A Selective Competitive Inhibitor of Aldehyde Dehydrogenase 1A3 Hinders Cancer Cell Growth, Invasiveness and Stemness In Vitro

 , , ,
, , ,  , , , and
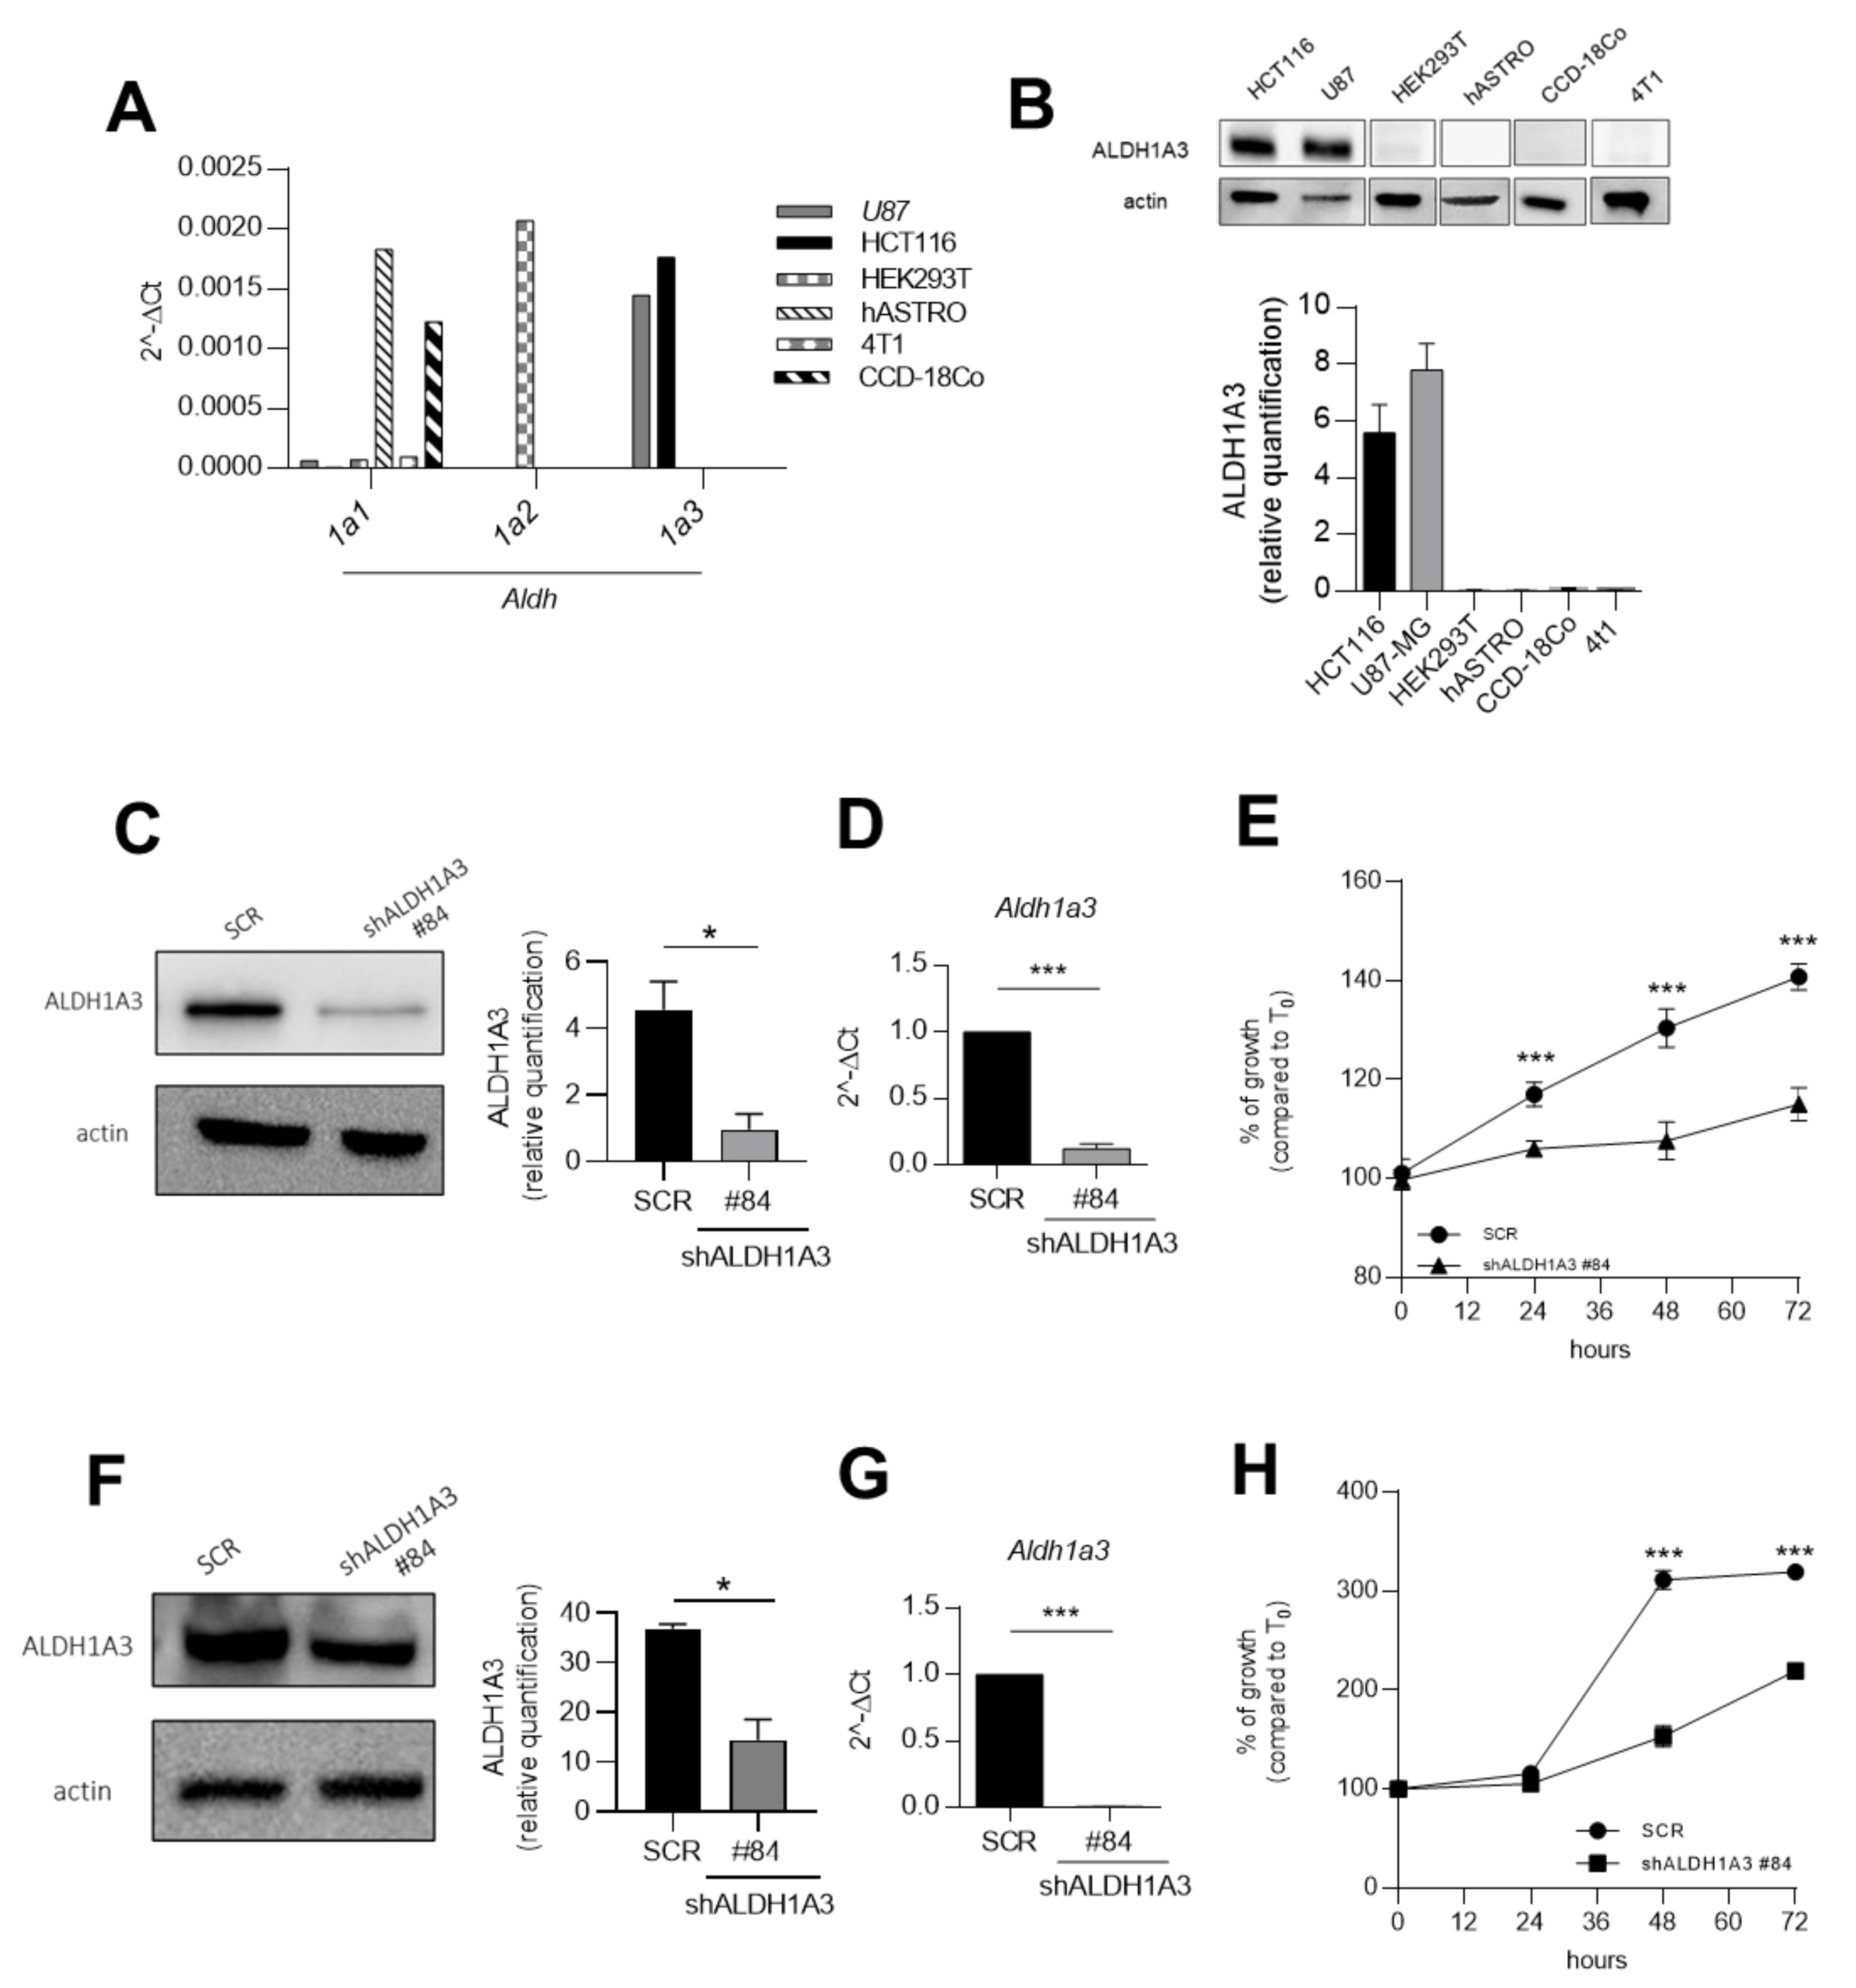
Abstract
:Simple Summary
Abstract
1. Introduction
2. Results
2.1. ALDH1A3 Overexpression Is Associated with Tumour Growth in Human U87MG Glioblastoma and Human HCT116 Colorectal Cancer Cell Lines
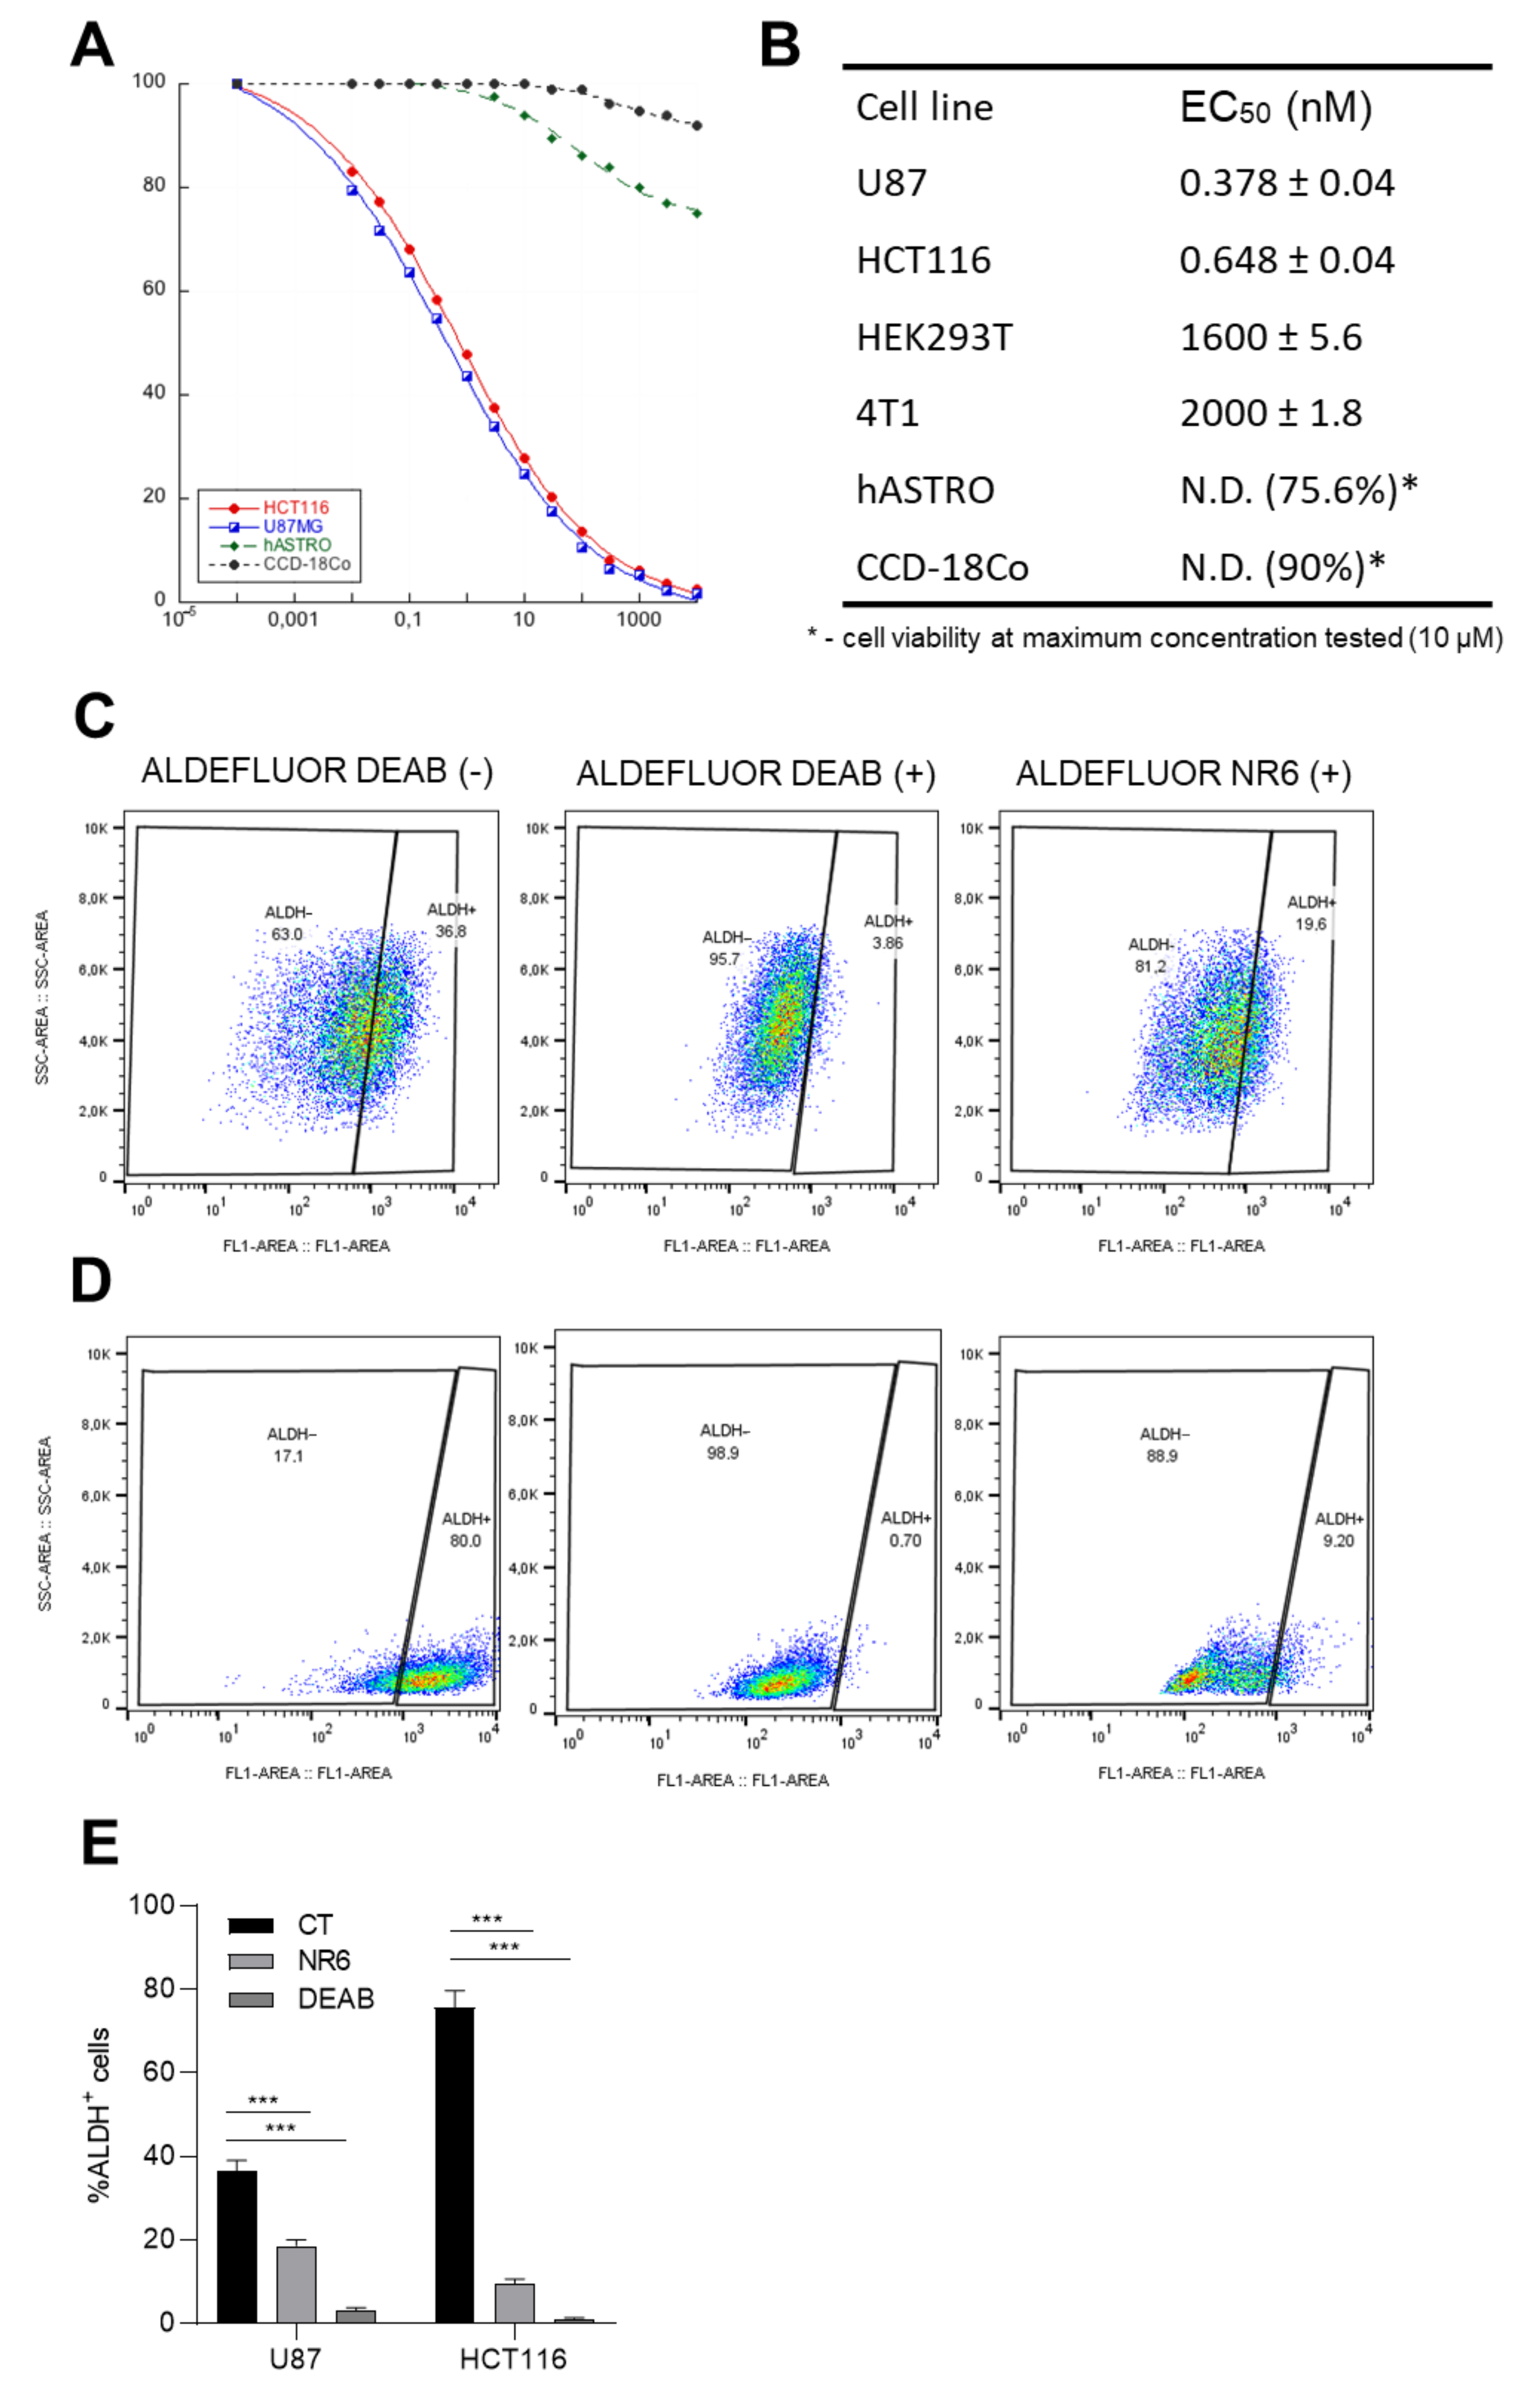
2.2. Functional Evaluation
2.3. NR6-ALDH1A3 Complex Crystallization Study
2.4. Molecular Dynamics Study of the Mutant ALDH1A3 Y472A in Complex with NR6
2.5. ALDH1A3 Inhibition Triggers ALDH1A3+ Cell Death
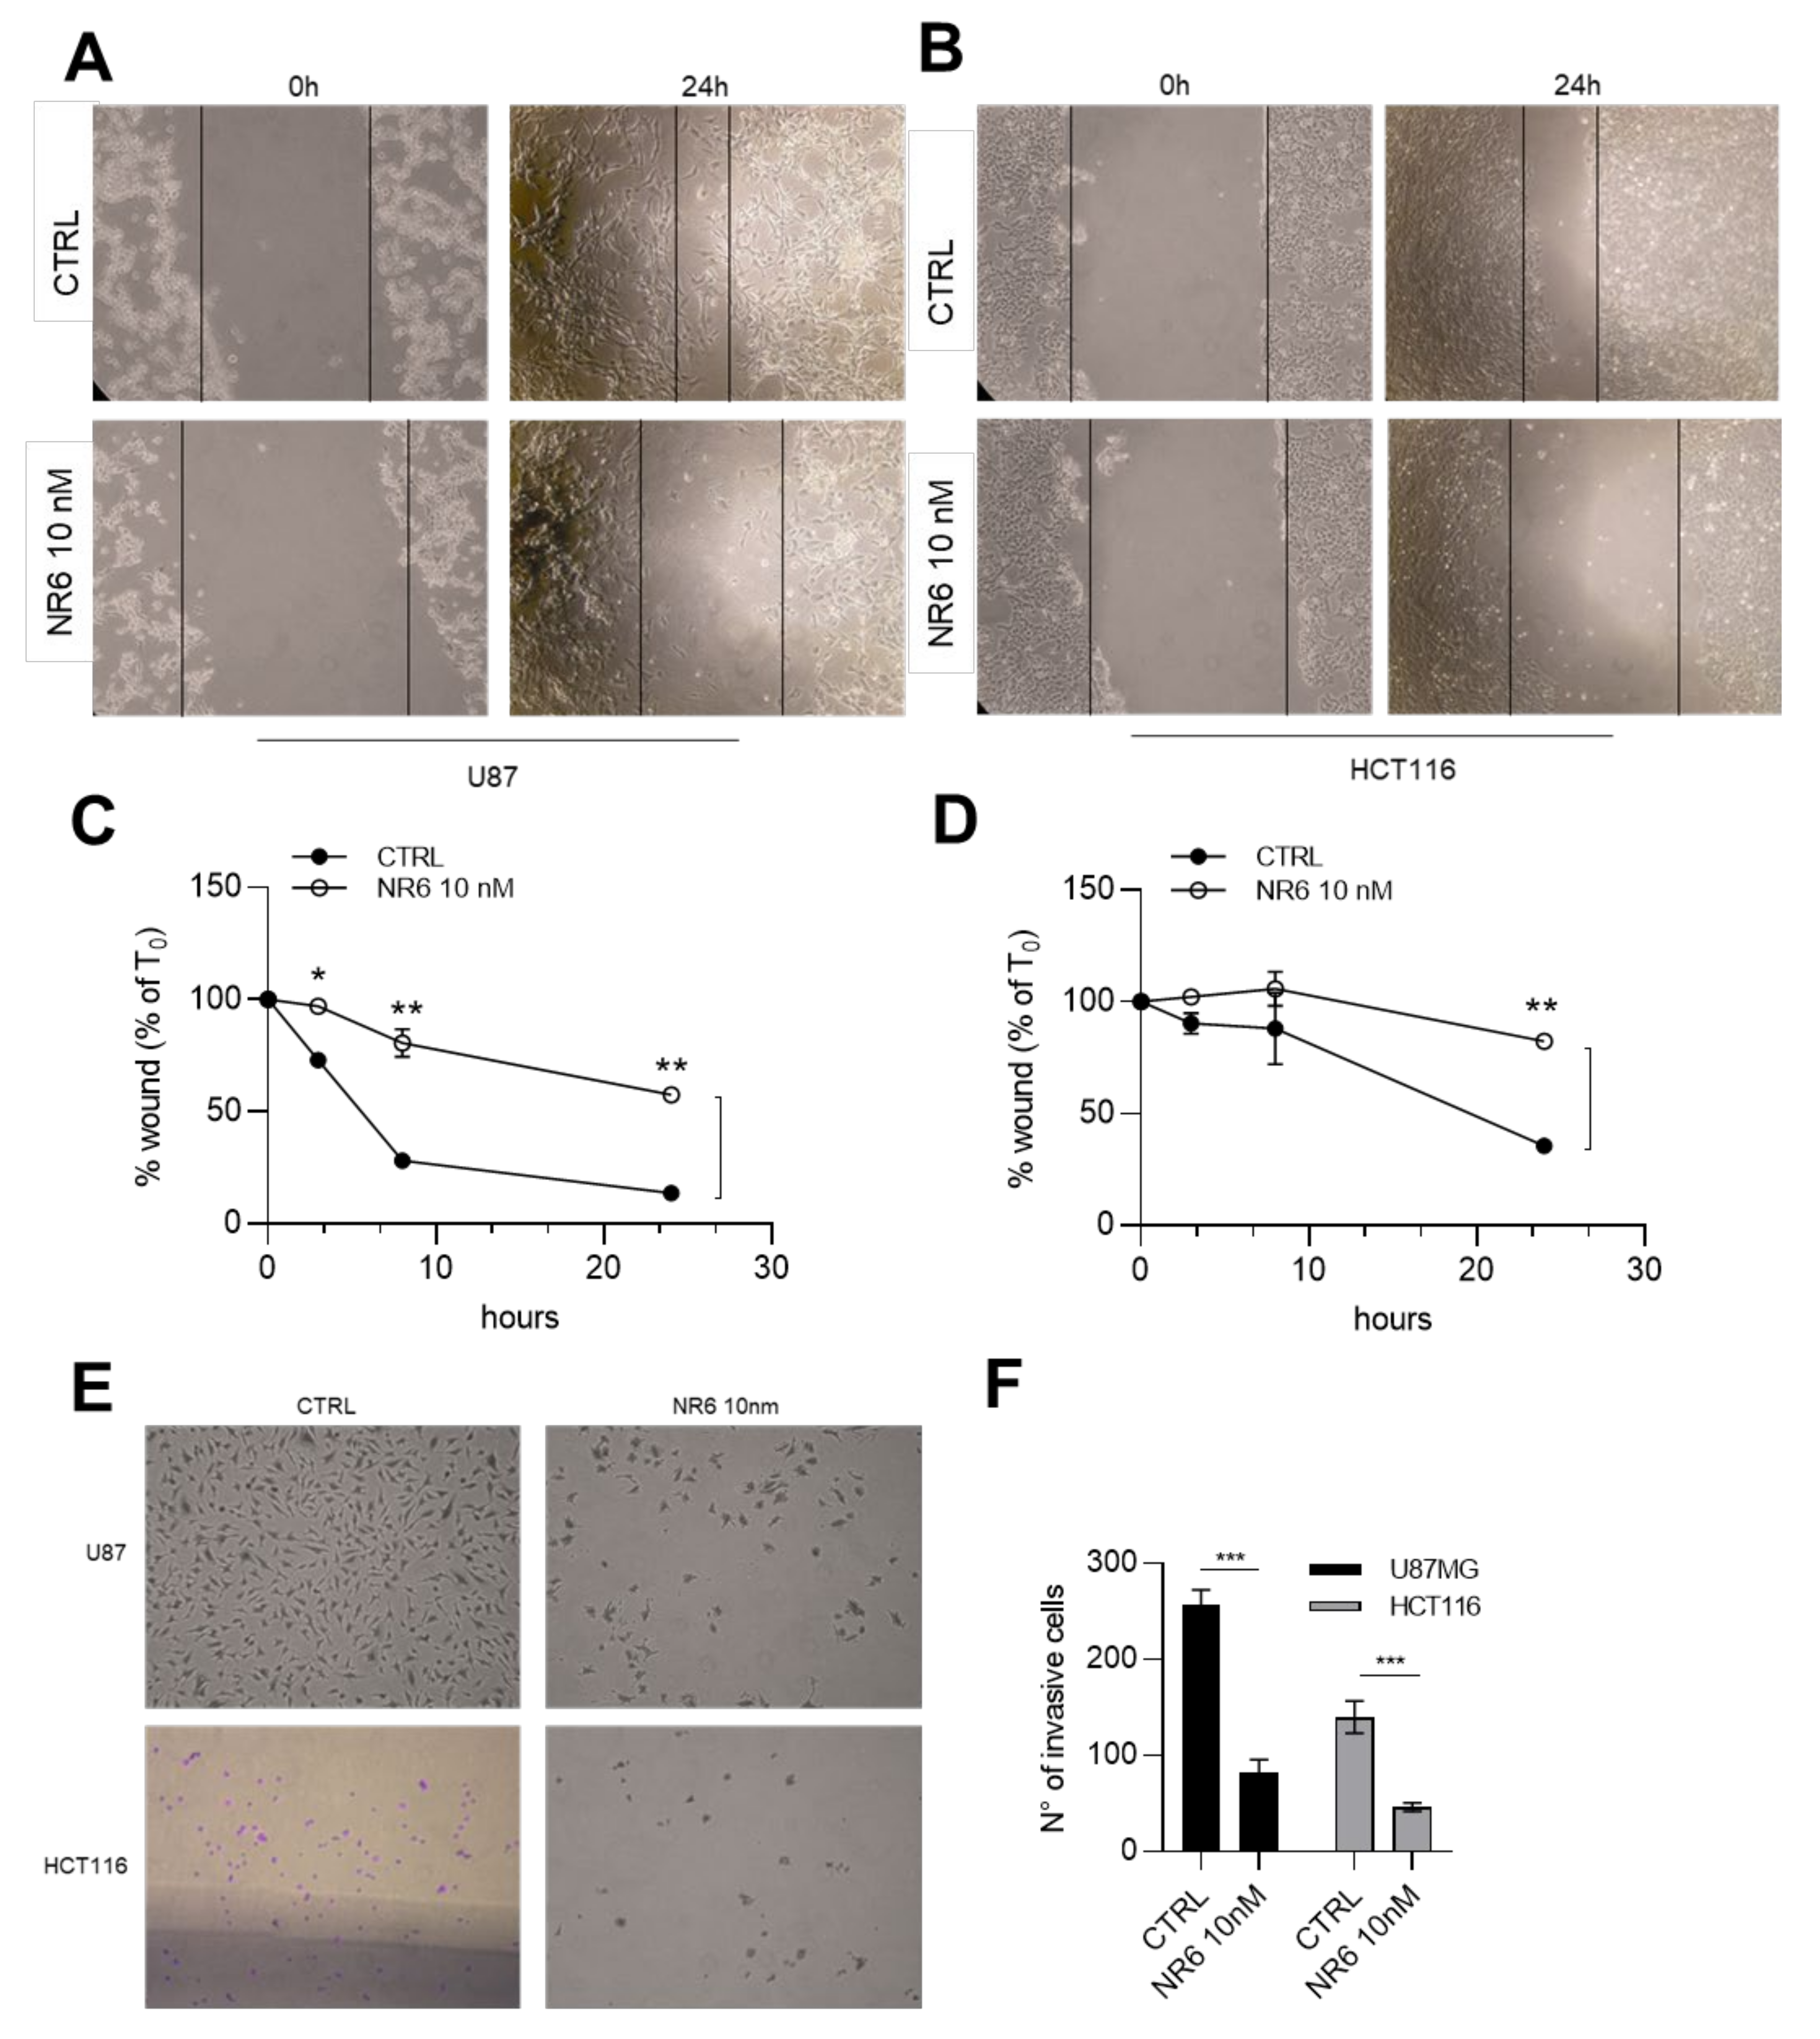
2.6. NR6 Is Able to Reduce Migration, Invasiveness and Stemness of Human U87MG Glioblastoma and Human HCT116 Colorectal Cancer Cell Lines
3. Discussion
4. Materials and Methods
4.1. Crystallization and Structure Determination
4.2. Molecular Dynamic Simulation
4.3. Cell Culture
4.4. Creation of U87MG and HCT116 shALDH1A3 Cell Line
4.5. Cell Viability Assay
4.6. Aldefluor Assay
4.7. Statistical Analysis
4.8. Additional Materials and Methods
5. Conclusions
Supplementary Materials
Author Contributions
Funding
Institutional Review Board Statement
Informed Consent Statement
Data Availability Statement
Acknowledgments
Conflicts of Interest
References
- Mizumoto, A.; Ohashi, S.; Hirohashi, K.; Amanuma, Y.; Matsuda, T.; Muto, M. Molecular mechanisms of acetaldehyde mediated carcinogenesis in squamous epithelium. Int. J. Mol. Sci. 2017, 18, 1943. [Google Scholar] [CrossRef] [Green Version]
- Marchitti, S.A.; Brocker, C.; Stagos, D.; Vasiliou, V. Non-P450 aldehyde oxidizing enzymes: The aldehyde dehydrogenase superfamily. Expert Opin. Drug Metab. Toxicol. 2008, 4, 697–720. [Google Scholar] [CrossRef] [Green Version]
- LoPachin, R.M.; Gavin, T. Molecular mechanisms of aldehyde toxicity: A chemical perspective. Chem. Res. Toxicol. 2014, 27, 1081–1091. [Google Scholar] [CrossRef]
- Vasiliou, V.; Pappa, A.; Petersen, D.R. Role of aldehyde dehydrogenases in endogenous and xenobiotic metabolism. Chem. Biol. Interact. 2000, 129, 1–19. [Google Scholar] [CrossRef]
- Koppaka, V.; Thompson, D.C.; Chen, Y.; Ellermann, M.; Nicolaou, K.C.; Juvonen, R.O.; Petersen, D.; Deitrich, R.A.; Hurley, T.D.; Vasiliou, V. Aldehyde dehydrogenase inhibitors: A comprehensive review of the pharmacology, mechanism of action, substrate specificity, and clinical application. Pharmacol. Rev. 2012, 64, 520–539. [Google Scholar] [CrossRef] [Green Version]
- Bchini, R.; Vasiliou, V.; Branlant, G.; Talfournier, F.; Rahuel-Clermont, S. Retinoic acid biosynthesis catalyzed by retinal dehydrogenases relies on a rate-limiting conformational transition associated with substrate recognition. Chem. Biol. Interact. 2013, 202, 78–84. [Google Scholar] [CrossRef] [PubMed] [Green Version]
- Germain, P.; Chambon, P.; Eichele, G.; Evans, R.M.; Lazar, M.A.; Leid, M.; de Lera, A.R.; Lotan, R.; Mangelsdorf, D.J.; Gronemeyer, H. International union of pharmacology. LX. Retinoic acid receptors. Pharmacol. Rev. 2006, 58, 712–725. [Google Scholar] [CrossRef] [PubMed]
- Clark, D.W.; Palle, K. Aldehyde dehydrogenases in cancer stem cells: Potential as therapeutic targets. Ann. Transl. Med. 2016, 4, 518. [Google Scholar] [CrossRef] [PubMed]
- Pors, K.; Moreb, J.S. Aldehyde dehydrogenases in cancer: An opportunity for biomarker and drug development? Drug Discov. Today 2014, 19, 1953–1963. [Google Scholar] [CrossRef]
- Dinavahi, S.S.; Bazewicz, C.G.; Gowda, R.; Robertson, G.P. Aldehyde dehydrogenase inhibitors for cancer therapeutics. Trends Pharmacol. Sci. 2019, 40, 774–789. [Google Scholar] [CrossRef]
- Kang, J.H.; Lee, S.-H.; Hong, D.; Lee, J.-S.; Ahn, H.-S.; Ahn, J.-H.; Seong, T.W.; Lee, C.-H.; Jang, H.; Hong, K.M.; et al. Aldehyde dehydrogenase is used by cancer cells for energy metabolism. Exp. Mol. Med. 2016, 48, e272. [Google Scholar] [CrossRef] [PubMed] [Green Version]
- Qiu, Y.; Pu, T.; Guo, P.; Wei, B.; Zhang, Z.; Zhang, H.; Zhong, X.; Zheng, H.; Chen, L.; Bu, H.; et al. ALDH +/CD44 + cells in breast cancer are associated with worse prognosis and poor clinical outcome. Exp. Mol. Pathol. 2016, 100, 145–150. [Google Scholar] [CrossRef] [PubMed]
- Tomita, H.; Tanaka, K.; Tanaka, T.; Hara, A. Aldehyde dehydrogenase 1A1 in stem cells and cancer. Oncotarget 2016, 7, 11018–11032. [Google Scholar] [CrossRef] [PubMed] [Green Version]
- Dalerba, P.; Dylla, S.J.; Park, I.-K.; Liu, R.; Wang, X.; Cho, R.W.; Hoey, T.; Gurney, A.; Huang, E.H.; Simeone, D.M.; et al. Phenotypic characterization of human colorectal cancer stem cells. Proc. Natl. Acad. Sci. USA 2007, 104, 10158–10163. [Google Scholar] [CrossRef] [PubMed] [Green Version]
- Nassar, D.; Blanpain, C. Cancer stem cells: Basic concepts and therapeutic implications. Annu. Rev. Pathol. Mech. Dis. 2016, 11, 47–76. [Google Scholar] [CrossRef]
- Mao, P.; Joshi, K.; Li, J.; Kim, S.-H.; Li, P.; Santana-Santos, L.; Luthra, S.; Chandran, U.R.; Benos, P.V.; Smith, L.; et al. Mesenchymal glioma stem cells are maintained by activated glycolytic metabolism involving aldehyde dehydrogenase 1A3. Proc. Natl. Acad. Sci. USA 2013, 110, 8644–8649. [Google Scholar] [CrossRef] [PubMed] [Green Version]
- Feng, H.; Liu, Y.; Bian, X.; Zhou, F.; Liu, Y. ALDH1A3 affects colon cancer in vitro proliferation and invasion depending on CXCR4 status. Br. J. Cancer 2018, 118, 224–232. [Google Scholar] [CrossRef] [Green Version]
- Marcato, P.; Dean, C.A.; Pan, D.; Araslanova, R.; Gillis, M.; Joshi, M.; Helyer, L.; Pan, L.; Leidal, A.; Gujar, S.; et al. Aldehyde dehydrogenase activity of breast cancer stem cells is primarily due to isoform ALDH1A3 and its expression is predictive of metastasis. Stem Cells 2011, 29, 32–45. [Google Scholar] [CrossRef]
- Marcato, P.; Dean, C.A.; Liu, R.-Z.; Coyle, K.M.; Bydoun, M.; Wallace, M.; Clements, D.; Turner, C.; Mathenge, E.G.; Gujar, S.A.; et al. Aldehyde dehydrogenase 1A3 influences breast cancer progression via differential retinoic acid signaling. Mol. Oncol. 2015, 9, 17–31. [Google Scholar] [CrossRef]
- Ma, S.; Chan, K.W.; Lee, T.K.-W.; Tang, K.H.; Wo, J.Y.-H.; Zheng, B.-J.; Guan, X.-Y. Aldehyde dehydrogenase discriminates the CD133 liver cancer stem cell populations. Mol. Cancer Res. 2008, 6, 1146–1153. [Google Scholar] [CrossRef] [Green Version]
- Jimeno, A.; Feldmann, G.; Suarez-Gauthier, A.; Rasheed, Z.; Solomon, A.; Zou, G.-M.; Rubio-Viqueira, B.; Garcia-Garcia, E.; Lopez-Rios, F.; Matsui, W.; et al. A direct pancreatic cancer xenograft model as a platform for cancer stem cell therapeutic development. Mol. Cancer Ther. 2009, 8, 310–314. [Google Scholar] [CrossRef] [PubMed] [Green Version]
- Vassalli, G. Aldehyde dehydrogenases: Not just markers, but functional regulators of stem cells. Stem Cells Int. 2019, 2019, 1–15. [Google Scholar] [CrossRef] [PubMed] [Green Version]
- Duan, J.-J.; Cai, J.; Guo, Y.-F.; Bian, X.-W.; Yu, S.-C. ALDH1A3, a metabolic target for cancer diagnosis and therapy: ALDH1A3 and cancer. Int. J. Cancer 2016, 139, 965–975. [Google Scholar] [CrossRef] [PubMed] [Green Version]
- Shao, C.; Sullivan, J.P.; Girard, L.; Augustyn, A.; Yenerall, P.; Rodriguez-Canales, J.; Liu, H.; Behrens, C.; Shay, J.W.; Wistuba, I.I.; et al. Essential role of aldehyde dehydrogenase 1A3 for the maintenance of non-small cell lung cancer stem cells is associated with the STAT3 pathway. Clin. Cancer Res. 2014, 20, 4154–4166. [Google Scholar] [CrossRef] [Green Version]
- Du, F.-Y.; Zhou, Q.-F.; Sun, W.-J.; Chen, G.-L. Targeting cancer stem cells in drug discovery: Current state and future perspectives. World J. Stem Cells 2019, 11, 398–420. [Google Scholar] [CrossRef]
- Ferraris, D.M.; Gelardi, E.L.M.; Garavaglia, S.; Miggiano, R.; Rizzi, M. Targeting NAD-dependent dehydrogenases in drug discovery against infectious diseases and cancer. Biochem. Soc. Trans. 2020, 48, 693–707. [Google Scholar] [CrossRef]
- Quattrini, L.; Gelardi, E.L.M.; Coviello, V.; Sartini, S.; Ferraris, D.; Mori, M.; Nakano, I.; Garavaglia, S.; La Motta, C. Imidazo [1,2-a] pyridine derivatives as aldehyde dehydrogenase inhibitors: Novel chemotypes to target glioblastoma stem cells. J. Med. Chem. 2020. [Google Scholar] [CrossRef]
- Quattrini, L.; Gelardi, E.L.M.; Petrarolo, G.; Colombo, G.; Ferraris, D.M.; Picarazzi, F.; Rizzi, M.; Garavaglia, S.; La Motta, C. Progresses in the field of aldehyde dehydrogenase inhibitors: Novel imidazo [1,2-a] pyridines against the 1A family. ACS Med. Chem. Lett. 2020. [Google Scholar] [CrossRef]
- Cheng, P.; Wang, J.; Waghmare, I.; Sartini, S.; Coviello, V.; Zhang, Z.; Kim, S.-H.; Mohyeldin, A.; Pavlyukov, M.S.; Minata, M.; et al. FOXD1-ALDH1A3 signaling is a determinant for the self-renewal and tumorigenicity of mesenchymal glioma stem cells. Cancer Res. 2016, 76, 7219–7230. [Google Scholar] [CrossRef] [Green Version]
- Barski, O.A.; Tipparaju, S.M.; Bhatnagar, A. The aldo-keto reductase superfamily and its role in drug metabolism and detoxification. Drug Metab. Rev. 2008, 40, 553–624. [Google Scholar] [CrossRef] [Green Version]
- Chen, C.-C.; Chu, C.-B.; Liu, K.-J.; Huang, C.-Y.F.; Chang, J.-Y.; Pan, W.-Y.; Chen, H.-H.; Cheng, Y.-H.; Lee, K.-D.; Chen, M.-F.; et al. Gene expression profiling for analysis acquired oxaliplatin resistant factors in human gastric carcinoma TSGH-S3 cells: The role of IL-6 signaling and Nrf2/AKR1C axis identification. Biochem. Pharmacol. 2013, 86, 872–887. [Google Scholar] [CrossRef] [PubMed]
- Matsunaga, T.; Hojo, A.; Yamane, Y.; Endo, S.; El-Kabbani, O.; Hara, A. Pathophysiological roles of aldo–keto reductases (AKR1C1 and AKR1C3) in development of cisplatin resistance in human colon cancers. Chem. Biol. Interact. 2013, 202, 234–242. [Google Scholar] [CrossRef] [PubMed]
- Wang, H.-W.; Lin, C.-P.; Chiu, J.-H.; Chow, K.-C.; Kuo, K.-T.; Lin, C.-S.; Wang, L.-S. Reversal of inflammation-associated dihydrodiol dehydrogenases (AKR1C1 and AKR1C2) overexpression and drug resistance in nonsmall cell lung cancer cells by wogonin and chrysin. Int. J. Cancer 2007, 120, 2019–2027. [Google Scholar] [CrossRef] [PubMed]
- Le Calvé, B.; Rynkowski, M.; Le Mercier, M.; Bruyère, C.; Lonez, C.; Gras, T.; Haibe-Kains, B.; Bontempi, G.; Decaestecker, C.; Ruysschaert, J.-M.; et al. Long-term in vitro treatment of human glioblastoma cells with temozolomide increases resistance in vivo through up-regulation of GLUT transporter and aldo-keto reductase enzyme AKR1C expression. Neoplasia 2010, 12, 727–739. [Google Scholar] [CrossRef] [PubMed]
- Karunasinghe, N.; Masters, J.; Flanagan, J.U.; Ferguson, L.R. Influence of aldo-keto reductase 1C3 in prostate cancer—A mini review. CCDT 2017, 17. [Google Scholar] [CrossRef]
- Matsumoto, R.; Tsuda, M.; Yoshida, K.; Tanino, M.; Kimura, T.; Nishihara, H.; Abe, T.; Shinohara, N.; Nonomura, K.; Tanaka, S. Aldo-keto reductase 1C1 induced by interleukin-1β mediates the invasive potential and drug resistance of metastatic bladder cancer cells. Sci. Rep. 2016, 6, 34625. [Google Scholar] [CrossRef] [Green Version]
- Nokin, M.-J.; Durieux, F.; Bellier, J.; Peulen, O.; Uchida, K.; Spiegel, D.A.; Cochrane, J.R.; Hutton, C.A.; Castronovo, V.; Bellahcène, A. Hormetic potential of methylglyoxal, a side-product of glycolysis, in switching tumours from growth to death. Sci. Rep. 2017, 7, 11722. [Google Scholar] [CrossRef] [Green Version]
- Zemanova, L.; Hofman, J.; Novotna, E.; Musilek, K.; Lundova, T.; Havrankova, J.; Hostalkova, A.; Chlebek, J.; Cahlikova, L.; Wsol, V. Flavones inhibit the activity of AKR1B10, a promising therapeutic target for cancer treatment. J. Nat. Prod. 2015, 78, 2666–2674. [Google Scholar] [CrossRef]
- Zhong, L.; Shen, H.; Huang, C.; Jing, H.; Cao, D. AKR1B10 induces cell resistance to daunorubicin and idarubicin by reducing C13 ketonic group. Toxicol. Appl. Pharmacol. 2011, 255, 40–47. [Google Scholar] [CrossRef] [Green Version]
- Moretti, A.; Li, J.; Donini, S.; Sobol, R.W.; Rizzi, M.; Garavaglia, S. Crystal structure of human aldehyde dehydrogenase 1A3 complexed with NAD + and retinoic acid. Sci. Rep. 2016, 6, 35710. [Google Scholar] [CrossRef] [Green Version]
- Massova, I.; Kollman, P.A. Computational alanine scanning to probe protein—Protein interactions: A novel approach to evaluate binding free energies. J. Am. Chem. Soc. 1999, 121, 8133–8143. [Google Scholar] [CrossRef]
- Miller, B.R.; McGee, T.D.; Swails, J.M.; Homeyer, N.; Gohlke, H.; Roitberg, A.E. MMPBSA.Py: An efficient program for end-state free energy calculations. J. Chem. Theory Comput. 2012, 8, 3314–3321. [Google Scholar] [CrossRef] [PubMed]
- Zhou, L.; Sheng, D.; Wang, D.; Ma, W.; Deng, Q.; Deng, L.; Liu, S. Identification of cancer-type specific expression patterns for active aldehyde dehydrogenase (ALDH) isoforms in ALDEFLUOR assay. Cell Biol. Toxicol. 2019, 35, 161–177. [Google Scholar] [CrossRef] [PubMed] [Green Version]
- Kabsch, W. XDS. Acta Crystallogr. D Biol. Crystallogr. 2010, 66, 125–132. [Google Scholar] [CrossRef] [Green Version]
- Collaborative Computational Project Number 4. The CCP4 suite: Programs for protein crystallography. Acta Crystallogr. D Biol. Crystallogr. 1994, 50, 760–763. [Google Scholar] [CrossRef]
- McCoy, A.J.; Grosse-Kunstleve, R.W.; Adams, P.D.; Winn, M.D.; Storoni, L.C.; Read, R.J. Phaser crystallographic software. J. Appl. Crystallogr. 2007, 40, 658–674. [Google Scholar] [CrossRef] [Green Version]
- Murshudov, G.N.; Vagin, A.A.; Dodson, E.J. Refinement of macromolecular structures by the maximum-likelihood method. Acta Crystallogr. D Biol. Crystallogr. 1997, 53, 240–255. [Google Scholar] [CrossRef]
- Afonine, P.V.; Grosse-Kunstleve, R.W.; Echols, N.; Headd, J.J.; Moriarty, N.W.; Mustyakimov, M.; Terwilliger, T.C.; Urzhumtsev, A.; Zwart, P.H.; Adams, P.D. Towards automated crystallographic structure refinement with phenix.refine. Acta Crystallogr. D Biol. Crystallogr. 2012, 68, 352–367. [Google Scholar] [CrossRef] [Green Version]
- Emsley, P.; Lohkamp, B.; Scott, W.G.; Cowtan, K. Features and development of Coot. Acta Crystallogr. D Biol. Crystallogr. 2010, 66, 486–501. [Google Scholar] [CrossRef] [Green Version]
- Brünger, A.T. Free R value: A novel statistical quantity for assessing the accuracy of crystal structures. Nature 1992, 355, 472–475. [Google Scholar] [CrossRef]
- Perrakis, A.; Harkiolaki, M.; Wilson, K.S.; Lamzin, V.S. ARP/WARP and molecular replacement. Acta Crystallogr. D Biol. Crystallogr. 2001, 57, 1445–1450. [Google Scholar] [CrossRef] [PubMed] [Green Version]
- Maier, J.A.; Martinez, C.; Kasavajhala, K.; Wickstrom, L.; Hauser, K.E.; Simmerling, C. Ff14SB: Improving the accuracy of protein side chain and backbone parameters from Ff99SB. J. Chem. Theory Comput. 2015, 11, 3696–3713. [Google Scholar] [CrossRef] [PubMed] [Green Version]
- Mermelstein, D.J.; Lin, C.; Nelson, G.; Kretsch, R.; McCammon, J.A.; Walker, R.C. Fast and flexible gpu accelerated binding free energy calculations within the amber molecular dynamics package. J. Comput. Chem. 2018, 39, 1354–1358. [Google Scholar] [CrossRef] [PubMed]
- Roe, D.R.; Cheatham, T.E. PTRAJ and CPPTRAJ: Software for processing and analysis of molecular dynamics trajectory data. J. Chem. Theory Comput. 2013, 9, 3084–3095. [Google Scholar] [CrossRef] [PubMed]


Publisher’s Note: MDPI stays neutral with regard to jurisdictional claims in published maps and institutional affiliations. |
© 2021 by the authors. Licensee MDPI, Basel, Switzerland. This article is an open access article distributed under the terms and conditions of the Creative Commons Attribution (CC BY) license (http://creativecommons.org/licenses/by/4.0/).
Share and Cite
Gelardi, E.L.M.; Colombo, G.; Picarazzi, F.; Ferraris, D.M.; Mangione, A.; Petrarolo, G.; Aronica, E.; Rizzi, M.; Mori, M.; La Motta, C.; et al. A Selective Competitive Inhibitor of Aldehyde Dehydrogenase 1A3 Hinders Cancer Cell Growth, Invasiveness and Stemness In Vitro. Cancers 2021, 13, 356. https://0-doi-org.brum.beds.ac.uk/10.3390/cancers13020356
Gelardi ELM, Colombo G, Picarazzi F, Ferraris DM, Mangione A, Petrarolo G, Aronica E, Rizzi M, Mori M, La Motta C, et al. A Selective Competitive Inhibitor of Aldehyde Dehydrogenase 1A3 Hinders Cancer Cell Growth, Invasiveness and Stemness In Vitro. Cancers. 2021; 13(2):356. https://0-doi-org.brum.beds.ac.uk/10.3390/cancers13020356
Chicago/Turabian StyleGelardi, Edoardo L. M., Giorgia Colombo, Francesca Picarazzi, Davide M. Ferraris, Andrea Mangione, Giovanni Petrarolo, Eleonora Aronica, Menico Rizzi, Mattia Mori, Concettina La Motta, and et al. 2021. "A Selective Competitive Inhibitor of Aldehyde Dehydrogenase 1A3 Hinders Cancer Cell Growth, Invasiveness and Stemness In Vitro" Cancers 13, no. 2: 356. https://0-doi-org.brum.beds.ac.uk/10.3390/cancers13020356