
Prediction of Radiation-Induced Hypothyroidism Using Radiomic Data Analysis Does Not Show Superiority over Standard Normal Tissue Complication Models

 , , , , , , and
Abstract
:Simple Summary
Abstract
1. Introduction
2. Materials and Methods
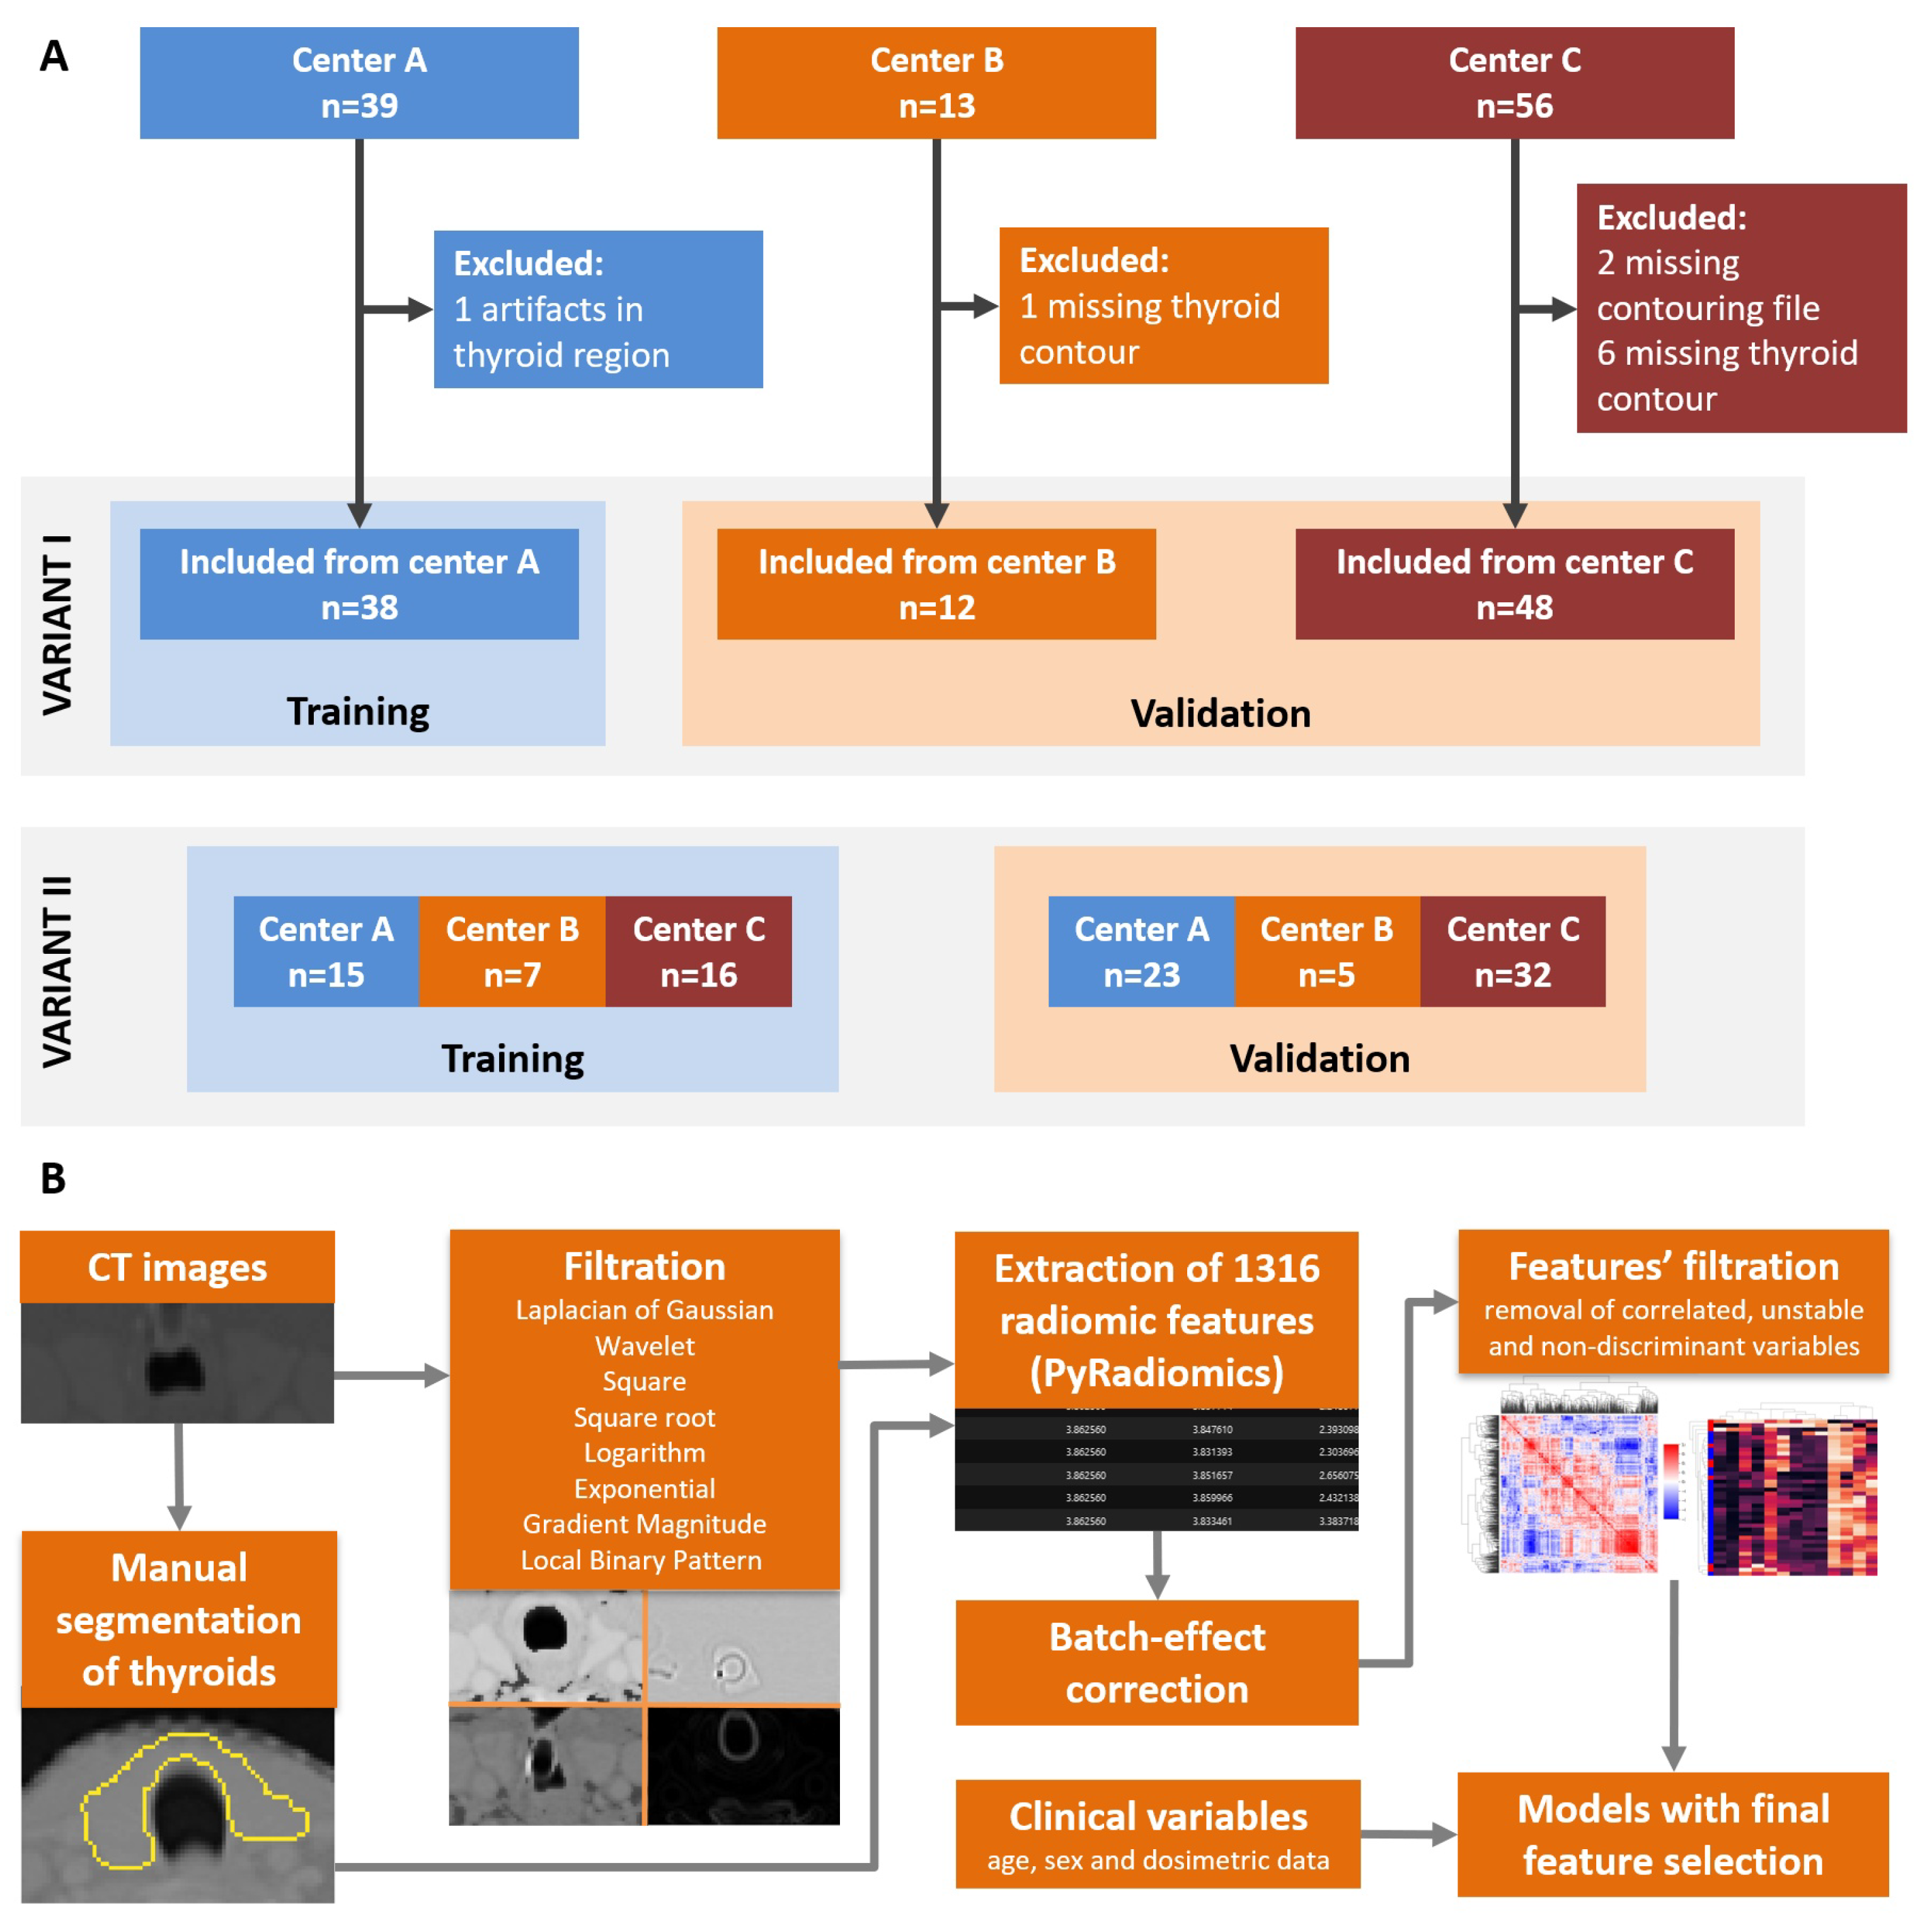
2.1. Patients and CT Images
2.2. Image Preprocessing and Radiomic Features Calculation
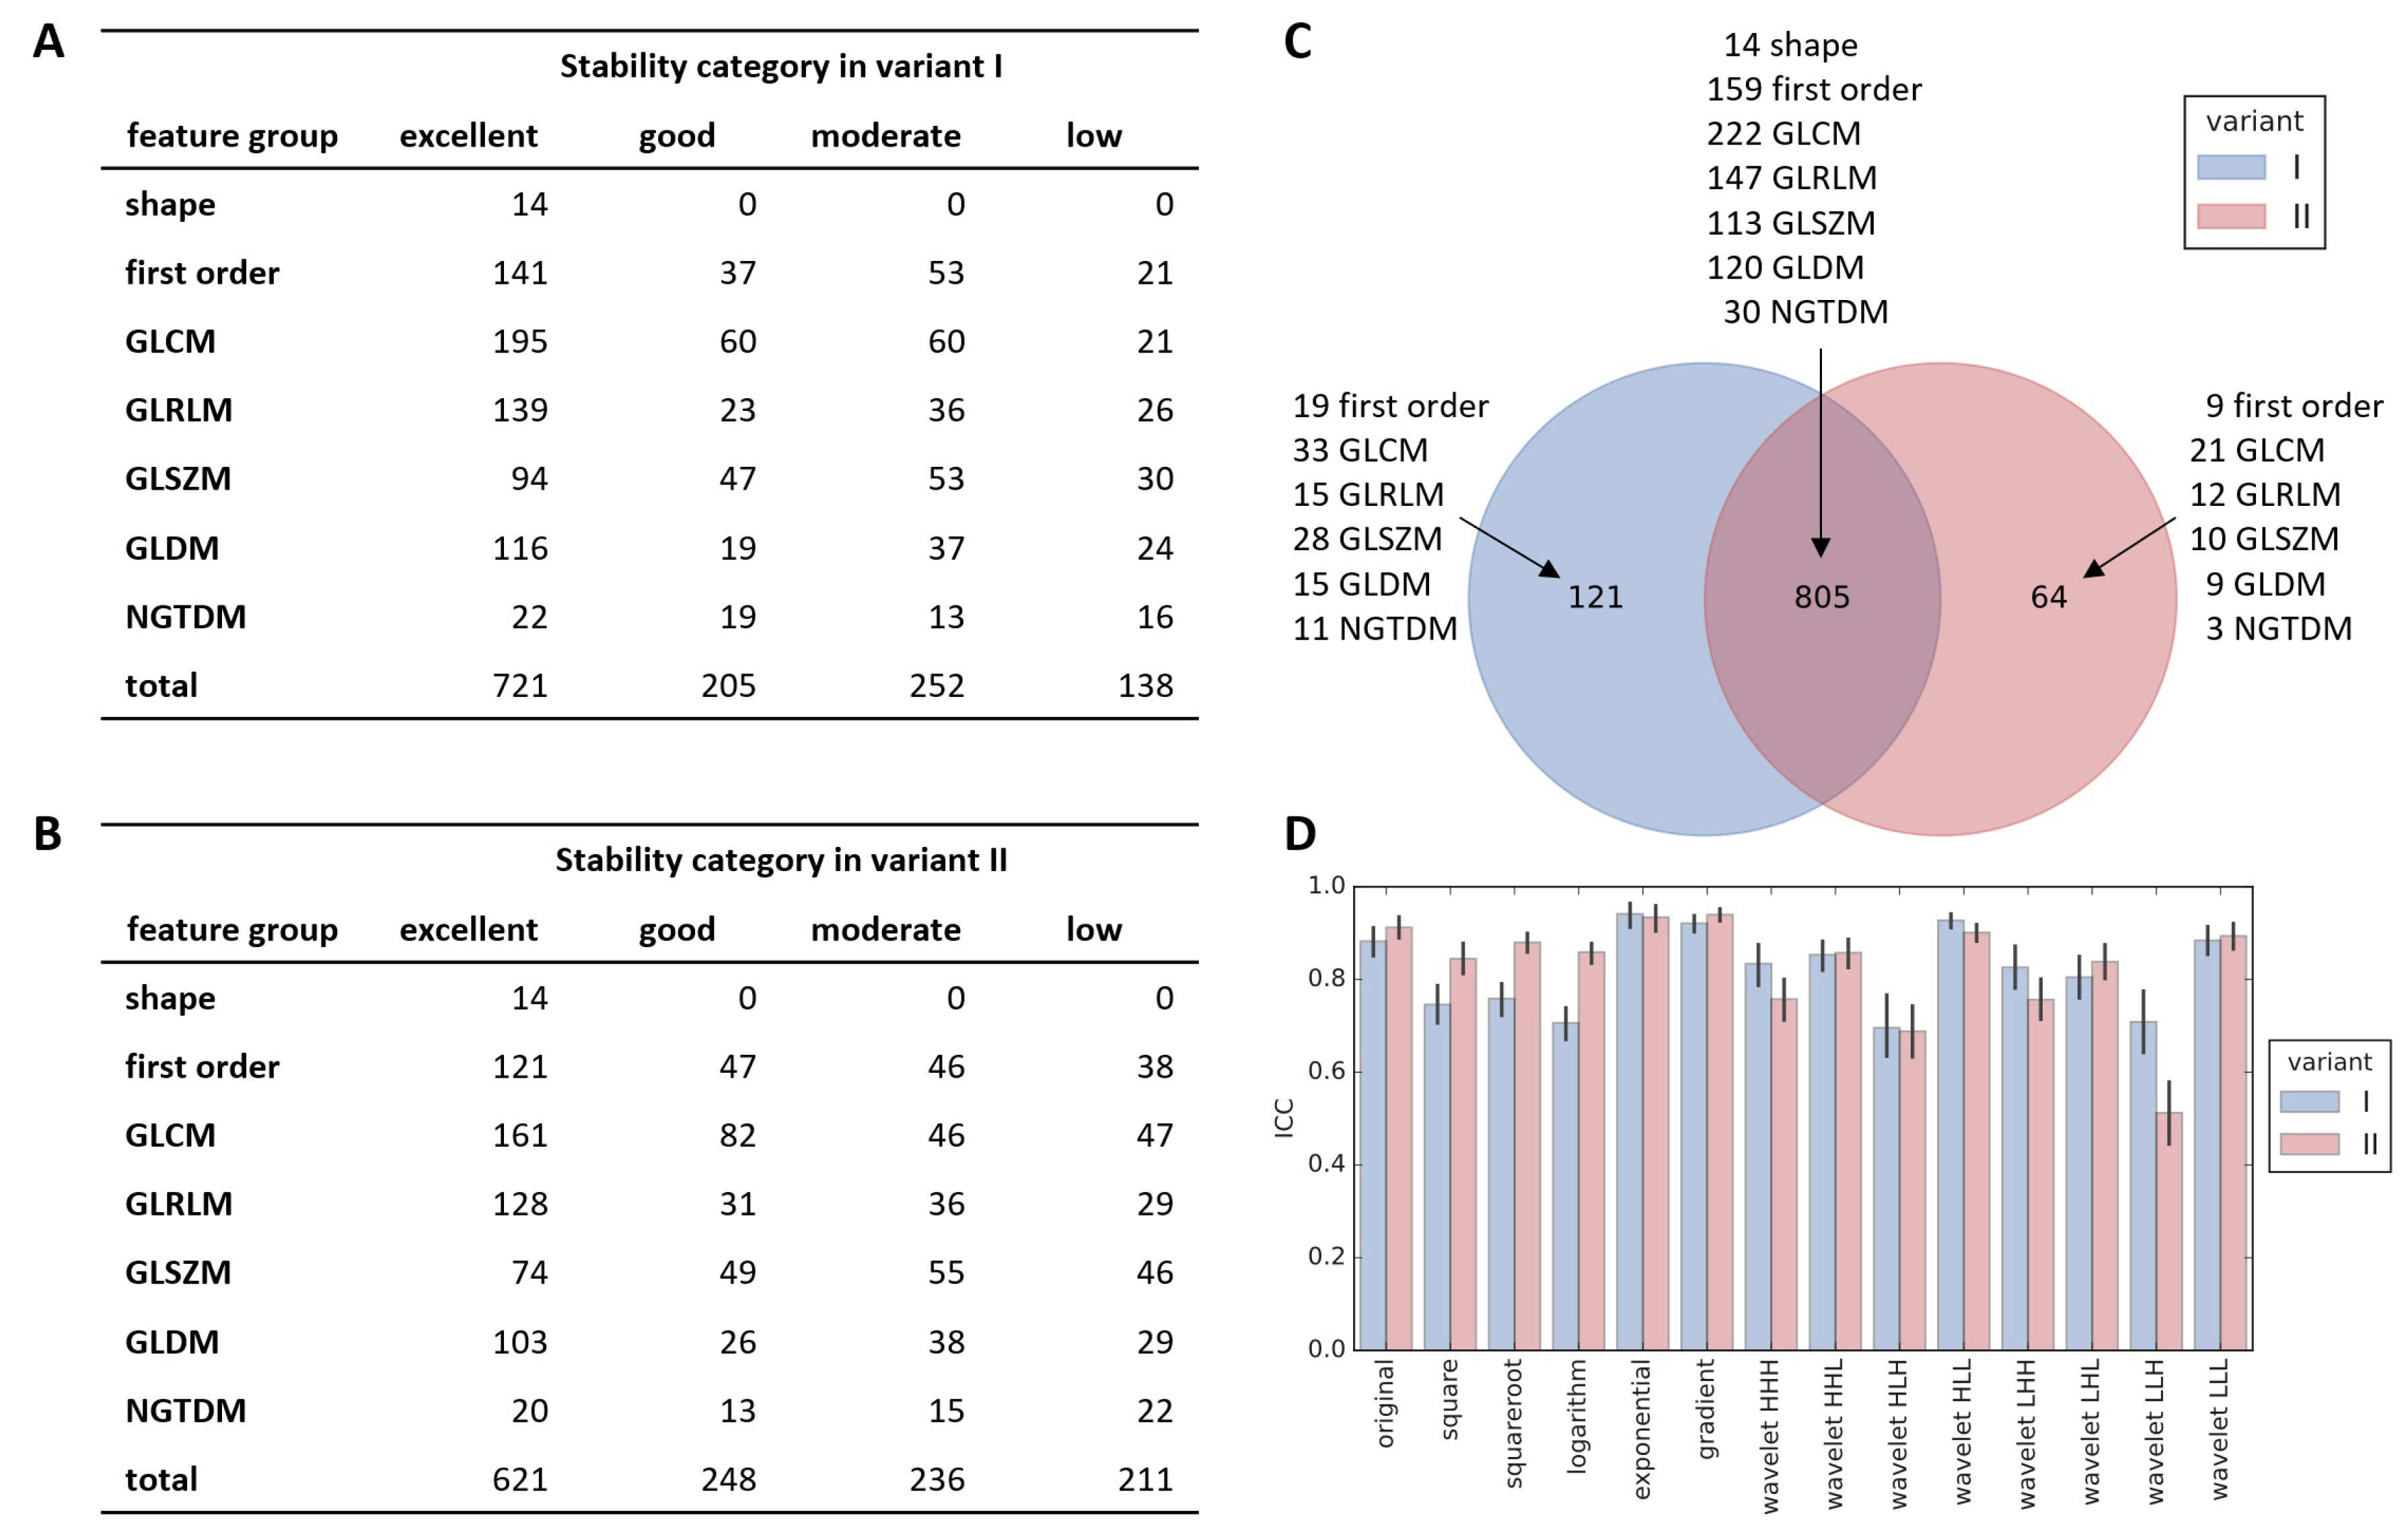
2.3. Stability Assessment
- 3 translations by up to 1 mm in either direction along each of the 3 main axes,
- 3 rotations by up to 2° in either direction around each of the 3 main axes,
- 3 zooms by up to 2% of either dimension along each of the 3 main axes.
2.4. Feature Preprocessing and Splitting Data Set
- Variant I without batch effect correction, later referred to as Variant Ia: center A as training set, centers B and C as validation set as shown in Figure 1A.
- Variant I with batch effect removed by ComBat [34], referred to also as Variant Ib: center A as training set, centers B and C as validation set.
- Variant II: no batch effect removal, but data from three centers were joined and subsequently divided into training and validation sets (Figure 1A). Training set contained 38 patients including 10 RITH to match the number of patients and proportion of RITH cases of center A data set so that both variants of splitting data are as comparable as possible.
2.5. Feature Filtration
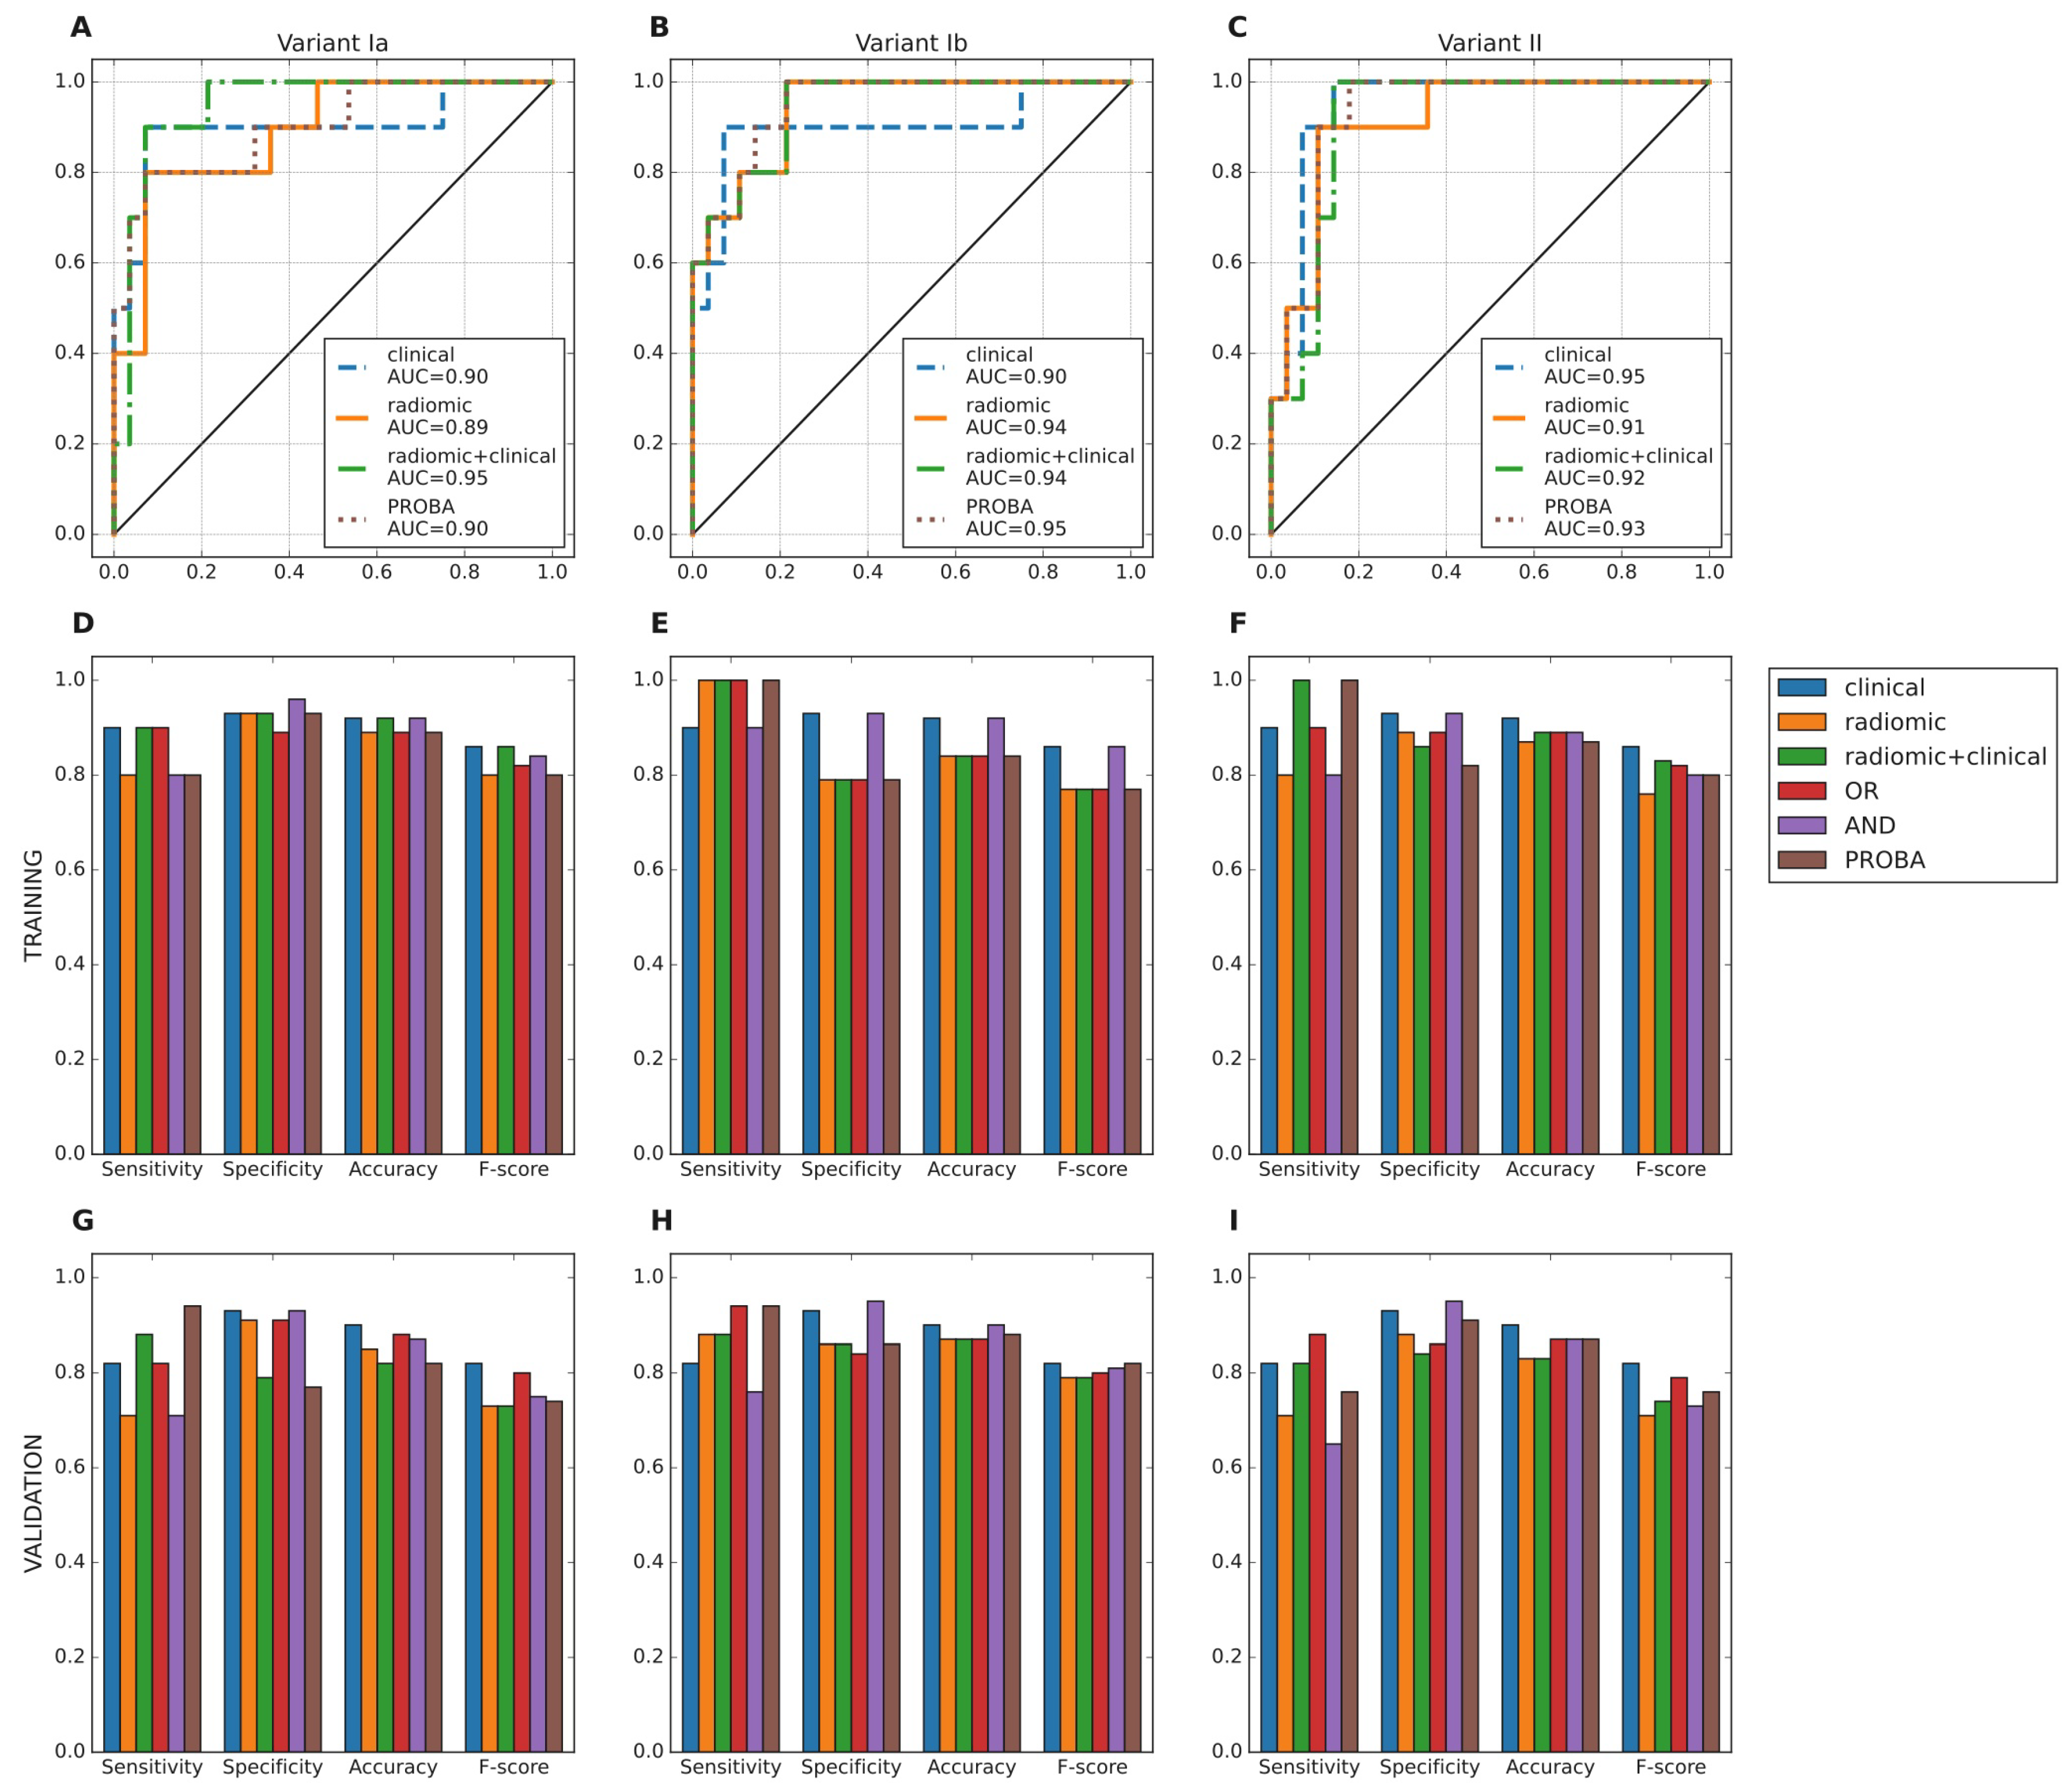
2.6. Model Training and Evaluation
- logical conjunction (AND): positive prediction only when both models predicted RIHT,
- logical disjunction (OR): positive prediction when any of the two models predicted RIHT,
- averaged probability (PROBA): probability (raw output) of two models were averaged and new decision threshold selected using ROC curve for training set.
3. Results
3.1. Feature Stability Analysis
3.2. Feature Processing and Filtration
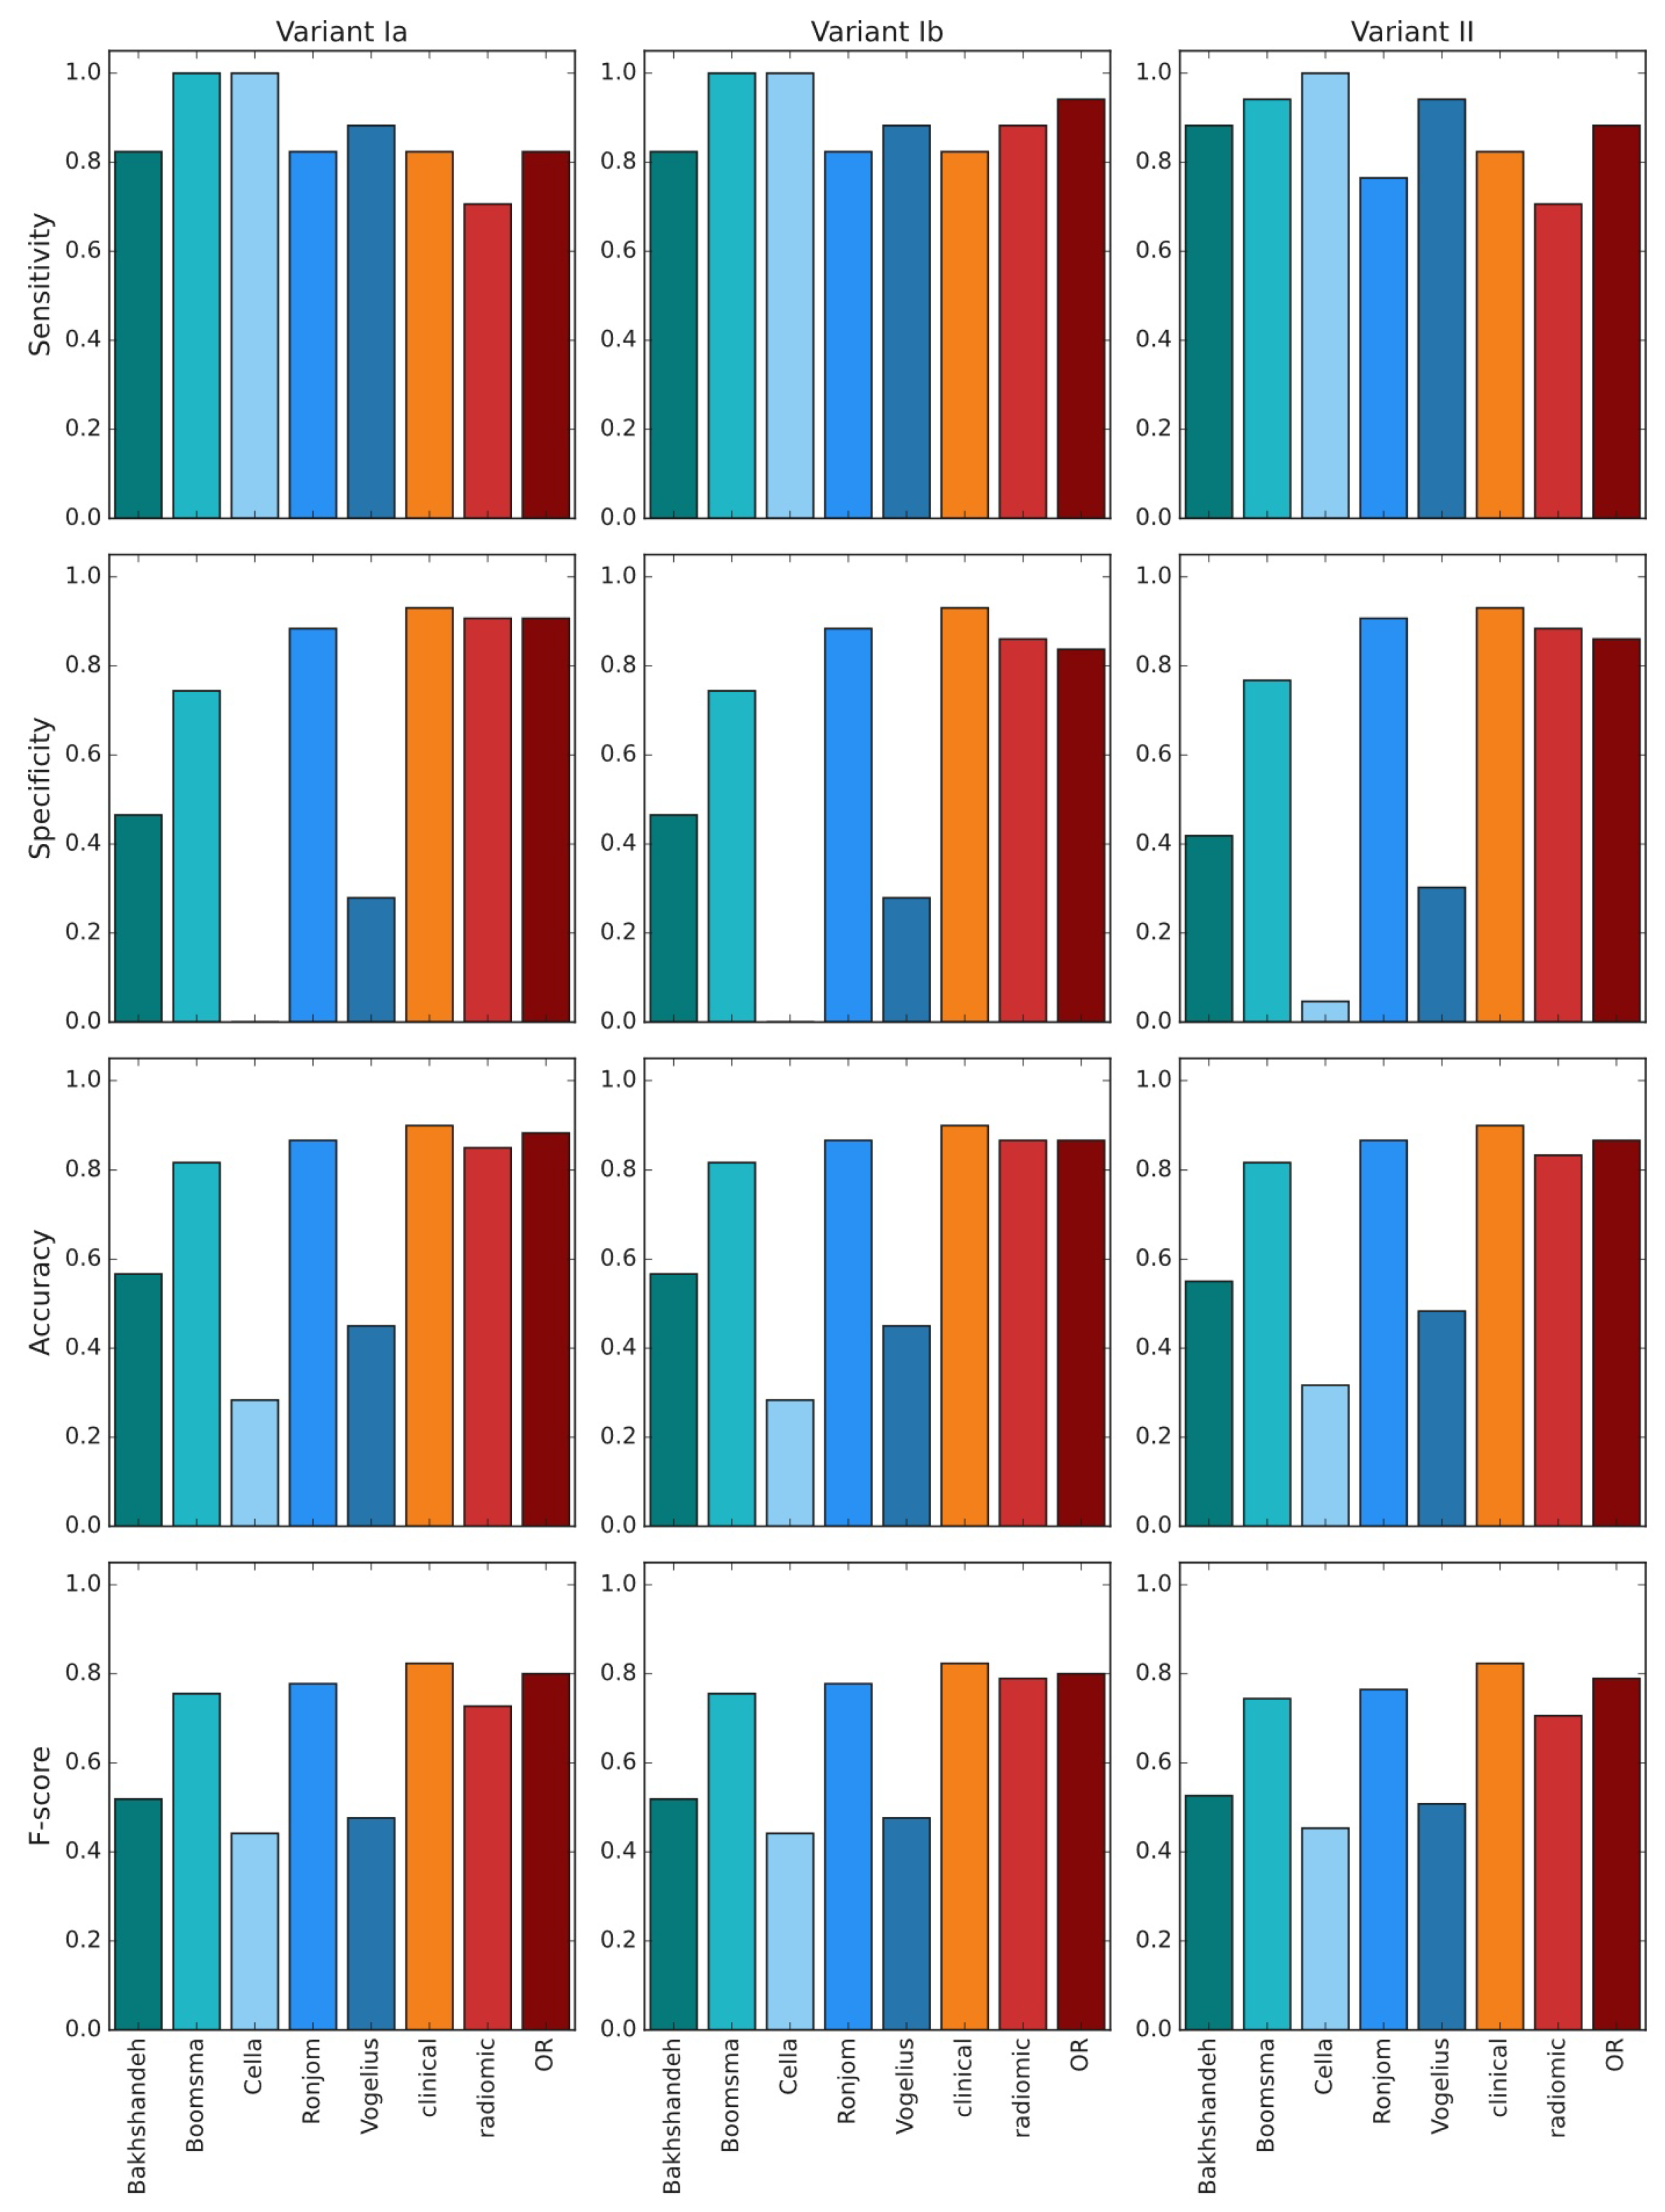
3.3. Models
4. Discussion
5. Conclusions
Supplementary Materials
Author Contributions
Funding
Institutional Review Board Statement
Informed Consent Statement
Data Availability Statement
Acknowledgments
Conflicts of Interest
Abbreviations
| AUC | area under curve |
| CT | computed tomography |
| FDR | false discovery rate |
| GLCM | gray level cooccurrence matrix |
| GLDM | gray level dependence matrix |
| GLRLM | gray level run length matrix |
| GLSZM | gray level size zone matrix |
| GPC | Gaussian process classifier |
| HNG | head and neck cancer |
| ICC | inter-class correlation coefficient |
| IMRT | intensity-modulated radiation therapy |
| MLP | multilayer perceptron |
| NGTDM | neighborhood gray tone difference matrix |
| NTCP | normal tissue complication probability |
| OAR | organ at risk |
| OPC | oropharyngeal cancer |
| PACS | picture archiving and communication system |
| ROI | region of interest |
| RT | radiation therapy |
| RIHT | radiation-induced hypothyroidism |
Appendix A. List of Calculated Radiomic Features
- elongation
- flatness
- least axis length
- major axis length
- maximum 2D diameter column
- maximum 2D diameter row
- maximum 2D diameter slice
- maximum 3D diameter
- mesh volume
- minor axis length
- sphericity
- surface area
- surface volume ratio
- voxel volume
- 10. percentile
- 90. percentile
- energy
- entropy
- interquartile range
- kurtosis
- maximum
- mean absolute deviation
- mean
- median
- minimum
- range
- robust mean absolute deviation
- root mean squared
- skewness
- total energy
- uniformity
- variance
- autocorrelation
- cluster prominence
- cluster shade
- cluster tendency
- contrast
- correlation
- difference average
- difference entropy
- difference variance
- inverse difference (ID), homogeneity 1
- inverse difference moment (IDM), homogeneity 2
- inverse difference moment normalized (IDMN)
- inverse difference normalized (IDN)
- informational measure of correlation 1 (IMC1)
- informational measure of correlation 2 (IMC2)
- inverse variance
- joint average
- joint energy
- joint entropy
- maximal correlation coefficient (MCC)
- maximum probability
- sum average
- sum entropy
- sum squares
- dependence entropy
- dependence nonuniformity
- dependence nonuniformity normalized
- dependence variance
- gray level nonuniformity
- gray level variance
- high gray level emphasis
- large dependence emphasis
- large dependence high gray level emphasis
- large dependence low gray level emphasis
- low gray level emphasis
- small dependence emphasis
- small dependence high gray level emphasis
- small dependence low gray level emphasis
- gray level nonuniformity
- gray level nonuniformity normalized
- gray level variance
- high gray level run emphasis
- long run emphasis
- long run high gray level emphasis
- long run low gray level emphasis
- low gray level run emphasis
- run entropy
- run length nonuniformity
- run length nonuniformity normalized
- run percentage
- run variance
- short run emphasis
- short run high gray level emphasis
- short run low gray level emphasis
- gray level nonuniformity
- gray level nonuniformity normalized
- gray level variance
- high gray level zone emphasis
- large area emphasis
- large area high gray level emphasis
- large area low gray level emphasis
- low gray level zone emphasis
- size zone nonuniformity
- size zone nonuniformity normalized
- small area emphasis
- small area high gray level emphasis
- small area low gray level emphasis
- zone entropy
- zone percentage
- zone variance
- busyness
- coarseness
- complexity
- contrast
- strength
References
- Brodin, N.P.; Kabarriti, R.; Garg, M.K.; Guha, C.; Tome, W.A. Systematic Review of Normal Tissue Complication Models Relevant to Standard Fractionation Radiation Therapy of the Head and Neck Region Published After the QUANTEC Reports. Int. J. Radiat. Oncol. Biol. Phys. 2018, 100, 391–407. [Google Scholar] [CrossRef] [PubMed]
- Vigário, P.; Teixeira, P.; Reuters, V.; Almeida, C.; Maia, M.; Silva, M.; Vaisman, M. Perceived health status of women with overt and subclinical hypothyroidism. Med. Princ. Pract. 2009, 18, 317–322. [Google Scholar] [CrossRef] [PubMed]
- Thvilum, M.; Brandt, F.; Almind, D.; Christensen, K.; Hegedüs, L.; Brix, T.H. Excess mortality in patients diagnosed with hypothyroidism: A nationwide cohort study of singletons and twins. J. Clin. Endocrinol. Metab. 2013, 98, 1069–1075. [Google Scholar] [CrossRef]
- Hassan, A.; Altamirano-Ufion, A.; Zulfiqar, B.; Boddu, P. Sub-Clinical Hypothyroidism and Its Association With Increased Cardiovascular Mortality: Call for Action. Cardiol. Res. 2017, 8, 31–35. [Google Scholar] [CrossRef] [Green Version]
- Rønjom, M.F.; Brink, C.; Bentzen, S.M.; Hegedüs, L.; Overgaard, J.; Johansen, J. Hypothyroidism after primary radiotherapy for head and neck squamous cell carcinoma: Normal tissue complication probability modeling with latent time correction. Radiother. Oncol. 2013, 109, 317–322. [Google Scholar] [CrossRef] [PubMed]
- Kamal, M.; Peeler, C.R.; Yepes, P.; Mohamed, A.S.; Blanchard, P.; Frank, S.; Chen, L.; Jethanandani, A.; Kuruvilla, R.; Greiner, B.; et al. Radiation-Induced Hypothyroidism After Radical Intensity Modulated Radiation Therapy for Oropharyngeal Carcinoma. Adv. Radiat. Oncol. 2020, 5, 111–119. [Google Scholar] [CrossRef] [PubMed] [Green Version]
- Nowicka, Z.; Tomasik, B.; Papis-Ubych, A.; Bibik, R.; Graczyk, Ł.; Latusek, T.; Rutkowski, T.; Wyka, K.; Fijuth, J.; Schoenfeld, J.D.; et al. Radiation-induced hypothyroidism in patients with oropharyngeal cancer treated with imrt: Independent and external validation of five normal tissue complication probability models. Cancers 2020, 12, 2716. [Google Scholar] [CrossRef]
- Rønjom, M.F.; Brink, C.; Bentzen, S.M.; Hegedüs, L.; Overgaard, J.; Petersen, J.B.; Primdahl, H.; Johansen, J. External validation of a normal tissue complication probability model for radiation-induced hypothyroidism in an independent cohort. Acta Oncol. 2015, 54, 1301–1309. [Google Scholar] [CrossRef] [Green Version]
- Boomsma, M.J.; Bijl, H.P.; Christianen, M.E.; Beetz, I.; Chouvalova, O.; Steenbakkers, R.J.; Van Der Laan, B.F.; Wolffenbuttel, B.H.; Oosting, S.F.; Schilstra, C.; et al. A prospective cohort study on radiation-induced hypothyroidism: Development of an NTCP model. Int. J. Radiat. Oncol. Biol. Phys. 2012, 84, e351–e356. [Google Scholar] [CrossRef]
- Lambin, P.; Rios-Velazquez, E.; Leijenaar, R.; Carvalho, S.; Van Stiphout, R.G.; Granton, P.; Zegers, C.M.; Gillies, R.; Boellard, R.; Dekker, A.; et al. Radiomics: Extracting more information from medical images using advanced feature analysis. Eur. J. Cancer 2012, 48, 441–446. [Google Scholar] [CrossRef] [Green Version]
- Zwanenburg, A.; Vallières, M.; Abdalah, M.A.; Aerts, H.J.W.L.; Andrearczyk, V.; Apte, A.; Ashrafinia, S.; Bakas, S.; Beukinga, R.J.; Boellaard, R.; et al. The Image Biomarker Standardization Initiative: Standardized Quantitative Radiomics for High-Throughput Image-based Phenotyping. Radiology 2020, 295, 328–338. [Google Scholar] [CrossRef] [Green Version]
- Aerts, H.J.; Velazquez, E.R.; Leijenaar, R.T.; Parmar, C.; Grossmann, P.; Carvalho, S.; Bussink, J.; Monshouwer, R.; Haibe-Kains, B.; Rietveld, D.; et al. Decoding tumour phenotype by noninvasive imaging using a quantitative radiomics approach. Nat. Commun. 2014, 5, 4006. [Google Scholar] [CrossRef]
- Leijenaar, R.T.; Carvalho, S.; Hoebers, F.J.; Aerts, H.J.; Van Elmpt, W.J.; Huang, S.H.; Chan, B.; Waldron, J.N.; Osullivan, B.; Lambin, P. External validation of a prognostic CT-based radiomic signature in oropharyngeal squamous cell carcinoma. Acta Oncol. 2015, 54, 1423–1429. [Google Scholar] [CrossRef] [PubMed] [Green Version]
- Nardone, V.; Tini, P.; Pastina, P.; Botta, C.; Reginelli, A.; Carbone, S.F.; Giannicola, R.; Calabrese, G.; Tebala, C.; Guida, C.; et al. Radiomics predicts survival of patients with advanced non-small cell lung cancer undergoing PD-1 blockade using Nivolumab. Oncol. Lett. 2020, 19, 1559–1566. [Google Scholar] [CrossRef]
- Vallières, M.; Kay-Rivest, E.; Perrin, L.J.; Liem, X.; Furstoss, C.; Aerts, H.J.; Khaouam, N.; Nguyen-Tan, P.F.; Wang, C.S.; Sultanem, K.; et al. Radiomics strategies for risk assessment of tumour failure in head-and-neck cancer. Sci. Rep. 2017, 7, 1–14. [Google Scholar] [CrossRef] [Green Version]
- Grossmann, P.; Stringfield, O.; El-Hachem, N.; Bui, M.M.; Rios Velazquez, E.; Parmar, C.; Leijenaar, R.T.; Haibe-Kains, B.; Lambin, P.; Gillies, R.J.; et al. Defining the biological basis of radiomic phenotypes in lung cancer. eLife 2017, 6, e23421. [Google Scholar] [CrossRef]
- Leijenaar, R.T.; Bogowicz, M.; Jochems, A.; Hoebers, F.J.; Wesseling, F.W.; Huang, S.H.; Chan, B.; Waldron, J.N.; O’Sullivan, B.; Rietveld, D.; et al. Development and validation of a radiomic signature to predict HPV (p16) status from standard CT imaging: A multicenter study. Br. J. Radiol. 2018, 91, 2017049811075. [Google Scholar] [CrossRef] [PubMed]
- Cong, M.; Feng, H.; Ren, J.L.; Xu, Q.; Cong, L.; Hou, Z.; Wang, Y.; Shi, G. Development of a predictive radiomics model for lymph node metastases in pre-surgical CT-based stage IA non-small cell lung cancer. Lung Cancer 2020, 139, 73–79. [Google Scholar] [CrossRef] [PubMed] [Green Version]
- Kwan, J.Y.Y.; Su, J.; Huang, S.H.; Ghoraie, L.S.; Xu, W.; Chan, B.; Yip, K.W.; Giuliani, M.; Bayley, A.; Kim, J.; et al. Radiomic Biomarkers to Refine Risk Models for Distant Metastasis in HPV-related Oropharyngeal Carcinoma. Int. J. Radiat. Oncol. Biol. Phys. 2018, 102, 1107–1116. [Google Scholar] [CrossRef]
- Sun, R.; Limkin, E.J.; Vakalopoulou, M.; Dercle, L.; Champiat, S.; Han, S.R.; Verlingue, L.; Brandao, D.; Lancia, A.; Ammari, S.; et al. A radiomics approach to assess tumour-infiltrating CD8 cells and response to anti-PD-1 or anti-PD-L1 immunotherapy: An imaging biomarker, retrospective multicohort study. Lancet Oncol. 2018, 19, 1180–1191. [Google Scholar] [CrossRef]
- Pérez-Morales, J.; Tunali, I.; Stringfield, O.; Eschrich, S.A.; Balagurunathan, Y.; Gillies, R.J.; Schabath, M.B. Peritumoral and intratumoral radiomic features predict survival outcomes among patients diagnosed in lung cancer screening. Sci. Rep. 2020, 10, 1–15. [Google Scholar] [CrossRef]
- Vaidya, P.; Bera, K.; Gupta, A.; Wang, X.; Corredor, G.; Fu, P.; Beig, N.; Prasanna, P.; Patil, P.D.; Velu, P.D.; et al. CT derived radiomic score for predicting the added benefit of adjuvant chemotherapy following surgery in stage I, II resectable non-small cell lung cancer: A retrospective multicohort study for outcome prediction. Lancet Digit. Health 2020, 2, e116–e128. [Google Scholar] [CrossRef] [Green Version]
- Coroller, T.P.; Agrawal, V.; Huynh, E.; Narayan, V.; Lee, S.W.; Mak, R.H.; Aerts, H.J. Radiomic-Based Pathological Response Prediction from Primary Tumors and Lymph Nodes in NSCLC. J. Thorac. Oncol. 2017, 12, 467–476. [Google Scholar] [CrossRef] [Green Version]
- Sha, X.; Gong, G.; Qiu, Q.; Duan, J.; Li, D.; Yin, Y. Discrimination of mediastinal metastatic lymph nodes in NSCLC based on radiomic features in different phases of CT imaging. BMC Med. Imaging 2020, 20, 1–8. [Google Scholar] [CrossRef] [PubMed] [Green Version]
- Van Dijk, L.V.; Brouwer, C.L.; van der Schaaf, A.; Burgerhof, J.G.; Beukinga, R.J.; Langendijk, J.A.; Sijtsema, N.M.; Steenbakkers, R.J. CT image biomarkers to improve patient-specific prediction of radiation-induced xerostomia and sticky saliva. Radiother. Oncol. 2017, 122, 185–191. [Google Scholar] [CrossRef] [Green Version]
- Gabryś, H.S.; Buettner, F.; Sterzing, F.; Hauswald, H.; Bangert, M. Design and Selection of Machine Learning Methods Using Radiomics and Dosiomics for Normal Tissue Complication Probability Modeling of Xerostomia. Front. Oncol. 2018, 8, 35. [Google Scholar] [CrossRef]
- Krafft, S.P.; Rao, A.; Stingo, F.; Briere, T.M.; Court, L.E.; Liao, Z.; Martel, M.K. The utility of quantitative CT radiomics features for improved prediction of radiation pneumonitis. Med. Phys. 2018, 45, 5317–5324. [Google Scholar] [CrossRef] [PubMed]
- Lucia, F.; Bourbonne, V.; Visvikis, D.; Miranda, O.; Gujral, D.M.; Gouders, D.; Dissaux, G.; Pradier, O.; Tixier, F.; Jaouen, V.; et al. Radiomics Analysis of 3D Dose Distributions to Predict Toxicity of Radiotherapy for Cervical Cancer. J. Pers. Med. 2021, 11, 398. [Google Scholar] [CrossRef]
- Rossi, L.; Bijman, R.; Schillemans, W.; Aluwini, S.; Cavedon, C.; Witte, M.; Incrocci, L.; Heijmen, B. Texture analysis of 3D dose distributions for predictive modelling of toxicity rates in radiotherapy. Radiother. Oncol. 2018, 129, 548–553. [Google Scholar] [CrossRef]
- Bourbonne, V.; Da-ano, R.; Jaouen, V.; Lucia, F.; Dissaux, G.; Bert, J.; Pradier, O.; Visvikis, D.; Hatt, M.; Schick, U. Radiomics analysis of 3D dose distributions to predict toxicity of radiotherapy for lung cancer. Radiother. Oncol. 2021, 155, 144–150. [Google Scholar] [CrossRef]
- Van Griethuysen, J.J.; Fedorov, A.; Parmar, C.; Hosny, A.; Aucoin, N.; Narayan, V.; Beets-Tan, R.G.; Fillion-Robin, J.C.; Pieper, S.; Aerts, H.J. Computational radiomics system to decode the radiographic phenotype. Cancer Res. 2017, 77, e104–e107. [Google Scholar] [CrossRef] [Green Version]
- Phil, T. Sikerdebaard/Dcmrtstruct2nii: V1.0.19. 2020. Available online: https://github.com/Sikerdebaard/dcmrtstruct2nii (accessed on 20 August 2021).
- Yeo, I.K.; Johnson, R. A new family of power transformations to improve normality or symmetry. Biometrika 2000, 87, 954–959. [Google Scholar] [CrossRef]
- Johnson, W.E.; Li, C.; Rabinovic, A. Adjusting batch effects in microarray expression data using empirical Bayes methods. Biostatistics 2007, 8, 118–127. [Google Scholar] [CrossRef]
- Pedregosa, F.; Varoquaux, G.; Gramfort, A.; Michel, V.; Thirion, B.; Grisel, O.; Blondel, M.; Prettenhofer, P.; Weiss, R.; Dubourg, V.; et al. Scikit-learn: Machine Learning in Python. J. Mach. Learn. Res. 2011, 12, 2825–2830. [Google Scholar]
- Raschka, S. MLxtend: Providing machine learning and data science utilities and extensions to Python’s scientific computing stack. J. Open Source Softw. 2018, 3, 638. [Google Scholar] [CrossRef]
- Bakhshandeh, M.; Hashemi, B.; Mahdavi, S.R.M.; Nikoofar, A.; Vasheghani, M.; Kazemnejad, A. Normal tissue complication probability modeling of radiation-induced hypothyroidism after head-and-neck radiation therapy. Int. J. Radiat. Oncol. Biol. Phys. 2013, 85, 514–521. [Google Scholar] [CrossRef] [PubMed]
- Cella, L.; Liuzzi, R.; Conson, M.; D’Avino, V.; Salvatore, M.; Pacelli, R. Development of multivariate NTCP models for radiation-induced hypothyroidism: A comparative analysis. Radiat. Oncol. 2012, 7, 224. [Google Scholar] [CrossRef] [Green Version]
- Vogelius, I.R.; Bentzen, S.M.; Maraldo, M.V.; Petersen, P.M.; Specht, L. Risk factors for radiation-induced hypothyroidism: A literature-based meta-analysis. Cancer 2011, 117, 5250–5260. [Google Scholar] [CrossRef]
- Maldjian, P.D.; Chen, T. Is visual assessment of thyroid attenuation on unenhanced CT of the chest useful for detecting hypothyroidism? Clin. Radiol. 2016, 71, 1199.e9–1199.e14. [Google Scholar] [CrossRef]
- Watane, G.V.; Hammer, M.M. Imaging Biomarkers of Hypothyroidism on Lung Cancer Screening CT. Curr. Probl. Diagn. Radiol. 2021, 50, 807–810. [Google Scholar] [CrossRef]
- Cavalieri, R.R. Iodine metabolism and thyroid physiology: Current concepts. Thyroid. Off. J. Am. Thyroid. Assoc. 1997, 7, 177–181. [Google Scholar] [CrossRef] [PubMed]
- Arger, P.H.; Jennings, A.S.; Gordon, L.F.; Coleman, B.G.; Axel, L.; Kressel, H.Y.; Baron, R.L. Computed tomography findings in clinically normal and abnormal thyroid patients. J. Comput. Tomogr. 1985, 9, 111–117. [Google Scholar] [CrossRef]
- Kamijo, K. Clinical studies on thyroid CT number in chronic thyroiditis. Endocr. J. 1994, 41, 19–23. [Google Scholar] [CrossRef] [Green Version]
- Lambin, P.; Leijenaar, R.T.H.; Deist, T.M.; Peerlings, J. Radiomics: The bridge between medical imaging and personalized medicine. Nat. Rev. Clin. Oncol. 2017, 14, 749–762. [Google Scholar] [CrossRef] [PubMed]
- Zwanenburg, A.; Leger, S.; Agolli, L.; Pilz, K.; Troost, E.G.; Richter, C.; Löck, S. Assessing robustness of radiomic features by image perturbation. Sci. Rep. 2019, 9, 1–31. [Google Scholar] [CrossRef] [Green Version]
- Sanduleanu, S.; Woodruff, H.C.; de Jong, E.E.; van Timmeren, J.E.; Jochems, A.; Dubois, L.; Lambin, P. Tracking tumor biology with radiomics: A systematic review utilizing a radiomics quality score. Radiother. Oncol. 2018, 127, 349–360. [Google Scholar] [CrossRef] [PubMed]
- Park, J.E.; Kim, D.; Kim, H.S.; Park, S.Y.; Kim, J.Y.; Cho, S.J.; Shin, J.H.; Kim, J.H. Quality of science and reporting of radiomics in oncologic studies: Room for improvement according to radiomics quality score and TRIPOD statement. Eur. Radiol. 2020, 30, 523–536. [Google Scholar] [CrossRef] [PubMed]
- Vuong, D.; Bogowicz, M.; Denzler, S.; Oliveira, C.; Foerster, R.; Amstutz, F.; Gabryś, H.S.; Unkelbach, J.; Hillinger, S.; Thierstein, S.; et al. Comparison of robust to standardized CT radiomics models to predict overall survival for non-small cell lung cancer patients. Med. Phys. 2020, 47, 4045–4053. [Google Scholar] [CrossRef]


| Center A (n = 38) | Center B (n = 12) | Center C (n = 48) | |||||
|---|---|---|---|---|---|---|---|
| RIHT | NO | YES | NO | YES | NO | YES | |
| Sex | Female | 7 | 7 | 1 | 1 | 5 | 2 |
| Male | 21 | 3 | 8 | 2 | 29 | 12 | |
| Age | Median | 62.0 | 60.0 | 61.0 | 57.0 | 57.5 | 58.0 |
| IQR | 57.0–66.2 | 56.8–61.8 | 60.0–68.0 | 55.5–60.5 | 53.0–62.0 | 52.2–66.5 | |
| Stage | I–II | 6 | 1 | 2 | 0 | 12 | 1 |
| III–IV | 22 | 9 | 7 | 3 | 22 | 13 | |
| Mean thyroid dose, Dmean (Gy) | Median | 54.8 | 57 | 55.2 | 57.3 | 47.2 | 52.5 |
| IQR | 51.9–56.3 | 52.7–59.3 | 53.5–56.3 | 56.2–58.4 | 43.8–49.5 | 49.7–56.2 | |
| Minimal thyroid dose, Dmin (Gy) | Median | 42.5 | 46.5 | 43 | 51.8 | 30.9 | 44.3 |
| IQR | 29.1–46.6 | 43.3–47.5 | 41.1–48.2 | 50.1–54.3 | 24.6–39.0 | 32.7–46.9 | |
| Median thyroid dose, D50 (Gy) | Median | 55.0 | 55.5 | 54.5 | 58.5 | 47.0 | 52.2 |
| IQR | 53.7–56.3 | 52.9–58.7 | 53.9–54.9 | 57.2–59.0 | 43.8–50.4 | 50.5–56.4 | |
| Maximal thyroid dose, Dmax (Gy) | Median | 62.5 | 69.4 | 61.7 | 61.6 | 60.2 | 65.1 |
| IQR | 57.6–70.1 | 63.3–71.9 | 60.8–62.1 | 59.6–61.8 | 52.6–68.0 | 53.6–72.2 | |
| Thyroid volume (mL) | Median | 21.7 | 11.8 | 29 | 12.6 | 19.1 | 10.6 |
| IQR | 19.0–32.9 | 7.7–13.9 | 21.7–37.4 | 10.6–14.0 | 14.6–27.6 | 8.3–13.3 | |
| Baseline fT4 (pg/mL) | Median | 6.5 | 6.1 | 9.3 | 8.2 | 7.2 | 8.1 |
| IQR | 5.3–7.4 | 5.1–7.6 | 8.0–10.1 | 7.7–10.7 | 6.3–8.4 | 7.9–9.9 | |
| Baseline TSH (mIU/L) | Median | 0.5 | 1.3 | 0.7 | 0.4 | 0.7 | 1.1 |
| IQR | 0.3–0.8 | 0.8–1.7 | 0.6–1.2 | 0.4–0.7 | 0.5–1.5 | 0.6–1.2 | |
| Mean pituitary dose (Gy) | Median | 4.0 | 3.8 | 4.0 | 3.8 | 3.8 | 3.7 |
| IQR | 3.0–4.5 | 3.0–5.3 | 3.2–4.8 | 3.6–3.8 | 3.0–4.4 | 3.0–4.8 | |
| Time to follow–up (months) | Median | 29.5 | 15 | 22 | 13 | 38 | 19 |
| IQR | 26.0–37.2 | 14.0–15.8 | 21.0–24.0 | 12.0–13.5 | 31.2–41.0 | 16.0–21.0 | |
| Pixel spacing (mm2) | 0.98 × 0.98 | 25 | 9 | 0 | 0 | 26 | 11 |
| 1.07 × 1.07 | 1 | 0 | 0 | 0 | 3 | 3 | |
| 1.09 × 1.09 | 0 | 0 | 0 | 0 | 1 | 0 | |
| 1.11 × 1.11 | 0 | 0 | 0 | 0 | 1 | 0 | |
| 1.13 × 1.13 | 0 | 0 | 0 | 0 | 1 | 0 | |
| 1.17 × 1.17 | 0 | 0 | 0 | 0 | 1 | 0 | |
| 1.27 × 1.27 | 1 | 0 | 9 | 3 | 1 | 0 | |
| 1.56 × 1.56 | 1 | 1 | 0 | 0 | 0 | 0 | |
| Slice thickness (mm) | 1.5 | 1 | 0 | 0 | 0 | 0 | 0 |
| 2 | 1 | 1 | 0 | 0 | 2 | 1 | |
| 2.5 | 0 | 0 | 9 | 3 | 0 | 0 | |
| 3 | 24 | 9 | 0 | 0 | 26 | 9 | |
| 4 | 0 | 0 | 0 | 0 | 6 | 4 | |
| 5 | 2 | 0 | 0 | 0 | 0 | 0 | |
| VARIANT Ia | VARIANT Ib | VARIANT II | ||||
|---|---|---|---|---|---|---|
| Model | Features | Model | Features | Model | Features | |
| clinical (same for Ia and Ib) | GPC | Dmean D50 Vthyroid | GPC | Dmean D50 Vthyroid | GPC | Dmean D50 Vthyroid |
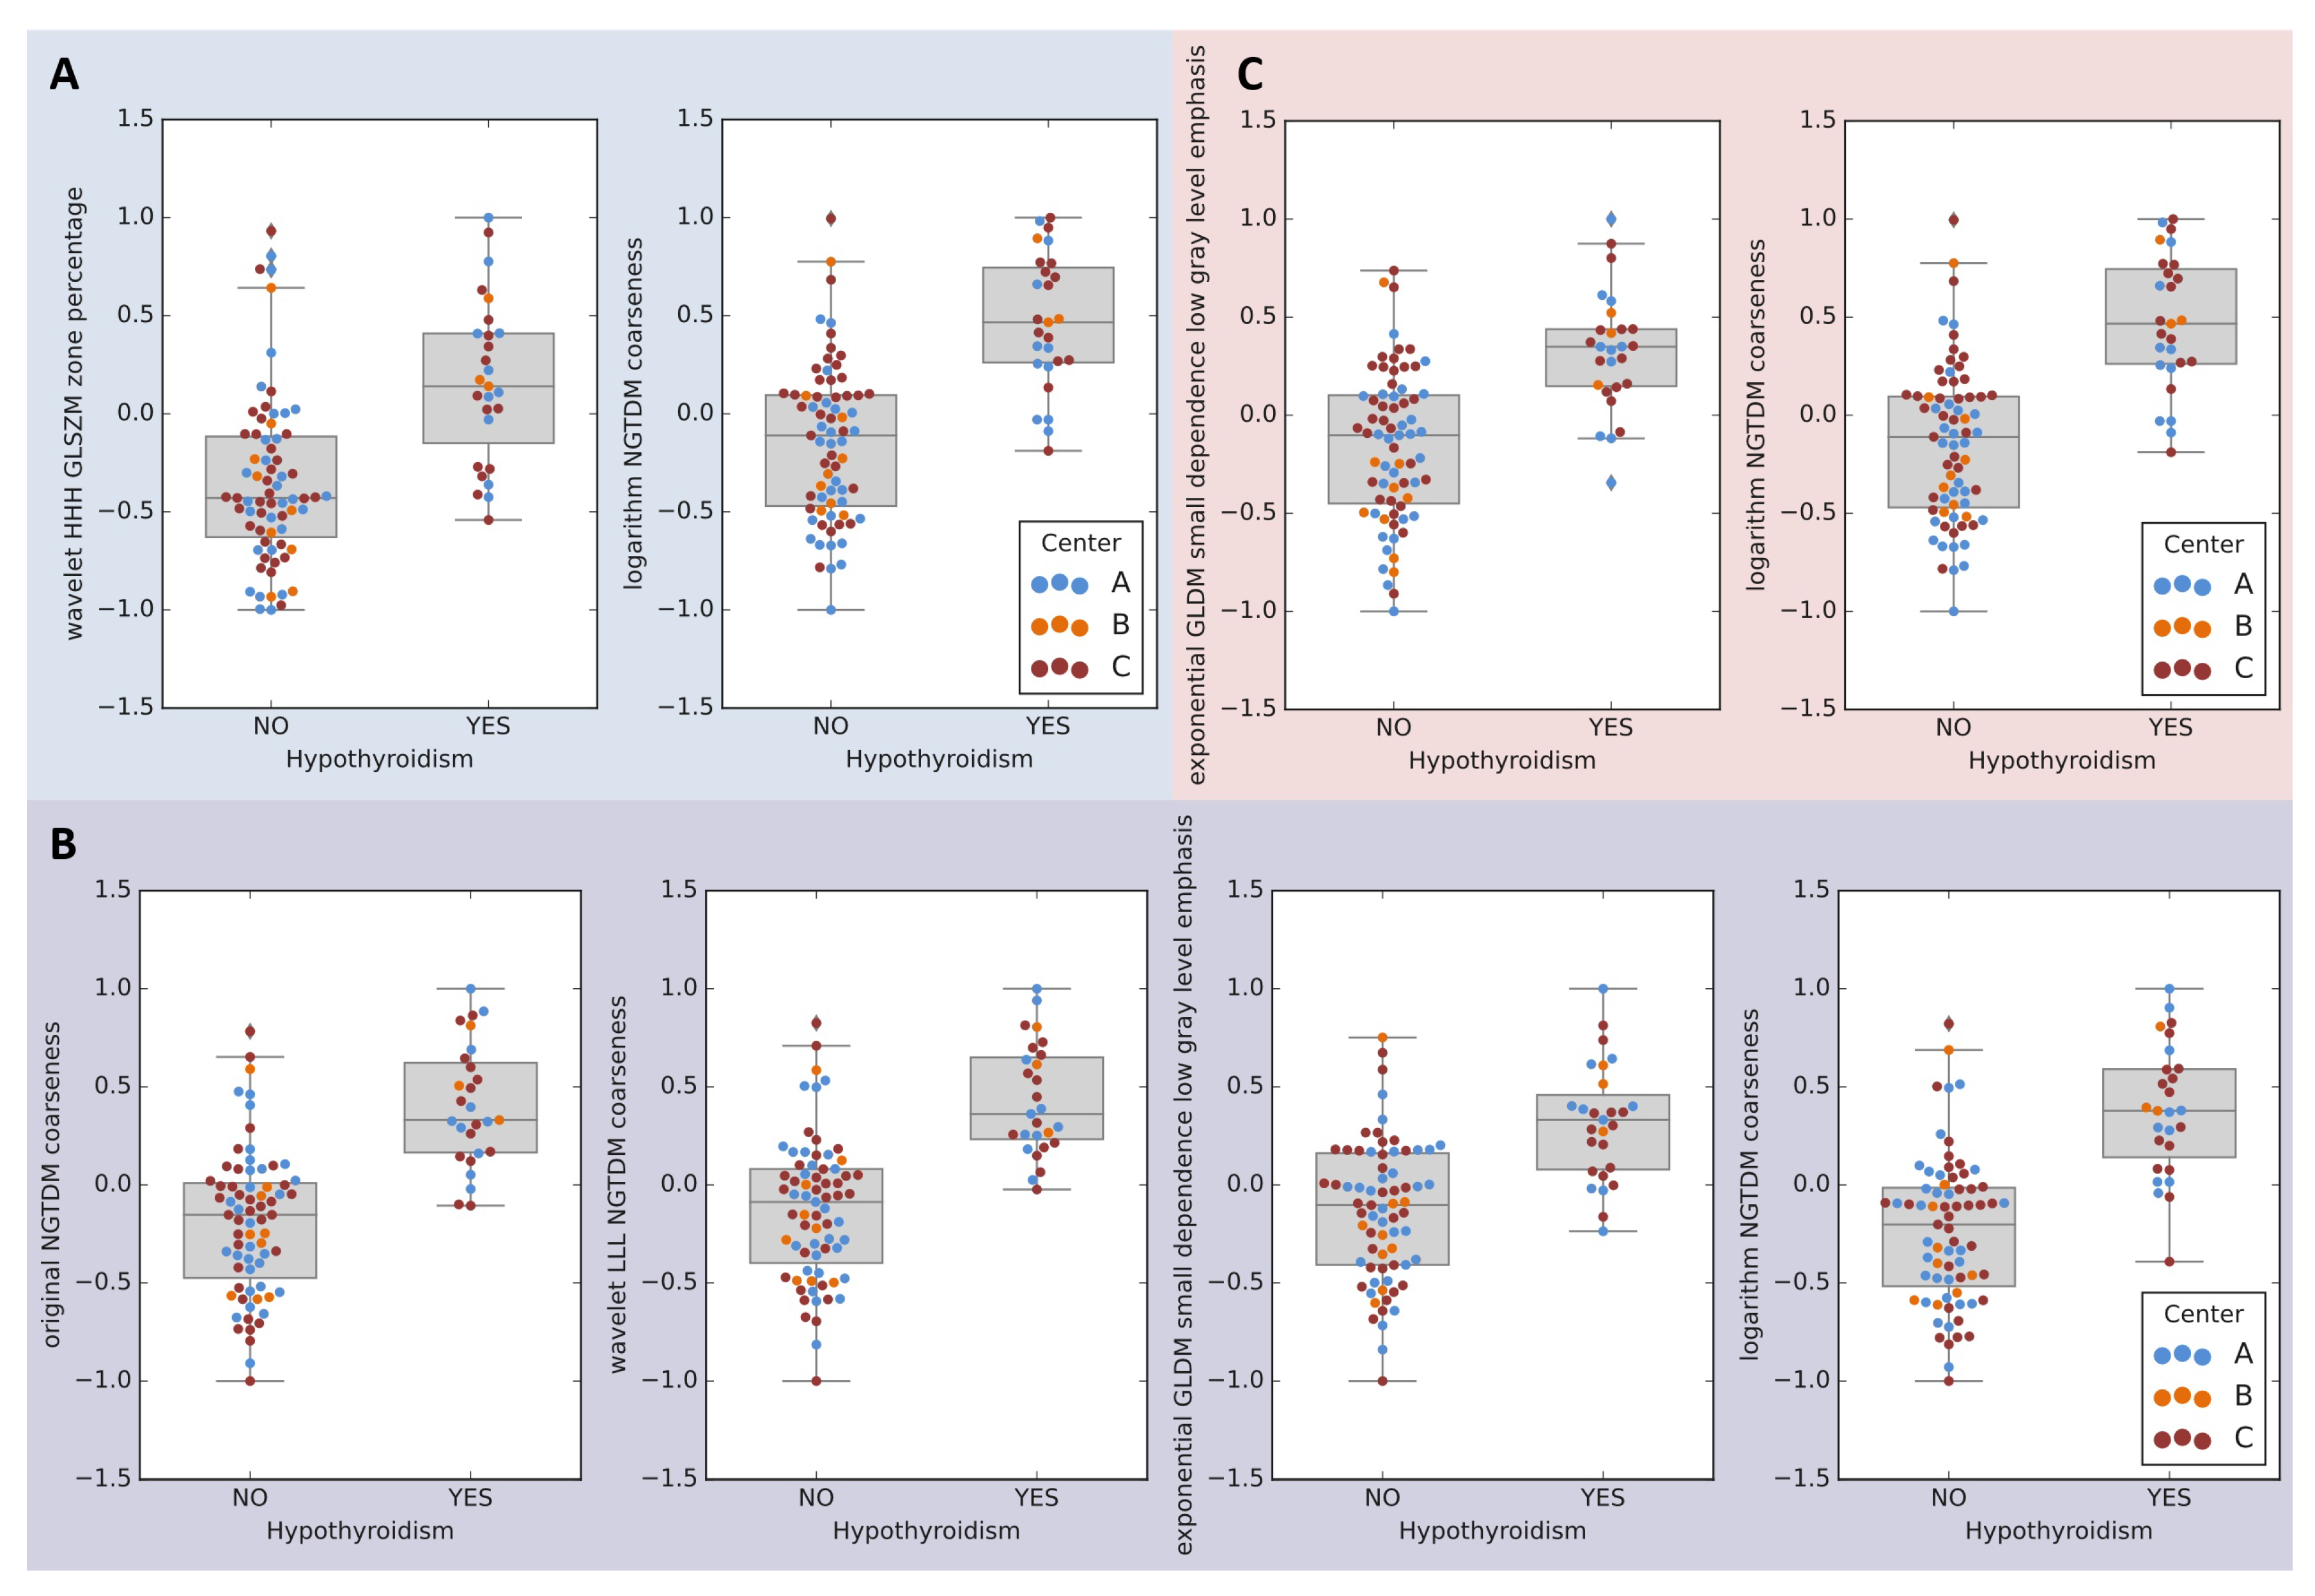
| radiomic | LRE | wavelet HHH GLSZM zone percentage logarithm NGTDM coarseness | MLP4 | original NGTDM coarseness wavelet LLL NGTDM coarseness exponential GLDM small dependence low gray level emphasis logarithm NGTDM coarseness | MLP4 | exponential GLDM small dependence low gray level emphasis logarithm NGTDM coarseness |
| clinical+radiomic | MLP2 | sex original shape least axis length exponential GLRLM run percentage exponential GLDM small dependence low gray level emphasis logarithm NGTDM coarseness | MLP4 | original NGTDM coarseness wavelet LLL NGTDM coarseness exponential GLDM small dependence low gray level emphasis logarithm NGTDM coarseness | MLP2 | sex original shape least axis length exponential GLRLM run percentage exponential GLDM small dependence low gray level emphasis logarithm NGTDM coarseness |
| VARIANT Ia | VARIANT Ib | VARIANT II | ||||
|---|---|---|---|---|---|---|
| Model | AUC ± SE | p | AUC ± SE | p | AUC ± SE | p |
| clinical | 0.90 ± 0.07 | - | 0.90 ± 0.07 | - | 0.95 ± 0.05 | - |
| radiomic | 0.89 ± 0.07 | 0.9196 | 0.94 ± 0.05 | 0.6471 | 0.91 ± 0.07 | 0.6263 |
| radiomic+clinical | 0.95 ± 0.05 | 0.5549 | 0.94 ± 0.05 | 0.6471 | 0.92 ± 0.06 | 0.8286 |
| PROBA | 0.90 ± 0.07 | 1.0000 | 0.95 ± 0.05 | 0.5549 | 0.93 ± 0.06 | 0.7940 |
Publisher’s Note: MDPI stays neutral with regard to jurisdictional claims in published maps and institutional affiliations. |
© 2021 by the authors. Licensee MDPI, Basel, Switzerland. This article is an open access article distributed under the terms and conditions of the Creative Commons Attribution (CC BY) license (https://creativecommons.org/licenses/by/4.0/).
Share and Cite
Smyczynska, U.; Grabia, S.; Nowicka, Z.; Papis-Ubych, A.; Bibik, R.; Latusek, T.; Rutkowski, T.; Fijuth, J.; Fendler, W.; Tomasik, B. Prediction of Radiation-Induced Hypothyroidism Using Radiomic Data Analysis Does Not Show Superiority over Standard Normal Tissue Complication Models. Cancers 2021, 13, 5584. https://0-doi-org.brum.beds.ac.uk/10.3390/cancers13215584
Smyczynska U, Grabia S, Nowicka Z, Papis-Ubych A, Bibik R, Latusek T, Rutkowski T, Fijuth J, Fendler W, Tomasik B. Prediction of Radiation-Induced Hypothyroidism Using Radiomic Data Analysis Does Not Show Superiority over Standard Normal Tissue Complication Models. Cancers. 2021; 13(21):5584. https://0-doi-org.brum.beds.ac.uk/10.3390/cancers13215584
Chicago/Turabian StyleSmyczynska, Urszula, Szymon Grabia, Zuzanna Nowicka, Anna Papis-Ubych, Robert Bibik, Tomasz Latusek, Tomasz Rutkowski, Jacek Fijuth, Wojciech Fendler, and Bartlomiej Tomasik. 2021. "Prediction of Radiation-Induced Hypothyroidism Using Radiomic Data Analysis Does Not Show Superiority over Standard Normal Tissue Complication Models" Cancers 13, no. 21: 5584. https://0-doi-org.brum.beds.ac.uk/10.3390/cancers13215584