
Estimating Interpersonal Distance and Crowd Density with a Single-Edge Camera


1
Department of Electrical and Computer Engineering, Binghamton University, Binghamton, NY 13902, USA
2
Technergetics, LLC, Utica, NY 13502, USA
*
Author to whom correspondence should be addressed.
Computers 2021, 10(11), 143; https://0-doi-org.brum.beds.ac.uk/10.3390/computers10110143
Submission received: 29 September 2021
/
Revised: 28 October 2021
/
Accepted: 29 October 2021
/
Published: 5 November 2021
(This article belongs to the Special Issue Feature Paper in Computers)
Abstract
:For public safety and physical security, currently more than a billion closed-circuit television (CCTV) cameras are in use around the world. Proliferation of artificial intelligence (AI) and machine/deep learning (M/DL) technologies have gained significant applications including crowd surveillance. The state-of-the-art distance and area estimation algorithms either need multiple cameras or a reference object as a ground truth. It is an open question to obtain an estimation using a single camera without a scale reference. In this paper, we propose a novel solution called E-SEC, which estimates interpersonal distance between a pair of dynamic human objects, area occupied by a dynamic crowd, and density using a single edge camera. The E-SEC framework comprises edge CCTV cameras responsible for capturing a crowd on video frames leveraging a customized YOLOv3 model for human detection. E-SEC contributes an interpersonal distance estimation algorithm vital for monitoring the social distancing of a crowd, and an area estimation algorithm for dynamically determining an area occupied by a crowd with changing size and position. A unified output module generates the crowd size, interpersonal distances, social distancing violations, area, and density per every frame. Experimental results validate the accuracy and efficiency of E-SEC with a range of different video datasets.
1. Introduction
The closed circuit television (CCTV) is a closed-loop television system where the CCTV pictures or video streams are only available to those connected directly into the loop unlike the broadcast television system which is available to anyone with an appropriate receiver. The loop refers to a physical link or a cable that carries the picture from the camera(s) to surveillance operation centers (SOC) or the viewer(s) or storage site. Since its first use in the 1950s, it has become an indispensable element of any professional physical security system. It creates a scenario where both premises and the people within them are constantly surveyed. This provides the security teams and property managers a tighter control over accesses to properties and facilities [1,2,3]. It is one of the important means of meeting the challenges posed by the rising crime rate. Today, with the main goals of ensuring physical security and public safety, there are more than a billion CCTV cameras in use around the globe enabling the law enforcers and security personnel to collect huge amount of information about individuals and follow their activities live [4,5,6,7,8]. It helps to identify law breaking individuals and deters crimes. In addition, with the aid of CCTV cameras, managers and supervisors can control risks and minimise costs efficiently and with the minimum of disruption [8,9,10,11]. They could also be employed to contain contagious diseases, like COVID-19, by providing data useful for faster interpersonal gap and crowd density determinations and alerting people to maintain the minimum required social distance between them.
With the increasing change in the flexibility and capability of CCTV systems due to rapid advancement of electronic technologies and physical links like microwave, laser, or other connections, the application of CCTV cameras has dramatically peaked. They offer plenty of benefits like assisting Police authorities in the monitoring of traffic flows and the implementation of prompt action in the case of accidents and other emergencies. Besides they greatly enable process industry managers to control the flow of work, identify bottlenecks and take corrective action timely. They also play vital roles in the monitoring of hostile environments that are not accessible to man, such as nuclear reactors and furnaces. Comparatively speaking, security and surveillance are the most accepted applications for the CCTV systems [8,12,13,14,15]. As effective crime deterrents, the CCTV cameras can provide such security applications as monitoring access to secure or private areas, unauthorised activities, theft or criminal damage, and personal safety. The surveillance applications of CCTV cameras include the monitoring of changing conditions and deciding on corrective action in crowd control, traffic control, industrial process control, public access, staff control, car park security, and shopping precinct security.
Earlier we proposed and built privacy-conscious surveillance models that identify individuals with aggressive and suspicious behavioral patterns, like gun brandishing or/and fist-raising, in a crowd [9,10]. Following the detection, the models are capable of sending alerting messages to law enforcers for immediate intervention. This is an example of a crowd control process. Generally, crowd control refers to a public security practice where crowds are managed and controlled to deter the outbreak of crowd affray, crushes, fights involving drunk and disorderly people or riots. Through time, mechanical surveillance systems like CCTV cameras have proved to be useful in overtly or covertly gathering audio-visual information about crowds’ characteristics, and access to some items. These activities are said to be vital for immediate actions of law enforcers to ensure the safety of crowds. This paper is, however, specifically motivated by the way COVID-19 spreads. We all have witnessed how the COVID-19 since its outbreak just before the dawning of the 2020 has tremendously affected more than 180 millions of people worldwide. Hence, in the effort to curb the dissemination of the virus, a number of different measures were adopted by a multitude of countries. Well, social distancing (SD) has been one of the most crucial practices to contain the virus. Therefore, introducing effective algorithms and unified models that make CCTV cameras more intelligent and useful in controlling crowds by estimating interpersonal distances and occupied areas is of paramount importance. This way cautioning messages can be generated to alert individuals in a crowd to maintain the minimum social distance required to eschew the spread of the virus in real-time. These algorithms and unified models are deployed on a cloud environment connected to edge CCTV cameras which are either wall-mounted or perched on poles three or more meters high.
The state-of-the-art distance and area estimation algorithms either need multiple cameras or a reference scale as a ground truth. Unfortunately, it is not realistic to have every site monitored under multiple cameras due to the cost. Neither is there always an object in a scenario that provides a scale factor. It is an open question to obtain an estimation using a single camera without a scale reference. To enable a good crowd control vis-à-vis containing contagious disease like COVID-19, we propose a novel solution called E-SEC, which estimates interpersonal distance between a pair of dynamic human objects, area occupied by a dynamic crowd, and density using a single edge camera. We built and tested E-SEC models and algorithms. The major contributions are briefly enumerated in what ensues:
- Design of algorithms for estimating the minimum social distance between two people in a crowd captured by a single edge camera.
- Design of an algorithm for estimating an area occupied by people in a video frame created by a single edge camera.
- Design of an algorithm that determines the number of people in a crowd caught on camera violating the minimum social distance.
- Design of a unified model capable of generating reports of the count of people in a video frame, the tuples of interpersonal distances, area occupied or density, and number of violations. Besides, the model generates messages that alerts individuals to take corrective actions.
- Extensive experimental analyses on stream of real videos created on a calibrated environment and publicly available pertinent video datasets corroborate applicability of the algorithms and models proposed in E-SEC.
The remainder of this paper is organized as follows: the related work is tersely presented in Section 2 ensued by the description of the overall system architecture of E-SEC in Section 3. In Section 4 and Section 5, the Distance Estimation and Area Estimation Algorithms are portrayed and explained. The experimental analyses, results and discussion are presented in Section 6. At last, the conclusions are presented in Section 7.
2. Related Work
2.1. Social Distancing
Following the advent of the COVID-19 pandemic just before the dawning of the new year of 2020, numerous efforts were done around the world to at least alleviate or fully stop the spread of the contagious viral disease. Then, social distancing (SD) was recommended as the best practice to curb the transmission of the infectious virus by many an expert following its initial practice and success story in China [16]. Later, international organizations like world health organization (WHO) and national organizations like the Centers for Disease Control and Prevention (CDC) of the United States deemed SD as the utmost reliable practice to contain the communicable virus and advised people to stay at least two meter or 6 feet apart from each other. Some researchers timely carried out a study on the social distancing impacts on controlling the spread of the COVID-19 outbreak and found out very encouraging results and ended up corroborating the recommendations of WHO and CDC [17].
As the number of COVID-19 cases and death rates had kept on sky-rocketing, some countries have resorted to adopting and employing technology-based solutions to monitor the movements of people who contracted the virus and to make sure that people are observing the social distancing requirements. The important technologies that could be employed to ensure the correct and consistent practice of social distancing include Surveillance Cameras, GPS, Computer Vision, Wi-Fi, Bluetooth, Deep Learning, Positioning or localization techniques, and smart phones. A survey [18] shows the attempts made to make use of some of the aforementioned technologies; they lack clear methods for precisely determining the distance between people in a crowd, though. Besides, previous works that focus on selective surveillance [6,9] and crowd surveillance using drones [13,19,20,21] could be further developed to be employed for social distance determination, monitoring, and alerting. The machine learning technology has a wide range of applications [22,23]; as a result, it can be adopted to design and build models useful for crowd control, like monitoring social distancing.
Given the pervasive existence of surveillance CCTV cameras in a myriad of suburban and urban areas around the world, many researchers have tried to develop solutions for social distance monitoring by leveraging these surveillance edge cameras, edge computing paradigm [24], and trending technologies like computer vision and deep learning. Based on an open image frontal-view dataset (OID) trained using YOLOv3 [25], a framework was developed to track people using the bounding boxes generated by the detection model coupled with a deep-sort [26]. Besides, a comparison between the use of YOLOv3, faster-RCNN [27] and SSD [28] for object detection and classification were performed in this paper [26] where the YOLOv3 was selected eventually. In the same year (2020), an autonomous drone-based model for social distancing monitoring was built [29]. The YOLOv3 was trained with limited custom dataset comprising few frontal and side view images of limited people, which was later extended for monitoring people whether they are wearing masks or not. Another framework [30] for physical distancing and crowd management was also developed in that very same year. After thoroughly investigating all these works, we have identified some gaps. All these papers primarily focus on the detection of people by adopting and improving existing deep-learning models like YOLOv3. However, they do not provide methods for determining or estimating the distance between two people, which is vital for monitoring the social distancing using surveillance cameras. For example, in a paper titled “A deep learning-based social distance monitoring framework for COVID-19” [31], a deep learning platform for social distance tracking using an overhead perspective is proposed. It mainly focused on improving the YOLOv3 through transfer-learning to add the capability of detecting people from an overhead perspective; it, however, gives no method or algorithm how the distance between people was determined. It simply uses an assumed pixels. This has served as a motivation for us to carry out extensive investigations and experiments to come up with some efficient mechanisms and algorithms for measuring the interpersonal distance in a crowd using a single camera.
2.2. Distance Estimation Using a Single Camera
To date, there is no established method for determining the distance between two dynamic objects using a single camera. It is possible to measure the distance between a fixed reference object of precisely known size and other objects on an image using a variant of the Thin-Lens Equation stated in Equation (1) [32,33], but not the distance between two dynamic objects. According to the principle of optics, ray tracing can be used to construct an image from the light rays originating from an object that pass through a lens. The image is located at the point where the rays cross. By choosing several points from an object the entire image can be constructed. Let be the object distance, the distance of an object from the center of a lens, be distance of the image from the center of a lens. The height of the object and height of the image are given by the symbols and , respectively. The thin lens equation quickly provides the relation between , , and the focal length f. It can be derived from a geometric analysis of ray tracing for thin lenses and is given by Equation (1).
The magnification m of an image is the ratio between the image and object height (). The magnification is related to by the relation stated in Equation (2).
Equation (1) cannot, however, be employed to accurately determine the distance between two moving objects or people captured by a single camera. Normally, to precisely determine the location of an object in space, for example using GPS systems, the triangulation or trilateration technique is employed where at least three GPS satellites are needed. Likewise, to determine the distance of an object, two cameras (stereo-system) with exactly known distance from each other are required. Hence, the concept of triangulation can be employed to approximately determine the distance between a camera and an object. Here trigonometric techniques can be used to estimate the distance based on the known distance between the cameras, and their respective field of visions. This approach even would have limitations when an object is situated on the side of one of the cameras but far away from the other one. Then, in this work, we came up with an approach that can measure interpersonal distance and occupied areas relatively more accurately than existing methods using a single camera.
3. E-SEC: Unified Model for Distance and Density Estimation
E-SEC leverages pervasively deployed surveillance cameras to enable easy crowd monitoring in relation to containing a contagious disease. Larger information technology (IT) services providers usually make use of hierarchical computing paradigms depending on data size, computational needs, and applications they run. The hierarchical computing architectures enable organizations or applications like the Industrial Internet of Things (IIoT) and CCTV-based surveillance to take advantage of a variety of computing and data storage resources. Cloud computing paradigm frees organizations from the requirement to keep expensive data-center infrastructure on site. It allows data to be collected from multiple distant sites and devices. It is accessible from anywhere around the globe. Fog computing and edge computing look similar for they both bring the intelligence and processing power closer to the point of data creation and collection. However, a fog environment places intelligence at the enterprise campus area network (CAN) where data is transmitted from endpoints to a gateway for processing. The edge computing places intelligence and processing power in devices such as embedded automation controllers, CCTV cameras, and smart meters. It allows the processing of data to be performed locally at multiple decision points for the purpose of enabling real-time communication and decision making by reducing network traffic, response time, and risk of security and privacy breaches.
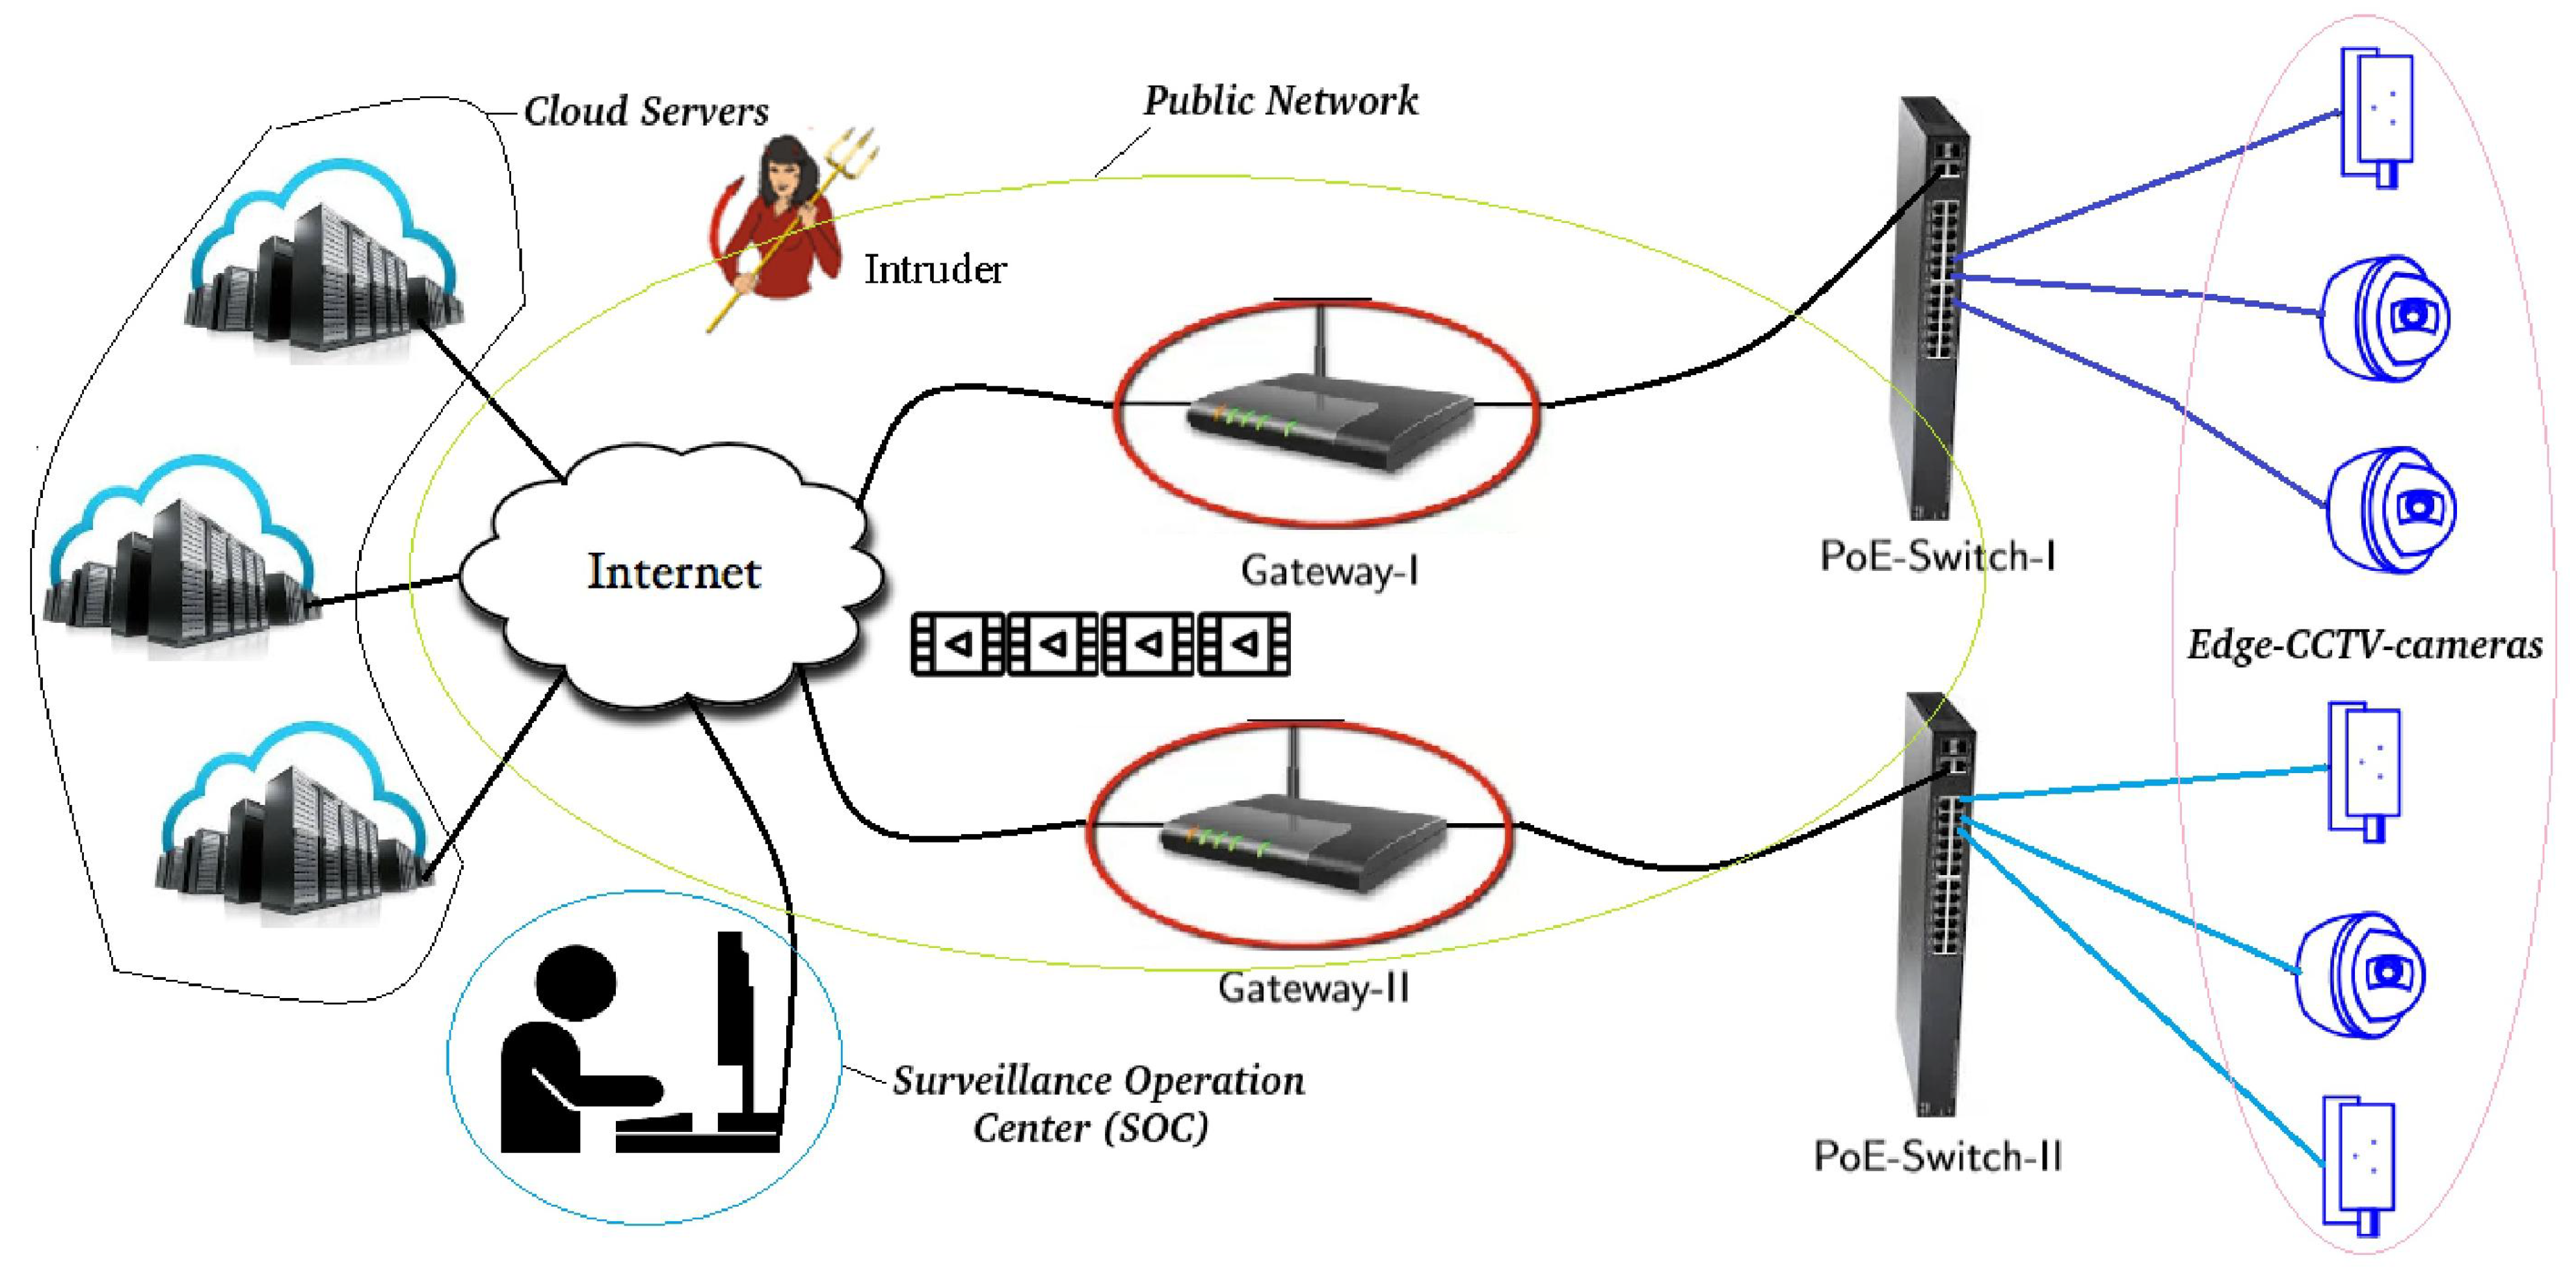
Therefore, E-SEC adopts a hierarchical cloud/fog-based video surveillance system (VSS) architecture as portrayed in Figure 1. It comprises edge CCTV cameras that capture images and video frames, wide area network (WAN)/ campus area network (CAN) that relays the video streams created by the edge-cameras to the storage or analytics centers, powerful cloud/fog servers for processing videos and performing video analytics, and a surveillance operation centers where security personnel or law enforcers sit to observe the activities or behavioral patterns of individuals caught on those edge cameras. To prevent the compromise of the privacy of individuals caught on the cameras, the video streams are transmitted over the insecure channel in enciphered form to the remote storage and processing sites. They are scrambled using a lightweight chaotic scheme [9,34].
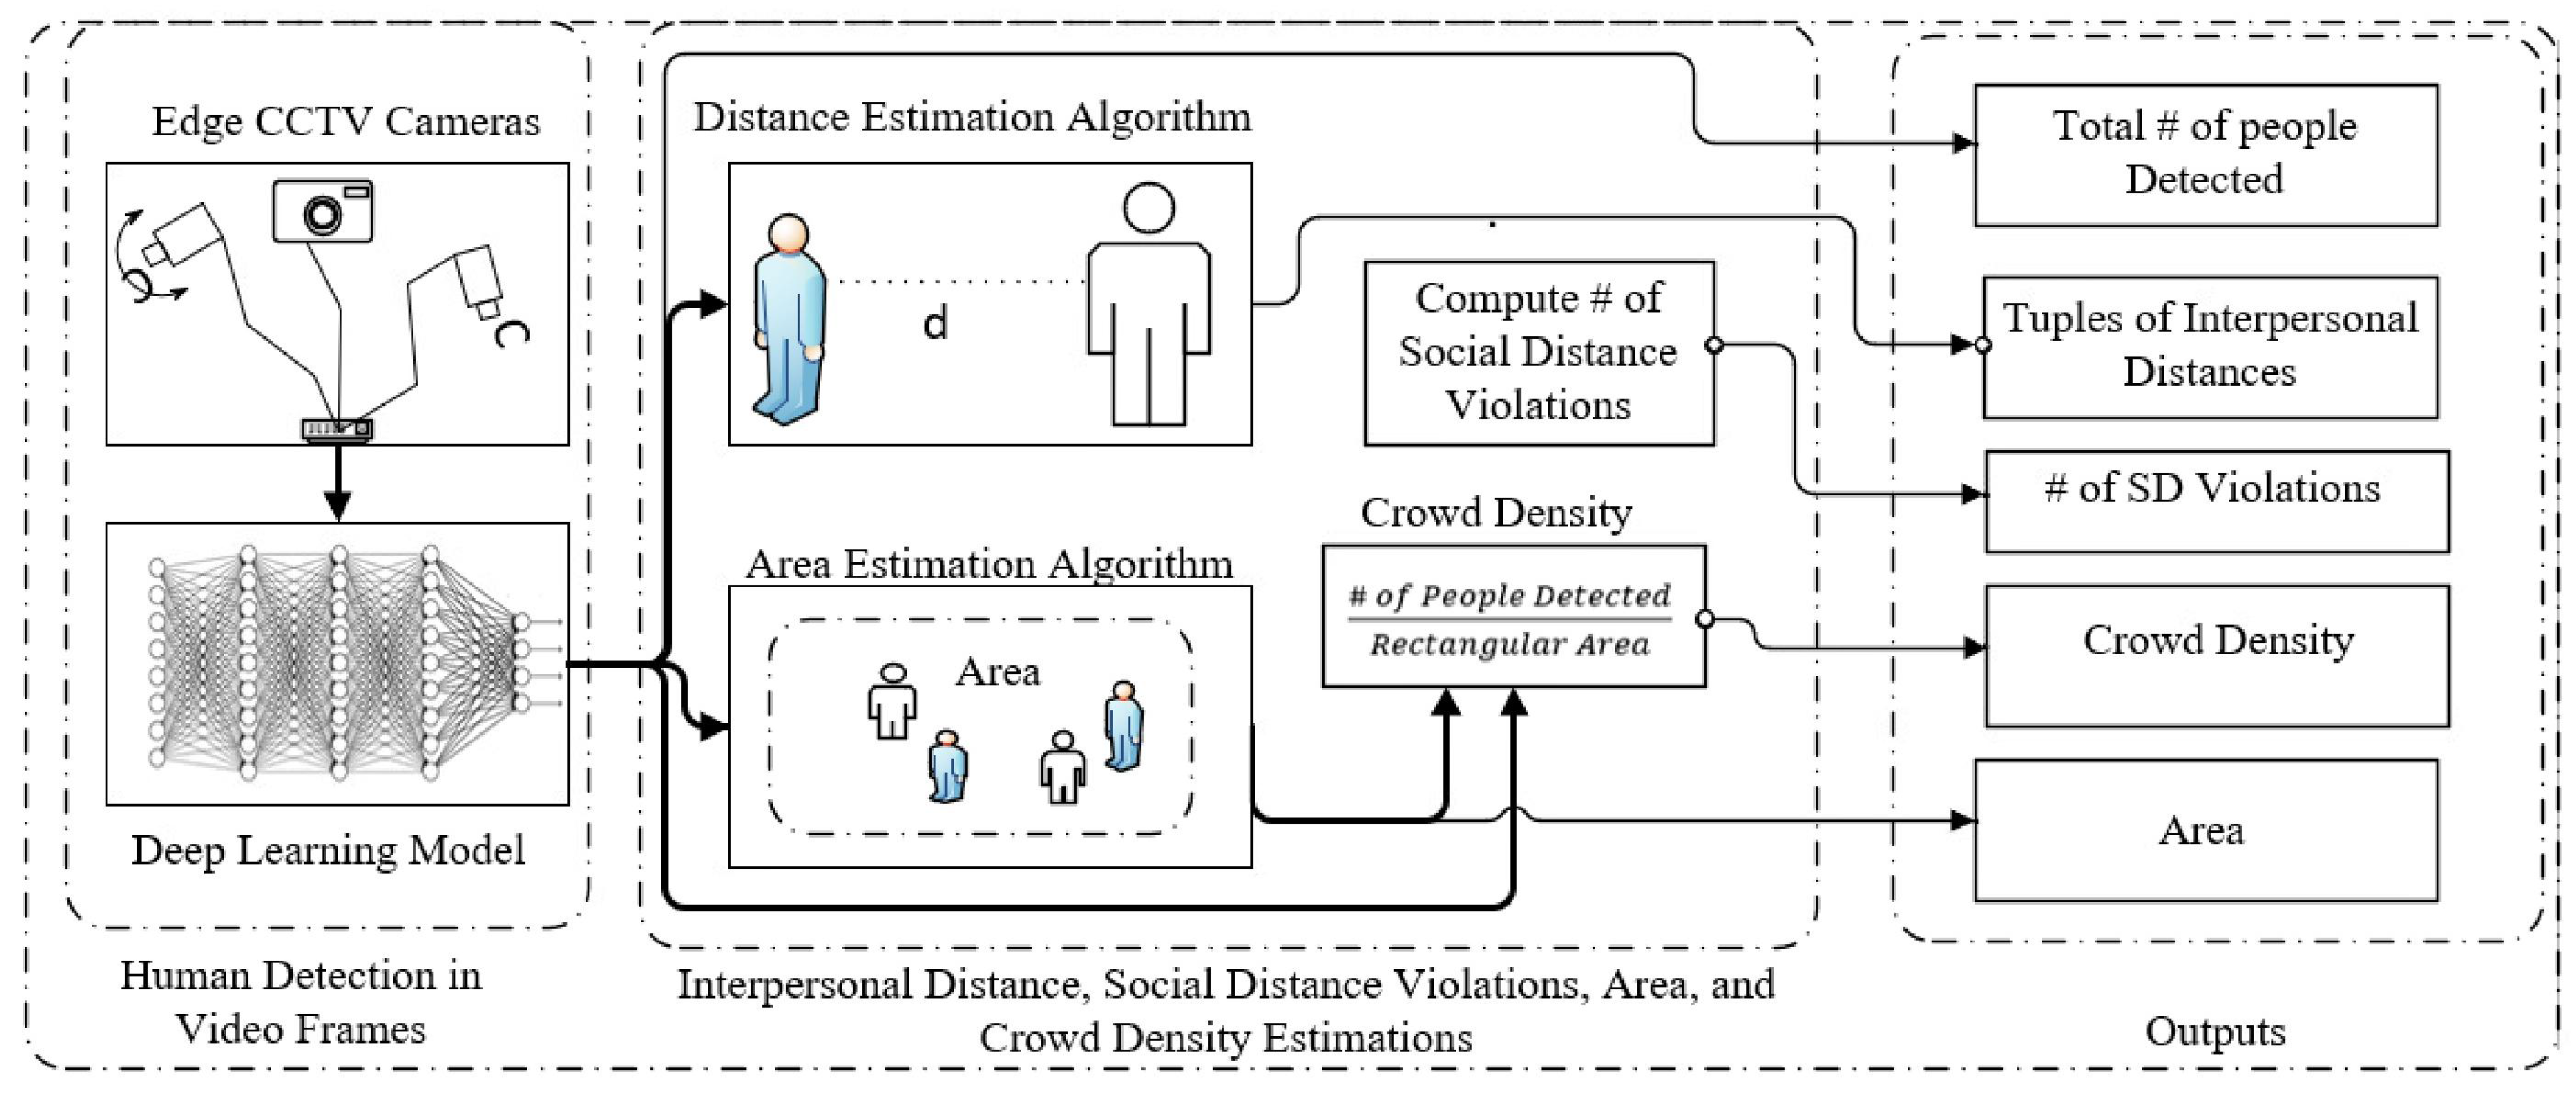
Figure 2 portrays the high-level framework of the unified E-SEC model where CCTV cameras function as edge devices for capturing crowds in streets and other designated places. The various components that constitute the proposed framework for crowd control are briefly elucidated in what ensues.
- Edge CCTV Cameras: they are placed at the edge of the network mounted on walls, and perched on poles along streets, city corners, stores, etc as shown in Figure 1. In the proposed framework, they are responsible for creating video frames of target crowds which are transmitted to remote analytics centers on cloud servers over the Internet. They are the eyes and ears of the proposed model. Besides, they are capable of enforcing privacy measures, like encrypting video frames to ensure end-to-end privacy (E2E).
- Human Detection in Video Frames: in order to determine the distance between people and the area occupied by a crowd, the first step is accurately detecting the people caught on a video frame by a camera. In E-SEC, however, the design of an object detection model is not one of our prime goals. As a result, we adopted YOLOv3 model for human detection on video frames and modified it so as to fit our purpose. It is able to detect people caught on camera with greater accuracy, which is vital for computing their centroids which are in turn useful for estimating distance between the people and their footage occupancy.
- Interpersonal Distance Estimator: this is an algorithm designed in this paper and employed to estimate the distance b/n two dynamic people on a video frame. That is, for tracking the distance between a pair of people in motion. The detailed description of the distance estimation algorithm is provided in Section 4. Knowledge of the inter-distance plays very crucial role in alerting people to maintain the minimum social distance so as to cut down on the spread of a contagious viral disease like COVID-19.
- Area Estimator Algorithm: this is designed to estimate an area occupied by a crowd caught on an edge camera using rectangular approximation explained in Section 5. It is an integral component of an effective crowd surveillance, which helps ensure the safety and security of a crowd. In a social or other form of gathering, it helps people in the venue enjoy themselves without worrying about their safety and physical security.
- Outputs: at last, as illustrated on Figure 1, the proposed unified model outputs the number of people caught on a frame, the tuples of distances between every pair of people on the frame, the number of people violating the minimum social distancing requirement, the area occupied by a crowd captured on a frame, and the crowd density just computed by dividing the number of people detected on a frame by the estimated rectangular area that they occupy.
4. Distance Estimation Algorithm
It has been proved that technology-based crowd management plays very pronounced roles in containing the spread of contagious viral diseases, especially when immunization vaccine is not yet invented. The COVID-19 outbreak has caused a global disaster which has infected more than 180 million people worldwide by spreading like a wild fire. Until the development of vaccines, social distancing had been the sole means to stymie the spread of the pandemic virus. Hence, in the face of a contagious pandemic, technology-based crowd control mechanism is of paramount importance. In this section, we have introduced mechanisms and techniques for estimating the distance between a pair of people in a crowd using a single edge camera. There are no established methods for determining the distance between two dynamic objects in a video stream created by using a single camera to date. All that people are able to achieve so far is measuring the distance of an object of definitely known size where the distance between the camera and the object is also known a priori, often considered as a reference. However, there is no way we can tell these two parameters from a video containing people who continuously change their positions. Then, following a thorough investigation and extensive experimental analysis, we came up with certain methods and algorithms for estimating the interpersonal distance, which is described in the subsections that follows.
4.1. Triangle Similarity
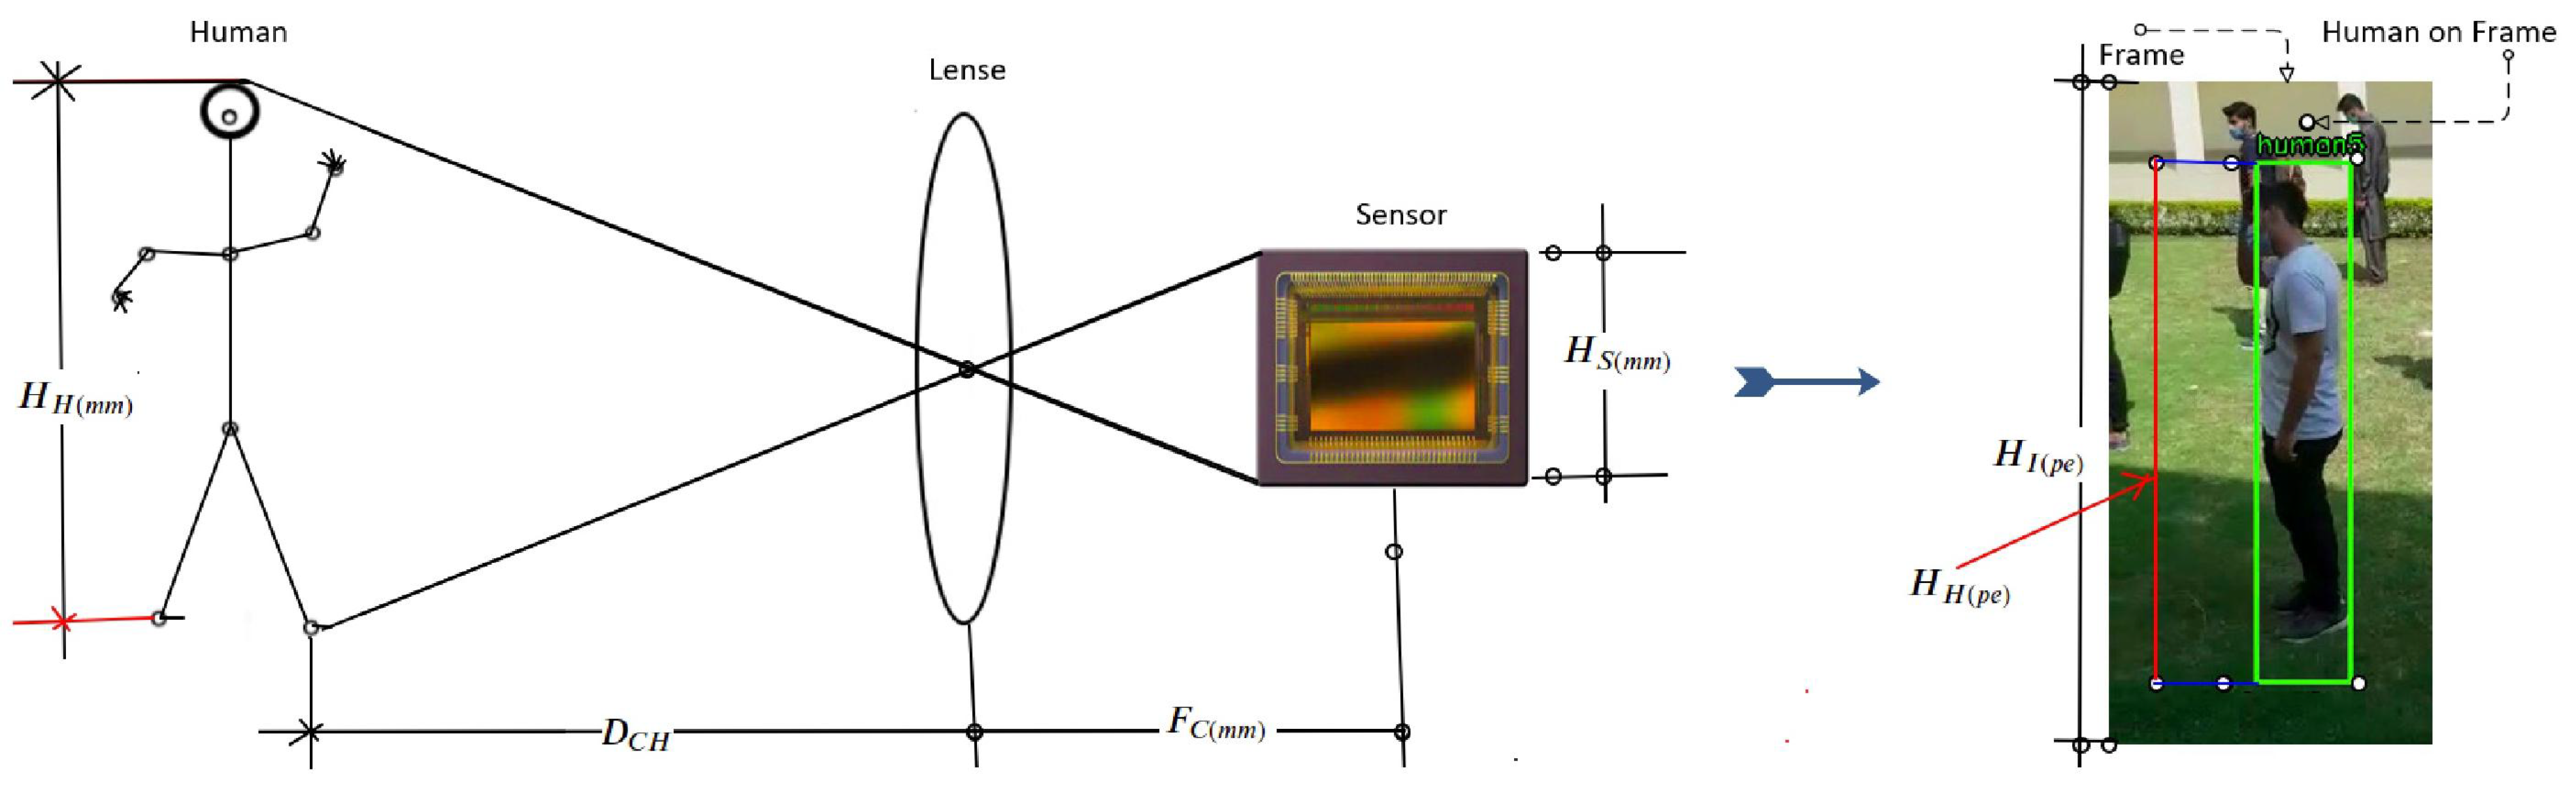
The triangle similarity equation stated in Equation (3), derived from the Thin Lens Equation provided by Equation (1), is often employed to determine a distance from a camera to a known fixed object or marker. We are going to utilize triangle similarity with some improvements in what fallows. The triangle similarity works in a such a way that a marker or an object with a known width W is placed some distance D from the camera. Then, the apparent width of the object in pixels (P) is measured from the picture of the object caught by using the camera, which allows us to derive the perceived focal length F of the camera using the triangle similarity equation given by Equation (3).
To account the variations in height measurements of people’s height on video frames depending on their distance from the camera, we derived a new relationship from Equation (3) using the principles of geometric optics provided by Equation (4). As portrayed in Figure 3, is the distance between a camera and a human measured in millimeter (mm), is the focal length of the camera in mm, is height of human in mm, is height of then video frames in pixels, is the height of the image sensor of the camera in mm, and is the human height on the frame in pixels.
To determine the distance between two people on a frame created by a camera, the determination of their respective distances from the camera using Equation (4) and their centroids are required. Here the average human height [35] is considered for dynamically measuring the actual height of people in such setting is next to impossible. This approach works fine as long as people are not underneath of an overhead camera. Under normal circumstances, we expect the number of pixels used to represent a distance on an image to decrease as the object moves away from the camera and conversely. However, the number of pixels used to represent the height of a person caught right underneath a camera is not correct. Besides, this approach needs the knowledge of the actual distances of the objects under consideration at least at the beginning of the process which makes the implementation very difficult.
4.2. Pixel Per Metric Method
Taking the upsides of the methods described in Section 4.1, we proposed a more accurate and realistic method in this subsection. After a thorough analysis of the front, back, and side views of people on an image and the variation of the number of pixels used to represent apparent distances on a frame depending up on the position of the object of interest, we designed a method described by Algorithm 1. The Central idea of this algorithm is the establishment of a relationship between distances measured in pixels and actual real-world units like feet or meter. Our experimental analyses proved that the use of a human width in lieu of human height produces more consistent and accurate results because the height is more sensitive to the camera position.
Using the foundations laid in the previous sections and subsections, the breadths of people caught on a frame are grabbed and employed for estimating the social distance between the people pairwise. The average human breadth from tricep-to-tricep considered in this paper is 56 cm. As stated in Algorithm 1, the first task is detecting people in a frame using a detection model which produces the bounding box of every person in a frame. From every bounding box, the centroid (C) of a person is determined by using Equation (5), where x and y represent the width and height of each bounding box in picture elements (pixels). This way, a list of all centroids of people in the frame is created. Then, a 2D matrix of interpersonal Euclidean distances of all pair-wise permutations of centroids, where only its upper triangle is considered, is created. Here SciPy, a Python-based ecosystem of open-source software for mathematics, science, and engineering, is employed to efficiently compute the interpersonal distances between the centroids in parallel
In Algorithm 1, once the tuples of centroids have been extracted and all interpersonal euclidean distances have been computed, the pixel-distances are transformed to real-world units using the pixel per metric (PPM) relationship established by means of the average human breadth and the pixel width measurements grabbed from the people on the frame. The relationship is stated in Equation (6).
The algorithm also compares every computed distance in the upper triangle of the euclidean distance with the minimum social distance (2 m or 200 cm) and creates a set of the people who happen to violate the minimum social distance. At last, the algorithm returns the matrix of the interpersonal distances and the number of minimum distance violations.
| Algorithm 1 Interpersonal Distance Estimation |
|
5. Area Estimation Algorithm
Crowd Counting and density calculation using an edge camera are part of crowd management used in real-life for automated public monitoring such as surveillance and traffic control. Besides, knowing how many people attend your event is an important input into event planning and management processes. It plays a key role in the evaluation process. However, the most important application of crowd control is in containing contagious diseases by continuously monitoring the social distancing and density of a crowd coupled with an alerting system.
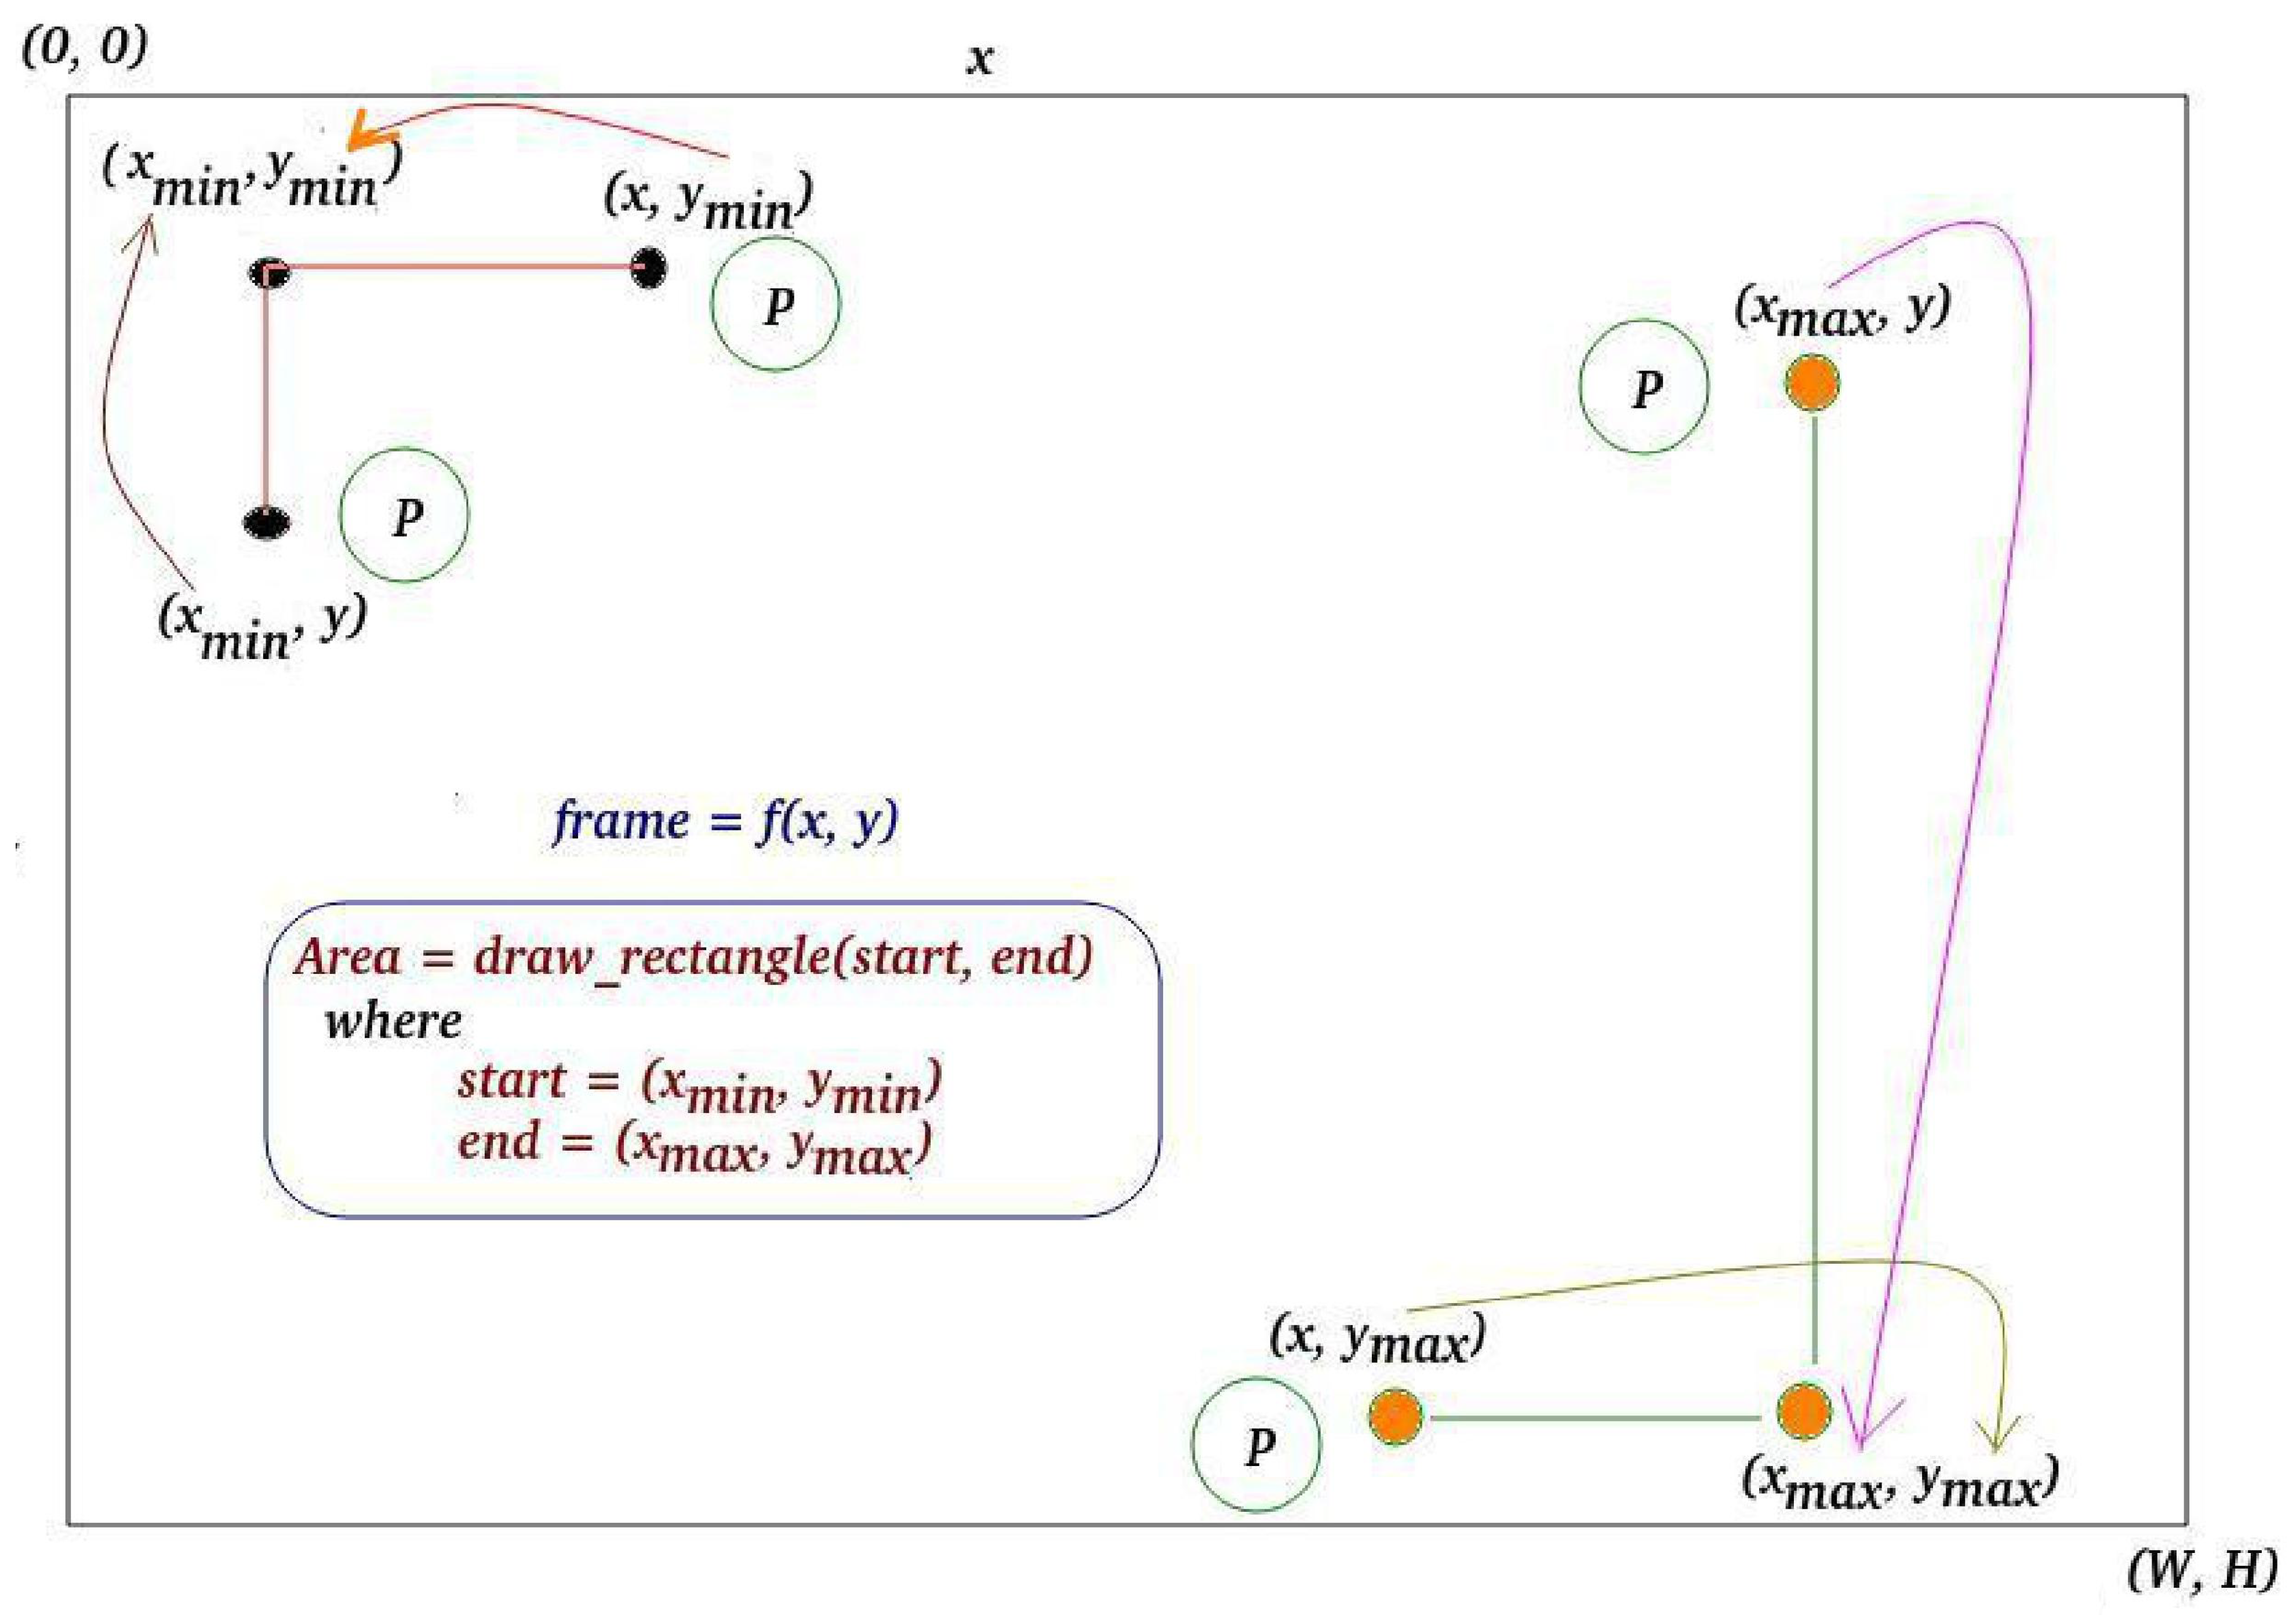
Figure 4 portrays the area occupied by a crowd and estimated based on the the closest and farthest positions of people on a frame with respect to the x and y axes. First, the tuples of human centroids containing the minimum and maximum x and y values are efficiently determined using an itemgetter method from the operator module of python. Then, two new points with coordinates () and () are created, which are used to draw a rectangle around the people.
As described in Algorithm 2, the minimum x and y values as well as the maximum x and y are first obtained from the centroid tuples. Then, they are appropriately altered as to include the entire people in the crowd. If only centroid points are considered for the area estimations, half parts of the people at the peripheries would be counted out. For that reason, a compensation is done by either subtracting or adding times the width of the person at the boundary. The subtraction is performed on the coordinate closer to the origin and the addition operation on the coordinate farthest from the origin (the one closer to the point (W,H) on the frame). Eventually, the algorithm converts the units of the dimensions from pixel to centimeter (cm) using the PPM, where in this case the average of all widths of detected people is employed. This algorithm returns coord1, coord2, the estimated area in squared meter, and the crowd density computed as a ratio of the number of people in a frame to the estimated area. The coord1, and coord2 are used for drawing the estimated area on every video frame which continuously varies depending on the number of people on each frame and their movements.
| Algorithm 2 Estimate Area & Compute Density |
|
6. Experimental Analysis, Results and Discussion
6.1. Experimental Setup
The explanations and analyses of the various experiments carried out in this work are presented in this section. For real-time interpersonal distance estimation, crowd size determination, social distance monitoring, area estimation, and density calculation, Logitech HD Webcam C615 type cameras were employed. The camera creates video frames with a standard size of 720P (1280 × 720 Pixels) and it has a field of view (FOV) of 74 degrees. In an open field of view, a security camera can technically see forever. However, what matters most here is how far away from the camera we can get usable video. Whether or not an object on the frame is readily identifiable or just a featureless blob on the video depends on the size of the subject on the recorded frame/image. The pixel per foot (PPF) or pixel per meter (PPM) is a standard term used by security industry to measure the size of an object on recorded video. It is a measurement of the quality of the final video produced based on the size of the area the video is recording. There are some specifications introduced by a European standard in accordance with the purpose of video surveillance systems. They are known as the Detection, Observation, Recognition, Identification (DORI) zones. In this paper, what we need is the detection and classification of objects. Hence, a minimum of 40 PPF is recommended for this purpose. In order to reproduce results generated in this work, videos must be recorded with any type of camera positioned at a point at least 3 m higher from the ground with its PPF set to at least 40. This guarantees the creation of frames with a quality sufficient for objects monitoring, detection, observation, and classification. The 40 PPF is recommended for best and smooth experience of the output; otherwise, we are also able to successfully process frames with PPF value as low as 25.
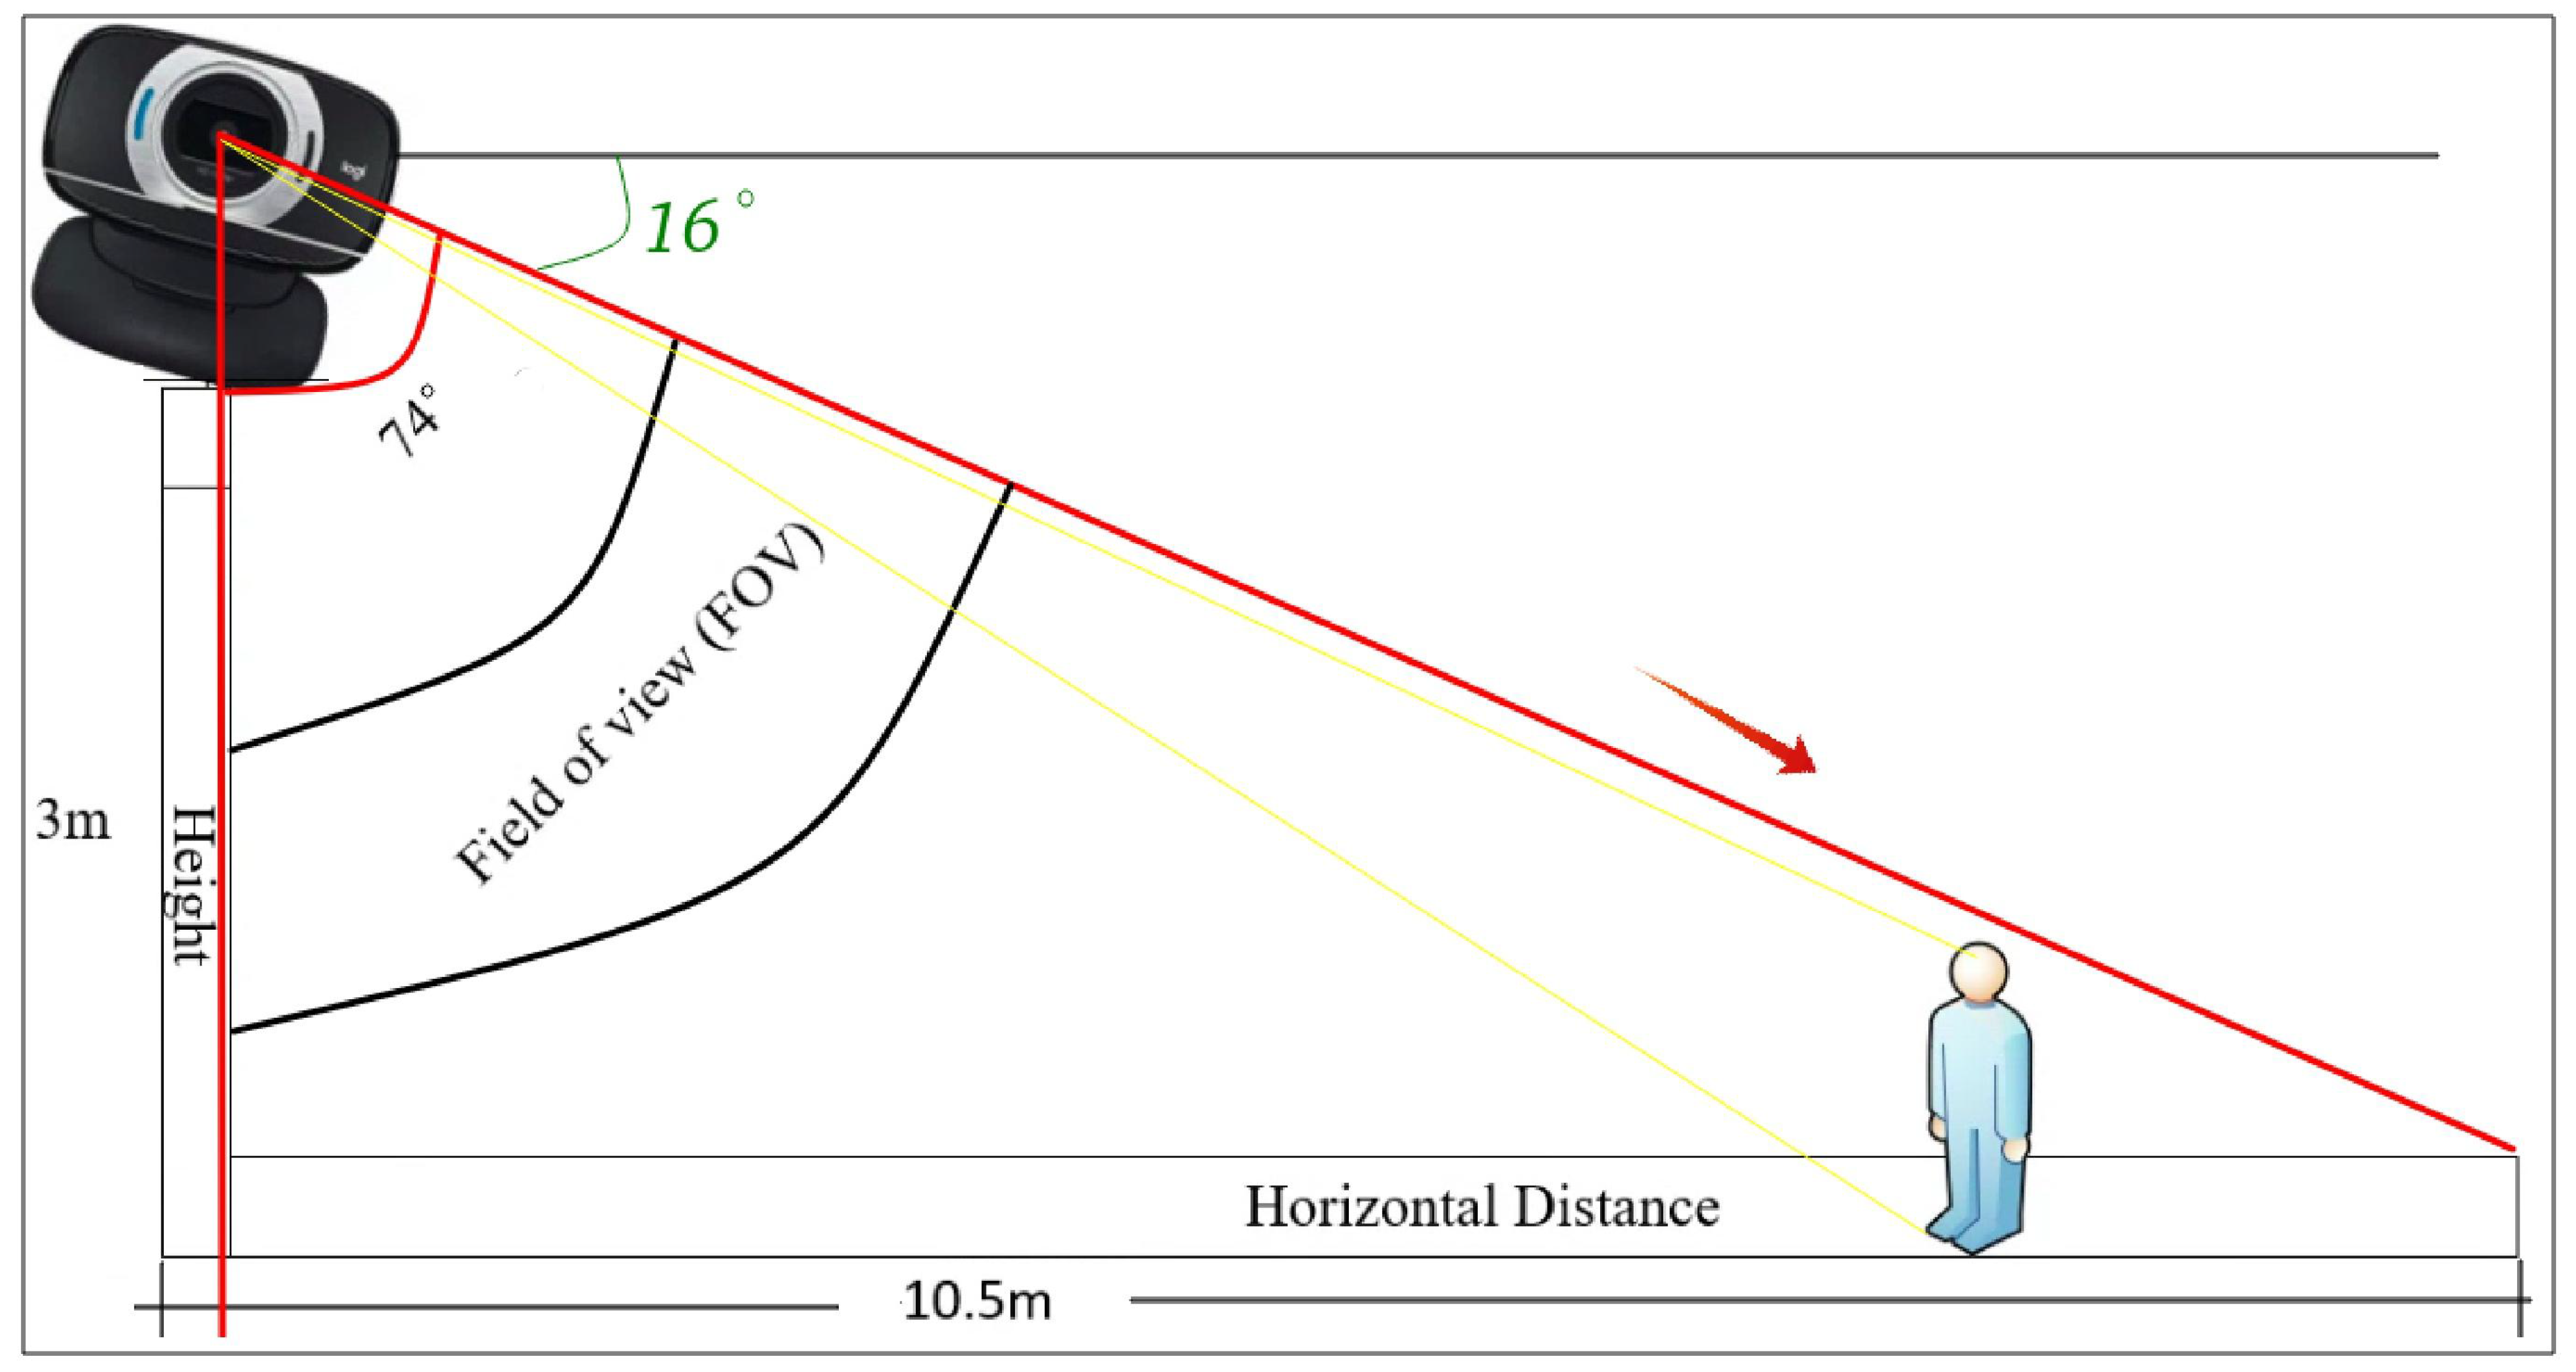
For meaningful video analytics in accordance with a predefined goal, the maximum distance that an object (a human in our case) can be away from the camera depends on the quality of frames the camera can produce. Besides, the height of camera position should be adjusted in accordance with the maximum distance it can meaningfully see. In this work, we employed a 720P camera and the maximum distance a person could be away and classified as a person is 18 m; hence, the height at which this camera is installed should be at least three meters. From a height of three meters, the camera is able to see objects as far as 18 m meaningfully in relation to our goal. In general, cameras need to be installed and configured according to the standard practices in the security industry. The camera position is mostly dictated by the purpose it is expected to serve. If one wants to exclusively surveil a single door, then the camera has to be directly focused close enough onto the door. Likewise, if one’s surveillance purpose is the monitoring of pedestrians that pass by a certain area, then, the camera has to be placed in a higher position so that it will be able see every pedestrian within its meaningful (40 PPF, in our case) FOV, with minimum occlusion. Yet, if one wants to capture an object 100 m away using a powerful camera, they have to set its height so that it can see human objects at 100 m without substantial occlusions. These are the rules of thumb that must be adhered to! Hence, in accordance with standard practices, we carried out our experiments and testing based on the camera setups portrayed in Figure 5 and Figure 6. We employed the first step-up illustrated in Figure 5 when conducting a test on people very close to it, between the point underneath it and about three to four meters forward of it. The farthest object that can be caught on the camera in this configuration is one at 10.5 m from the camera; however, the camera cannot capture the full size of all humans at positions between 4 m and m due to their heights. In the second setup shown in Figure 6, the camera is meant to capture any object positioned forward of a point located at 2 m from the point directly below it. Beyond the 2 m-point mark, the horizon is the limit for the camera’s sight in this configuration. It can see forever or infinitely. However, it cannot see objects located behind the 2 m mark. In addition, due to the PPF requirement set for successful object classification, we recorded our test videos within 15 m from the camera without straying out of its FOV (74 degrees).
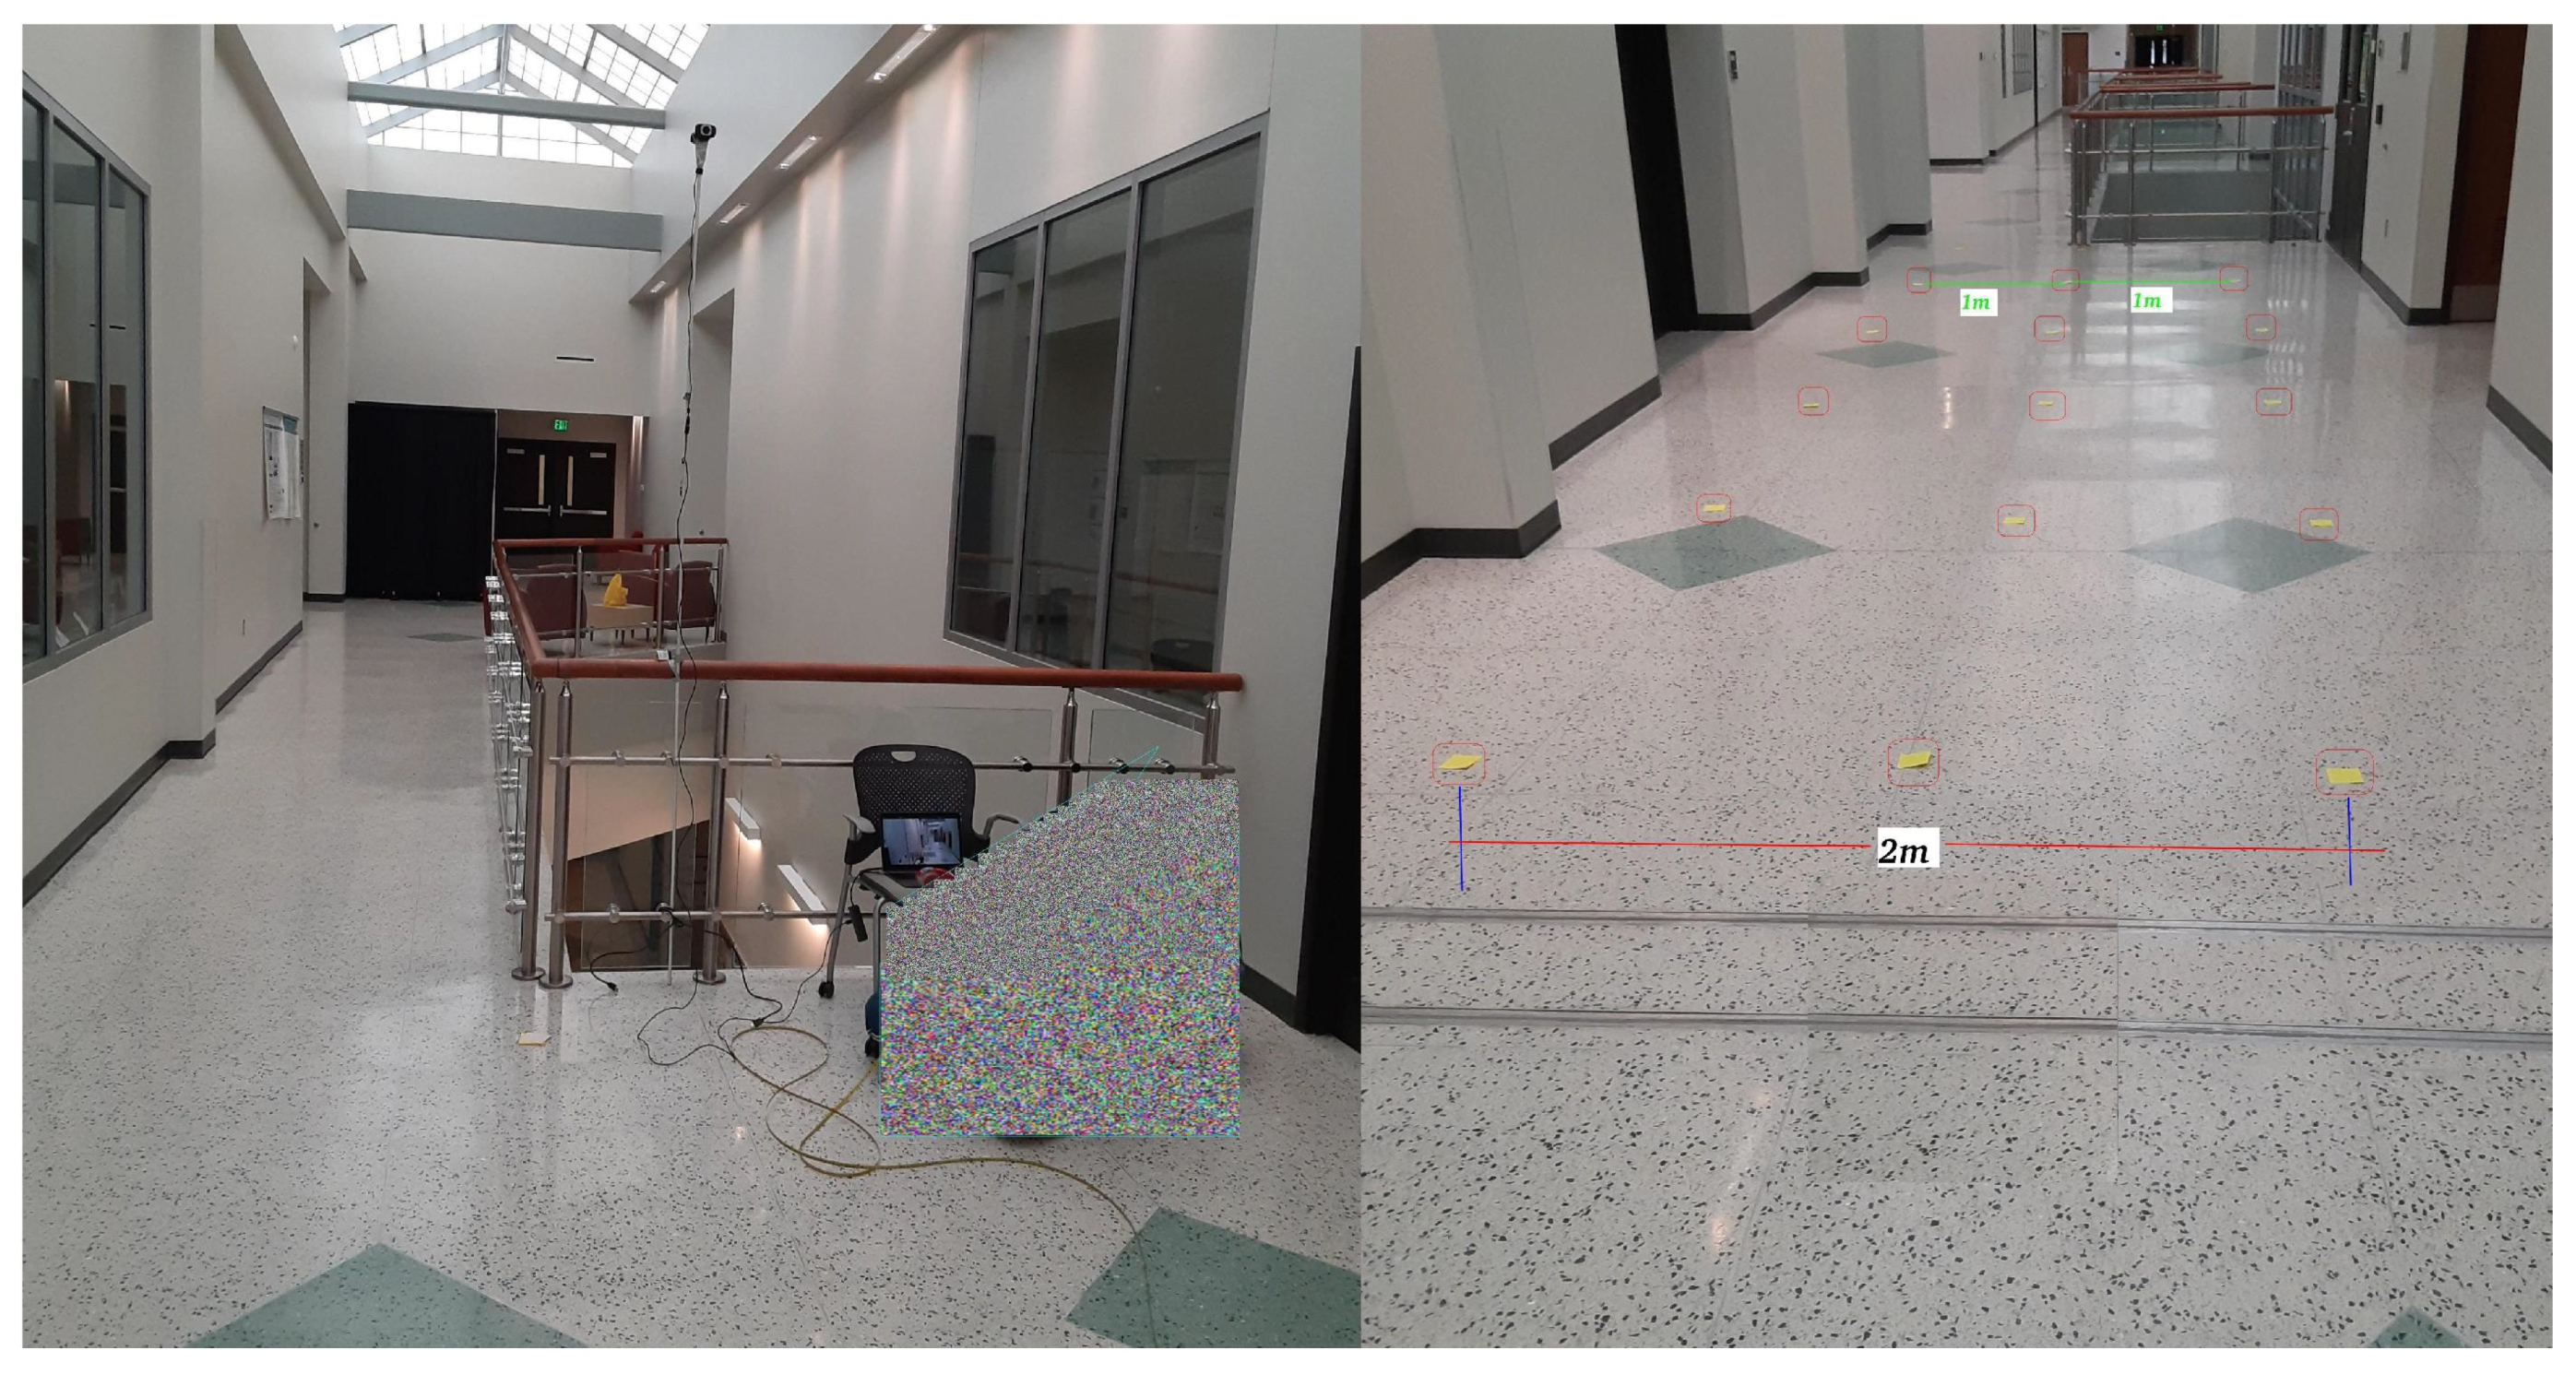
An example of one of our experimental setups is shown in Figure 7. It shows a C615 HD webcam perched on an about 3 m tall pole and seven marked rows within 15 m from it. Every row is marked with three marks where the outermost two marks are two meters apart from each other and the third is midway between them (just a meter away from each side-mark). A virtual server (with 8 vCPUs, and 16 GB RAM) was employed for the processing of the video frames by the using the algorithms proposed in this paper. To successfully and meaningfully run, the proposed solution needs at least a quad-core 2.5 Ghz CPU or equivalent, a minimum memory size of 4 GB, and a minimum storage size of 250 MB. A machine that has these computing resources can process about five frames per second (FPS). However, for instance, if run on a powerful Predator Triton 700-A laptop (has GPU) connected to the edge cameras, it produces an output (slightly greater than 20 FPS) that is as smooth as a fluid flow to our eyes. The implementation is done using Python 3.9.0 multithreading and multiprocessing, where the global interpreter lock (GIL) is disabled. Some of the input video datasets, the complete sets of python codes, and outputs are provided on github [36]. So, anyone interested can download the codes along with the essential files and input video files or they can use their own videos to verify or run our works. The instructions and information provided in the readme file must be read and followed to successfully re-run our work. In a scenario where there is no access to a server, it is highly recommended to run it on a laptop with GPU for a smooth output. The necessary file organization for the experimental analysis and testing of this work is provided in Figure 8 with all details. It is also available on github [36].
6.2. Datasets
For the analysis and testing of the proposed algorithms, we have employed a number of video datasets on top of the datasets we created ourselves. The video datasets we used in this paper include Video Dataset for COVID-19 Social Distancing and Human Detection Validation [37], Pedestrian overpass—original video (sample)—BriefCam Syndex [38], and 5GB videos from PETS 2009 Benchmark Data for crowd surveillance [39].
6.3. Distance Estimation
To experimentally prove that our distance estimation algorithm holds, we created video frames using the setups in Figure 5, Figure 6 and Figure 7. As depicted in Figure 7, we created seven rows of marks with an interval of two meters that span from a point 2 m away from the camera up to a point 15 m away from the camera based on the camera configuration in Figure 6. Likewise, we created three rows of markers starting at the point directly underneath the camera up to a point 6 m away in the forward direction based on the configuration presented in Figure 5. Each row comprises three markers where the pair of the outermost markers are 2 m meter apart from each other. As portrayed in Figure 9, two people walked starting at a point 15 m away from camera to a point 2 m away from the camera while maintaining a gap of at least 2 m. This is just one scenario, many more experiments with scenarios where a pair of people walks with a varying interpersonal distance (0 m to 5 m) were considered. Similar measurements and scenarios were also considered with the camera FOV delimited between a point directly underneath it and a farthest point at m. Then, we made estimations of the social distance between the pair of people based on data collected using a variety of scenarios. The average results show that the gaps were found nearly equal to those physically measured ones. The algorithm was able to compute the gaps with an average accuracy of when the camera is mounted at a point higher than the height of the people.
Hence, this algorithm is designed to work for a camera mounted at point at least 3 m from the level ground and for video frames captured with at least 40 PPF. The accuracy achieved in this work is based on videos captured by cameras with frame standard 720P. However, it can definitely produce similar results for any camera with the proviso that the videos are created in a scenario that meets the requirements (camera should be positioned at least 3 m higher from the ground and the PPF should be at least 40) set. In most cases, the vast majority of cameras (excluding thermal cameras) function like our eyes; if there is an occlusion between them and the target object, they cannot see it. Hence, they have to be positioned at strategic locations in order to gather maximum information about target objects. Otherwise, the whole idea of surveillance and our work might not make any sense at all. For instance, if you position the camera at a height of one meter and try to measure the accuracy of our proposed solution, it will only give good results about the people at the front. Those people behind them will not be clearly captured by the camera. Even if they are captured, it would appear like they are all together; they are some distances away from one another in reality, though. Our proposed solution can perform well on areas where the camera of interest can see well. If the camera gives garbage to our proposed solution; it surely outputs garbage, too.
In Table 1, column three shows the Social Distances between the pair of people at distances 15 m, 13 m, 11 m, 9 m, 7 m, 5 m and 3 m as computed by using the proposed algorithm. These results further validate the algorithm.
6.4. Area Estimation
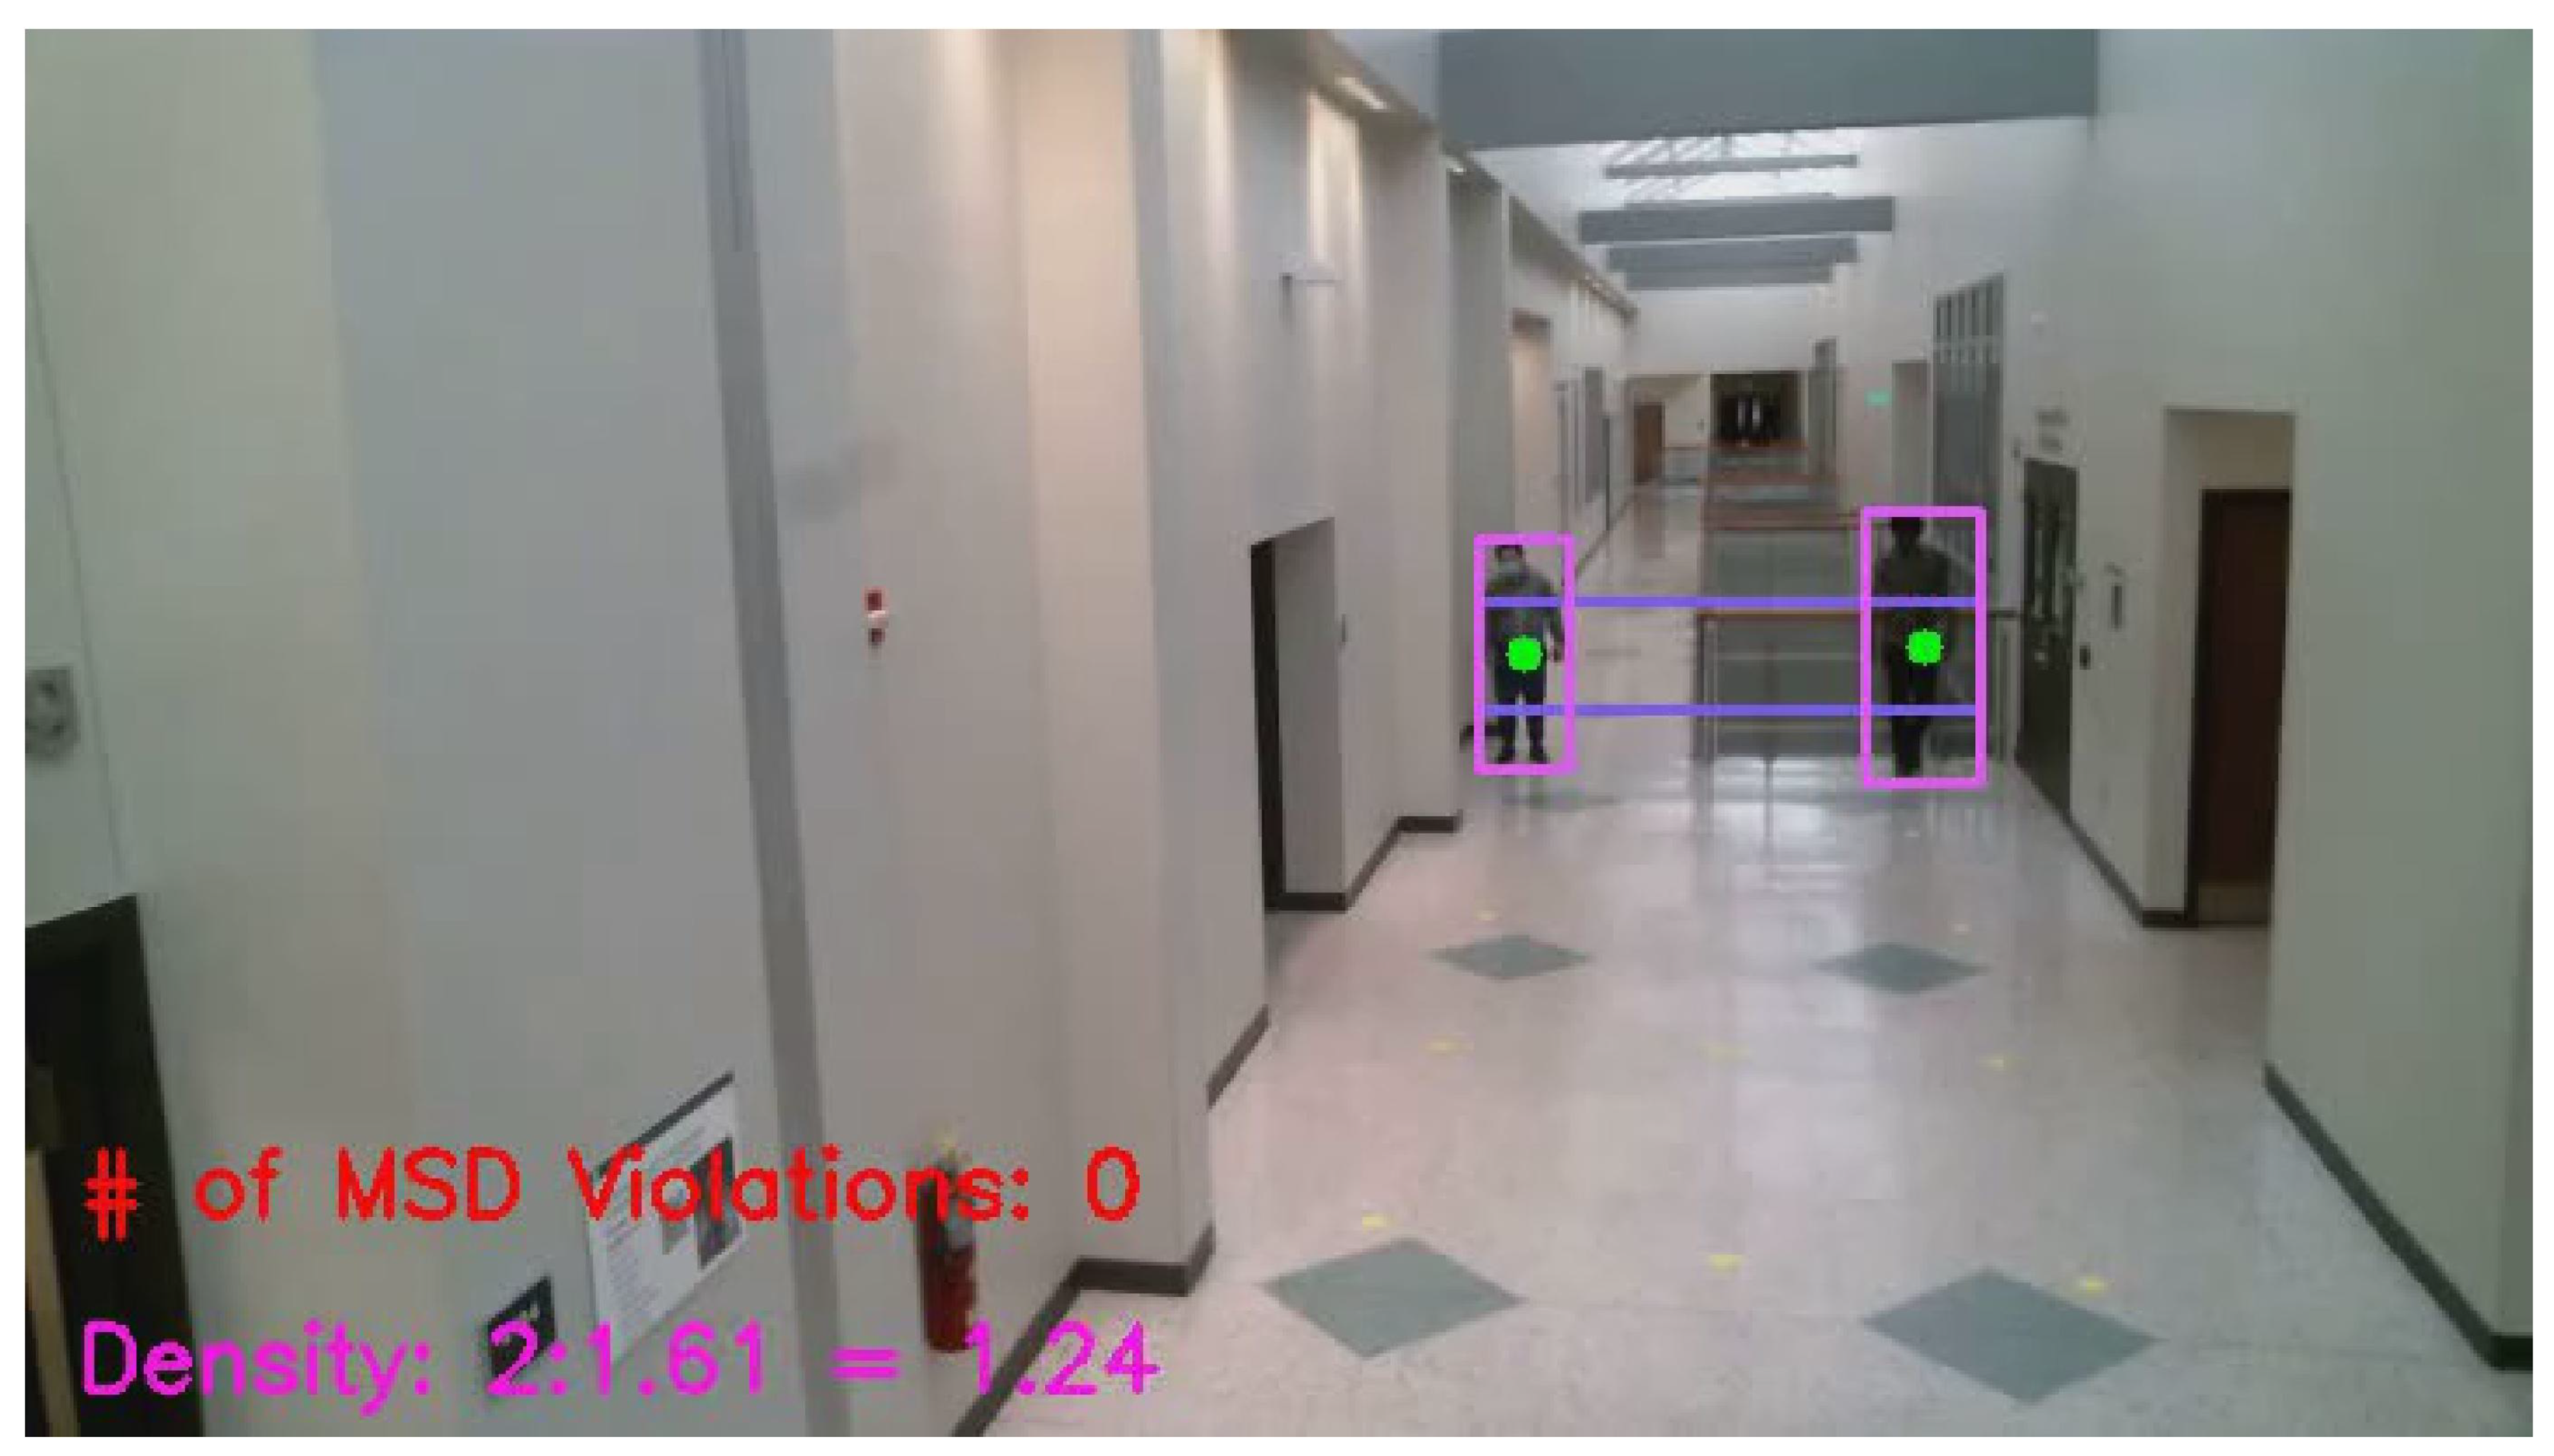
Once again this algorithm holds for an overhead camera or a camera mounted on a point at least 3 m higher from the ground. It can work well within a radius of 25 m (the recommended one is 15 m, though) within its FOV. Figure 10 illustrates the estimation of an area occupied by two people standing 15 m away from a camera. They physically occupy an area of about 1.6 m, which was accurately estimated by the area estimation algorithm to be 1.61 m verifying the validity of the algorithm. In addition, the number of people violating the minimum social distance (2 m or 200 cm), the total number of people in the frame, and crowd density are accurately computed as displayed on the frame shown on Figure 10. People violating the minimum social distance are identified with a red target-symbol on the frames; whereas people obeying social distancing are marked with a green target-symbol on their centroids.
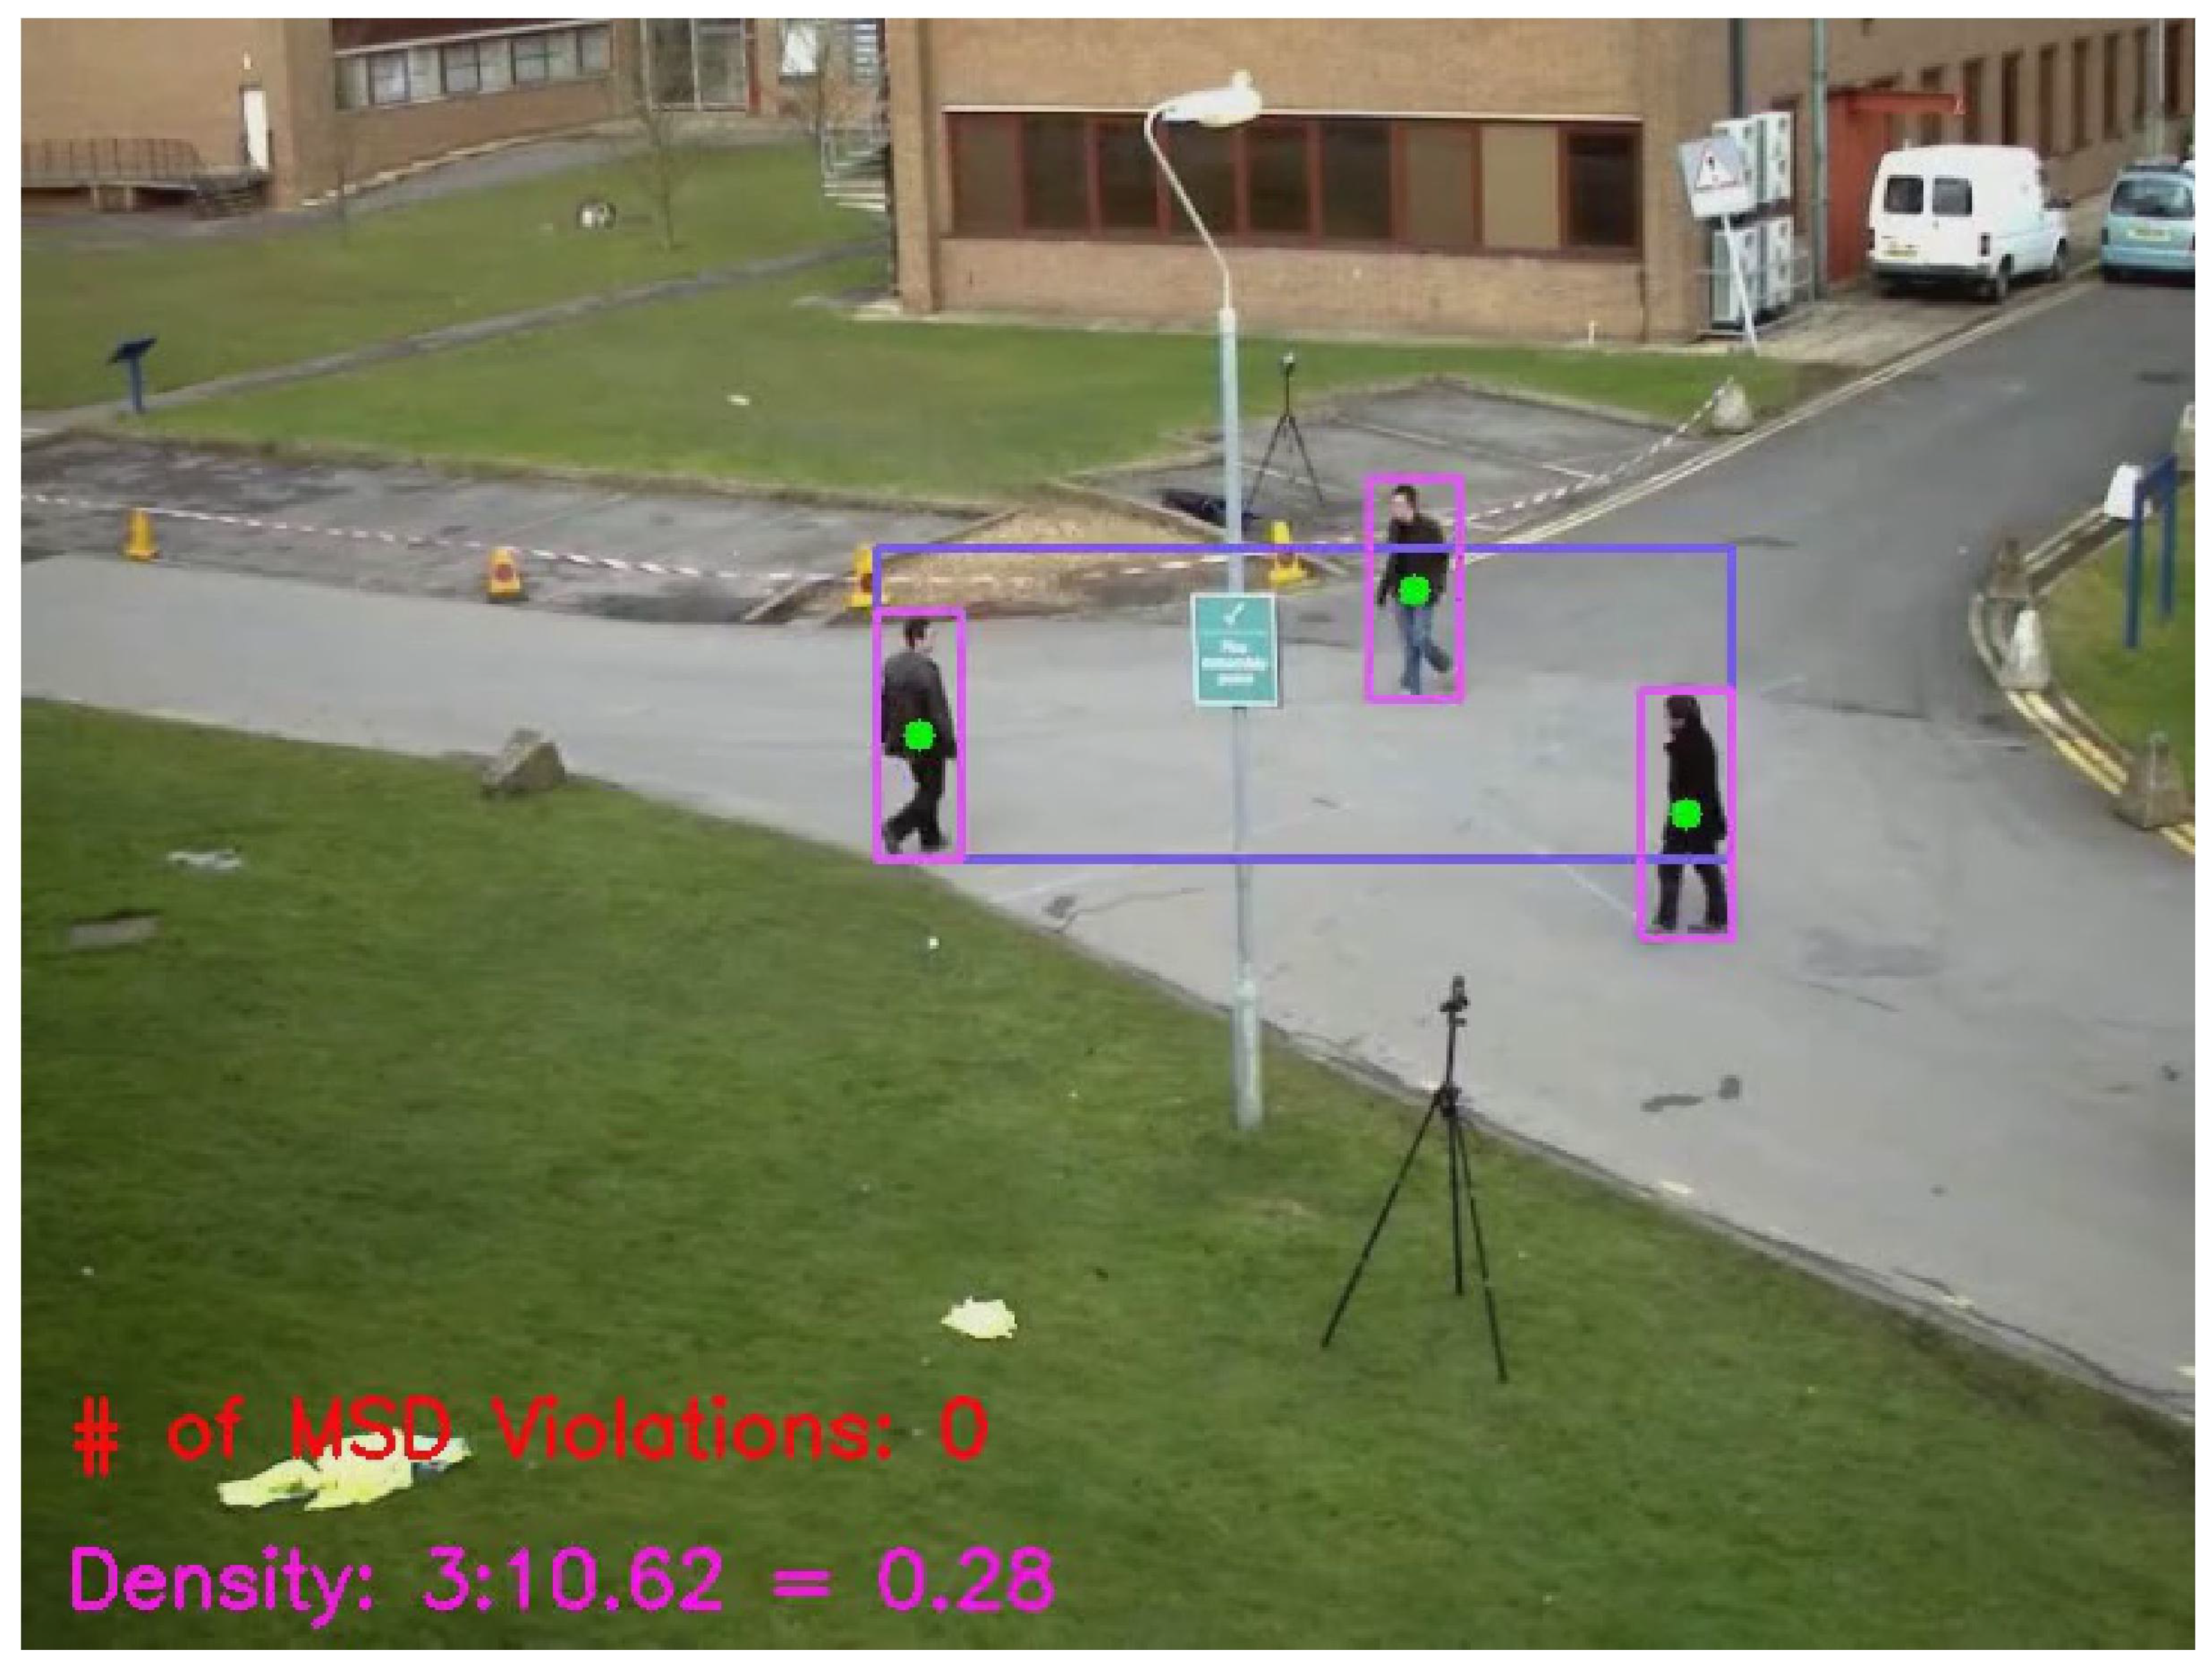
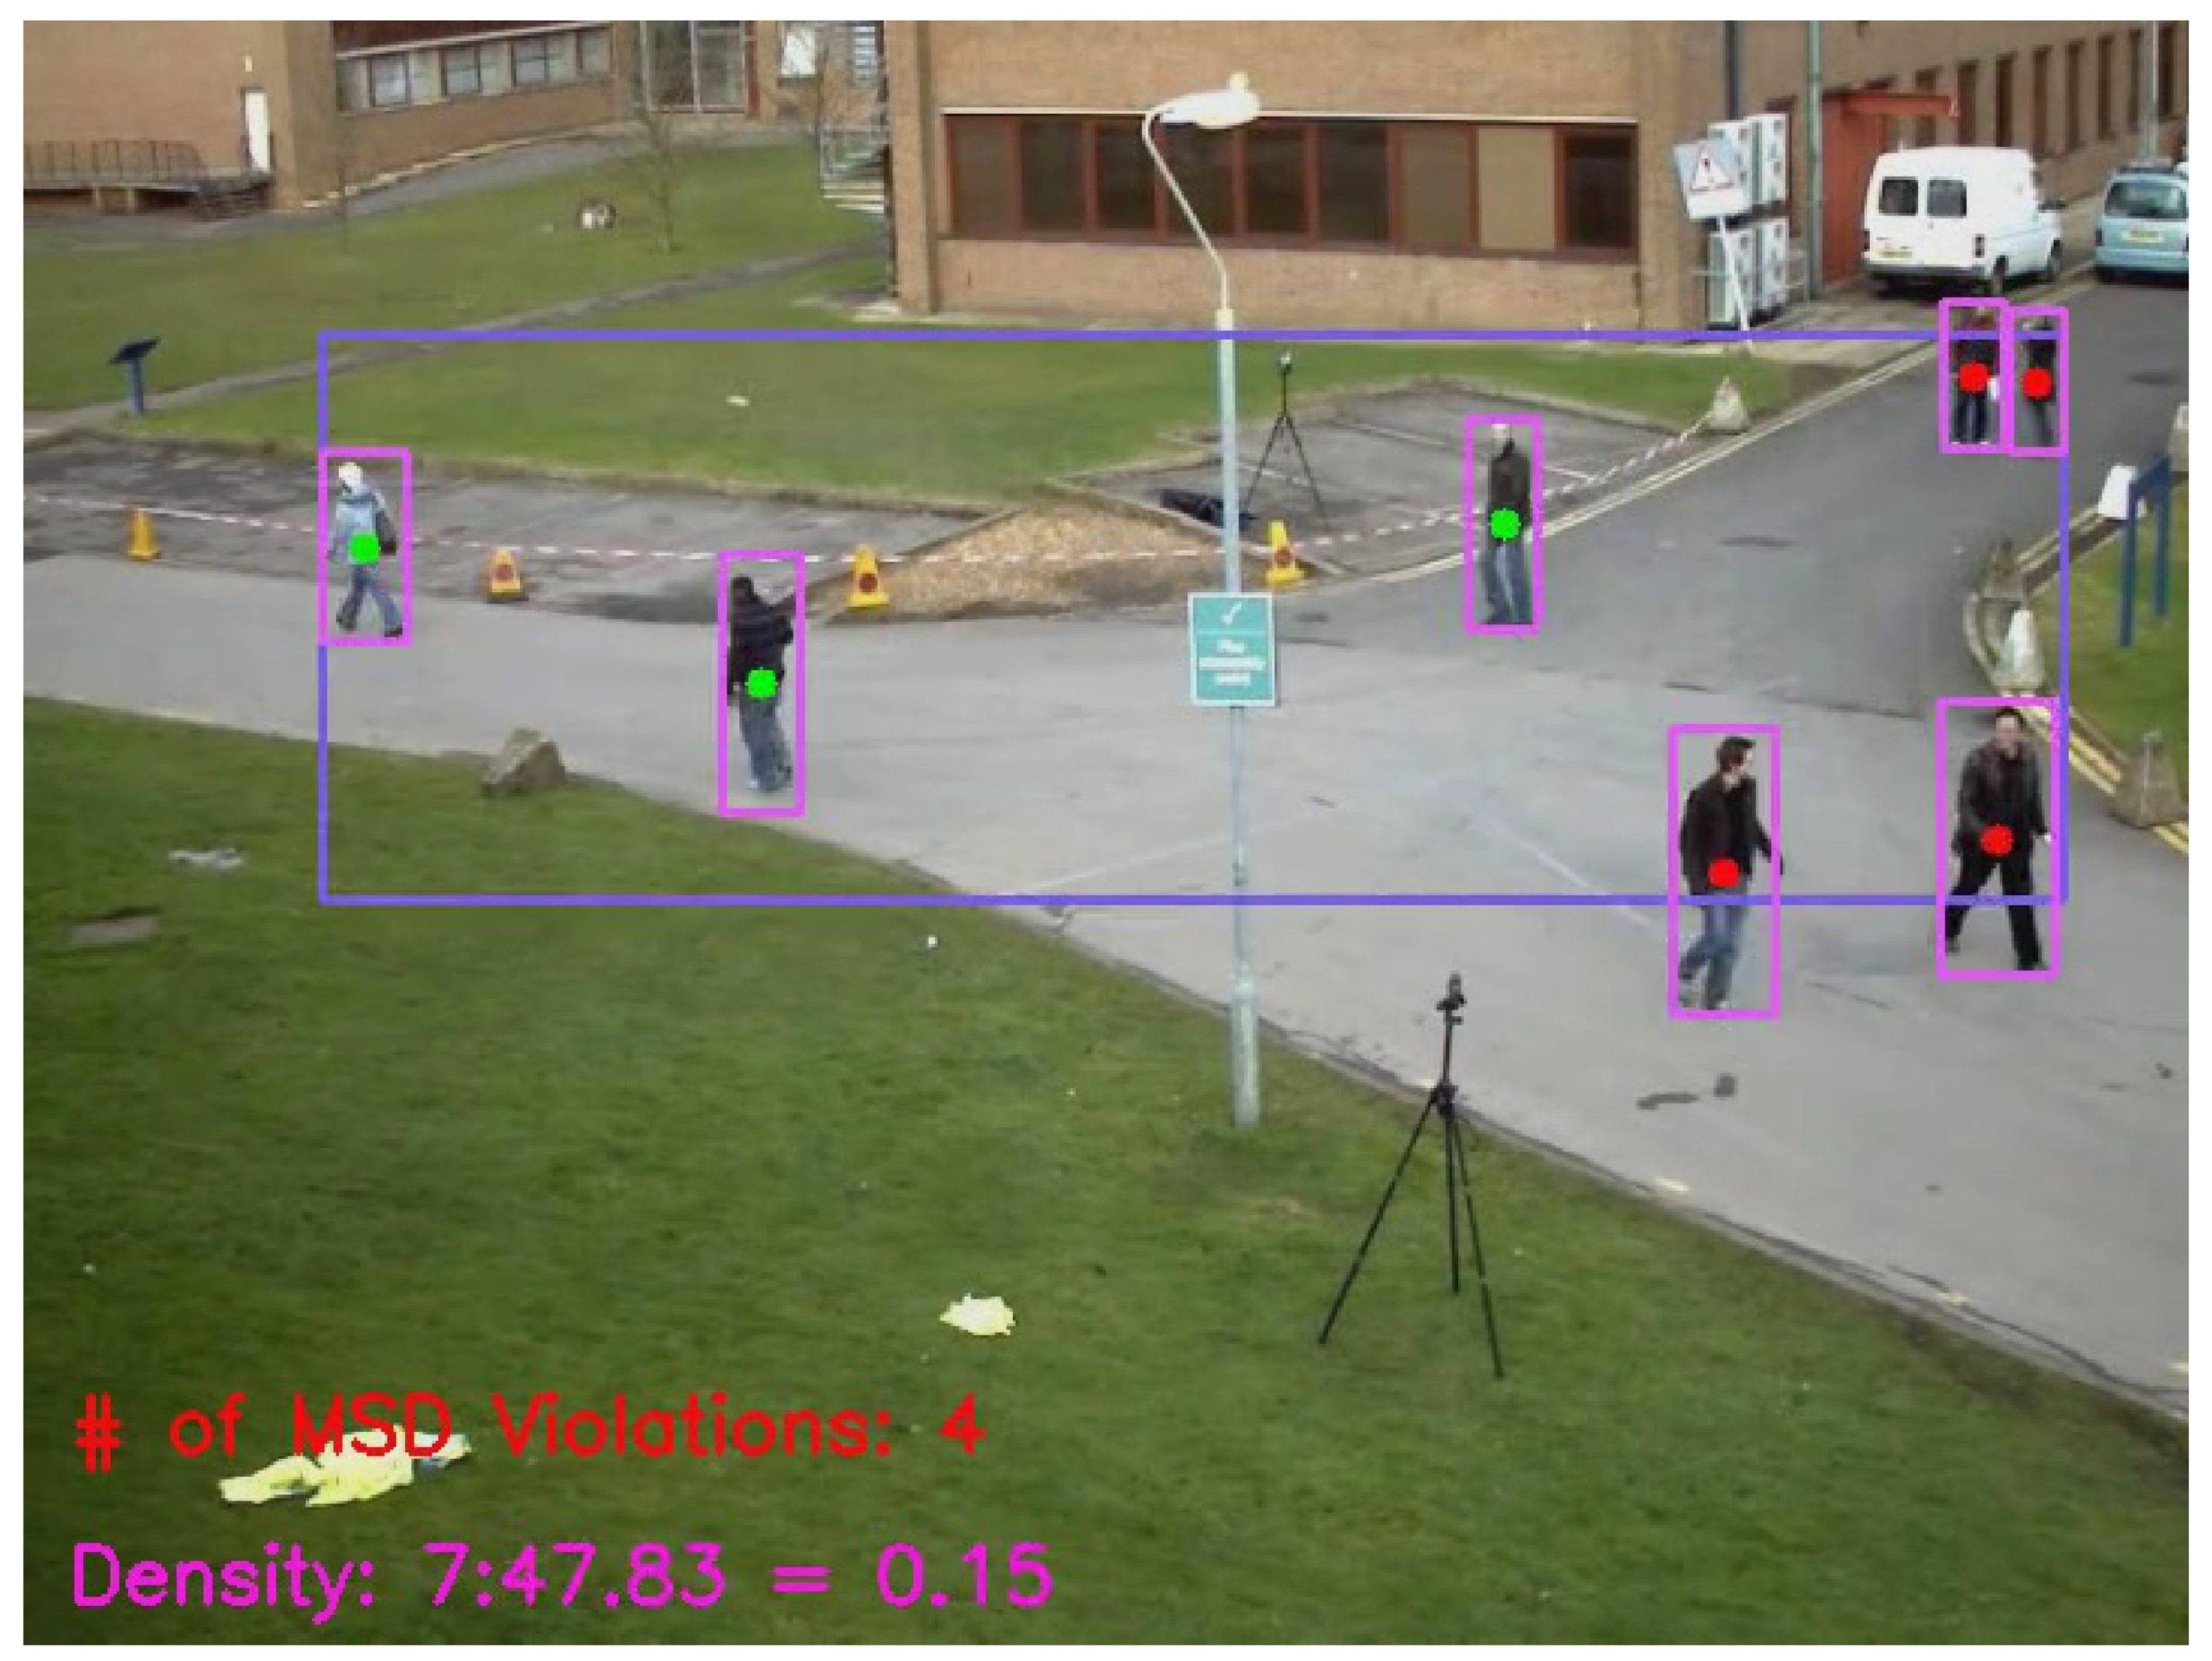
Figure 11, Figure 12 and Figure 13 also demonstrate the estimation of areas, detection and identification of social distance violating people on a frame, counting of the total number of people in a crowd caught by a camera in a frame, and the calculation of the crowd density. All the results prove that the area estimation algorithm works well for cameras positioned at points well taller than the height of people caught on camera. For instance, on Figure 11, 13 people are detected out of whom ten are violating the minimum social distance on an estimated area of 92 squared meter, where the density is 0.14. On Figure 12, there are only three people on a total estimated area of 10.62 m, with a density of . Here, there is no violation of minimum distances. Lastly, a total of seven people are detected on an estimated area of 47.83 m (with a density of ) as portrayed in Figure 13. Out of the seven people, three are violating the minimum social distance. Those with red-target-symbol on their centroid are the ones violating the minimum social distancing.
6.5. Discussion
As clearly stated in the related works section, all researches on social distancing published to-date focus on object detection with no regard to the major works of interpersonal distance and area estimation. In this work, we put in a lot of efforts and focus on the design, development and implementation of corroborated distance and area estimation algorithms using a single-edge camera. The results of analyses of experiments that we carried out on live video streams caught by our lab cameras and on a number of preexisting video datasets including 1 m and 2 m videos [37], Pedestrian overpass dataset [38], and 5 GB videos from PETS [39] solidly verify our proposed algorithms for distance and area estimation. Especially when the CCTV cameras are mounted on walls or perched on poles at least three meters tall, E-SEC scheme is able to estimate distance and area with an accuracy greater than . These E-SEC algorithms play very pronounced roles in improving crowd surveillance. On top of enabling easier management of social distancing and crowd density to contain the spread of a contagious disease, E-SEC scheme could be employed for people traffic management and evaluation processes. For example, the unified model can count the number of people entering a room and it can recommend newly arriving people to move to another room once the maximum occupancy is reached.
For better performance and more accurate results, the CCTV cameras must be mounted or perched at points well higher than the heights of humans in accordance with the good practices of video surveillance systems. They should be deployed at least at a height of 3 m from the ground for a 720P camera for the purpose of classification of objects on video frames. The height should be proportional to the farthest object the camera can meaningfully see. Otherwise, the accuracy of the proposed scheme will deteriorate. Besides, all objects on a frame should be caught with an image quality of 40 PPF.
7. Conclusions
Crowd management through the determination of their size, interpersonal distance, occupied area, and density play very important role in stymieing the spread of infectious viral diseases, automated surveillance and traffic control, and event planning and management processes. Therefore, this paper proposes a unified E-SEC framework for the the estimation of interpersonal distances and area occupied by a crowd caught on a single camera. The unified model is capable of estimating the distance between a pair of people, approximating the area occupied by a crowd, determining people violating social distancing, counting the total number of people in a frame, and computing the crowd density. To the best of our knowledge, E-SEC is the first of its kind that proposes algorithms for the estimation of interpersonal distance between two dynamic people and an area occupied by a crowd that varies both in size and movement dynamically using a single camera. The extensive experimental analyses carried out based on a wide range of video datasets prove the validity and accuracy of E-SEC framework for videos captured by edge-cameras mounted at points three or more meters higher from the ground. All camera installations and configurations are performed in accordance with the standard security industry practices.
Author Contributions
Conceptualization, A.F., Y.C. and H.S.; methodology, A.F., Y.C. and H.S.; software, A.F.; validation, A.F., Y.C. and H.S.; formal analysis, A.F.; investigation, A.F. and H.S.; resources, Y.C. and R.H.; data curation, A.F. and H.S.; writing—original draft preparation, A.F. and H.S.; writing—review and editing, Y.C. and R.H.; visualization, A.F.; supervision, Y.C.; project administration, Y.C. and R.H.; funding acquisition, Y.C. All authors have read and agreed to the published version of the manuscript.
Funding
This research was funded by U.S. Air Force Research Laboratory under grant FA8649-20-C-0243.
Institutional Review Board Statement
Not Applicable.
Informed Consent Statement
Not Applicable.
Conflicts of Interest
The authors declare no conflict of interest. The views and conclusions contained herein are those of the authors and should not be interpreted as necessarily representing the official policies or endorsements, either expressed or implied, of their institutions.
Abbreviations
The following abbreviations are used in this manuscript:
| AI | Artificial Intelligence |
| CAN | Campus Area Network |
| CCTV | Closed-Circuit Television |
| CDC | Centers for Disease Control |
| COVID-19 | Coronavirus Disease of 2019 |
| DML | Deep Machine Learning |
| DORI | Detection, Observation, Monitoring, and Identification |
| E2E | End-to-End |
| GIL | Global Interpreter Lock (python) |
| GPS | Global Positioning System |
| HD | High Definition |
| IIoT | Internet of Industrial of Things |
| IT | Information Technology |
| OID | Open Image frontal view Dataset |
| PPF | Pixel Per Foot |
| PPM | Pixel Per Meter |
| PPM | Pixel Per Metric |
| RCNN | Region Based Convolutional Neural Networks |
| SD | Social Distancing |
| SSD | Single-Shot Detection |
| VSS | Video Surveillance Systems |
| WAN | Wide Area Network |
| YOLOv3 | You Look Only Once version 03 |
References
- Altawy, R.; Youssef, A.M. Security, privacy, and safety aspects of civilian drones: A survey. ACM Trans. Cyber-Phys. Syst. 2017, 1, 7. [Google Scholar] [CrossRef]
- Birnstill, P. Privacy-Respecting Smart Video Surveillance Based on Usage Control Enforcement; KIT Scientific Publishing: Karlsruhe, Germany, 2016; Volume 25. [Google Scholar]
- Cavallaro, A. Privacy in video surveillance [in the spotlight]. IEEE Signal Process. Mag. 2007, 2, 166–168. [Google Scholar] [CrossRef]
- Fitwi, A.; Chen, Y. Secure and Privacy-Preserving Stored Surveillance Video Sharing atop Permissioned Blockchain. arXiv 2021, arXiv:2104.05617. [Google Scholar]
- Fitwi, A.; Chen, Y.; Zhu, S. No peeking through my windows: Conserving privacy in personal drones. In Proceedings of the 2019 IEEE International Smart Cities Conference (ISC2), Casablanca, Morocco, 14–17 October 2019; pp. 199–204. [Google Scholar]
- Fitwi, A.; Chen, Y.; Zhu, S.; Blasch, E.; Chen, G. Privacy-Preserving Surveillance as an Edge Service Based on Lightweight Video Protection Schemes Using Face De-Identification and Window Masking. Electronics 2021, 10, 236. [Google Scholar] [CrossRef]
- Lin, L.; Purnell, N. A World With a Billion Cameras Watching You Is Just Around the Corner. Wall Str. J. 2019. Available online: https://www.wsj.com/articles/a-billion-surveillance-cameras-forecast-to-be-watching-within-two-years-11575565402 (accessed on 10 May 2021).
- Xu, R.; Nikouei, S.Y.; Nagothu, D.; Fitwi, A.; Chen, Y. Blendsps: A blockchain-enabled decentralized smart public safety system. Smart Cities 2020, 3, 47. [Google Scholar] [CrossRef]
- Fitwi, A.; Chen, Y. Privacy-Preserving Selective Video Surveillance. In Proceedings of the 2020 29th International Conference on Computer Communications and Networks (ICCCN), Honolulu, HI, USA, 3–6 August 2020; pp. 1–10. [Google Scholar]
- Fitwi, A.; Chen, Y.; Zhu, S. PriSE: Slenderized Privacy-Preserving Surveillance as an Edge Service. In Proceedings of the 2020 IEEE 6th International Conference on Collaboration and Internet Computing (CIC), Virtual Conference, Atlanta, GA, USA, 1–3 December 2020; pp. 125–134. [Google Scholar]
- Fitwi, A.; Yuan, M.; Nikouei, S.Y.; Chen, Y. Minor privacy protection by real-time children identification and face scrambling at the edge. EAI Endorsed Trans. Secur. Saf. 2020. submitted. [Google Scholar] [CrossRef]
- Fitwi, A.; Chen, Y.; Zhu, S. A lightweight blockchain-based privacy protection for smart surveillance at the edge. In Proceedings of the 2019 IEEE International Conference on Blockchain (Blockchain), Atlanta, GA, USA, 14–17 July 2019; pp. 552–555. [Google Scholar]
- Fitwi, A.H.; Nagothu, D.; Chen, Y.; Blasch, E. A distributed agent-based framework for a constellation of drones in a military operation. In Proceedings of the 2019 Winter Simulation Conference (WSC), National Harbor, MD, USA, 8–11 December 2019; pp. 2548–2559. [Google Scholar]
- Mali, D.; Hadush, A. Home Monitoring System using wireless Sensor Network via Internet. Technia 2014, 7, 11014. [Google Scholar]
- Yuan, M.; Nikouei, S.Y.; Fitwi, A.; Chen, Y.; Dong, Y. Minor Privacy Protection Through Real-time Video Processing at the Edge. arXiv 2020, arXiv:2005.01178. [Google Scholar]
- Ainslie, K.E.; Walters, C.E.; Fu, H.; Bhatia, S.; Wang, H.; Xi, X.; Baguelin, M.; Bhatt, S.; Boonyasiri, A.; Boyd, O.; et al. Evidence of initial success for China exiting COVID-19 social distancing policy after achieving containment. Wellcome Open Res. 2020, 5. [Google Scholar] [CrossRef]
- Prem, K.; Liu, Y.; Russell, T.W.; Kucharski, A.J.; Eggo, R.M.; Davies, N.; Flasche, S.; Clifford, S.; Pearson, C.A.; Munday, J.D.; et al. The effect of control strategies to reduce social mixing on outcomes of the COVID-19 epidemic in Wuhan, China: A modelling study. Lancet Public Health 2020, 5, e261–e270. [Google Scholar] [CrossRef] [Green Version]
- Nguyen, C.T.; Saputra, Y.M.; Van Huynh, N.; Nguyen, N.T.; Khoa, T.V.; Tuan, B.M.; Nguyen, D.N.; Hoang, D.T.; Vu, T.X.; Dutkiewicz, E.; et al. Enabling and emerging technologies for social distancing: A comprehensive survey and open problems. arXiv 2020, arXiv:2005.02816. [Google Scholar]
- Fitwi, A.; Chen, Y.; Zhou, N. An agent-administrator-based security mechanism for distributed sensors and drones for smart grid monitoring. In Proceedings of the Signal Processing, Sensor/Information Fusion, and Target Recognition XXVIII. International Society for Optics and Photonics, Baltimore, MD, USA, 14–18 April 2019; Volume 11018, p. 110180L. [Google Scholar]
- Harvey, A.; LaPlace, J. MegaPixels: Origins, ethics, and privacy implications of publicly available face recognition image datasets. Megapixels 2019. [Google Scholar]
- Robakowska, M.; Tyranska-Fobke, A.; Nowak, J.; Slezak, D.; Zuratynski, P.; Robakowski, P.; Nadolny, K.; Ładny, J.R. The use of drones during mass events. Disaster Emerg. Med. J. 2017, 2, 129–134. [Google Scholar] [CrossRef] [Green Version]
- Vamathevan, J.; Clark, D.; Czodrowski, P.; Dunham, I.; Ferran, E.; Lee, G.; Li, B.; Madabhushi, A.; Shah, P.; Spitzer, M.; et al. Applications of machine learning in drug discovery and development. Nat. Rev. Drug Discov. 2019, 18, 463–477. [Google Scholar] [CrossRef]
- Yekun, E.A.; Fitwi, A.H.; Selvi, S.K.; Kumar, A. Short-term Wind Speed Forecasting based on LSSVM Optimized by Elitist QPSO. arXiv 2020, arXiv:2010.07757. [Google Scholar]
- Fitwi, A.; Yang, Z.; Chen, Y.; Lin, X. Smart grids enabled by edge computing. In Edge Computing: Models, Technologies and Applications; Taheri, J., Deng, S., Eds.; The Institution of Engineering and Technology (IET): London, UK, 2020; e-ISBN 978-1785619410. [Google Scholar]
- Redmon, J.; Farhadi, A. Yolov3: An incremental improvement. arXiv 2018, arXiv:1804.02767. [Google Scholar]
- Punn, N.S.; Sonbhadra, S.K.; Agarwal, S. COVID-19 epidemic analysis using machine learning and deep learning algorithms. MedRxiv 2020. [Google Scholar] [CrossRef] [Green Version]
- Ren, S.; He, K.; Girshick, R.; Sun, J. Faster r-cnn: Towards real-time object detection with region proposal networks. Adv. Neural Inf. Process. Syst. 2015, 28, 91–99. [Google Scholar] [CrossRef] [PubMed] [Green Version]
- Liu, W.; Anguelov, D.; Erhan, D.; Szegedy, C.; Reed, S.; Fu, C.Y.; Berg, A.C. Ssd: Single shot multibox detector. In Proceedings of the European Conference on Computer Vision, Amsterdam, The Netherlands, 8–16 October 2016; Springer: Berlin/Heidelberg, Germany, 2016; pp. 21–37. [Google Scholar]
- Ramadass, L.; Arunachalam, S.; Sagayasree, Z. Applying deep learning algorithm to maintain social distance in public place through drone technology. Int. J. Pervasive Comput. Commun. 2020, 16, 223–234. [Google Scholar] [CrossRef]
- Sathyamoorthy, A.J.; Patel, U.; Savle, Y.A.; Paul, M.; Manocha, D. COVID-robot: Monitoring social distancing constraints in crowded scenarios. arXiv 2020, arXiv:2008.06585. [Google Scholar]
- Ahmed, I.; Ahmad, M.; Rodrigues, J.J.; Jeon, G.; Din, S. A deep learning-based social distance monitoring framework for COVID-19. Sustain. Cities Soc. 2021, 65, 102571. [Google Scholar] [CrossRef] [PubMed]
- Candela, L. Geometric Optics: Thin Lenses and Ray Tracing. 2021. Available online: ttps://courses.lumenlearning.com/boundless-physics/chapter/lenses/ (accessed on 10 May 2021).
- Fulton, W. Calculate Distance or Size of an Object in a Photo Image. 2021. Available online: https://www.scantips.com/lights/subjectdistance.html (accessed on 10 May 2021).
- Fitwi, A.; Chen, Y.; Zhu, S. Lightweight Frame Scrambling Mechanisms for End-to-End Privacy in Edge Smart Surveillance. TechRxiv. 2021. Available online: https://www.techrxiv.org/articles/preprint/Lightweight_Frame_Scrambling_Mechanisms_for_End-to-End_Privacy_in_Edge_Smart_Surveillance/14402504 (accessed on 10 May 2021).
- Max Roser, C.A.; Ritchie, H. Human Height. Our World in Data. 2013. Available online: https://ourworldindata.org/human-height (accessed on 10 May 2021).
- Fitwi, A. A Unified Model for Estimating Interpersonal Distance and Crowd Density Using an Edge Camera. github. 2021. Available online: https://github.com/ahfitwi/SDProject2021 (accessed on 20 September 2021).
- Khan, W.; Nawaz, F.; Hussain, A. Video Dataset for COVID-19 Social Distancing and Human Detection Validation. ELSEVIER. 2020. Available online: https://data.mendeley.com/datasets/xh6m6gxhvj/1 (accessed on 20 April 2021).
- BriefCam. Pedestrian Overpass-Original Video (Sample)-BriefCam Syndex. Youtube. 2014. Available online: https://www.youtube.com/watch?v=aUdKzb4LGJI (accessed on 3 May 2021).
- Ferryman, J.; Shahrokni, A. Pets2009: Dataset and challenge. In Proceedings of the 2009 Twelfth IEEE International Workshop on Performance Evaluation of Tracking and Surveillance, Snowbird, UT, USA, 7–9 December 2009; pp. 1–6. [Google Scholar]
Figure 1.
Cloud-based Architecture of Video Surveillance System Comprising Cloud Servers, Surveillance Operation Center, Communication Channel, and Edge-cameras.
Figure 1.
Cloud-based Architecture of Video Surveillance System Comprising Cloud Servers, Surveillance Operation Center, Communication Channel, and Edge-cameras.

Figure 2.
Unified E-SEC Model for Human Detection and Estimation of Interpersonal Distance, Number of Social Distance (SD) Violations, Area, and Crowd Density.
Figure 2.
Unified E-SEC Model for Human Detection and Estimation of Interpersonal Distance, Number of Social Distance (SD) Violations, Area, and Crowd Density.

Figure 3.
Geometrical relationship between actual and virtual human dimensions.

Figure 4.
Rectangular estimation of an area occupied by a crowd.

Figure 5.
A camera configured to see areas forward of the point directly below it up to a distance of 10.5 m.
Figure 5.
A camera configured to see areas forward of the point directly below it up to a distance of 10.5 m.

Figure 6.
A camera setup to see areas forward of a mark at 2 m from the point directly below it up to infinity.
Figure 6.
A camera setup to see areas forward of a mark at 2 m from the point directly below it up to infinity.

Figure 7.
Experimental Setup for obtaining relationship between widths of people and corresponding interpersonal distances.
Figure 7.
Experimental Setup for obtaining relationship between widths of people and corresponding interpersonal distances.

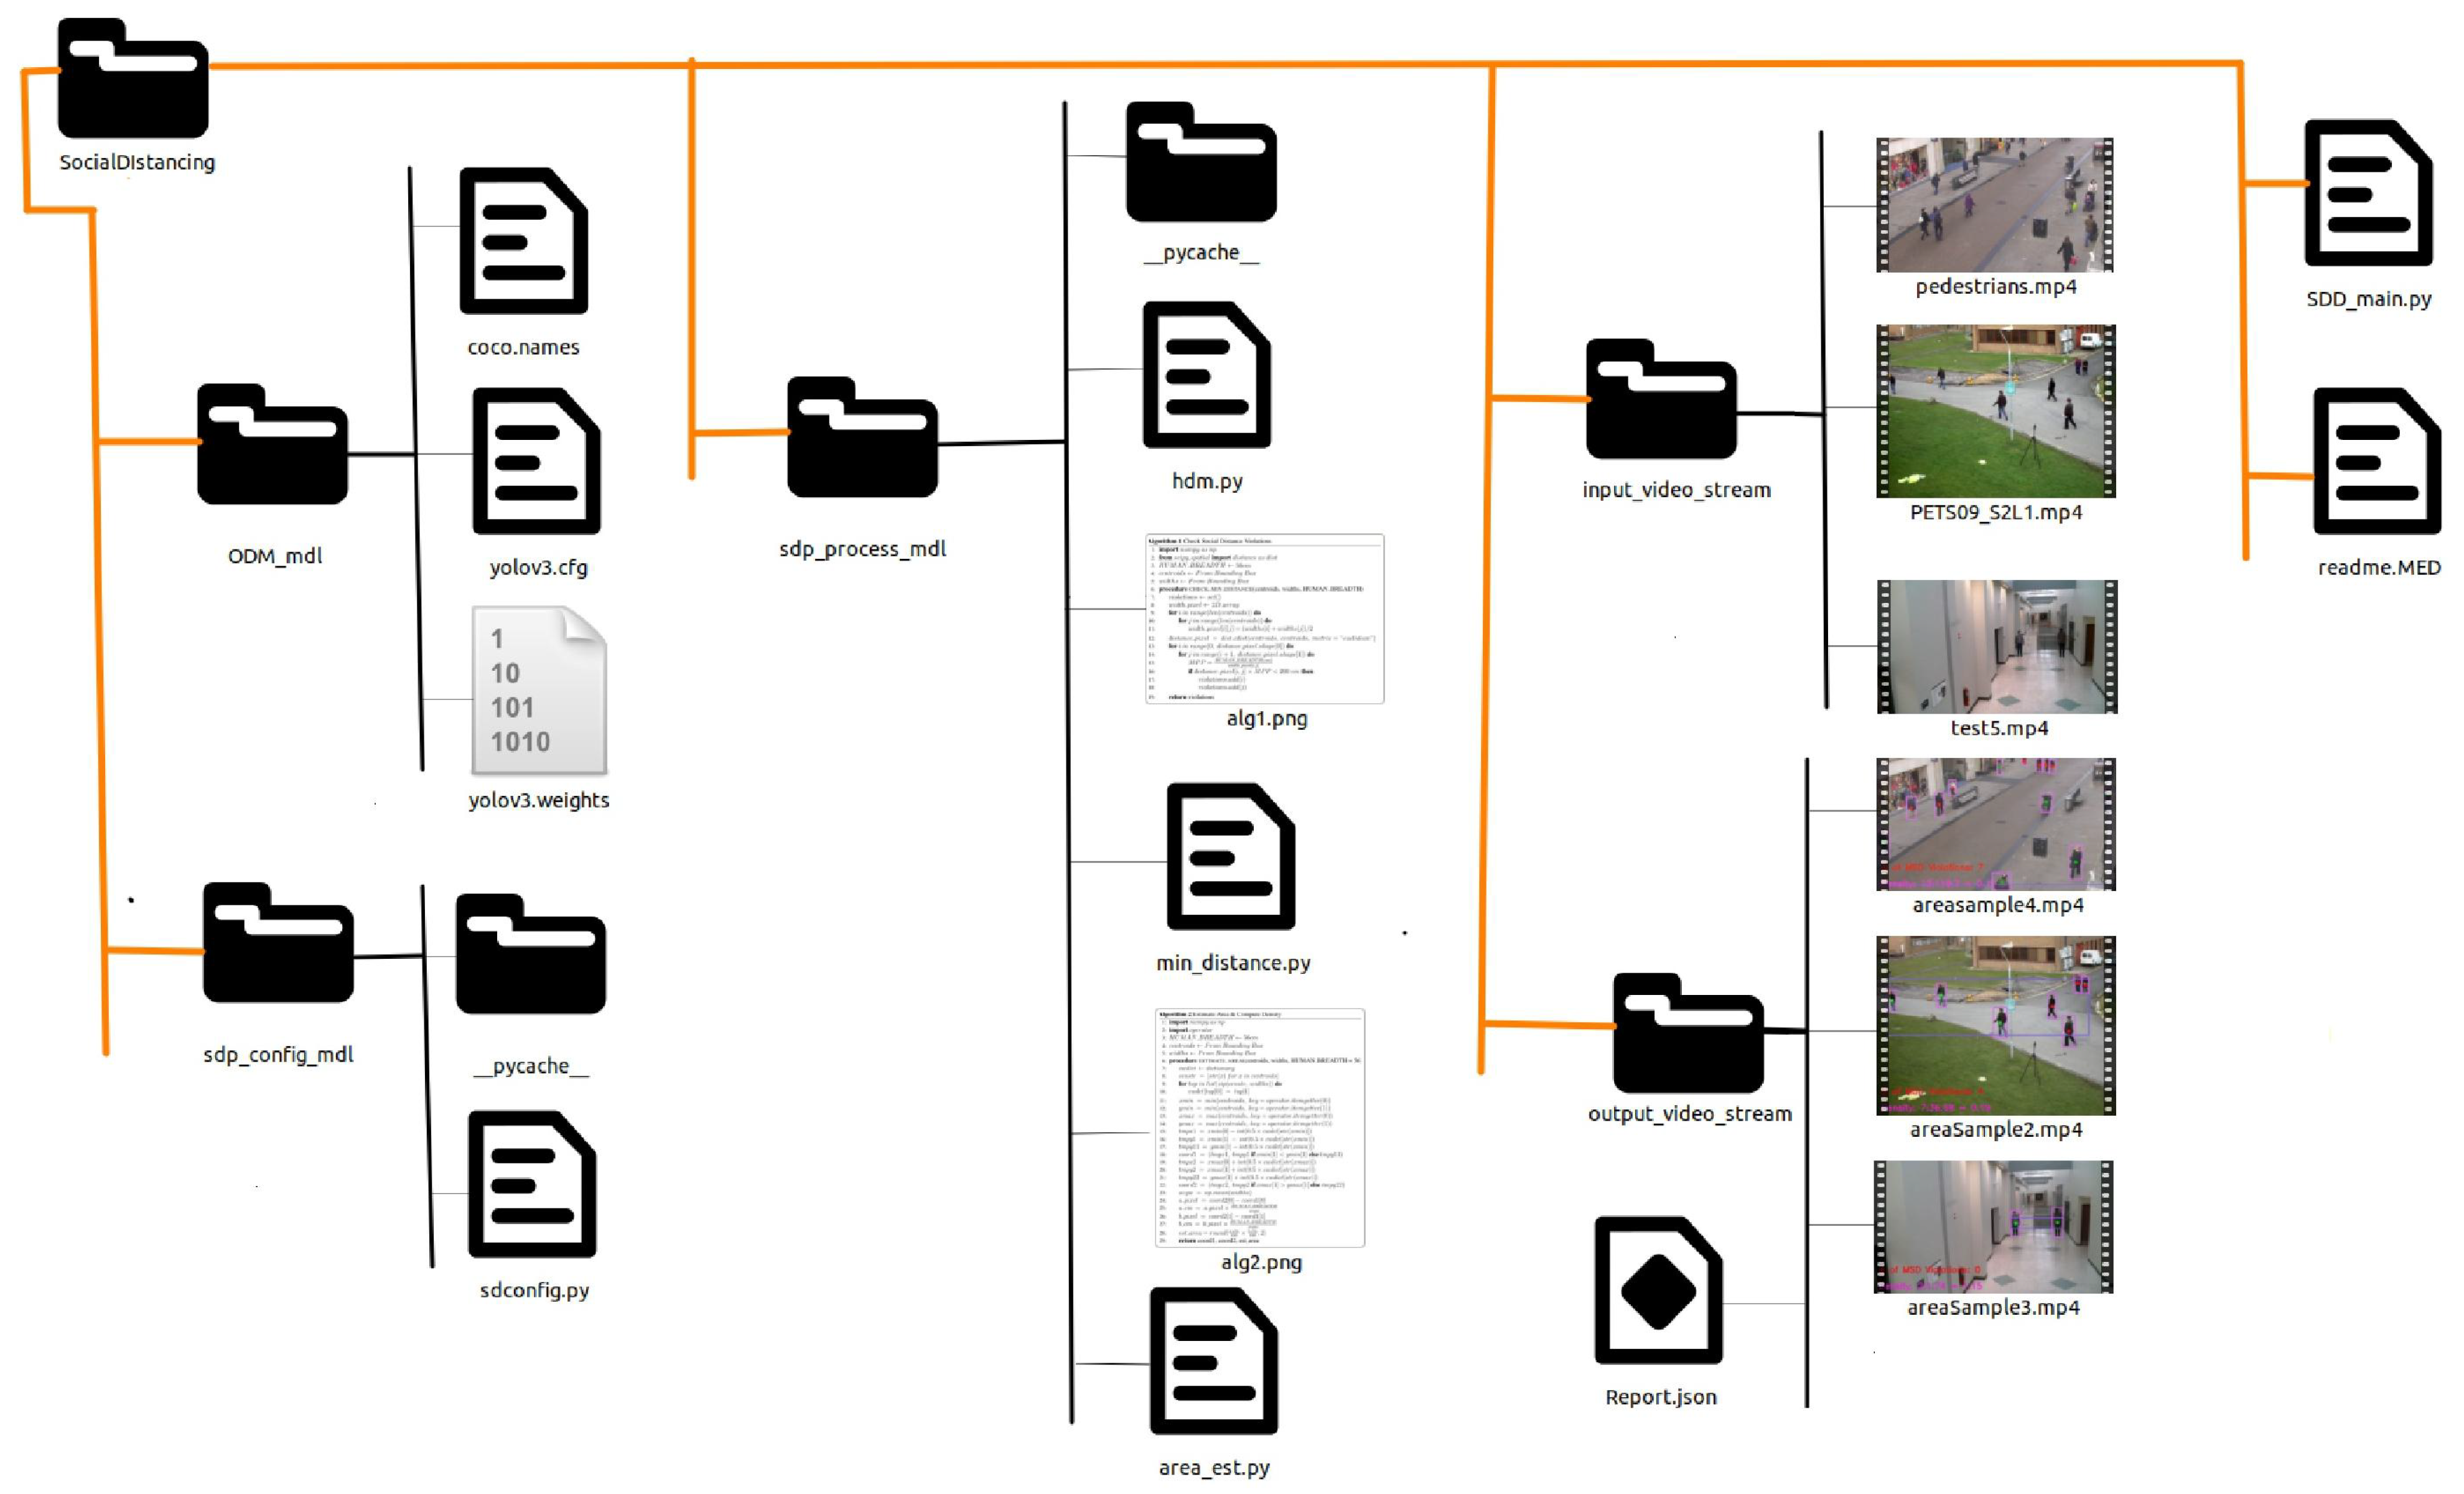
Figure 8.
File structure for Experimental Analysis and Testing of the Methods proposed in this paper.
Figure 8.
File structure for Experimental Analysis and Testing of the Methods proposed in this paper.

Figure 9.
Experimental Analysis: a pair of people at least 2 m apart from each other at a distance of (a) 15 m, (b) 13 m, (c) 11 m, (d) 9 m, (e) 7 m, and (f) 5 m from the camera perched on a 3 m tall pole.
Figure 9.
Experimental Analysis: a pair of people at least 2 m apart from each other at a distance of (a) 15 m, (b) 13 m, (c) 11 m, (d) 9 m, (e) 7 m, and (f) 5 m from the camera perched on a 3 m tall pole.

Figure 10.
Number of people violating social distancing: 0, Total number of people in the frame: 2, Estimated area: 1.61 m, & Density: .
Figure 10.
Number of people violating social distancing: 0, Total number of people in the frame: 2, Estimated area: 1.61 m, & Density: .

Figure 11.
Number of people violating social distancing: 10, Total number of people in a frame: 13, Estimated area: 92.01 m, & Density: 0.14.
Figure 11.
Number of people violating social distancing: 10, Total number of people in a frame: 13, Estimated area: 92.01 m, & Density: 0.14.

Figure 12.
Number of people violating social distancing: 0, Total number of people in a frame: 3, Estimated area: 10.62 m, Density: 0.28.
Figure 12.
Number of people violating social distancing: 0, Total number of people in a frame: 3, Estimated area: 10.62 m, Density: 0.28.

Figure 13.
Number of people violating social distancing: 4, Total number of people in a frame: 7, Estimated area: 47.83 m, Density: 0.15.
Figure 13.
Number of people violating social distancing: 4, Total number of people in a frame: 7, Estimated area: 47.83 m, Density: 0.15.


Table 1.
Social Distance Measurement.
| Distance to Camera | Actual Gap | Calculated Gap |
|---|---|---|
| 3 m | m | m |
| 5 m | 2 m | m |
| 5 m | 2 m | m |
| 7 m | 2 m | m |
| 9 m | 2 m | m |
| 11 m | 2 m | m |
| 13 m | 2 m | 2 m |
Publisher’s Note: MDPI stays neutral with regard to jurisdictional claims in published maps and institutional affiliations. |
© 2021 by the authors. Licensee MDPI, Basel, Switzerland. This article is an open access article distributed under the terms and conditions of the Creative Commons Attribution (CC BY) license (https://creativecommons.org/licenses/by/4.0/).
Share and Cite
MDPI and ACS Style
Fitwi, A.; Chen, Y.; Sun, H.; Harrod, R. Estimating Interpersonal Distance and Crowd Density with a Single-Edge Camera. Computers 2021, 10, 143. https://0-doi-org.brum.beds.ac.uk/10.3390/computers10110143
AMA Style
Fitwi A, Chen Y, Sun H, Harrod R. Estimating Interpersonal Distance and Crowd Density with a Single-Edge Camera. Computers. 2021; 10(11):143. https://0-doi-org.brum.beds.ac.uk/10.3390/computers10110143
Chicago/Turabian StyleFitwi, Alem, Yu Chen, Han Sun, and Robert Harrod. 2021. "Estimating Interpersonal Distance and Crowd Density with a Single-Edge Camera" Computers 10, no. 11: 143. https://0-doi-org.brum.beds.ac.uk/10.3390/computers10110143
Note that from the first issue of 2016, this journal uses article numbers instead of page numbers. See further details here.