
Towards Developing a Framework to Analyze the Qualities of the University Websites

 ,
,  ,
,  ,
,  ,
,  and
and
Abstract
:1. Introduction
1.1. Background
1.2. Contributions
- In our proposed framework, three key quality attributes were considered, such as content of information, website performance and loading time.
- In addition, there are multiple factors considered under content of information, such as university vision and mission, faculty information, online course registration etc.
- Along with this, we have conducted a questionnaire-based survey with the respective university students for obtaining their satisfaction level about their university website.
- We also performed statistical analysis on the feedback of survey documents to get a clear insight about the websites of several universities from the point of view of its users.
- Finally, we compare the survey results with the results of our developed system; this comparison validates the effectiveness of our tool.
1.3. Outline of Paper
2. Related Work
3. System Architecture and Design
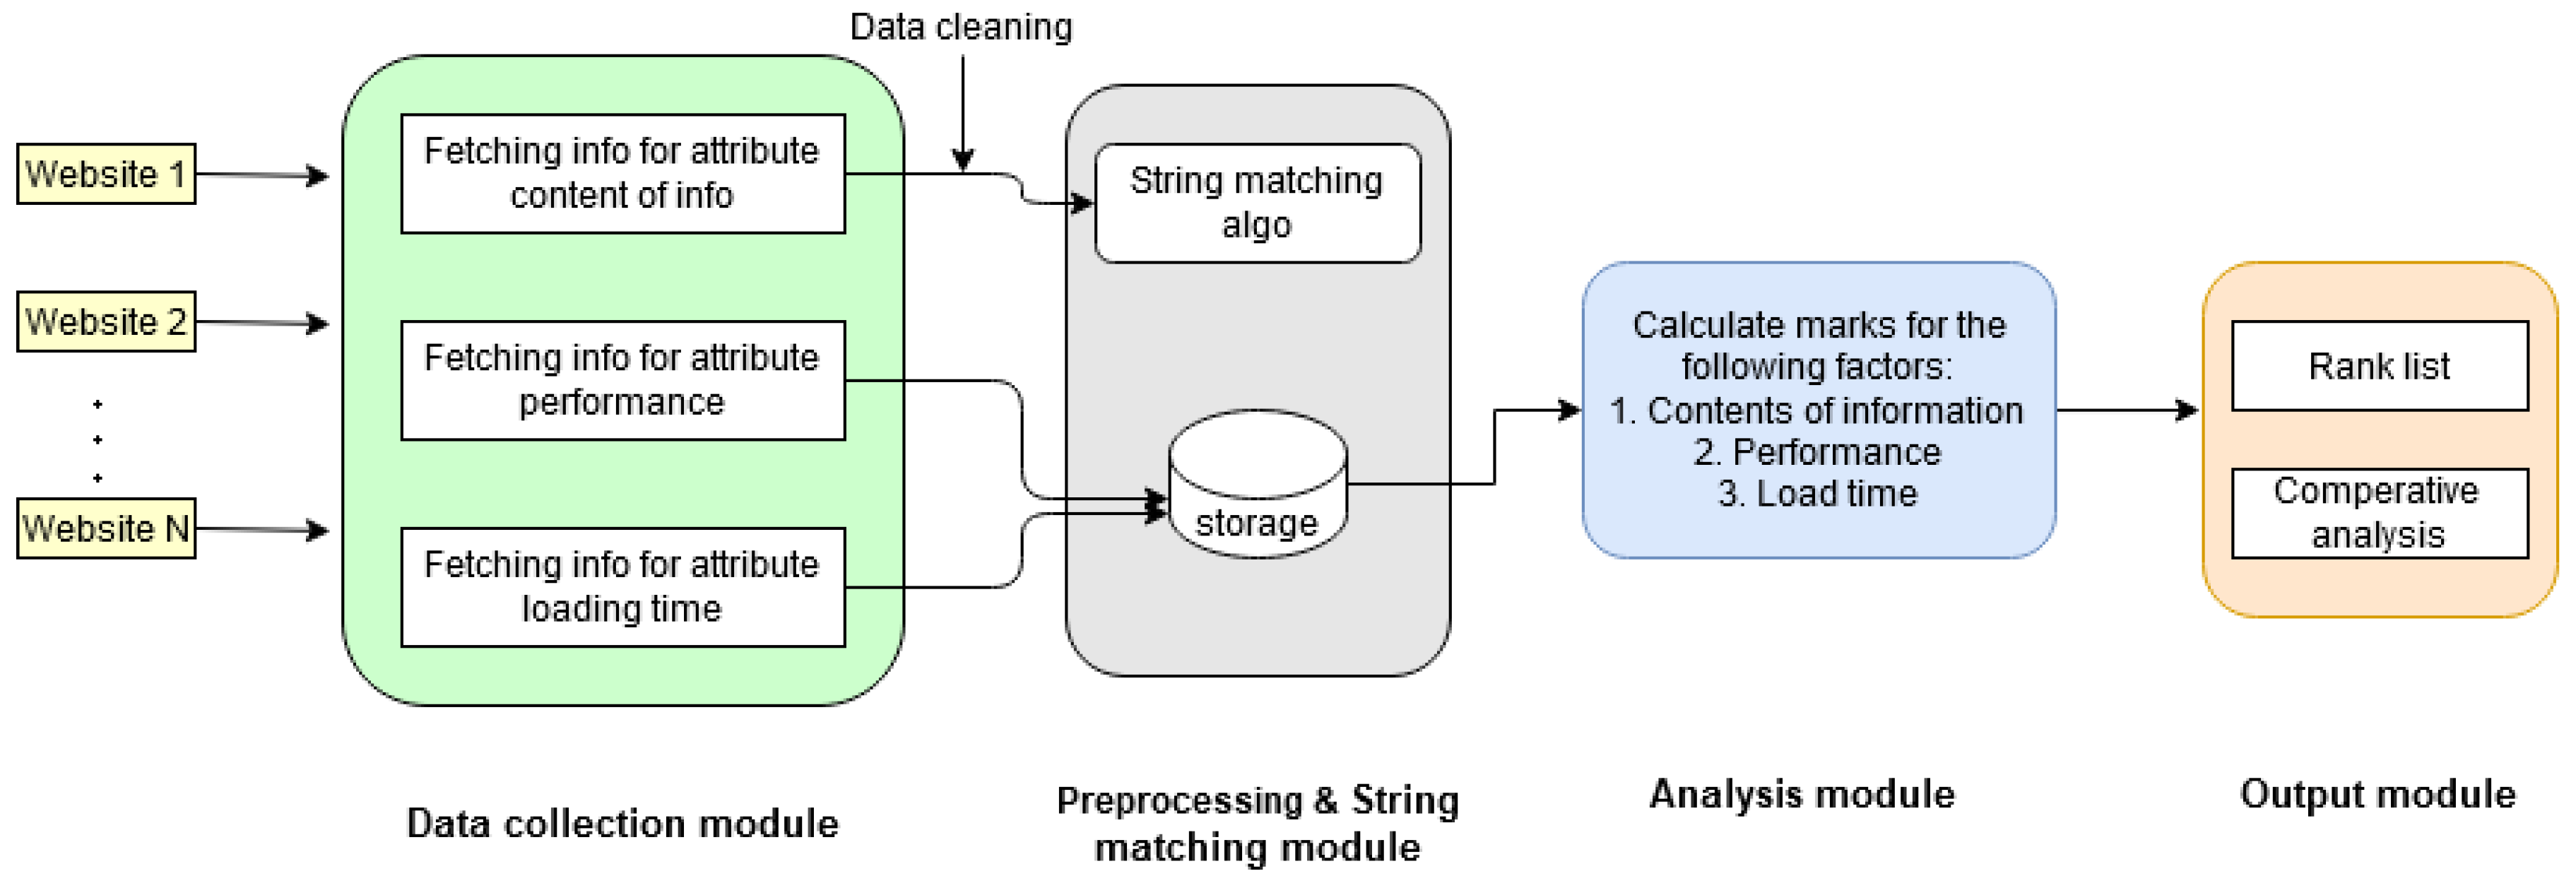
3.1. Automated Evaluation
3.1.1. Data Collection Module
3.1.2. Data Preprocessing and String Matching Module
| Algorithm 1: Algorithm for data preprocessing and string matching module. |
 |
3.1.3. Data Analyzing Module
3.1.4. Output Module
- Details of each attribute for each university website.
- University website ranking.
3.2. Statistical Evaluation
- Educational information
- Online facilities (Online learning environment, course registration etc.)
- Faculty member information
- Other helpful information (Scholarship, health care center etc.)
- Navigation and responsiveness
- Visual appearance
4. Implementation
4.1. Automated Tool
| Algorithm 2: Algorithm of Content of Information. |
 |
| Algorithm 3: Algorithm for attribute loading Time. |
| Result: loading time required for each webpage Input URL; |
| 1. fetch data stream using stream = urllib2.urlopen(URL); |
| 2. calculate the start time; |
| 3. read data stream using “stream.read()” and calculate the end time; |
| 4. calculate: load time = end time - start time; |
| 5. calculate: marks of load time = max (10 − load time, 0); |
| Algorithm 4: Algorithm for attribute Website Performance. |
| Result: Performance of website Input URL; |
| 1. set chrome driver path and other parameters; |
| 2. install and initialize the chrome driver; |
| 3. retrieve the 20 type of data selected for performance calculation; |
| 4. calculate marks on performance attribute; |
4.2. Questionnaire Based Evaluation
Data Collection Procedure
5. Experimental Result
5.1. Result of Automated Tool
- Comparative analysis of selected university websites considering each attribute (Contents of information, Performance of website, Website loading time)
- Rank list of selected university websites based on overall score
5.2. Result of Questionnaire Based Evaluation
5.2.1. Analysis of Each Question
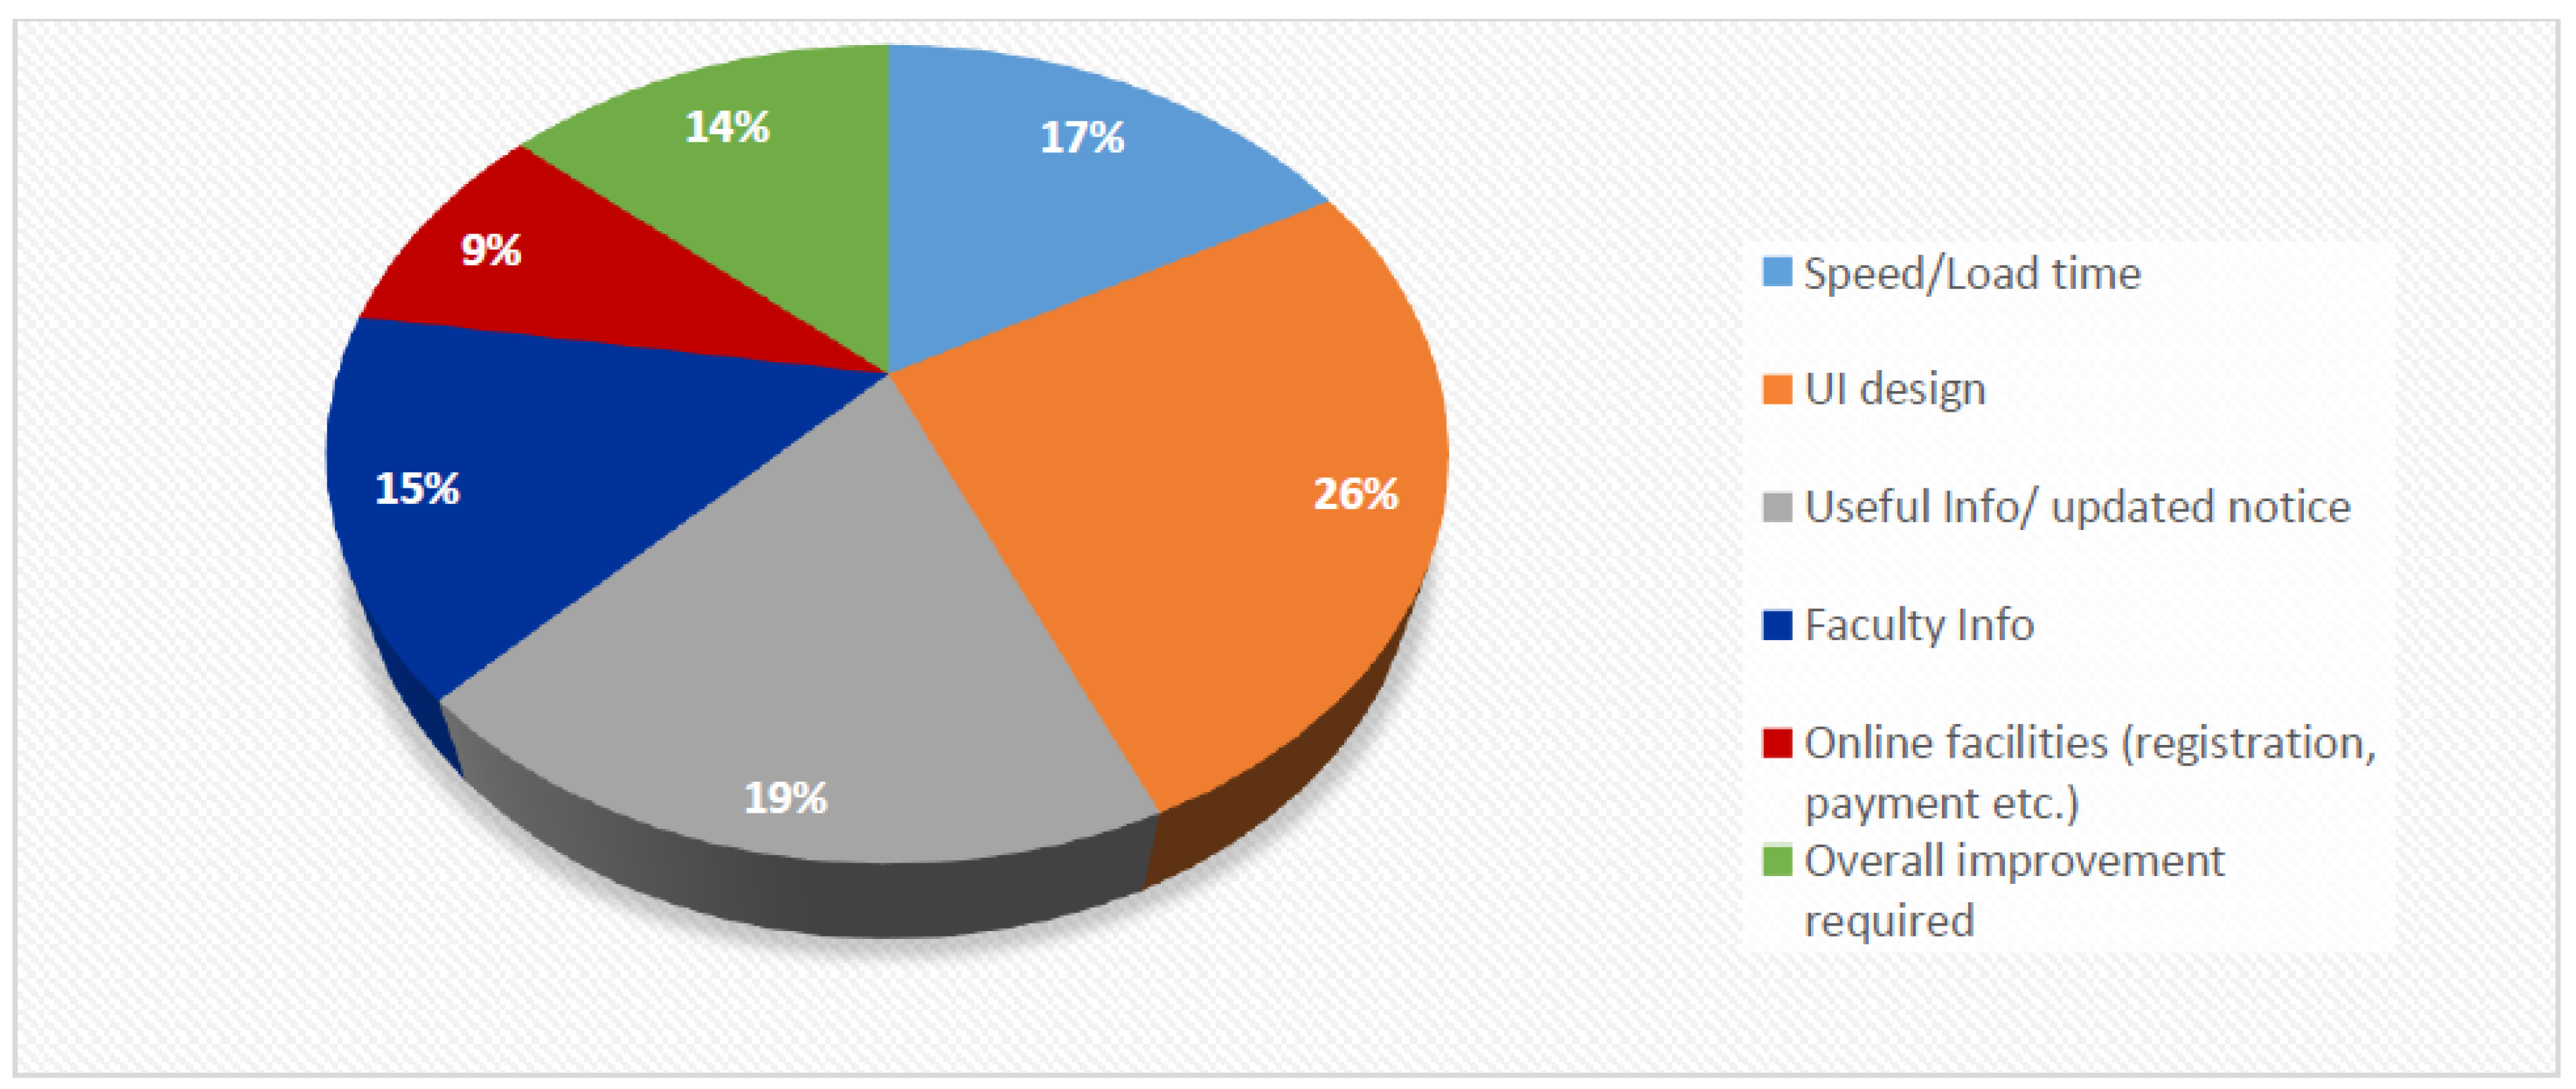
5.2.2. Recommendation for Website Improvement
- Speed/ Load time
- UI design
- Useful info/ Updated notice board
- Faculty information (Experience, field of interest)
- Online facilities (registration, payment)
- Overall improvement
5.2.3. Rank List Based on Average Score of Each Website
6. Conclusions and Future Research
Author Contributions
Funding
Institutional Review Board Statement
Informed Consent Statement
Conflicts of Interest
Appendix A. The List of 25 Key Strings
- University vision and mission or objective or goal
- University webmail or mail info
- University faculty info
- Administration info
- Workshop or seminar info
- Research info
- Information about Conference
- Information about publication
- Academic program
- Departmental information
- Institutes info
- Information about career, job or field
- Information about accommodation or residence
- Info about transportation
- Information about library
- Online services (online requisition, online course registration, online class, online application, online registration, online service, online admission, online learning, online exam)
- Notice board
- News and events
- Information about Alumni
- Info about Convocation
- Info about student scholarship
- Information about IQAC
- Admission info
- Information about FAQ
- Academic information
Appendix B. 20 Types of Data for Calculating Performance
- Connect start time
- Connect end time
- DomComplete time
- Dom content load-event start time
- Dom content load event end time
- Dom inter-active time
- Domain look-up end time
- Domain look-up start time
- Duration time
- Fetch start time
- Load event end time
- Load event start time
- Redirect end time
- Redirect start time
- Request start time
- Response start time
- Unload event end time
- Unload event start time
- Secure connection start time
- Worker start time
References
- Andalib, Z.; Danaee, H. A study on measuring the quality of university website. Manag. Sci. Lett. 2013, 3, 1955–1960. [Google Scholar] [CrossRef] [Green Version]
- Will, E.M.; Callison, C. Web presence of universities: Is higher education sending the right message online? Public Relat. Rev. 2006, 32, 180–183. [Google Scholar] [CrossRef]
- Peker, S.; Kucukozer-Cavdar, S.; Cagiltay, K. Exploring the relationship between web presence and web usability for universities. Program 2016. [Google Scholar] [CrossRef]
- Manzoor, M.; Hussain, W.; Ahmed, A.; Iqbal, M.J. The importance of higher education website and its usability. Int. J. Basic Appl. Sci. 2012, 1, 150–163. [Google Scholar] [CrossRef] [Green Version]
- Ismail, A.; Kuppusamy, K. Accessibility of Indian universities’ homepages: An exploratory study. J. King Saud Univ. Comput. Inf. Sci. 2018, 30, 268–278. [Google Scholar] [CrossRef] [Green Version]
- Yerlikaya, Z.; Durdu, P.O. Evaluation of accessibility of university websites: A case from turkey. In International Conference on Human-Computer Interaction; Springer: Berlin/Heidelberg, Germany, 2017; pp. 663–668. [Google Scholar]
- Almahamid, S.M.; Tweiqat, A.F.; Almanaseer, M.S. University website quality characteristics and success: Lecturers’ perspective. Int. J. Bus. Inf. Syst. 2016, 22, 41–61. [Google Scholar] [CrossRef]
- Ganiyu, A.A.; Mishra, A.; Elijah, J.; Gana, U.M. The Importance of Usability of a Website. IUP J. Inf. Technol. 2017, 13, 27–35. [Google Scholar]
- Parasuraman, A. Technology Readiness Index (TRI) a multiple-item scale to measure readiness to embrace new technologies. J. Serv. Res. 2000, 2, 307–320. [Google Scholar] [CrossRef]
- Harper, K.A.; DeWaters, J. A quest for website accessibility in higher education institutions. Internet High. Educ. 2008, 11, 160–164. [Google Scholar] [CrossRef]
- Islam, A.; Tsuji, K. Evaluation of Usage of University Websites in Bangladesh. DESIDOC J. Libr. Inf. Technol. 2011, 31. [Google Scholar]
- Kaur, S.; Kaur, K.; Kaur, P. An empirical performance evaluation of universities website. Int. J. Comput. Appl. 2016, 146, 10–16. [Google Scholar] [CrossRef]
- Ojino, R.; Mich, L.; Ogao, P.; Karume, S. The Quality of Kenyan University Websites: A Study for the Re-engineering of the Masinde Muliro University Website. J. e-Learn. Knowl. Soc. 2013, 9. [Google Scholar]
- Dominic, P.; Jati, H.; Hanim, S. University website quality comparison by using non-parametric statistical test: A case study from Malaysia. Int. J. Oper. Res. 2013, 16, 349–374. [Google Scholar] [CrossRef] [Green Version]
- Montazer, G.A. University Website Quality Improvement Using Intuitionistic Fuzzy Preference Ranking Model. Biquarterly Iran. Distance Educ. J. 2018, 1, 9–30. [Google Scholar]
- Devi, K.; Sharma, A. Framework for evaluation of academic website. Int. J. Comput. Tech. 2016, 3, 234–239. [Google Scholar]
- Ismailova, R.; Inal, Y. Accessibility evaluation of top university websites: A comparative study of Kyrgyzstan, Azerbaijan, Kazakhstan and Turkey. Univers. Access Inf. Soc. 2018, 17, 437–445. [Google Scholar] [CrossRef]
- Loiacono, E.T.; Watson, R.T.; Goodhue, D.L. WebQual: A measure of website quality. Mark. Theory Appl. 2002, 13, 432–438. [Google Scholar]
- Liang, C.J.; Chen, H.J. A study of the impacts of website quality on customer relationship performance. Total Qual. Manag. 2009, 20, 971–988. [Google Scholar] [CrossRef]
- Olsina, L.; Covella, G.; Rossi, G. Web Quality. In Web Engineering; Springer: Berlin/Heidelberg, Germany, 2006; pp. 109–142. [Google Scholar]
- Król, K.; Zdonek, D. Aggregated Indices in Website Quality Assessment. Future Internet 2020, 12, 72. [Google Scholar] [CrossRef] [Green Version]
- Rocha, Á. Framework for a global quality evaluation of a website. Online Inf. Rev. 2012, 36, 374–382. [Google Scholar] [CrossRef]
- Kincl, T.; Štrach, P. Measuring website quality: Asymmetric effect of user satisfaction. Behav. Inf. Technol. 2012, 31, 647–657. [Google Scholar] [CrossRef]
- Khandare, S.S.; Gawade, S.; Turkar, V. Survey on website evaluation tools. In Proceedings of the 2017 International Conference on Recent Innovations in Signal Processing and Embedded Systems (RISE), Bhopal, India, 27–29 October 2017; pp. 608–615. [Google Scholar]
- Canziani, B.F.; Welsh, D.H. Website quality for SME wineries: Measurement insights. J. Hosp. Tour. Technol. 2016, 7, 266–280. [Google Scholar] [CrossRef] [Green Version]
- Singh, T.; Malik, S.; Sarkar, D. E-commerce website quality assessment based on usability. In Proceedings of the 2016 International Conference on Computing, Communication and Automation (ICCCA), Greater Noida, India, 29–30 April 2016; pp. 101–105. [Google Scholar]
- Jayakumar, R.; Mukhopadhyay, B. Website quality assessment model (WQAM) for developing efficient e-learning framework-a novel approach. Int. J. Eng. Technol. (IJET) 2013, 5, 3770–3780. [Google Scholar]
- Zahran, D.I.; Al-Nuaim, H.A.; Rutter, M.J.; Benyon, D. A comparative approach to web evaluation and website evaluation methods. Int. J. Public Inf. Syst. 2014, 10. [Google Scholar]
- Ford, E.W.; Huerta, T.R.; Diana, M.L.; Kazley, A.S.; Menachemi, N. Patient satisfaction scores and their relationship to hospital website quality measures. Health Mark. Q. 2013, 30, 334–348. [Google Scholar] [CrossRef]
- Giannakoulopoulos, A.; Konstantinou, N.; Koutsompolis, D.; Pergantis, M.; Varlamis, I. Academic Excellence, Website Quality, SEO Performance: Is there a Correlation? Future Internet 2019, 11, 242. [Google Scholar] [CrossRef] [Green Version]
- Giraud, S.; Thérouanne, P.; Steiner, D.D. Web accessibility: Filtering redundant and irrelevant information improves website usability for blind users. Int. J. Hum. Comput. Stud. 2018, 111, 23–35. [Google Scholar] [CrossRef]
- Medyawati, H.; Mabruri, A. Website quality: Case study on local government bank and state own bank in Bekasi City. Procedia Soc. Behav. Sci. 2012, 65, 1086–1091. [Google Scholar] [CrossRef] [Green Version]
- Sukmasetya, P.; Setiawan, A.; Arumi, E. Usability evaluation of university website: A case study. J. Phys. Conf. Ser. 2020, 1517, 012071. [Google Scholar] [CrossRef]
- EL-firjani, N.F.; Elberkawi, E.K.; Maatuk, A.M. Method for Website Usability Evaluation. Ph.D. Thesis, University of Benghazi, Benghazi, Libya, 2017. [Google Scholar]
- Hamarashid, H.; Saeed, S. Usability Testing on Sulaimani Polytechnic University Website. Int. J. Multidiscip. Curr. Res. 2017, 5. [Google Scholar]


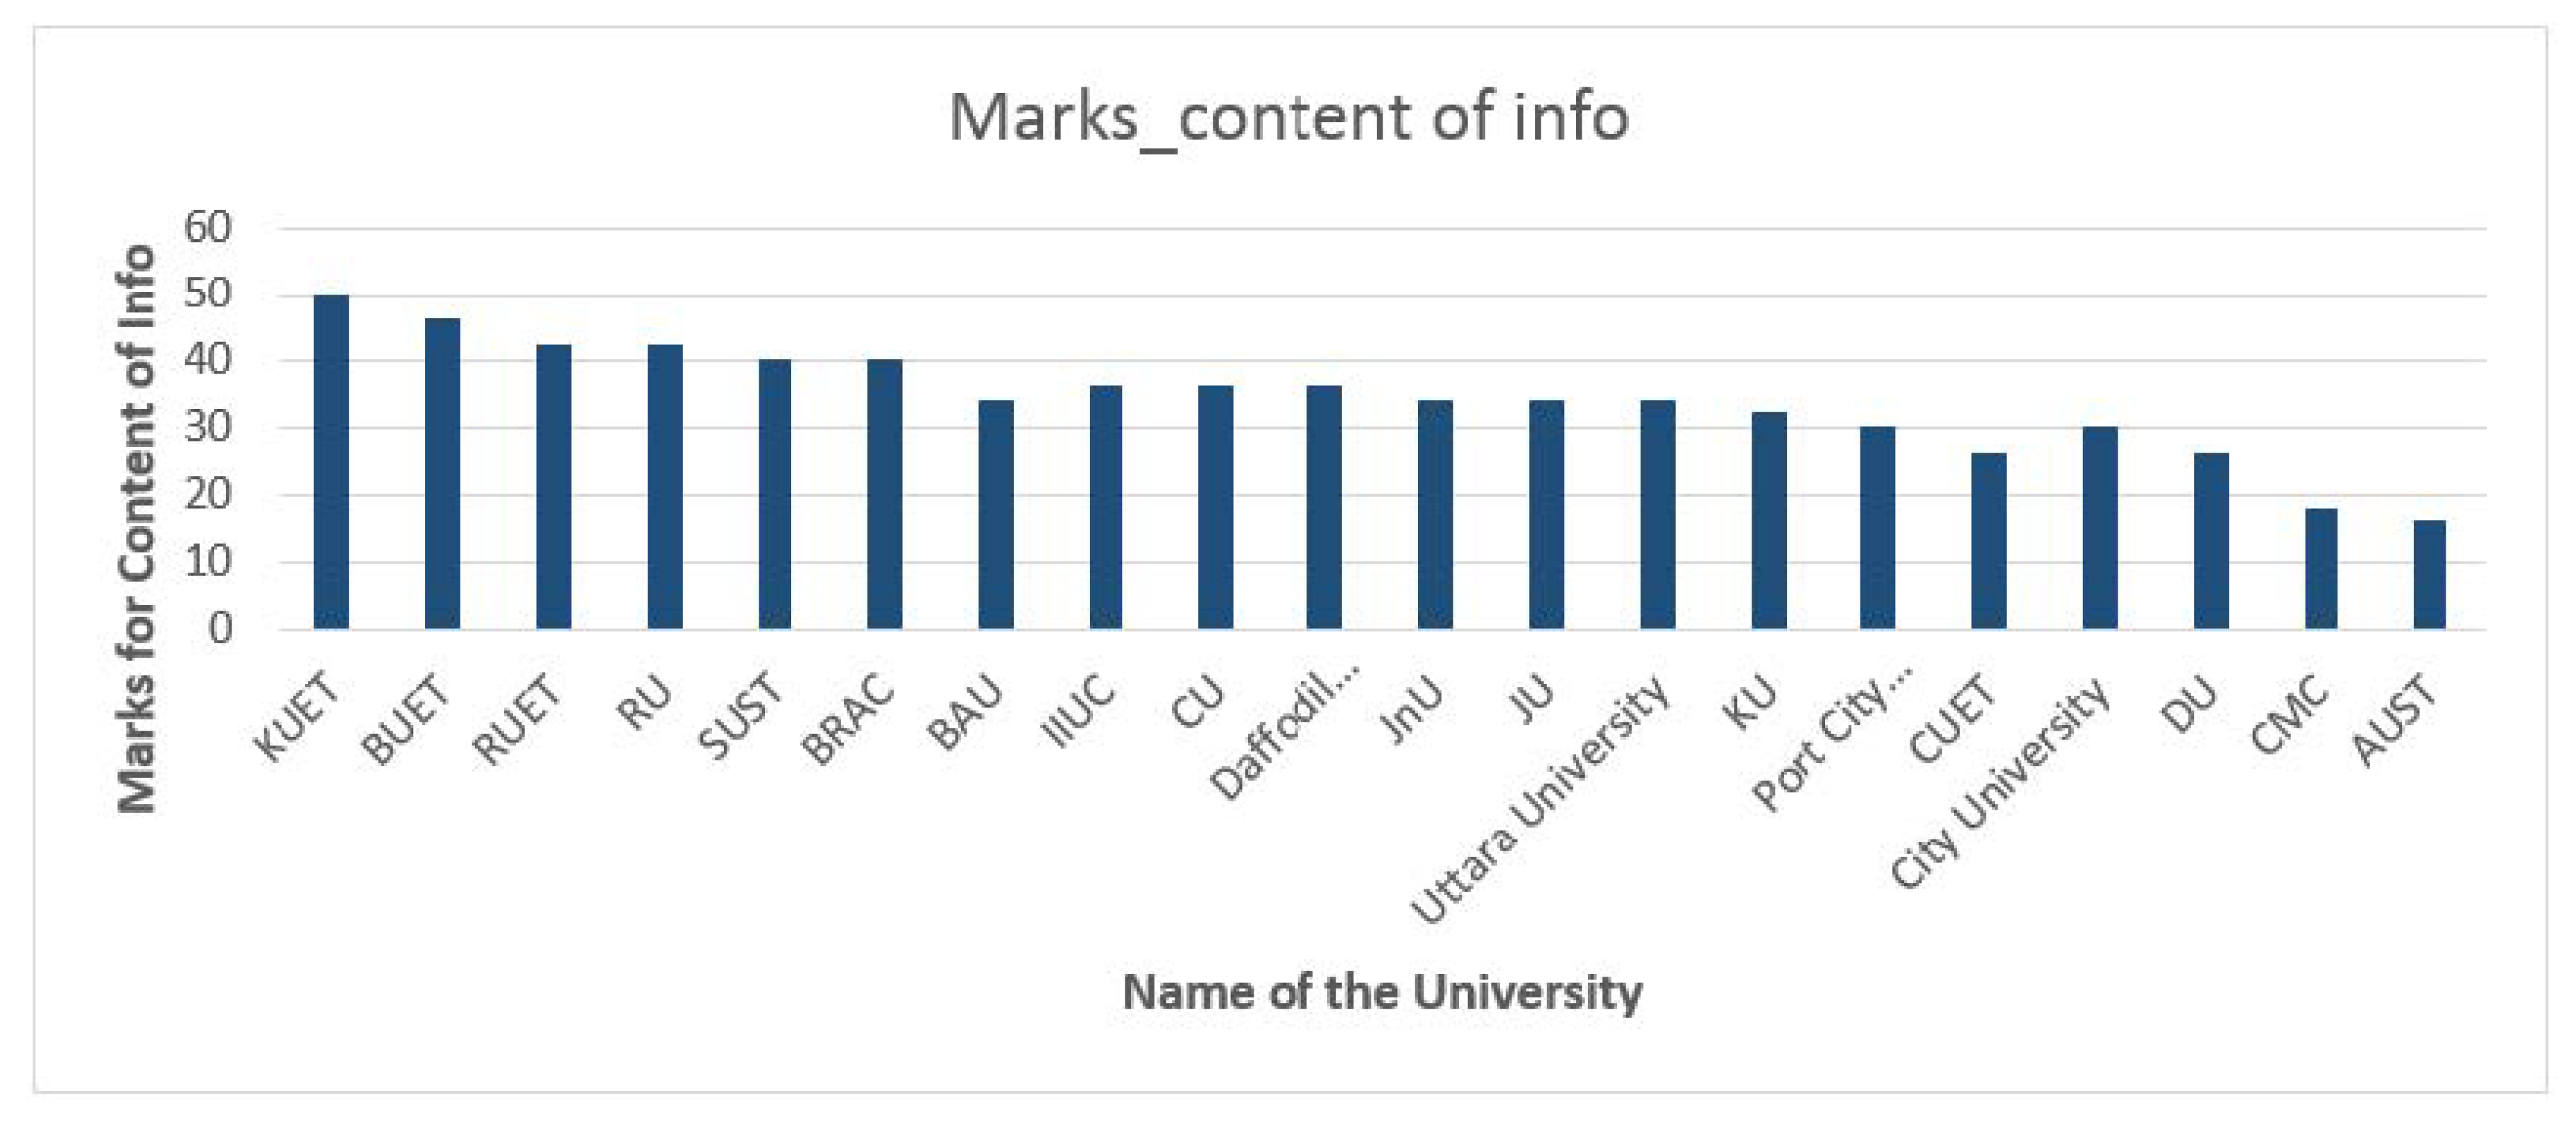
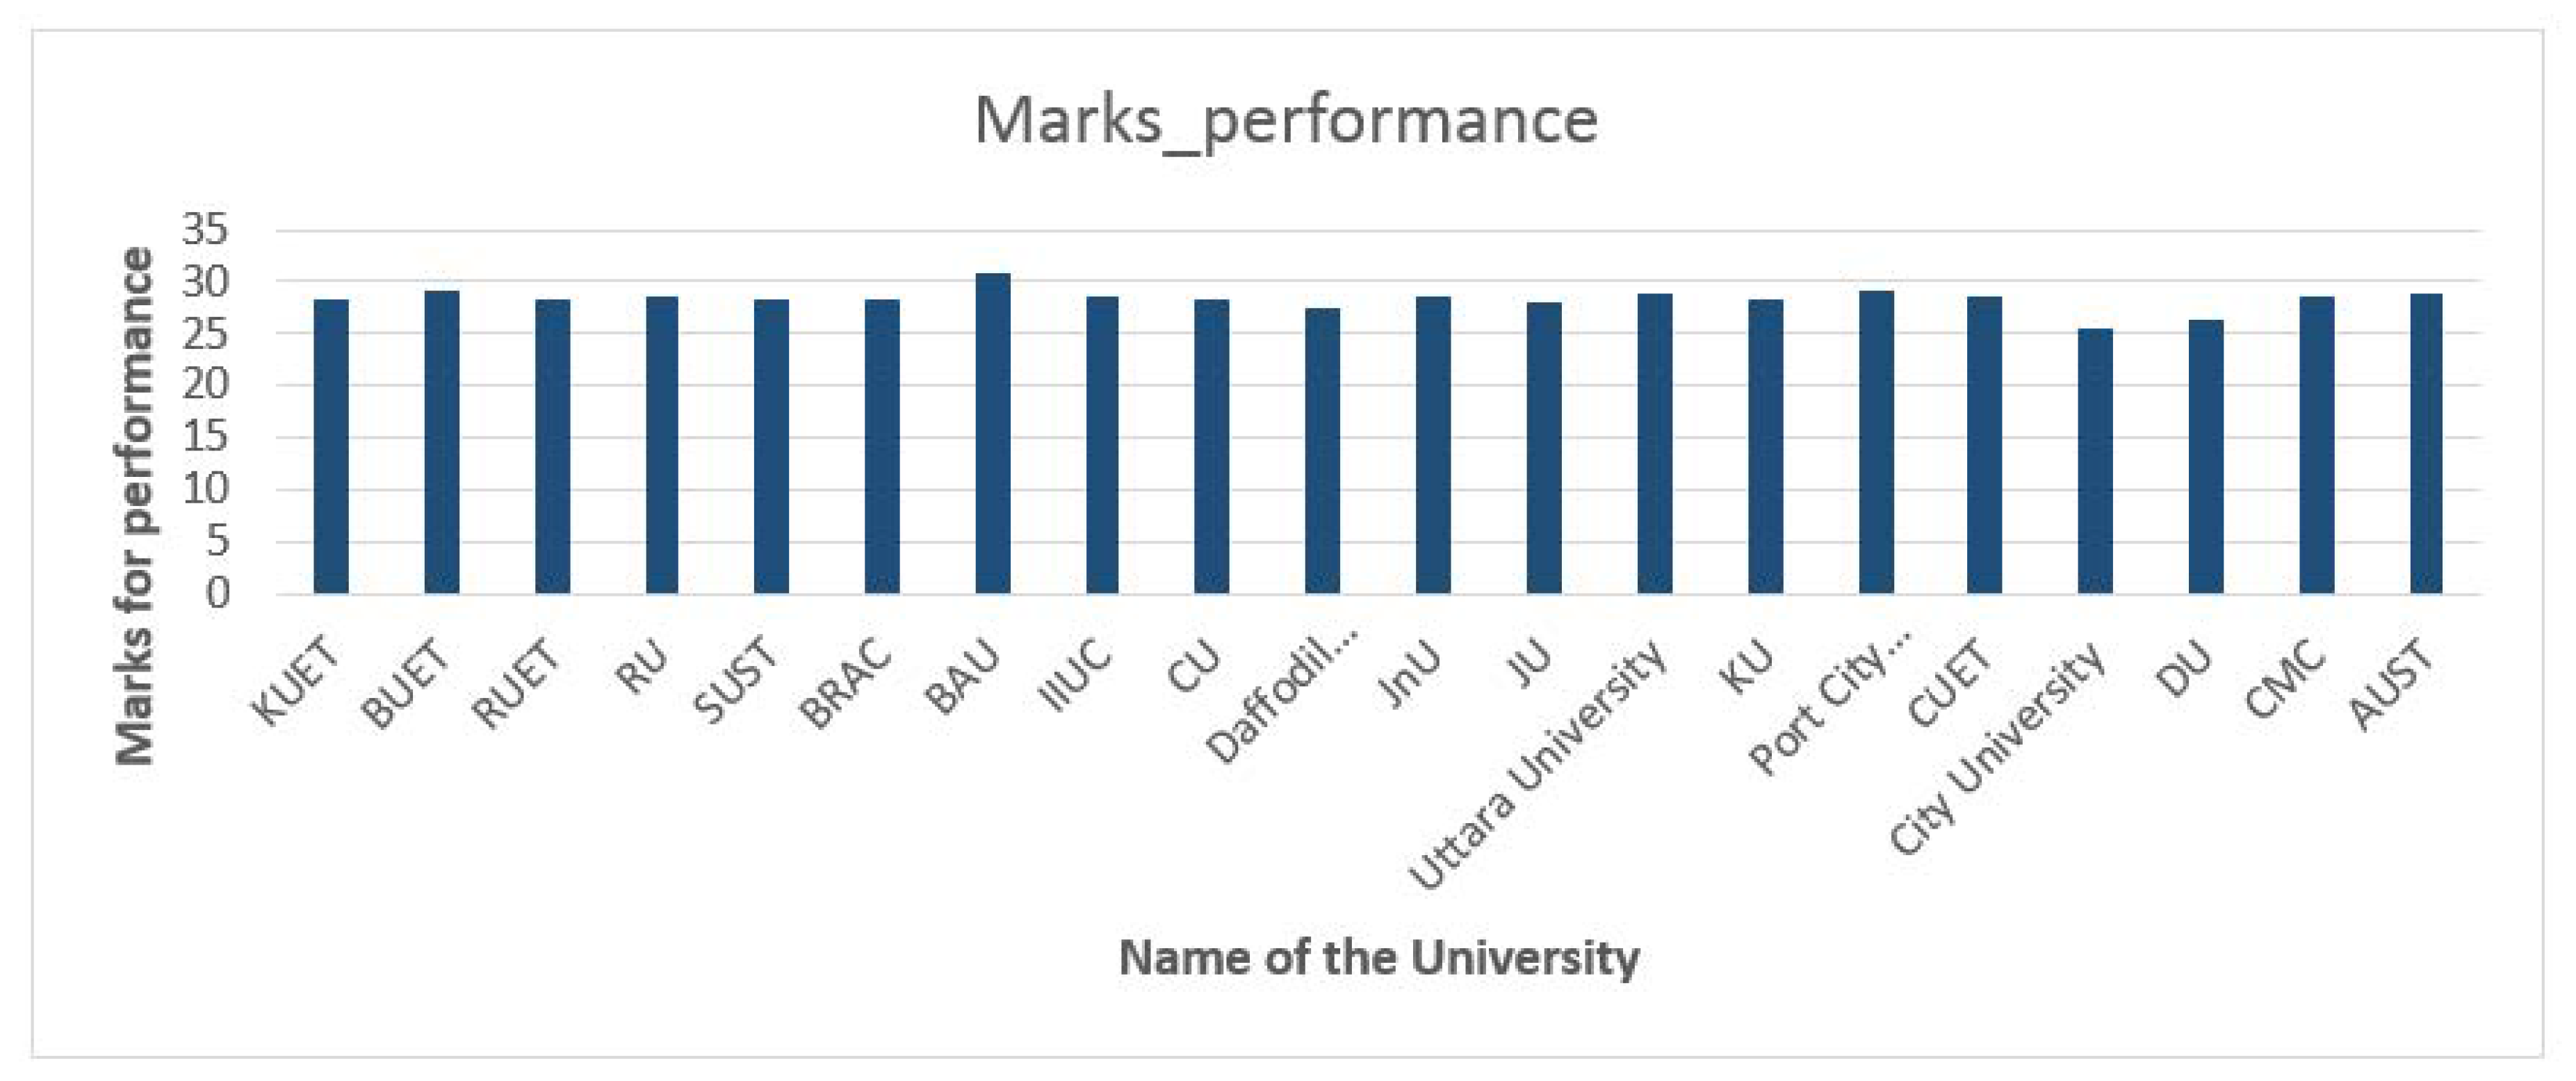
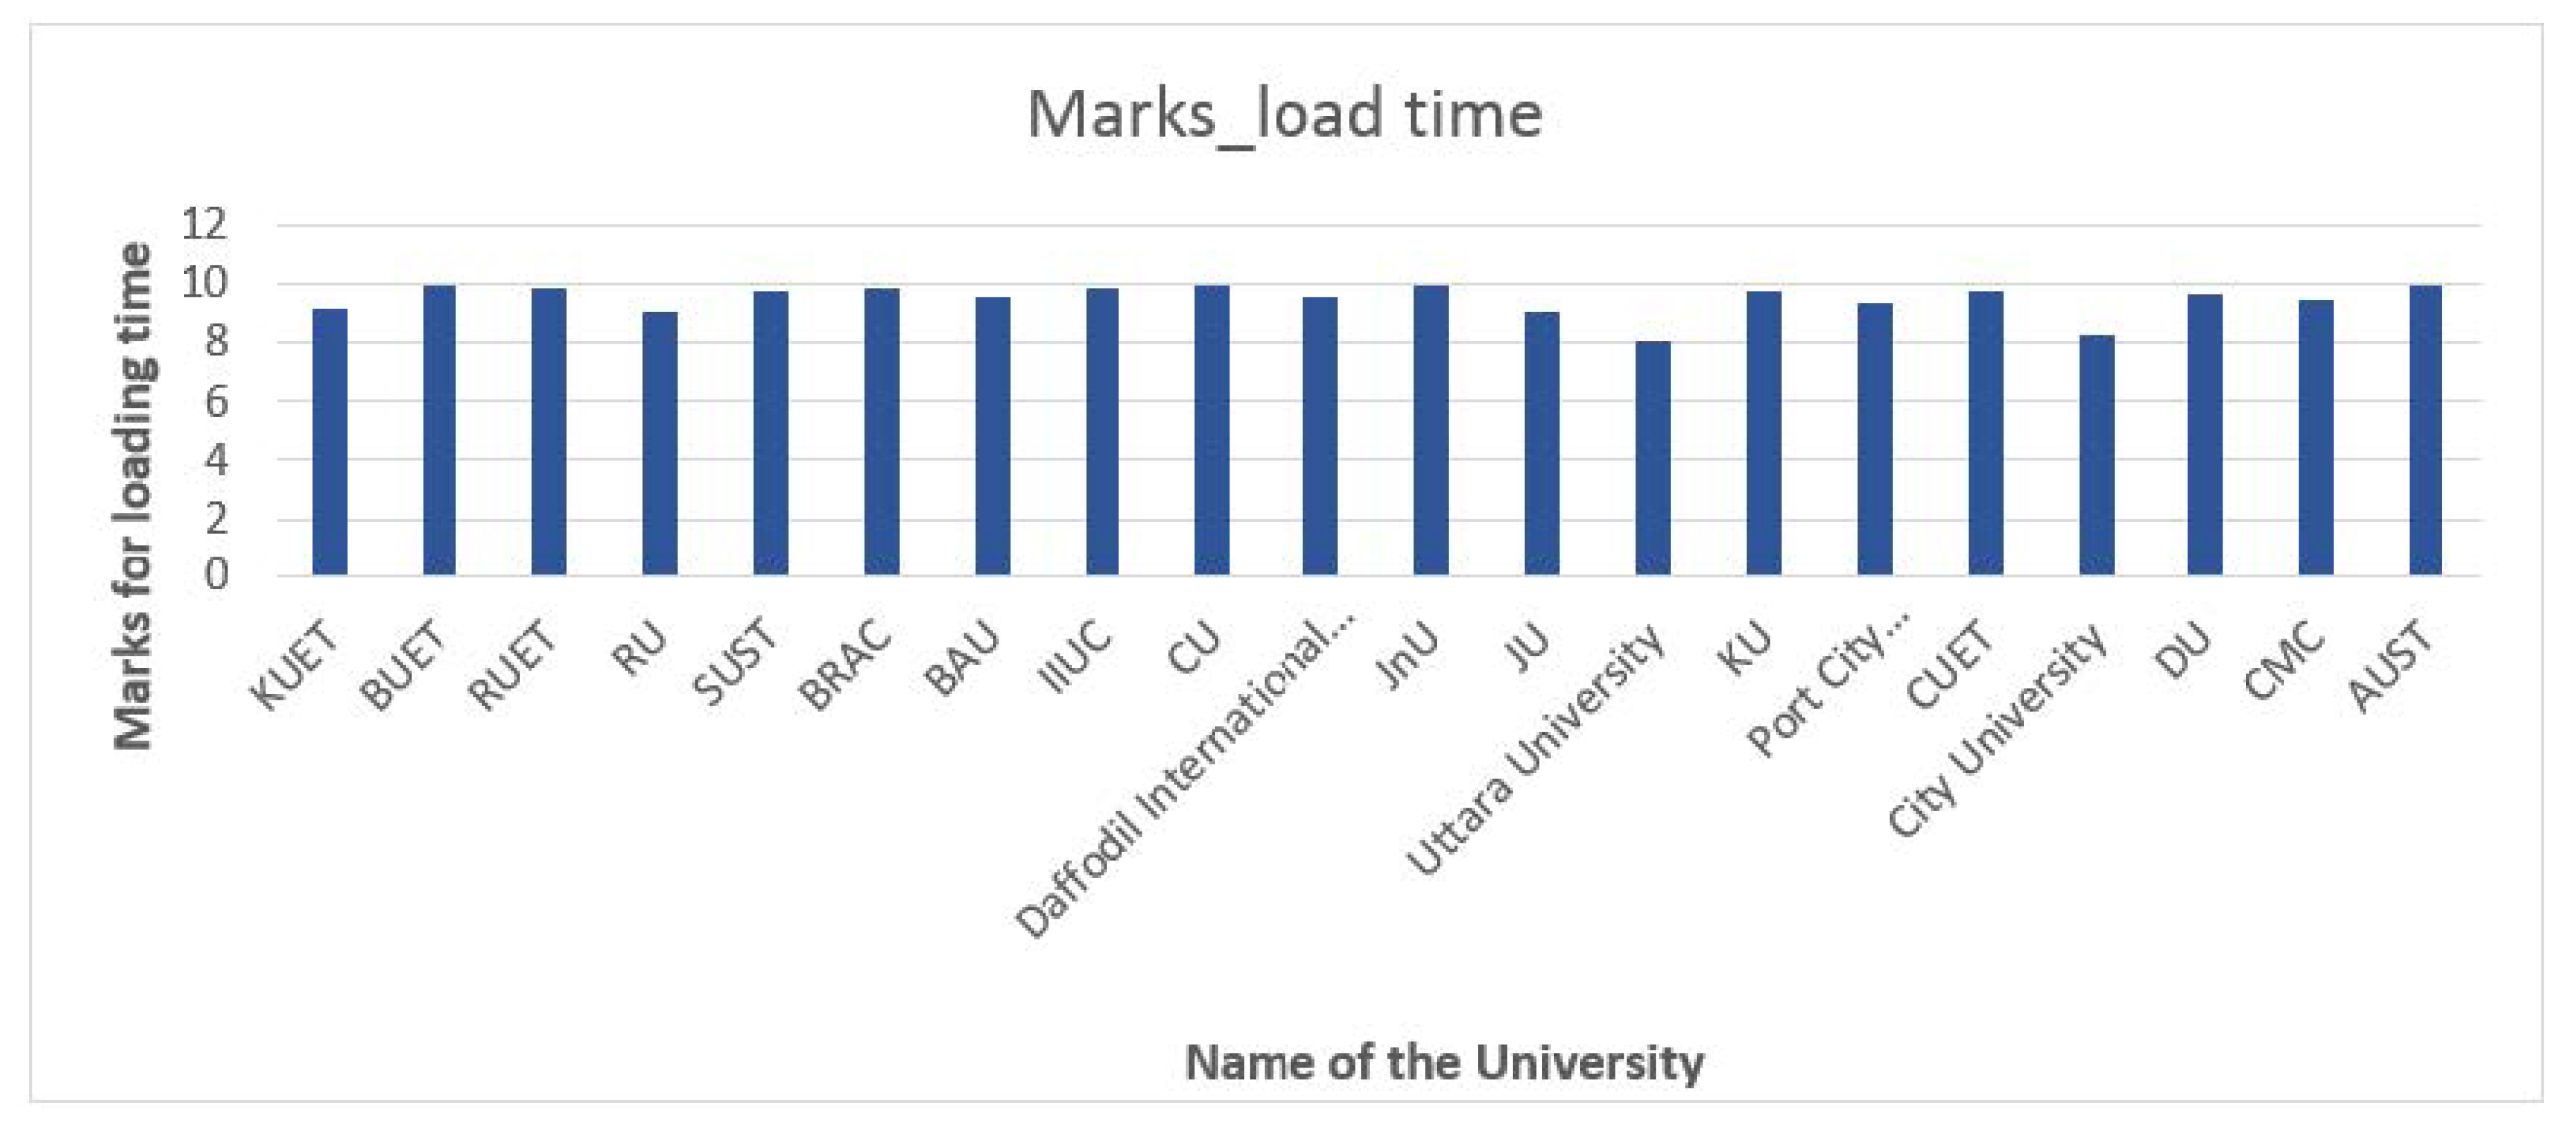
| University | Total Score | Marks: Content of Information | Marks: Performance | Marks: Load time |
|---|---|---|---|---|
| KUET | 87.36 | 50 | 28.19837998 | 9.159674883 |
| BUET | 84.92 | 46 | 29.01364 | 9.905450106 |
| RUET | 80.02 | 42 | 28.21030003 | 9.814033747 |
| RU | 79.61 | 42 | 28.54937997 | 9.059892654 |
| SUST | 78.01 | 40 | 28.25218002 | 9.754738331 |
| BRAC | 77.97 | 40 | 28.18038005 | 9.790145159 |
| Bangladesh Agricultural University (BAU) | 74.45 | 34 | 30.94878003 | 9.504649401 |
| International Islamic University Chittagong (IIUC) | 74.31 | 36 | 28.51358002 | 9.80026722 |
| CU | 74.22 | 36 | 28.34311995 | 9.881783724 |
| Daffodil International University | 72.97 | 36 | 27.46102006 | 9.505887508 |
| JnU | 72.59 | 34 | 28.68139998 | 9.907032013 |
| JU | 70.93 | 34 | 27.92382002 | 9.003336878 |
| Uttara University | 70.85 | 34 | 28.78095999 | 8.070547581 |
| KU | 69.87 | 32 | 28.15985999 | 9.70607543 |
| Port City International University | 68.42 | 30 | 29.05629998 | 9.362358093 |
| CUET | 64.17 | 26 | 28.44676004 | 9.724467039 |
| City University | 63.67 | 30 | 25.41607798 | 8.252358093 |
| DU | 61.88 | 26 | 26.21411998 | 9.667788744 |
| Chittagong Medical College (CMC) | 56.14 | 18 | 28.68057996 | 9.462923765 |
| AUST | 54.69 | 16 | 28.76954001 | 9.921000481 |
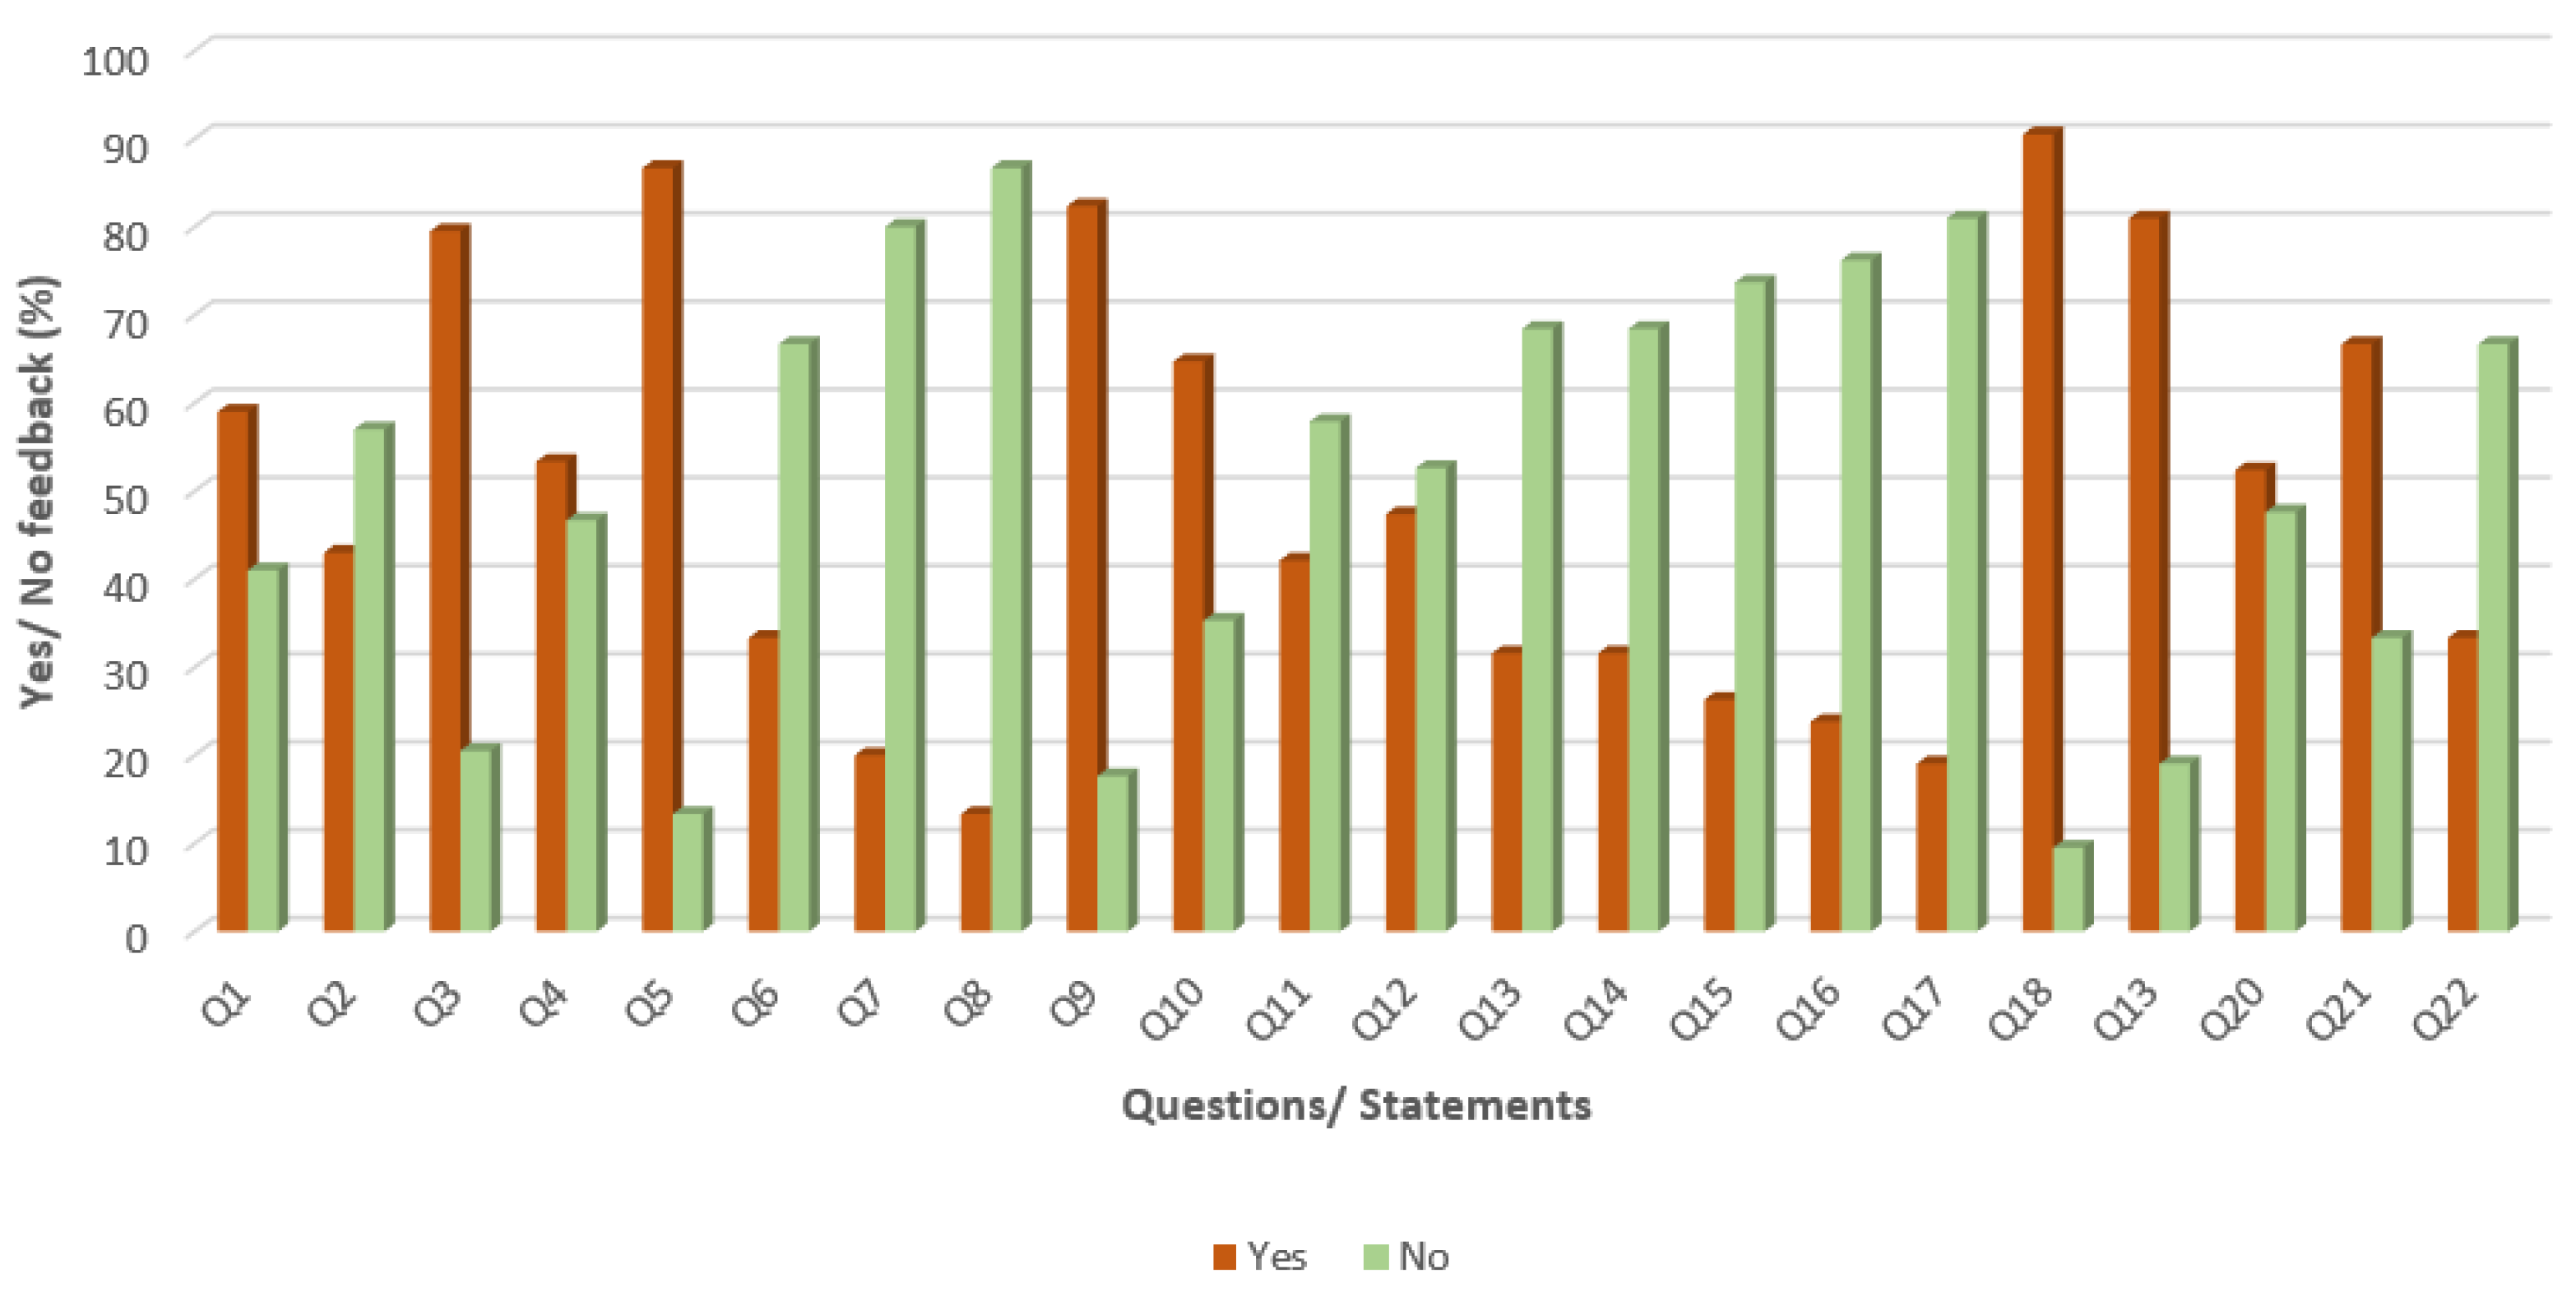
| No. | Questions/Statements | Yes(%) | No(%) |
|---|---|---|---|
| Q1 | Information on continuous education and training provided by your university website is helpful | 59 | 41 |
| Q2 | Does the website provide any Online Learning Environment facility (e.g., Moodle)? | 43 | 57 |
| Does the university website provide following information? (Q3 to Q8) | |||
| Q3 | Research and extension activities | 79.5 | 20.5 |
| Q4 | Student scholarship | 53.33 | 46.67 |
| Q5 | Academic calendar | 86.67 | 13.33 |
| Q6 | Transport schedule and related important information | 33.33 | 66.67 |
| Q7 | Relevant information and contact details of university health-care center? | 20 | 80 |
| Q8 | Student-related social support (e.g., complaint on sexual harassment or ragging)? | 13.33 | 86.67 |
| Q9 | Does the website maintain updated faculty member list? | 82.35 | 17.65 |
| Does it contain the following information about faculty members? (Q10 to Q13) | |||
| Q10 | Detailed qualification information | 64.71 | 35.29 |
| Q11 | Publication list | 42.11 | 57.89 |
| Q12 | Field of interest | 47.37 | 52.63 |
| Q13 | Updated contact information | 31.58 | 68.42 |
| Q14 | Does your university website provide online course registration service? | 31.58 | 68.42 |
| Q15 | Does it support online payment of fees (e.g., registration fee, library fine etc.)? | 26.32 | 73.68 |
| Q16 | Does it provide facilities for online library management (e.g., book rental/ renew)? | 23.81 | 76.19 |
| Q17 | Does the website support multiple languages (e.g., native and English)? | 19.05 | 80.95 |
| Q18 | Is the website compatible with the most popular browsers (e.g., Internet Explorer, Firefox, Chrome)? | 90.48 | 9.52 |
| Q19 | Is the website visually appealing? | 80.95 | 19.05 |
| Q20 | Do you feel good using this website? | 52.38 | 47.62 |
| Q20 | Is the website’s loading time satisfactory? | 66.67 | 33.33 |
| Q22 | Do you get all updated information/ notices from the website? | 33.33 | 66.67 |
| Q23 | Please give your suggestions for improving your academic website quality |
| University | Average Score |
|---|---|
| BRAC | 85.12 |
| BUET | 82.99 |
| Daffodil International University | 75.27 |
| Port City International University | 70.07 |
| International Islamic University Chittagong (IIUC) | 69 |
| AUST | 68.66 |
| CUET | 68.01 |
| City University | 68 |
| DU | 67.46 |
| KUET | 67.03 |
| JU | 66.88 |
| RUET | 66.08 |
| SUST | 64.55 |
| RU | 59.79 |
| Uttara University | 57.76 |
| Bangladesh Agricultural University (BAU) | 50.95 |
| CU | 50.92 |
| JnU | 50.32 |
| KU | 50.16 |
| Chittagong Medical College (CMC) | 43.57 |
| HSTU | 41.22 |
| Sylhet Agricultural University (SAU) | 41.01 |
Publisher’s Note: MDPI stays neutral with regard to jurisdictional claims in published maps and institutional affiliations. |
© 2021 by the authors. Licensee MDPI, Basel, Switzerland. This article is an open access article distributed under the terms and conditions of the Creative Commons Attribution (CC BY) license (https://creativecommons.org/licenses/by/4.0/).
Share and Cite
Rashida, M.; Islam, K.; Kayes, A.S.M.; Hammoudeh, M.; Arefin, M.S.; Habib, M.A. Towards Developing a Framework to Analyze the Qualities of the University Websites. Computers 2021, 10, 57. https://0-doi-org.brum.beds.ac.uk/10.3390/computers10050057
Rashida M, Islam K, Kayes ASM, Hammoudeh M, Arefin MS, Habib MA. Towards Developing a Framework to Analyze the Qualities of the University Websites. Computers. 2021; 10(5):57. https://0-doi-org.brum.beds.ac.uk/10.3390/computers10050057
Chicago/Turabian StyleRashida, Maliha, Kawsarul Islam, A. S. M. Kayes, Mohammad Hammoudeh, Mohammad Shamsul Arefin, and Mohammad Ashfak Habib. 2021. "Towards Developing a Framework to Analyze the Qualities of the University Websites" Computers 10, no. 5: 57. https://0-doi-org.brum.beds.ac.uk/10.3390/computers10050057