Article

Influence of Chemical Activation Temperatures on Nitrogen-Doped Carbon Material Structure, Pore Size Distribution and Oxygen Reduction Reaction Activity

1
Latvian State Institute of Wood Chemistry, LV-1006 Riga, Latvia
2
National Institute of Chemical Physics and Biophysics, 12618 Tallinn, Estonia
*
Author to whom correspondence should be addressed.
Submission received: 27 September 2021 / Revised: 23 November 2021 / Accepted: 24 November 2021 / Published: 30 November 2021

Abstract

:
The goal of this research was to synthesize activated nitrogen-doped nanocarbons with high specific surface area and adjustable pore size distribution using wood charcoal as a raw material. The resulting carbon materials were tested for possible application as oxygen reduction reaction catalysts in alkaline media. Activated carbons were obtained using a thermochemical activation method with NaOH. Nitrogen was introduced into activated carbons using dicyandiamide solution. It was demonstrated that the content of introduced nitrogen depends on oxygen content in the structure of the activated carbon. The oxygen reduction reaction activity of the activated and nitrogen-doped carbon material was comparable with a commercial 20% Pt/C catalyst. Electrocatalytic properties of the synthesized N-doped wood-derived carbon catalysts may be associated with the highly developed surface area, specific ratio of micro- and mesopores, as well as the high percentage of pyridinic nitrogen.

1. Introduction

Nowadays, energy consumption is constantly increasing and the development of effective and cheap electrochemical power sources is gaining more and more attention. Fuel cells are considered one of the most important technologies, among the others, because of their high efficiency [1], grid-independence and longer operating times, in comparison to battery technologies [2]. Despite having already been used in 1960 by NASA for the Apollo and Space Shuttle programs [3] and many research efforts to improve their performance, as well as the efficiency and durability of fuel cells, they still have not succeeded in large-scale commercialization [4,5]. Power specifications and price of fuel cells are limited, among other factors, by the expense of platinum-based catalysts, which also suffer from catalyst poisoning due to carbon monoxide [6,7]. Thus, the development of catalysts aimed to replace platinum-group metals is the most important issue in fuel-cell design [1].
The application of biomass-derived, N-doped carbons as novel metal-free cathode catalysts for oxygen reduction reactions (ORR) to transform chemical energy into electricity is the current and prospective approach to the use of carbon materials [8]. There is a number of studies devoted to oxygen-reduction catalysts on porous carbonaceous materials, which can be obtained by carbonizing renewable biomass, such as lignocellulose, sugar, chitosan, mulberry leaves, animal biomass, natural fibers, haddock peel, dandelion seeds, gelatin, chitin, etc. [9]. Besides their availability and renewability, plant biomass precursors are mostly naturally porous and rich in heteroatoms. For example, authors [10] have synthesized Typha orientalis-based materials using hydrothermal carbonization, yielding catalysts with relatively low specific area, and compared them to Pt/C commercial electrodes. Despite a relatively high nitrogen content, the performance was notably less effective than that of the commercial sample. In previous research [11], carbons were derived from aronia and peach stones via steam vapor activation, once again showing relatively low specific area, and used as catalysts for ORR. In this case, materials were co-doped with nitrogen and iron ions and compared to Pt/C commercial electrodes. There were also efforts to activate carbons from juncus plants using ZnCl2 [12] and to apply them for ORR reactions. Chemical activation provided significantly higher specific areas compared to the abovementioned methods, although the nitrogen content was low. Highly porous material was synthesized from the oatmeal precursor using urea as a source of nitrogen [13], showing promising activity towards ORR reaction. Another approach is the synthesis of biomass-based fibers, from example, from catkins and soybean treatment waste [14]; however, porosity and nitrogen content were relatively low in this case, which affected electrochemical performance.
The performance of N-doped activated carbons is attributed to various factors, including the number of active sites, such as pyridinic N, the favorable three-dimensional porous structure, and the large specific surface area [9]. The most prospective way to obtain highly porous carbon materials with well-developed nanoporous structure is alkali activation [15]. The final characteristics of activated carbons (AC) are predetermined by the nature of the precursor, as well as activation parameters [16]. The process of alkali activation usually includes four main stages: (1) impregnation or mixing of the precursor with an alkali (with a ratio of up to 1–7 to 1 of alkali to precursor); (2) heating of the mixture to activation temperature; (3) isothermal treatment for 1–3 h; (4) cooling of the mixture, washing of the AC from mineral components (leftover alkali and alkali salts), and finally, drying [17]. A porous material, AC, is formed at the end of the third stage [15].
In typical carbon materials, high micropore volume ensures high specific areas of up to 2000 m2/g, while mesopores are responsible for the more effective mass transfer properties. It is crucial to develop materials with these properties balanced with regards to pore size distribution, providing both high specific areas and unhindered transport of ions. Carbon microstructure comprises chaotically distributed crystallites of various sizes. Each of these crystallites consists of polyaromatic carbon moieties, e.g., graphenes. Unsaturated double bonds provide electric conductivity via mobile π-electrons, and the carbon regions of greatest interest are defect sites and edges, which are the most chemically active [18]. Electrochemical properties of carbon materials are dependent on the ratio of basal planes and edge structures and, in general, are defined by the surface concentration of structural defects [18]. According to this, the greatest catalytic activity should be exhibited by the less-ordered activated carbons [19]. Additionally, AC has various surface oxygen groups that present in the precursor and are formed in the process of carbon synthesis and activation [16].
Due to the strong O=O bond, the ORR has slow kinetics [20], so it is important to focus on accelerating the reaction rate. There are two possible ways to improve kinetics using carbon materials doped either with transition metals and/or with heteroatoms as catalysts [21,22]. The improved ORR activity of heteroatom-doped carbon materials can be associated with free-flowing π-electrons that can be donated [23]. Among the various heteroatoms, nitrogen has significant advantages for the modification of carbon nanomaterials since nitrogen and carbon have similar atomic sizes. Theoretical studies have demonstrated that nitrogen can be viewed as a n-type donor for transferring electrons to carbon atoms [24,25]. As nitrogen has higher electronegativity, doping carbon with N generates positive charge density on carbon atoms, and the O2 chemisorption changes. This also effectively weakens the O=O bond and promotes the ORR [26].
In this study [27], it was demonstrated that nitrogen-doped carbon material on the base of lignocellulose demonstrated good electrochemical activity in the oxygen reduction reaction. However, the low uniformity of resulting materials is one of the drawbacks [28]. To achieve the desired structure of N-doped carbon nanomaterials, optimization of activation and pyrolysis processes is required, as well as appropriate sources of nitrogen [29,30].
The goal of this research was to synthesize activated nitrogen-doped nanocarbons at various temperatures, providing high specific surface area and adjustable pore size distribution of the material, and using wood charcoal as a precursor. The obtained carbons were tested as candidates for application as ORR cathode catalysts in alkaline media.

2. Results

To evaluate the effect of activation temperature on the porosity and properties of activated carbon (AC), activated nitrogen-doped nanocarbons were synthesized using wood charcoal as precursor. This raw material was chosen for the several reasons. Firstly, it allows for the exclusion the carbonization stage; secondly, commercial charcoal has stable properties and is produced in large quantities in the well-known technological cycles available in many countries.
Activation was performed an activator (NaOH) to precursor rate of 3:1 for two hours. Isothermal process temperature was varied in the range 650 to 800 °C. The resulting activated carbons were then doped with nitrogen using the following procedure. Dicyandiamide (DCDA) was dissolved in dimethylformamide (DMF), mixed with activated carbon and stirred in a rotary evaporator for two hours at 90 °C. Then, DMF was evaporated, and the resulting solid mixture was thermally treated at 800 °C in a muffle oven for one hour in an argon atmosphere.
The samples were tested using nitrogen sorption at 77 K, and the resulting isotherms are shown in the Figure 1a. The shape of the isotherm for the sample synthesized at 650 °C belongs to Type I, according to IUPAC classification [16], which points to the predominant presence of very fine micropores with a width of only few molecular dimeters. At activation temperatures of 700 and 750 °C, the volume of adsorbed gas increases, and isotherms are accompanied by visible H4-type hysteresis [31], characteristic of capillary condensation and development of mesoporosity [15]. At the activation temperature of 800 °C, the shape of the isotherm changes even further and can be classified as Type II, while the shape of hysteresis points to the significant input of mesopores in the adsorption process.
Figure 1b compares the pore size distributions of carbon materials (AC-N), depending on the activation temperature, calculated from the nitrogen adsorption isotherms at 77 K (Figure 1a) using density functional theory (DFT). The increase in the activation temperature substantially influences micropore development, increasing their width. At lower activation temperatures (650 °C), pores in the size range of 1 to 2 nm are mainly formed, and their volume is relatively low. As the temperature increases, volume of micropores with a width of 1–2 nm increases and reaches a maximum at the activation temperature of 750 °C. As the activation temperature increases to 800 °C, micropore input into the total specific volume of the samples under study significantly decreases, and the volume of mesopores with a pore width of 2–5 nm increases.
The porosity data calculated from the nitrogen adsorption isotherms at 77 K (Figure 1a) are presented in Table 1 (specific surface area calculated according Brunauer-Emmet-Teller (BET) theory—SBET, specific surface area calculated according to density functional theory (DFT, calculated according NLDFT− N2—carbon equilibrium transition kernel at 77 K based on a slit-pore model)—SDFT, micropores volume calculated according Dubinin-Radushkevich method—Vmicro, and mesopores volume—Vmeso). Table 1 illustrates that all samples of activated carbons have high specific surface areas (SBET from 1924 to 2728 m2 g−1 and 1383 to 1764 cm2 g−1) according DFT theory (SDFT), which points to the high efficiency of the chosen activation process. With the increase in activation temperature, both total volume (Vmicro + Vmeso) and specific surface area increase, reaching the maximum of SBET 2728 m2 g−1 at 750 °C. At the activation temperature of 800 °C, pore size distribution is altered (Figure 1b). Due to the collapse of walls, micropores merge and form a bimodal mesoporous structure with sizes in the range of 2.5–4.5 nm, thus reducing the specific surface area of the samples.
The yields of the activated carbons from the precursor, namely alder wood charcoal, in the process of activation and doping are shown in the Table 1, and their dependency on the temperature is demonstrated. The highest AC-N yield was achieved at the activation temperature of 650 °C (based on o.d. charcoal—31.2%), and the lowest yield was achieved at the activation temperature of 800 °C (calculated on o.d. charcoal—19.2%).
The chemical composition of the samples under study was determined using elementary analysis and is shown in Table 1. There are works that relate the nitrogen content after doping to the content of oxygen-containing groups on the surface of the carbonaceous precursor, e.g., degree of oxidation [32,33]. The authors of this study have published extensive research showing a decrease in oxygen content in activated carbons with an increase in activation temperature [34]. The highest N content was obtained at the activation temperature of 650 °C −7.52%, while when the activation temperature was increased up to 800 °C, N content was only 2.48%, which can be explained by the abovementioned phenomena.
In a number of studies [35,36,37,38,39], it was found that electrochemical activity depends not only on the content but also on the chemical form of nitrogen bound to the AC structure. The surface chemical composition of AC-N was studied using X-ray photoelectron spectroscopy (XPS). Peaks corresponding to C1s, O1s and N1s were recorded (Figure 2a). The high-resolution spectra of N1s are shown in Figure 2b.
The C1 peak consists mainly of sp2 hybridized carbon [40]. The intensity of the N1s peak is very low due to the low nitrogen content on the surface. Nevertheless, the peak can be deconvoluted (Figure 2b). Four peaks were determined for nitrogen: pyridinic-N, pyrrolic-N, graphitic-N and pyridine-N-oxide. Most of the nitrogen was in the pyridinic form, and the second most important form of nitrogen is graphite-N. It has been reported [37] that the pyridinic-N form lowers the potential for oxygen reduction reactions, and graphitic-N acts as their active site, which, in turn, helps to achieve a higher diffusion-limited current.
Raman spectroscopy and XRD were used to determine the structural characteristics of the carbon samples under study and to clarify how the changes in structure affect the oxygen reduction reaction. Figure 3a illustrates the changes in the structure of AC-N with the alteration of activation temperature at a constant amount of activator to precursor ratio. Figure 3a shows the Raman scattering spectra for wood-based AC-N samples as a function of activation temperature. Two peaks are observed in the Raman scattering spectra: 1350 cm−1 (band D) and 1580 cm−1 (band G) (see Figure 3a).
Band D indicates a completely symmetric type of Alg valence, which is not possible in the case of ideal graphite crystals and appears only in the presence of defects [41]. These bands indicate an amorphous carbon structure.
The G band indicates the symmetry of E2g and is related to the valence fluctuations of carbon atoms in the aromatic ring and chains in the sp2 hybridization plane [42].
As the activation temperature increases, the intensity of the D and G peaks increases, and in the case of the AC-800N sample spectrum, shows a maximum G’ (or 2D) in the ~2500 cm−1 region, which is characteristic of graphene and indicates the presence of two-dimensional carbon structures [41].
X-ray diffraction (XRD), which is generally considered to be the “ideal” method for structural characterization of materials, not only distinguishes the structures of different carbon allotropes and polytypes but also allows for the determination of the extent to which a given carbon form differs from the ideal graphite structure [31]. Anything that changes interatomic distances—activation temperature, reheating, doping or defecting by introducing nitrogen into the structure—will be reflected in the change in peak positions.
For all of the samples under study, the diffraction reflexes (Figure 3b) detected by XRD are centered around 2θ = 43° and related to the diffraction in the 004 [43] or 100/101 [44] planes. However, differences in their relative intensities and widths are observed, depending on the sample activation temperatures. Increasing the activation temperature increases the intensity of the peak, reaching a maximum when the activation temperature is 800 °C (AC-800-N).
As the activation temperature increases, a peak centered around 2θ = 26° appears in the X-ray diffraction patterns of samples AC-750-N and AC-800-N, which is related to diffraction C (002) (graphite-graphite) [44,45], which corresponds to amorphous carbon and reveals a small amount of graphitized carbon embedded in the amorphous matrix. This type of carbon is formed by a partial conversion of amorphous carbon to a more ordered carbon due to the influence of DCDA decomposition products and NaOH on the carbon matrix in the course of thermal treatment. It should be noted that AC-800-N is not just a crystalline or amorphous form of carbon but a heterogeneous mixture of domains ranging from a single graphite layer (graphene) to multilayer graphite crystallites [46].
In order to study the electrochemical activity of the synthesized doped carbon samples, measurements were performed using a standard three-electrode system and the rotating disk electrode (RDE) method in 0.1 M KOH solution at room temperature (23 °C) at different rotation rates. Figure 4 compares the oxygen reduction voltammetry curves of AC-N based on wood synthesized at different activation temperatures at the same ratio of activator to precursor (3:1) with electrode rotation speeds of 360, 610, 960, 1900, 3100 and 4600 rpm. The linear sweep polarization curves demonstrate a clear dependence on the RDE rotation speed. Current density increases due to shorter diffusion distance, and a flat diffusion-limited plateau can be observed at lower rotation speeds, especially in the case of the sample activated at 800 °C (Figure 4d).
As the activation temperature increases from 650 to 800 °C, the onset (650 °C −237 mV, 700 °C −196 mV, 750 °C −146 mV, 800 °C −91 mV) and half-wave potentials become more positive, but at the same time, the diffusion-limited current density falls to slightly lower values (–1.4 mA cm−2—650 °C; −2.3 mA cm−2—700 °C; −3.1 mA cm−2—750 °C; −5.5 mA cm−2—800 °C at 1900 rpm). When the activation temperature is 800 °C, the curves almost coincide with the selected commercial 20% Pt/C catalyst samples (Figure 5a). For the samples activated at lower temperatures, the current is under the mixed, kinetic-diffusional limitations, even in the case of overpotentials. However, the activity steadily increases with the increase in the activation temperature. For the sample AC-N-800, the reaction is practically only diffusion-limited, which is indicated by the Koutecky-Levich plot (Figure 6a) since the intercept is close to zero.
The number of transferred electrons per O2 molecule (n) was calculated at various potentials using the Koutecky-Levich (K-L) equation, shown below, from the ORR data [47]:
1 j = 1 j k + 1 j d = 1 n F k C O 2 b 1 0.62 n F D O 2 2 / 3 ν 1 / 6 C O 2 b ω 1 / 2    
where, j is the ORR current density measured experimentally, jk and jd are the kinetic and diffusion limited current densities, respectively, F is the Faraday constant (96,485 C mol−1), k is the heterogeneous rate constant for O2 reduction, ω is the electrode rotation rate (rad s−1 [48]), DO2 is the diffusion coefficient of oxygen (1.9 × 10⁻⁵ cm2 s−1 [49]), CO2b is the oxygen concentration (1.2 × 10⁻⁶ mol cm−3 [49]) in 0.1 M KOH, and ν is the kinematic viscosity of the solution (0.01 cm2 s−1).
The changes in the number of transferred electrons, n (per O2 molecule), depending on the mesopore volume ratio to total adsorbed volume, can be seen in Figure 5b. As the activation temperature increases, the total pore volume increases linearly, and the mesopore volume and the number of transferred electrons increase as well, while the micropore volume decreases. More efficient electron transfer occurs when the density of mesopores (size 2.5–5 nm) of the material is greater than the volume of micropores. This outstanding result for AC-800-N can be attributed to its more accessible porosity, which is formed by two interconnected systems of mesopores (see Figure 1b), centered around 2.7 and 3.5 nm, that enhance the mass-transfer processes during the oxygen reduction reaction and limit the influence of mass-transfer limitations. The authors of [45] have also observed similar behavior, though in the case of N-doped carbon microspheres. Figure 6a illustrates the Koutecky-Levich plots derived from the experimental data shown in Figure 4d for the material with the best properties towards ORR—nitrogen-doped carbon activated at 800 °C, AC-N-800. Figure 6b shows the potential dependence of n, which, in this is case, is four, indicating that the process proceeds via a four-electron pathway.

3. Materials and Methods

Activated carbons based on alder wood charcoal (SIA “Fille”, Latvia) were obtained using chemical activation method with NaOH (activator to precursor ratio 3:1) at temperatures of 650, 700, 750 and 800 °C in an argon atmosphere. After activation, samples were demineralized with 10% HCl and deionized water. Nitrogen was introduced into the activated samples using dicyandiamide (DCDA) solution in dimethylformamide (DMF) with mass ratio of carbon material/DCDA 1:20. Doping was performed at 800 °C for 1 h in an argon atmosphere.
Porous characteristics were determined from nitrogen adsorption isotherms at 77 K using Nova 4200e instrument (Quantachrome, Boynton Beach, FL, USA).
The elementary composition was evaluated using the Vario Macro CHNSO device (Elementar, Langenselbold, Germany).
X-ray diffraction (XRD) data were collected on a PANalytical X’Pert Pro diffractometer (Malvern Panalytical Ltd., Malvern, UK). Cu Kα1 radiation was used, and time per step was 50 s, step size 0.050° 2θ, irradiated length 7 mm. X’Pert Highscore software and PDF-2 database were used for phase identification.
Raman spectra were recorded using an inVia Raman (Renishaw, Wotton-under-Edge, UK) spectrometer equipped with a thermoelectrically cooled (−70 °C) CCD camera and a microscope. The Raman spectra were excited with 532 nm radiation from a diode-pumped solid-state (DPSS) laser (Renishaw, Wotton-under-Edge, UK). The 20x/0.40 NA objective lens and 1800 lines/mm grating were used to record the Raman spectra. The accumulation time was 40 s. To avoid damage of the sample, the laser power at the sample was restricted to 0.6 mW. The Raman frequencies were calibrated using the polystyrene standard. Parameters of the bands were determined by fitting the experimental spectra with Gaussian-Lorentzian shape components using GRAMS/A1 8.0 software.(Version 8.0, Thermo Scientific, Waltham, MA, USA, 2015) Electrochemical measurements were performed with a standard three-electrode system using the rotating disk electrode (RDE) method. Saturated calomel electrode (SCE) was used as a reference electrode, and graphite rod was used as a counter electrode. Glassy carbon disk (Sigma-Aldrich, St. Louis, MO, USA) with a geometric area of 0.2 cm2 was used as a working electrode. The catalyst ink with a concentration of 4 mg mL−1 in isopropanol was prepared by using 0.25% of AS-04 OH ionomer (Tokuyama Corp., Tokyo, Japan), followed by sonication for 1 h. The electrodes were evenly covered with the catalyst material by drop coating with 20 μL of previously prepared catalyst ink. After coating, the electrodes were dried in the oven at 60 °C. Pine AFMSRCE (Pine, Durham, NC, USA) rotator and speed controlling unit were used for carrying out the RDE measurements. The software used for controlling the experiments was Nova 2.1.2 (Metrohm Autolab P.V., Utrecht, The Netherlands), and the potential was applied with a potentiostat/galvanostat Autolab PGSTAT 128N (Metrohm Autolab P.V., Utrecht, The Netherlands). Measurements were performed in 0.1 M KOH solution at room temperature (23 °C) at rotation rates of 360, 610, 960, 1900, 3100 and 4600 rpm. Further information on electrode preparation and electrochemical testing can be found elsewhere [50,51].

4. Conclusions

Nitrogen-doped activated carbons were synthesized using the chemical activation method with NaOH and studied as catalysts for oxygen reduction reactions (ORR) in fuel cells. The dependence of porosity of carbons on the activation temperature was studied. It was found that with the increase in activation temperature from 650 to 800 °C, micropores walls collapse, leading to the higher input of mesopores into total specific volume. Alterations to the structure of activated carbons were studied using Raman spectroscopy and XRD methods.
The ORR activity of the carbon material in the case of a nitrogen-doped sample activated at 800 °C wood char was comparable with commercial 20% Pt/C catalysts. Electrocatalytic activity of the synthesized nitrogen-doped, wood-based carbon catalysts may be associated with the highly developed surface area, favorable micro and mesoporous ratio and balance, high percentage of pyridinic nitrogen, and lack of stacking defects of graphene layers, as well as partial transformation into a more ordered structure, as demonstrated by Raman spectroscopy.
The results of this study demonstrate that the oxygen reduction reaction is influenced by the structure of the material and the pore size distribution. Nitrogen-doped carbon activated at 800 °C is a promising material for application in fuel cells as cathode for the oxygen reduction reaction.

Author Contributions

Conceptualization, A.V., A.P. and G.D.; methodology, A.V. and K.K.; validation and formal analysis, A.P., G.D., K.K. and A.V.; resources and data curation, A.P. and K.K.; writing—original draft preparation, A.P.; writing—review and editing, A.V. and A.P.; visualization, A.P. and A.V.; supervision, G.D., A.Z. and I.K.; project administration and funding acquisition, A.Z. and I.K. All authors have read and agreed to the published version of the manuscript.

Funding

The research was funded by postdoc project “Nitrogen and phosphorus-containing biomass based activated carbons for fuel cells and supercapacitors” No. 1.1.1.2/VIAA/4/20/596, “New biomass origin materials hybrid carbon composites for energy storage” project No LZP-2020/2-0019 and by European Regional Development Fund “Emerging orders in quantum and nanomaterials” project No. TK134.

Data Availability Statement

The data presented in this study are available on request from the corresponding author.

Acknowledgments

The authors would like to thank the Latvian State Institute of Wood Chemistry (Latvia) and the National Institute of Chemical Physics and Biophysics (Estonia) for the support provided.

Conflicts of Interest

The authors declare no conflict of interest.

References

  1. Barbir, F.; Gómez, T. Efficiency and economics of proton exchange membrane (PEM) fuel cells. Int. J. Hydrogen Energy 1996, 21, 891–901. [Google Scholar] [CrossRef]
  2. Gröger, O.; Gasteiger, H.; Suchsland, J.-P. Review—Electromobility: Batteries or Fuel Cells? J. Electrochem. Soc. 2015, 162, 2605–2622. [Google Scholar] [CrossRef]
  3. Williams, M.C. Chapter 2—Fuel Cells; Shekhawat, D., Spivey, J.J., Berry, D.A., Eds.; Elsevier: Amsterdam, The Netherlands, 2011; pp. 11–27. [Google Scholar]
  4. Debe, M.K. Electrocatalyst approaches and challenges for automotive fuel cells. Nature 2012, 486, 43–51. [Google Scholar] [CrossRef]
  5. Volfkovich, Y.M.; Sosenkin, V.; Bagotsky, V. Structural and wetting properties of fuel cell components. J. Power Sources 2010, 195, 5429–5441. [Google Scholar] [CrossRef]
  6. Bagotzky, V.S.; Osetrova, N.V.; Skundin, A.M. Fuel Cells: State-of-the-Art and Major Scientific and Engineering Problems. Russ. J. Electrochem. 2003, 39, 919–934. [Google Scholar] [CrossRef]
  7. Cheng, X.; Shi, Z.; Glass, N.; Zhang, L.; Zhang, J.; Song, D.; Liu, Z.-S.; Wang, H.; Shen, J. A review of PEM hydrogen fuel cell contamination: Impacts, mechanisms, and mitigation. J. Power Sources 2007, 165, 739–756. [Google Scholar] [CrossRef]
  8. Bruno, M.M.; Viva, F.A. Carbon Materials for Fuel Cells. In Direct Alcohol Fuel Cells; Springer: Dordrecht, The Netherlands, 2014; pp. 231–270. [Google Scholar]
  9. Jiang, M.; Yu, X.; Yang, H.; Chen, S. Optimization Strategies of Preparation of Biomass-Derived Carbon Electrocatalyst for Boosting Oxygen Reduction Reaction: A Minireview. Catalysts 2020, 10, 1472. [Google Scholar] [CrossRef]
  10. Chen, P.; Wang, L.-K.; Wang, G.; Gao, M.-R.; Ge, J.; Yuan, W.-J.; Shen, Y.-H.; Xie, A.-J.; Yu, S.-H. Nitrogen-doped nanoporous carbon nanosheets derived from plant biomass: An efficient catalyst for oxygen reduction reaction. Energy Environ. Sci. 2014, 7, 4095–4103. [Google Scholar] [CrossRef]
  11. Pérez-Rodríguez, S.; Sebastián, D.; Alegre, C.; Tsoncheva, T.; Petrov, N.; Paneva, D.; Lázaro, M.J. Biomass waste-derived nitrogen and iron co-doped nanoporous carbons as electrocatalysts for the oxygen reduction reaction. Electrochim. Acta 2021, 387, 138490. [Google Scholar] [CrossRef]
  12. He, G.; Yan, G.; Song, Y.; Wang, L. Biomass Juncus Derived Nitrogen-Doped Porous Carbon Materials for Supercapacitor and Oxygen Reduction Reaction. Front. Chem. 2020, 8, 226. [Google Scholar] [CrossRef] [PubMed] [Green Version]
  13. Zhang, Y.; Zhang, X.; Ma, X.; Guo, W.; Wang, C.; Asefa, T.; He, X. A Facile Synthesis of Nitrogen-Doped Highly Porous Carbon Nanoplatelets: Efficient Catalysts for Oxygen Electroreduction. Sci. Rep. 2017, 27, 43366. [Google Scholar] [CrossRef] [Green Version]
  14. Liu, A.; Ma, M.; Zhang, X.; Ming, J.; Jiang, L.; Li, Y.; Zhang, Y.; Liu, S. A biomass derived nitrogen doped carbon fibers as efficient catalysts for the oxygen reduction reaction. J. Electroanal. Chem. 2018, 824, 60–66. [Google Scholar] [CrossRef]
  15. Marsh, H.; Rodriguez-Reinoso, F. Activated Carbon; Elsevier: Amsterdam, The Netherlands, 2006. [Google Scholar]
  16. Bansal, R.C.; Goyal, M. Activated Carbon Adsorption; Taylor & Francis: Abingdon, UK, 2005. [Google Scholar]
  17. Volperts, A.; Plavniece, A.; Dobele, G.; Zhurinsh, A.; Kruusenberg, I.; Kaare, K.; Locs, J.; Tamasauskaite-Tamasiunaite, L.; Norkus, E. Biomass Based Activated Carbons for Fuel Cells. Renew. Energy 2019, 141, 40–45. [Google Scholar] [CrossRef]
  18. Yuan, W.; Zhou, Y.; Li, Y.; Li, C.; Peng, H.; Zhang, J.; Liu, Z.; Dai, L.; Shi, G. The edge- and basal-plane-specific electrochemistry of a single-layer graphene sheet. Sci. Rep. 2013, 3, 2248. [Google Scholar] [CrossRef] [PubMed] [Green Version]
  19. Zagal, J.H.; Bedioui, F.; Dodelet, J.-P. N4-Macrocyclic Metal Complexes; Springer: Berlin/Heidelberg, Germany, 2006. [Google Scholar]
  20. Gewirth, A.A.; Thorum, M.S. Electroreduction of Dioxygen for Fuel-Cell Applications: Materials and Challenges. Inorg. Chem. 2010, 49, 3557–3566. [Google Scholar] [CrossRef] [PubMed]
  21. Dombrovskis, J.K.; Palmqvist, A.E.C. Recent Progress in Synthesis, Characterization and Evaluation of Non-Precious Metal Catalysts for the Oxygen Reduction Reaction. Fuel Cells 2016, 16, 4–22. [Google Scholar] [CrossRef]
  22. Zheng, Y.; Jiao, Y.; Jaroniec, M.; Jin, Y.; Qiao, S.Z. Nanostructured Metal-Free Electrochemical Catalysts for Highly Efficient Oxygen Reduction. Small 2012, 8, 3550–3566. [Google Scholar] [CrossRef] [PubMed]
  23. Xiong, D.; Li, X.; Fan, L.; Bai, Z. Three-dimensional heteroatom-doped nanocarbon for metal-free oxygen reduction electrocatalysis: A review. Catalysts 2018, 8, 301. [Google Scholar] [CrossRef] [Green Version]
  24. Joucken, F.; Tison, Y.; Le Fèvre, P.; Tejeda, A.; Taleb-Ibrahimi, A.; Conrad, E.; Repain, V.; Chacon, C.; Bellec, A.; Girard, Y.; et al. Charge transfer and electronic doping in nitrogen-doped graphene. Sci. Rep. 2015, 5, 14564. [Google Scholar] [CrossRef] [Green Version]
  25. Yutomo, E.B.; Noor, F.A.; Winata, T. Effect of the number of nitrogen dopants on the electronic and magnetic properties of graphitic and pyridinic N-doped graphene—A density-functional study. RSC Adv. 2021, 11, 18371–18380. [Google Scholar] [CrossRef]
  26. Tang, C.; Zhang, Q. Nanocarbon for Oxygen Reduction Electrocatalysis: Dopants, Edges, and Defects. Adv. Mater. 2017, 29, 1604103. [Google Scholar] [CrossRef]
  27. Borghei, M.; Lehtonen, J.; Liu, L.; Rojas, O.J. Advanced Biomass-Derived Electrocatalysts for the Oxygen Reduction Reaction. Adv. Mater. 2018, 30, 1–27. [Google Scholar] [CrossRef]
  28. Yan, L.; Yu, J.; Houston, J.; Flores, N.; Luo, H. Biomass derived porous nitrogen doped carbon for electrochemical devices. Green Energy Environ. 2017, 2, 84–99. [Google Scholar] [CrossRef]
  29. Liu, J.; Zhang, T.; Wang, Z.; Dawson, G.; Chen, W. Simple pyrolysis of urea into graphitic carbon nitride with recyclable adsorption and photocatalytic activity. J. Mater. Chem. 2011, 21, 14398–14401. [Google Scholar] [CrossRef]
  30. Guilminot, E.; Gavillon, R.; Chatenet, M.; Berthon-Fabry, S.; Rigacci, A.; Budtova, T. New nanostructured carbons based on porous cellulose: Elaboration, pyrolysis and use as platinum nanoparticles substrate for oxygen reduction electrocatalysis. J. Power Sources 2008, 185, 717–726. [Google Scholar] [CrossRef]
  31. Bottani, E.J.; Tascόn, J.M.D. Adsorption by Carbons; Elsevier: Amsterdam, The Netherlands, 2008. [Google Scholar]
  32. Tarasenko, Y.O.; Zhurakvsky, S.V.; Dukhno, I.N.; Kartel, M.T.; Khavryuchenko, V.D. Modelling of interaction of cyanotriamide with a surface of the active carbons. Kharkov Univ. Bull. Chem. Ser. 2010, 932, 129–138. [Google Scholar]
  33. Biniak, S.; Szymański, G.; Siedlewski, J.; Świątkowski, A. The characterization of activated carbons with oxygen and nitrogen surface groups. Carbon NY 1997, 35, 1799–1810. [Google Scholar] [CrossRef]
  34. Dobele, G.; Dizhbite, T.; Gil, M.V.V.; Volperts, A.; Centeno, T. Production of nanoporous carbons from wood processing wastes and their use in supercapacitors and CO2 capture. Biomass Bioenergy 2012, 46, 145–154. [Google Scholar] [CrossRef] [Green Version]
  35. Biddinger, E.J.; Ozkan, U.S. Role of Graphitic Edge Plane Exposure in Carbon Nanostructures for Oxygen Reduction Reaction. J. Phys. Chem. C 2010, 114, 15306–15314. [Google Scholar] [CrossRef]
  36. She, Y.; Chen, J.; Zhang, C.; Lu, Z.-G.; Ni, M.; Sit, P.; Leung, M.K. Oxygen Reduction Reaction Mechanism of Nitrogen-Doped Graphene Derived from Ionic Liquid. Energy Procedia 2017, 142, 1319–1326. [Google Scholar] [CrossRef]
  37. Lai, L.; Potts, J.R.; Zhan, D.; Wang, L.; Poh, C.K.; Tang, C.; Gong, H.; Shen, Z.; Lin, J.; Ruoff, R.S. Exploration of the active center structure of nitrogen-doped graphene-based catalysts for oxygen reduction reaction. Energy Environ. Sci. 2012, 5, 7936–7942. [Google Scholar] [CrossRef]
  38. Wiggins-Camacho, J.D.; Stevenson, K. Effect of Nitrogen Concentration on Capacitance, Density of States, Electronic Conductivity, and Morphology of N-Doped Carbon Nanotube Electrodes. J. Phys. Chem. C 2009, 113, 19082–19090. [Google Scholar] [CrossRef]
  39. Guo, D.; Shibuya, R.; Akiba, C.; Saji, S.; Kondo, T.; Nakamura, J. Active sites of nitrogen-doped carbon materials for oxygen reduction reaction clarified using model catalysts. Science 2016, 351, 361–365. [Google Scholar] [CrossRef] [PubMed]
  40. Pylypenko, S.; Mukherjee, S.; Olson, T.S.; Atanassov, P. Non-platinum oxygen reduction electrocatalysts based on pyrolyzed transition metal macrocycles. Electrochim. Acta 2008, 53, 7875–7883. [Google Scholar] [CrossRef]
  41. Lazzarini, A.; Piovano, A.; Pellegrini, R.; Leofanti, G.; Agostini, G.; Rudić, S.; Chierotti, M.R.; Gobetto, R.; Battiato, A.; Spoto, G.; et al. A comprehensive approach to investigate the structural and surface properties of activated carbons and related Pd-based catalysts. Catal. Sci. Technol. 2016, 6, 4910–4922. [Google Scholar] [CrossRef] [Green Version]
  42. Ferrari, A.C.; Robertson, J. Interpretation of Raman spectra of disordered and amorphous carbon. Phys. Rev. B 2000, 61, 14095–14107. [Google Scholar] [CrossRef] [Green Version]
  43. Hara, M.; Yoshida, T.; Takagaki, A.; Takata, T.; Kondo, J.; Hayashi, S.; Domen, K. A Carbon Material as a Strong Protonic Acid. Angew. Chem. Int. Ed. 2004, 43, 2955–2958. [Google Scholar] [CrossRef]
  44. Zhao, C.; Wang, Q.; Lu, Y.; Li, B.; Chen, L.; Hu, Y.-S. High-temperature treatment induced carbon anode with ultrahigh Na storage capacity at low-voltage plateau. Sci. Bull. 2018, 63, 1125–1129. [Google Scholar] [CrossRef] [Green Version]
  45. Ferrero, G.A.; Preuss, K.; Fuertes, A.B.; Sevilla, M.; Titirici, M.-M. The influence of pore size distribution on the oxygen reduction reaction performance in nitrogen doped carbon microspheres. J. Mater. Chem. A 2016, 4, 2581–2589. [Google Scholar] [CrossRef] [Green Version]
  46. Jurkiewicz, K.; Pawlyta, M.; Burian, A. Structure of Carbon Materials Explored by Local Transmission Electron Microscopy and Global Powder Diffraction Probes. J. Carbon Res. 2018, 4, 68. [Google Scholar] [CrossRef] [Green Version]
  47. Kaare, K.; Yu, E.; Käämbre, T.; Volperts, A.; Dobele, G.; Zhurinsh, A.; Niaura, G.; TamasauskaiteTamasiunaite, L.; Norkus, E.; Kruusenberg, I. Biomass-derived Graphene-like Catalyst Material for Oxygen Reduction Reaction. ChemNanoMat 2021, 7, 307–313. [Google Scholar] [CrossRef]
  48. Lide, D.R. Handbook of Chemistry and Physics, 81st ed.; CRC Press: Boca Raton, FL, USA, 2000. [Google Scholar]
  49. Davis, R.; Horvath, G.; Tobias, C. The solubility and diffusion coefficient of oxygen in potassium hydroxide solutions. Electrochimica Acta 1967, 12, 287–297. [Google Scholar] [CrossRef]
  50. Ratso, S.; Kruusenberg, I.; Vikkisk, M.; Joost, U.; Shulga, E.; Kink, I.; Kallio, T.; Tammeveski, K. Highly active nitrogen-doped few-layer graphene/carbon nanotube composite electrocatalyst for oxygen reduction reaction in alkaline media. Carbon NY 2014, 73, 361–370. [Google Scholar] [CrossRef]
  51. Ratso, S.; Kruusenberg, I.; Joost, U.; Saar, R.; Tammeveski, K. Enhanced oxygen reduction reaction activity of nitrogen-doped graphene/multi-walled carbon nanotube catalysts in alkaline media. Int. J. Hydrogen Energy 2016, 41, 22510–22519. [Google Scholar] [CrossRef]
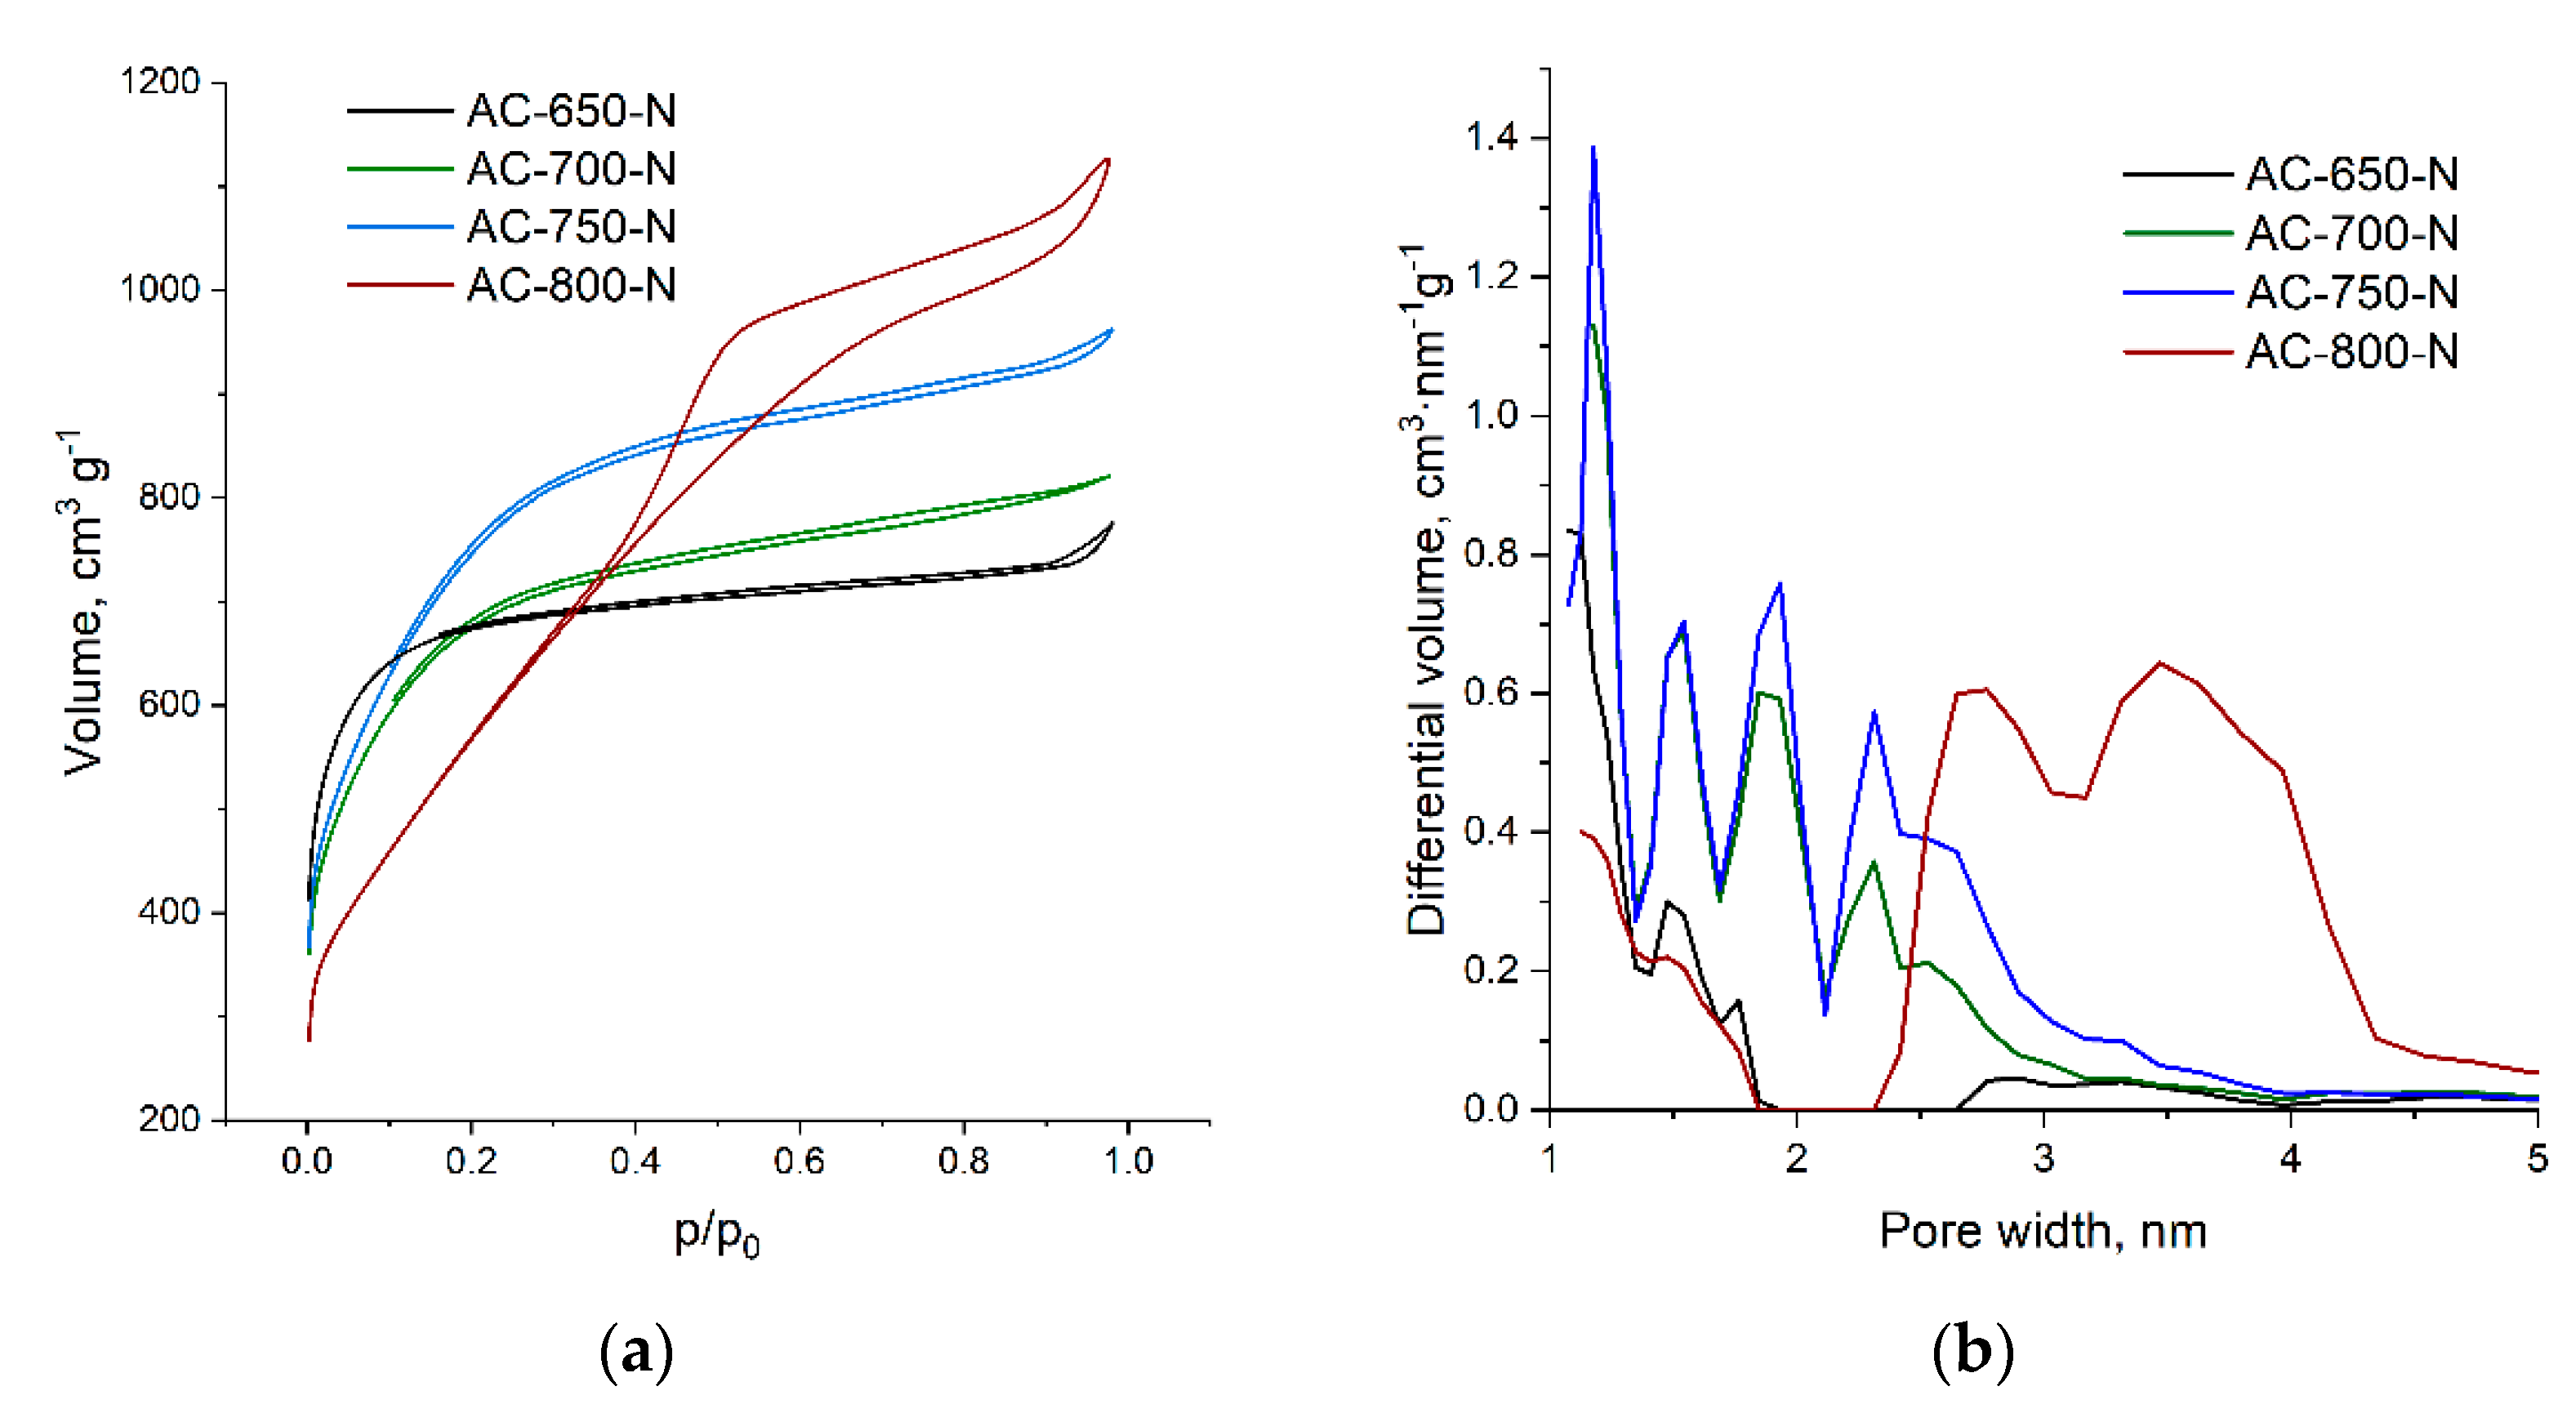
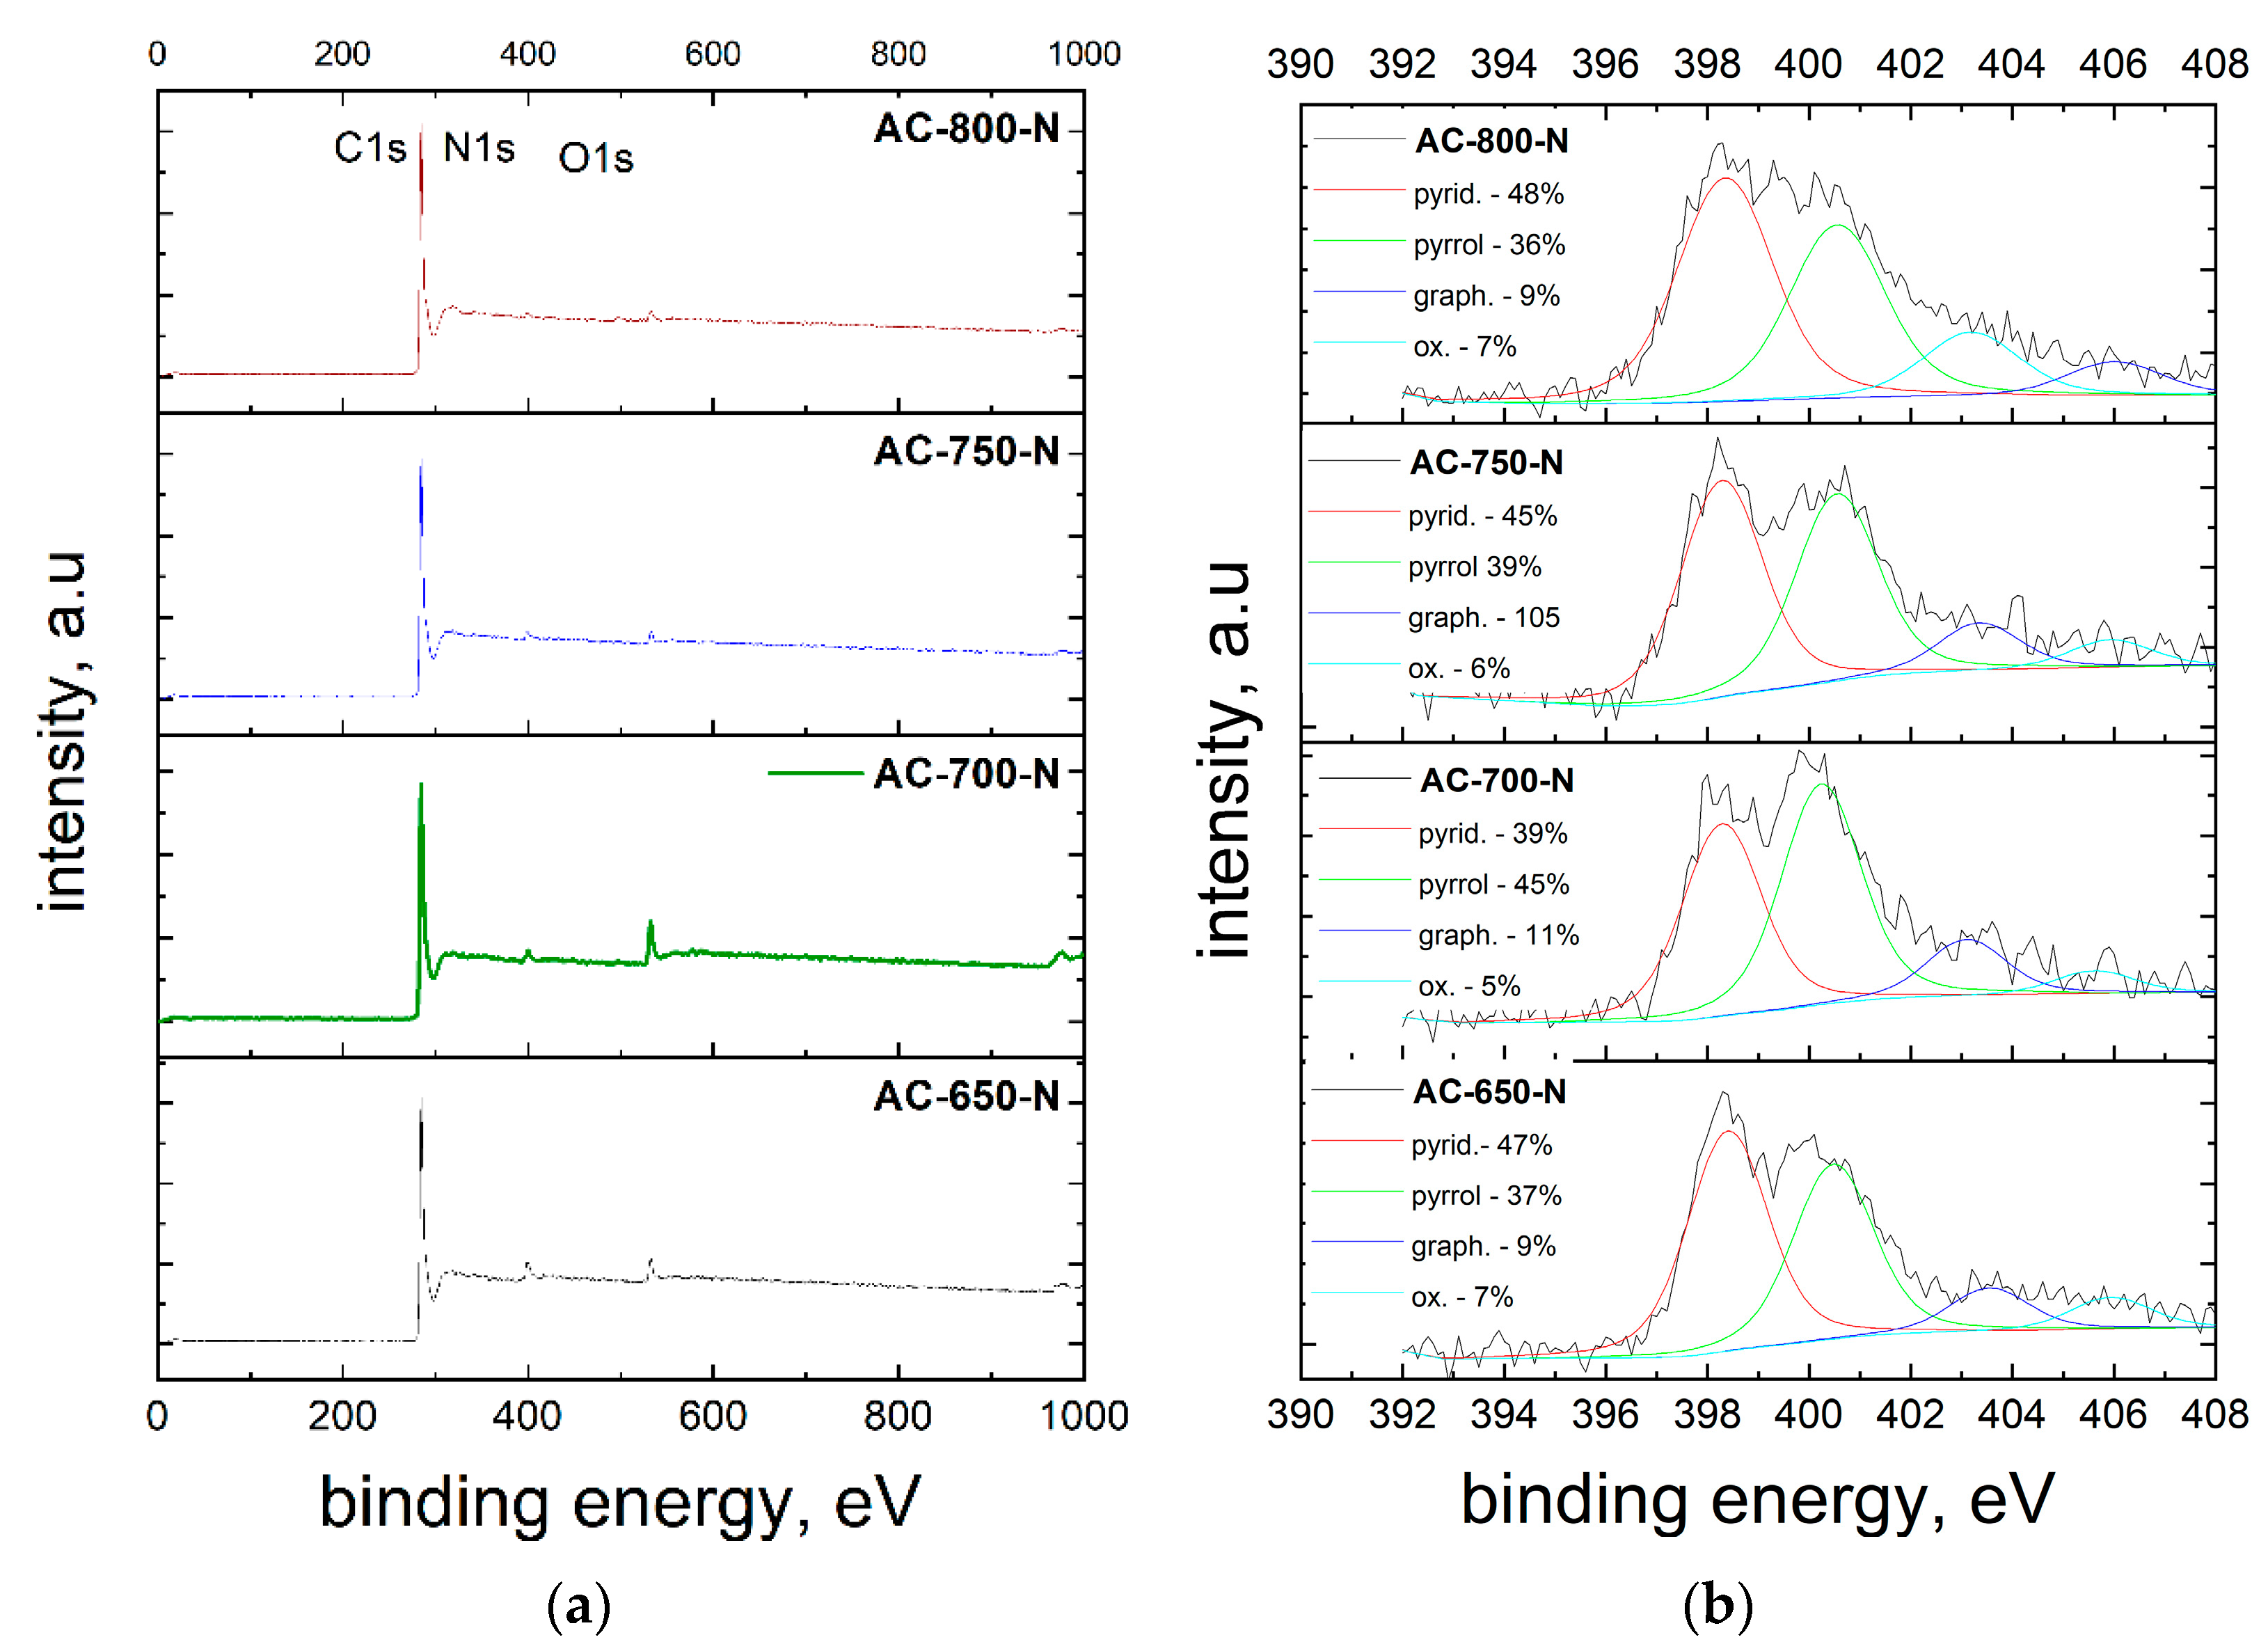
Figure 1. N-doped, wood-based activated carbon nitrogen sorption isotherms at 77 K (a) and pore size distributions (b), depending on activation temperature.
Catalysts 11 01460 g001
Figure 2. XPS study of nitrogen-doped, wood-based activated carbons synthesized at various temperatures. (a) XPS survey of samples under study; (b) deconvoluted high-resolution N1 spectra of samples under study and the relative content of various nitrogen-related peaks.
Catalysts 11 01460 g002
Figure 3. Raman spectra of wood-based, nitrogen-doped activated carbons synthesized at various temperatures (a); X-ray diffraction spectra of wood-based, nitrogen-doped activated carbons synthesized at various temperatures (b).
Catalysts 11 01460 g003
Figure 4. RDE polarization curves of GC electrodes modified with wood-based, nitrogen-doped activated carbons synthesized at (a) 650 °C, (b) 700 °C, (c) 750 °C and (d) 800 °C temperatures in O2 saturated 0.1 M KOH (ν = 10 mV s−1) measured at various rotation speeds.
Catalysts 11 01460 g004
Figure 5. RDE polarization curves of GC electrodes modified with wood-based, nitrogen-doped activated carbons synthesized at various temperatures and commercial 20% Pt/C in O2 saturated 0.1 M KOH (ν = 10 mV s−1, ω = 1900 rpm) (a). Changes in the number of transferred electrons, n (per O2 molecule), depending on the mesopore volume ratio (b).
Catalysts 11 01460 g005
Figure 6. Koutecky-Levich plots derived from the experimental data shown in Figure 4d (GC electrodes modified with wood-based, nitrogen-doped activated carbon synthesized at 800 °C, AC-800-N) (a). The potential dependence of n (number of transferred electrons per O2 molecule) (b).
Catalysts 11 01460 g006
Table 1. Porosity, yield and elemental composition of nitrogen-doped, wood-based activated carbons.
SamplesTactivationSBET,SDFTVmicroVmesoYield *NCHO
°Cm2 g−1m2 g−1cm3 g−1cm3 g−1%%%%%
AC-650-N650202115820.940.2631.27.5289.530.682.27
AC-700-N700243516750.650.6224.95.5590.970.892.59
AC-750-N750272817640.860.6320.23.4293.080.722.78
AC-800-N800192413830.611.1419.22.4894.982.061.48
* calculated to o.d. charcoal.
Publisher’s Note: MDPI stays neutral with regard to jurisdictional claims in published maps and institutional affiliations.

