Article

Towards Computer-Aided Graphene Covered TiO2-Cu/(CuxOy) Composite Design for the Purpose of Photoinduced Hydrogen Evolution

by
Łukasz Lewandowski
1,
Agnieszka Gajewicz-Skretna
2,
Tomasz Klimczuk
3,
Grzegorz Trykowski
4,
Kostiantyn Nikiforow
5,
Wojciech Lisowski
5,
Anna Gołąbiewska
1,* and
Adriana Zaleska-Medynska
1,*
1
Department of Environmental Technology, Faculty of Chemistry, University of Gdansk, ul. Wita Stwosza 63, 80-308 Gdansk, Poland
2
Laboratory of Environmental Chemometrics, Faculty of Chemistry, University of Gdansk, ul. Wita Stwosza 63, 80-308 Gdansk, Poland
3
Department of Solid State Physics, Faculty of Applied Physics and Mathematics, Gdansk University of Technology, 80-233 Gdansk, Poland
4
Instrumental Analyses Laboratory, Faculty of Chemistry, Nicolaus Copernicus University in Torun, 87-100 Torun, Poland
5
Laboratory of Surface Analysis, Institute of Physical Chemistry, Polish Academy of Sciences, 01-224 Warszawa, Poland
*
Authors to whom correspondence should be addressed.
Submission received: 10 May 2021 / Revised: 28 May 2021 / Accepted: 29 May 2021 / Published: 31 May 2021
(This article belongs to the Special Issue Novel Photocatalysts for Environmental and Energy Applications)

Abstract

:
In search a hydrogen source, we synthesized TiO2-Cu-graphene composite photocatalyst for hydrogen evolution. The catalyst is a new and unique material as it consists of copper-decorated TiO2 particles covered tightly in graphene and obtained in a fluidized bed reactor. Both, reduction of copper from Cu(CH3COO) at the surface of TiO2 particles and covering of TiO2-Cu in graphene thin layer by Chemical Vapour Deposition (CVD) were performed subsequently in the flow reactor by manipulating the gas composition. Obtained photocatalysts were tested in regard to hydrogen generation from photo-induced water conversion with methanol as sacrificial agent. The hydrogen generation rate for the most active sample reached 2296.27 µmol H2 h−1 gcat−1. Combining experimental and computational approaches enabled to define the optimum combination of the synthesis parameters resulting in the highest photocatalytic activity for water splitting for green hydrogen production. The results indicate that the major factor affecting hydrogen production is temperature of the TiO2-Cu-graphene composite synthesis which in turn is inversely correlated to photoactivity.

1. Introduction

Carbon nanostructures are widely used materials due to their unique properties: well developed large specific surface area, high electron mobility, excellent thermal conductivity and flexible structure. One of the most promising carbon nanostructures is graphene. Despite the great application potential, it is worth mentioning that graphene itself possesses zero band gap as well as inertness to reaction, which weakens the competitive strength of graphene in the field of semiconductors and sensors. Nonetheless, combinations of graphene with semiconductors have wide reaching implications for the applications in heterogeneous photocatalysis and energy storage. The graphene provides not only the support to the photocatalyst but it also improves the adsorption of organic molecules, increase charge separation, and facilitate charge transport [1]. The photocatalytic enhancement is largely attributed to the improved charge separation as induced by the efficient photoelectron extraction by the attached graphene. The direct contact between graphene and the photocatalyst is crucial for efficient interfacial photoelectrons extraction that in turn minimizes the bulk recombination within the photocatalyst. Graphene is also reported to improve the stability of the semiconductor photocatalyst [2]. According to the literature the grapheme—TiO2 nanostructures are one of the promising nanomaterials in photocatalysis and arewidely used [1,3,4,5,6]. Furthermore, the combination of TiO2-graphene with a noble metal (such as: gold, platinum and silver) additionally can improve the photocatalytic properties of nanocomposite [7,8,9,10,11,12]. The TiO2-Cu-graphene composites have proven to combine very promising photochemical properties with a relatively low materials cost but there are still limited papers in theliterature [13,14,15,16,17]. Most of the above mentioned photocatalysts have been synthesized so far via “wet chemistry” method and represent a wide array of products that are different in terms of morphology/nanostructure, none of which is a graphene covered nanoparticle identical on the one described in this paper. In this regard in the present work, we demonstrate an entirely new material for hydrogen evolution from water photoconversion. The material novelty lies within its unique structure—TiO2 decorated with Cu-based nanoparticles and tightly covered in graphene sheath. Additionally, the method is unprecedented and material is obtained in a newly developed, fluidized bed reactor [18]. The synthesis process is conducted in a gas suspension as opposite to more common wet chemistry methods. In order to maximize the efficiency and reduce the cost of design of new graphene covered TiO2-Cu/(CuxOy) composites for the photoinduced hydrogen evolution, computer-aided modelling methods were additionally employed. The undoubted advantage of the virtualization of the new material design process is the possibility to perform a virtual pre-synthesis screening with a great focus on testing of various combinations of the synthesis parameters and/or different kinds of chemical and structure modifications. This provides plenty of support in selecting the most appropriate synthesis parameter combination, resulting in obtaining the material having the properties required for the maximum yield of hydrogen evolution from water photoconversion. Guided by a literature review as well as ourown expertise and experience we have focused in the present study on the influence of the following synthesis conditions: different temperature and graphene synthesis times on the hydrogen production. Hence, by combining experiments with theoretical investigations deeper insights into the optimal synthesis parameter combination for the maximum yield of hydrogen generation were gained.

2. Results

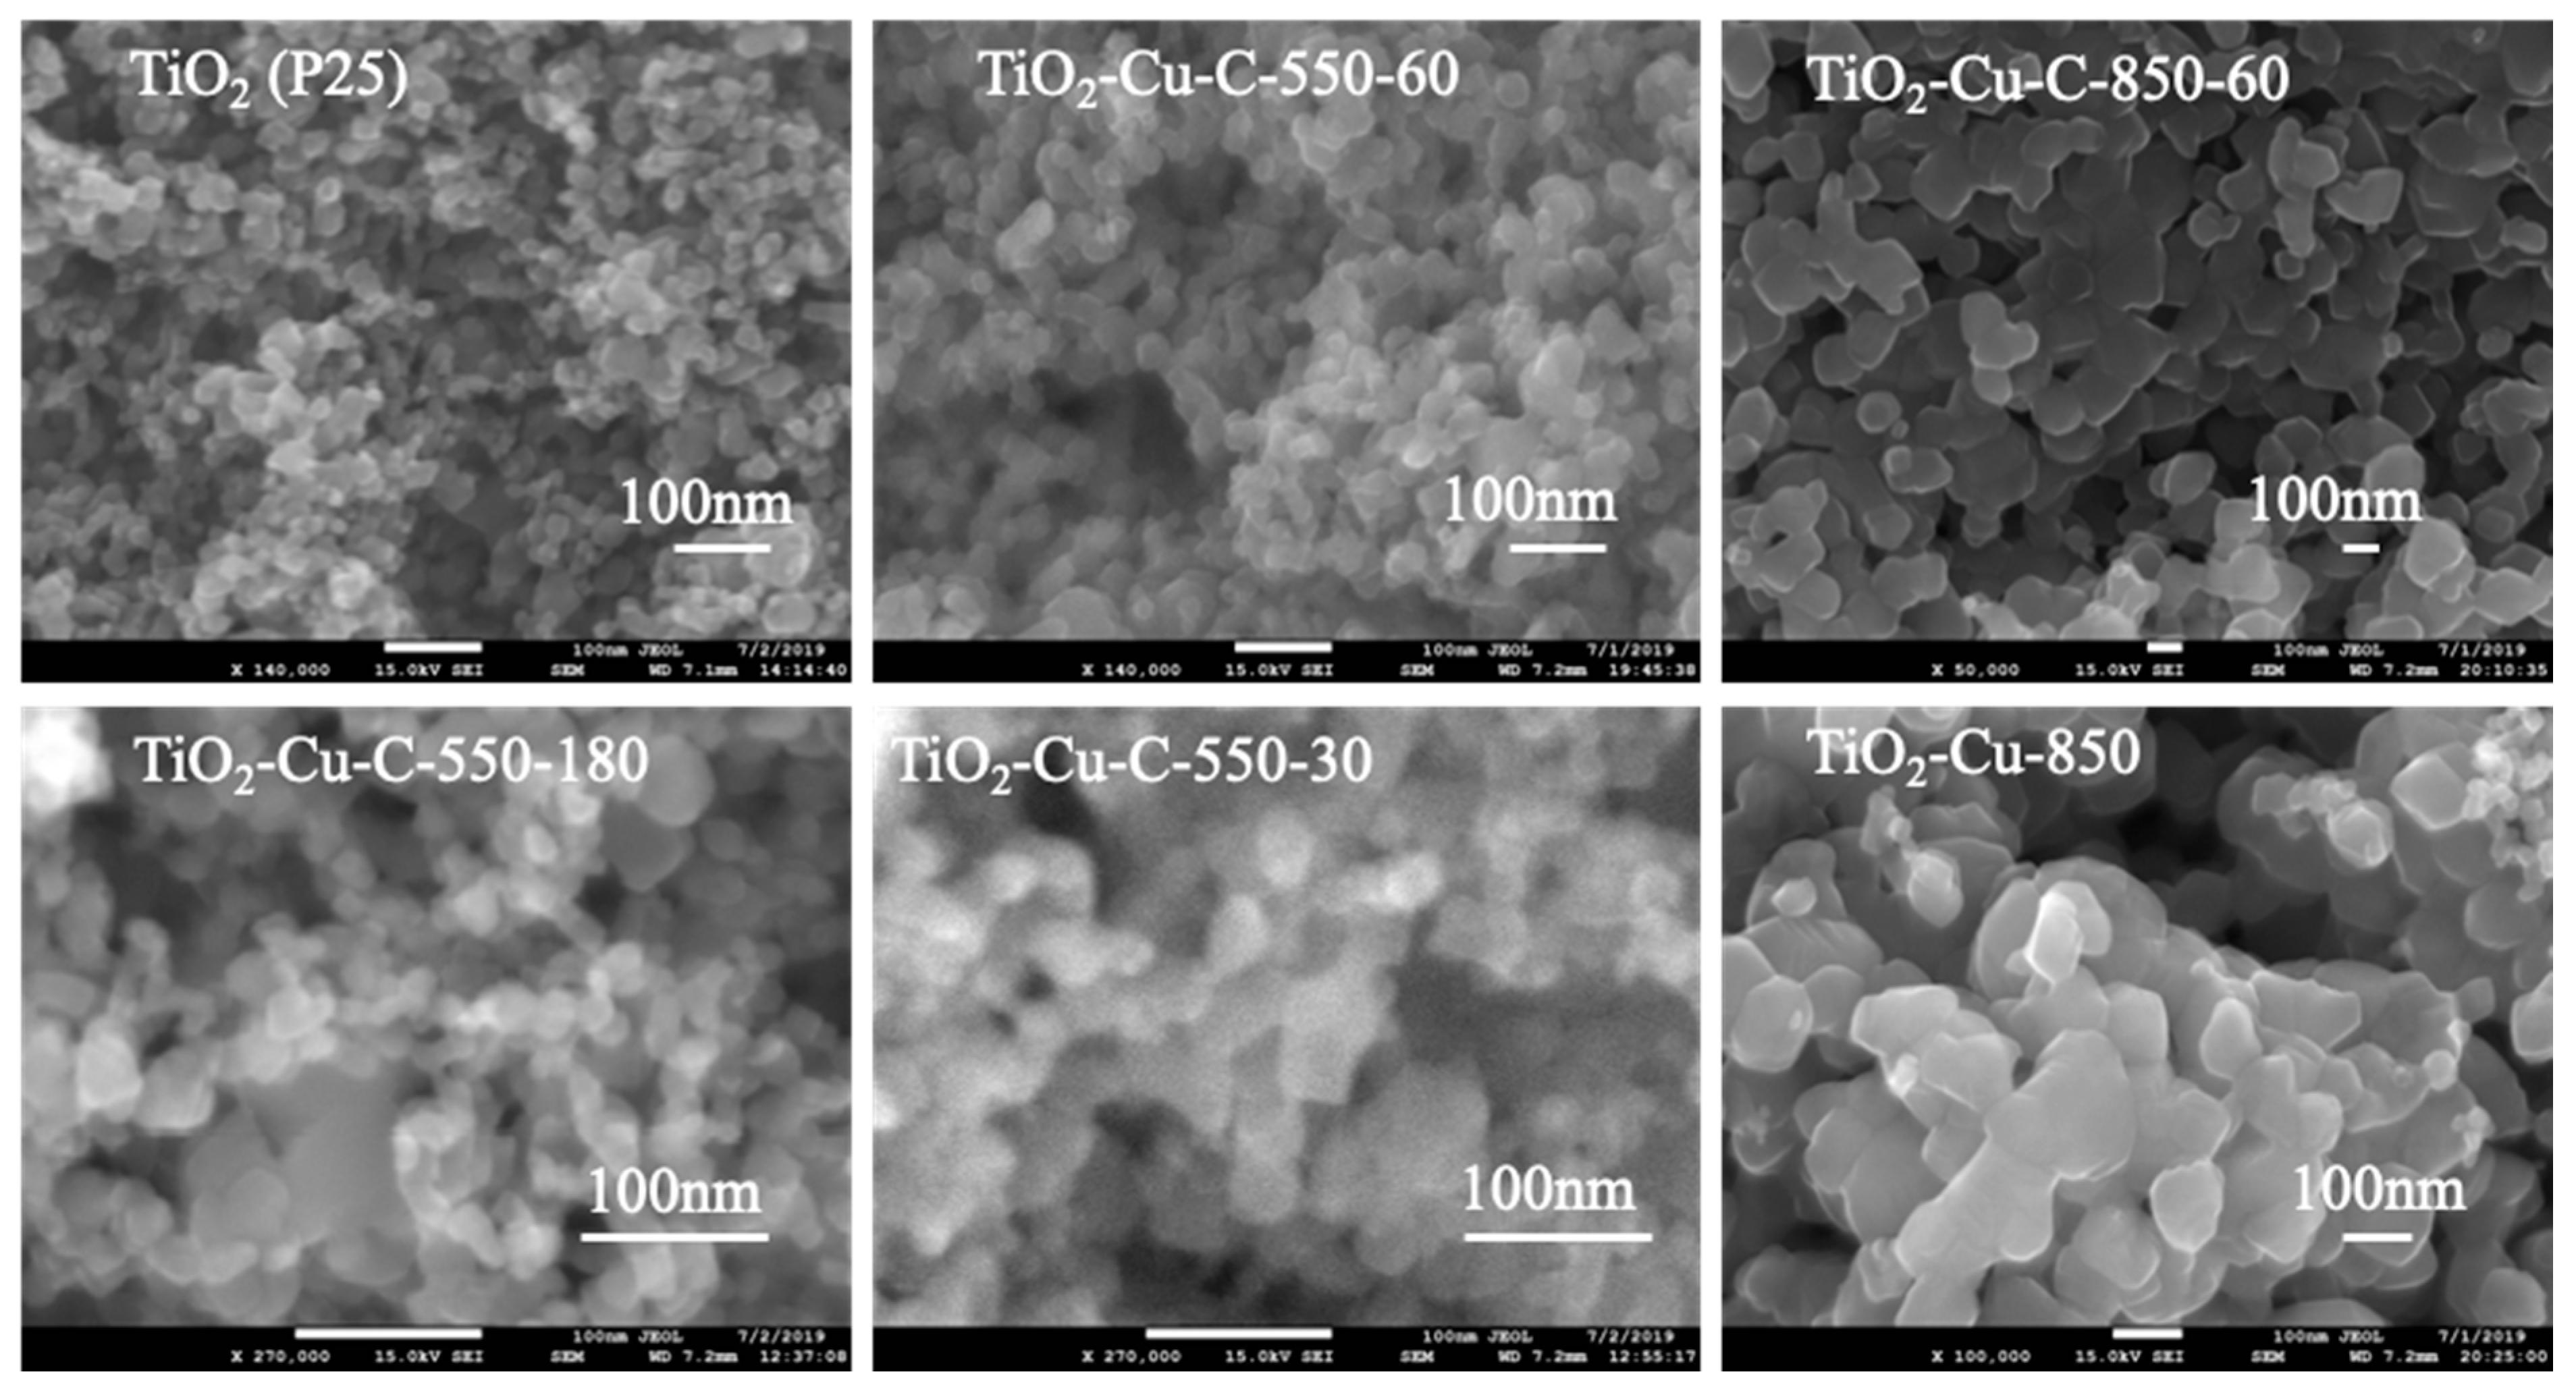
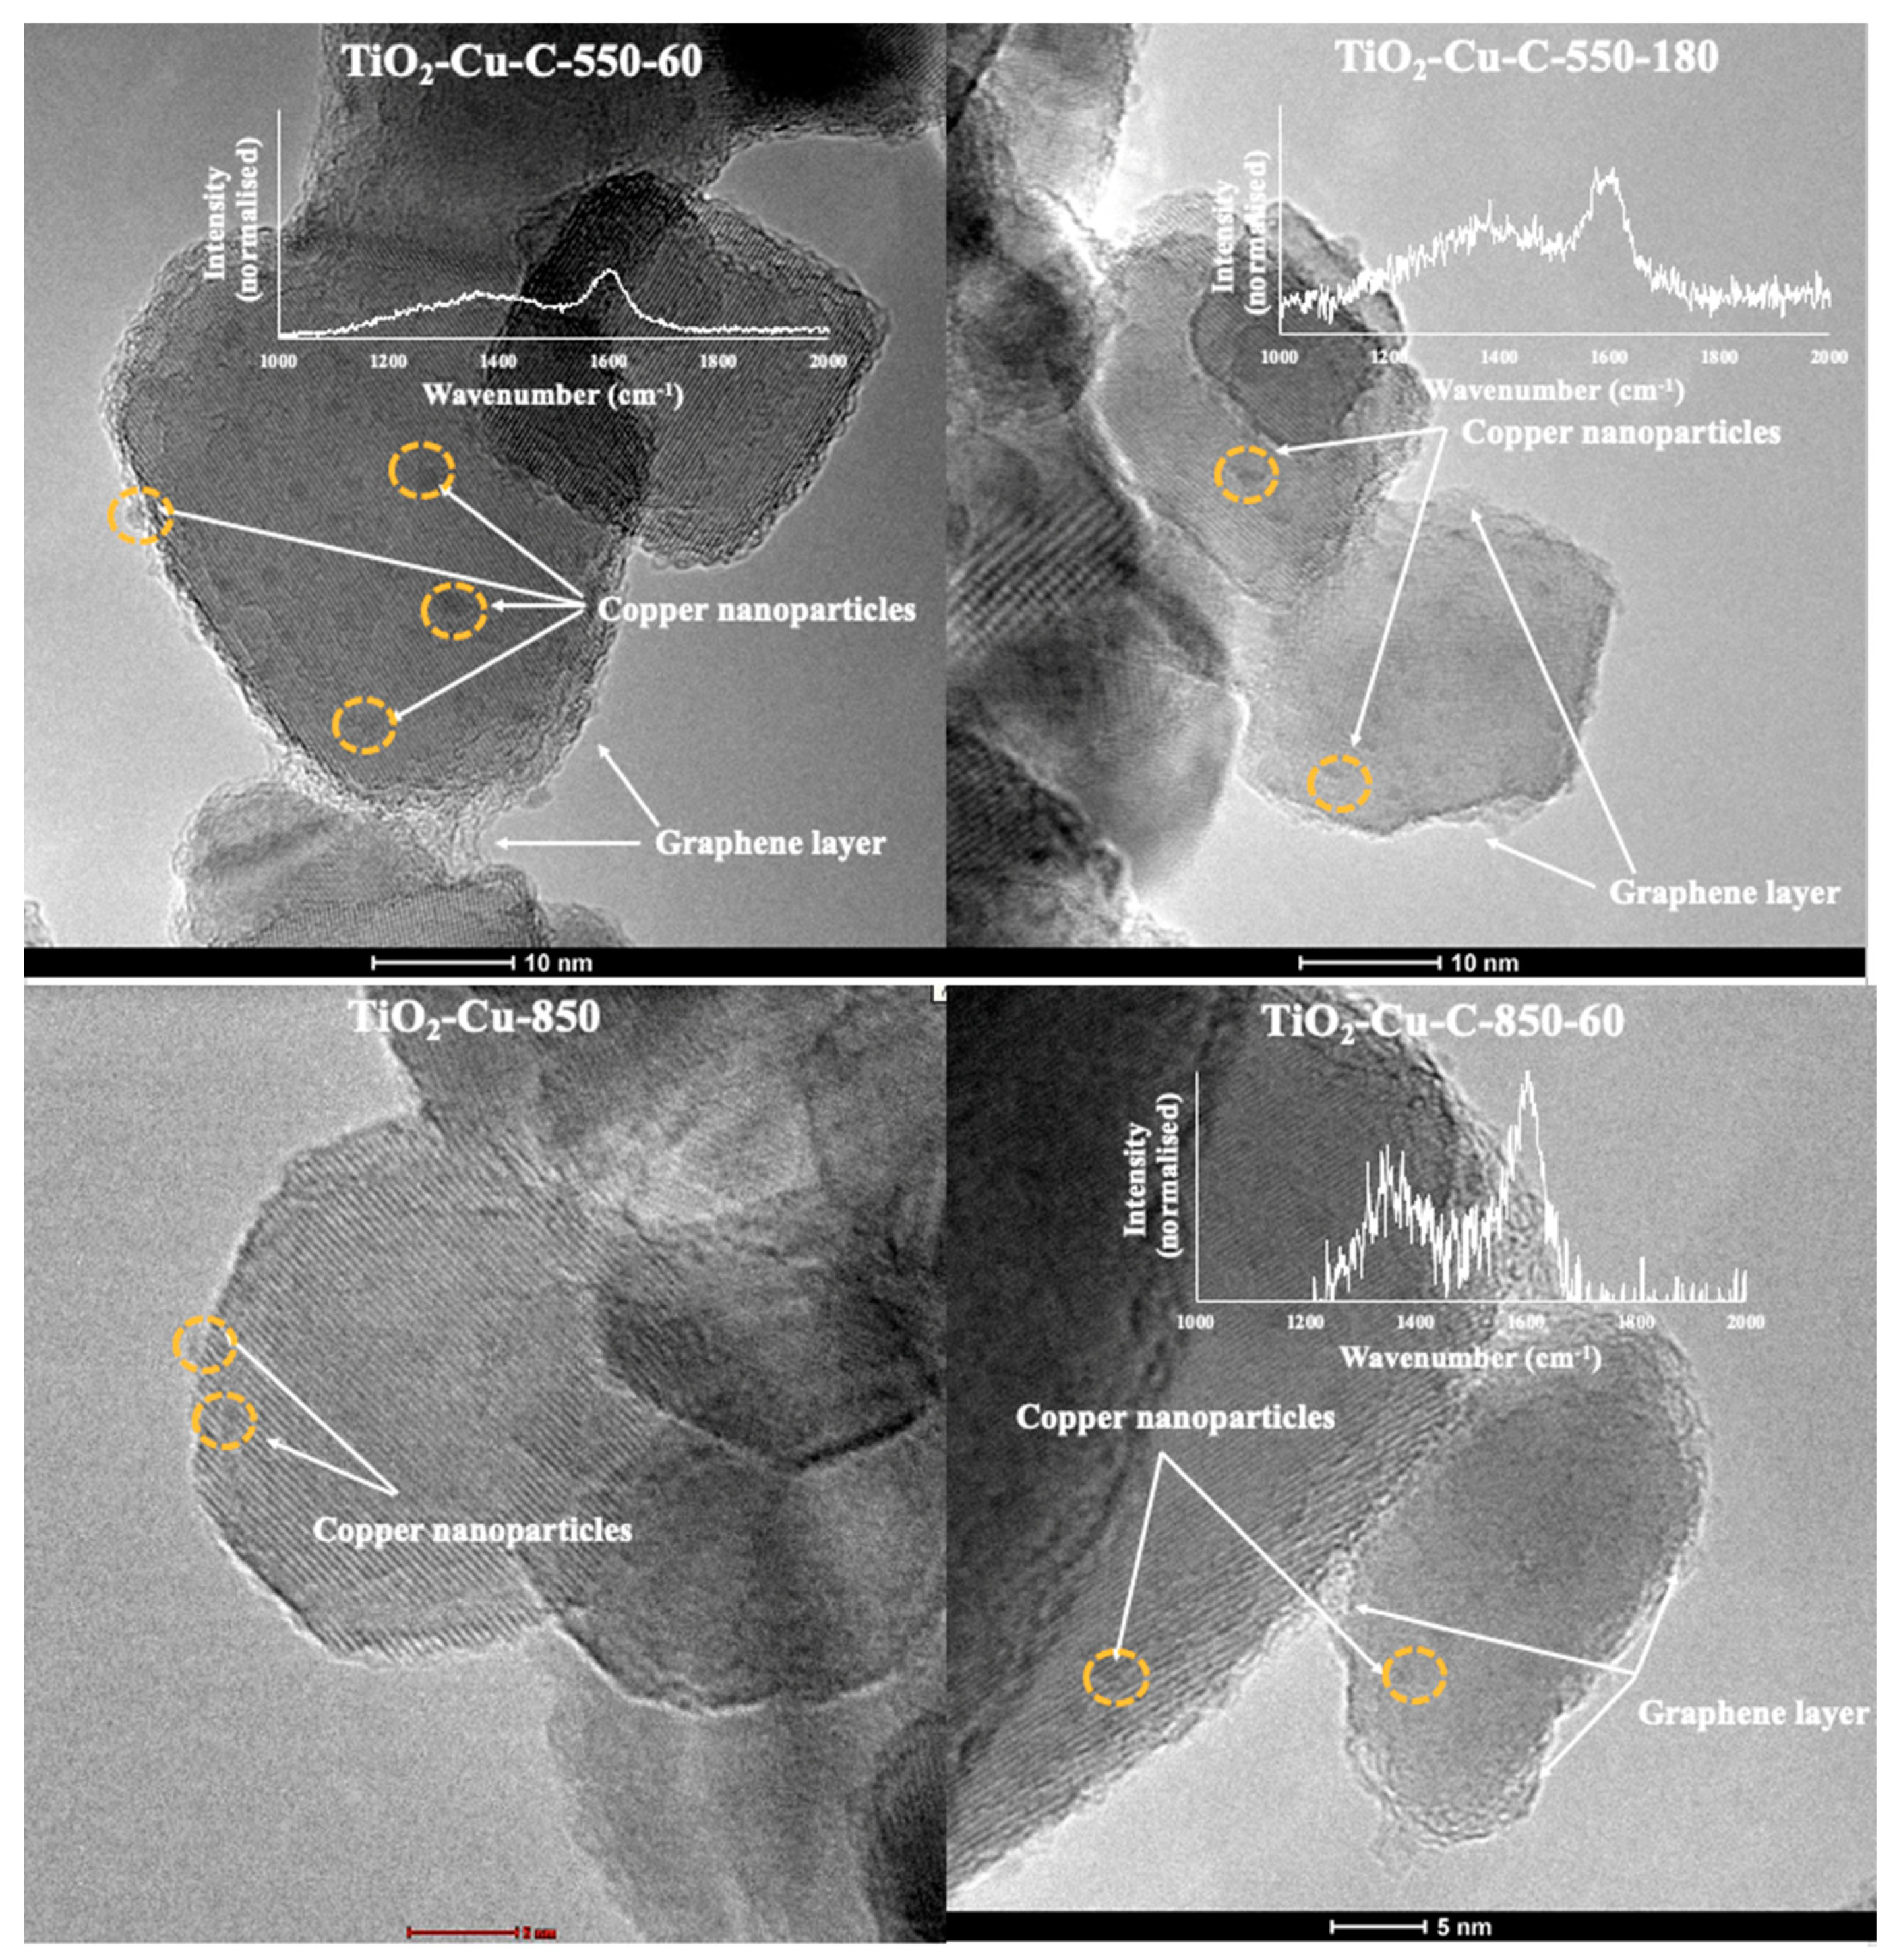
2.1. Morphology and Raman Spectra

As demonstrated by SEM imaging (Figure 1), all samples consist of irregular-shaped particles, mostly varying in size from 10 to 50 nm in diameter (similarly to pristine P25) with randomly occurring larger particles (up to 100 nm).
In thecase of samples synthesized at 850 °C (both most right-side images in Figure 1) the size of particles is significantly larger, with most grains exceeding 100 nm possibly due to particles sintering and leading to a decrease in surface area per gram of sample. Finer details are revealed by TEM imaging and Raman spectra (for selected samples) presented in Figure 2.
For the purpose of this work, Raman spectra have been normalized against the anatase TiO2 tallest peak (~14 cm−1) in case of samples obtained below 600 °C and rutile tallest peak (~610 cm−1) in case of samples obtained above 600 °C (Figure S2 in supporting information). The tallest peak was artificially set to the intensity of 1000 and the rest of the intensity values were adjusted accordingly. The normalization was done by the following formula:
Inorm = [I × (100,000 × Imax)]/100
where Inorm is the normalized intensity, Imax is the maximal intensity (intensity at 140 cm−1 and 610 cm−1 for samples obtained < 600 °C and > 600 °C respectively), I is the raw intensity. Pristine P25 TiO2 Raman scans show no peaks at D and G bands (~1350 and ~1590 cm−1 respectively) demonstrating lack of any graphene layer. The same is true for the samples containing copper, yet not subjected to graphene generation procedure (TiO2-Cu-550; TiO2-Cu-850) and those subjected to graphene generation procedure but not containing any copper (TiO2-C-550-30). Remaining samples (containing Cu and subjected to graphene generation) show visible D and G band peaks, indicating the presence of graphitic carbon [18,19,20,21,22,23,24,25]. The sp3-hybridized carbon atoms at 1350 cm−1 (D band) and sp2-bonded carbon atoms (G band) at 1590 cm−1. The D band is commonly assigned to disorder vibration of graphene, and G band is bound up with vibration of sp2 carbon atoms. Based on the results it was observed that the increased intensity of the D and mainly G band peaks in the Raman spectra can be found wby increasing the time of chemical vapour deposition process. The increase in sp2 defects can be attributed to (i) elevated of graphene amount which is related to the synthesis time and (ii) chemical linkage between TiO2 and graphene layers [26]. An attempt was made to measure the graphene wall thickness and Cu nanoparticles diameter based on TEM images. Additionally, G/D band intensity ratio was calculated for selected samples. Results are gathered in Table 1 for selected samples.
Copper was deposited on the TiO2 matrix by reducing Cu(CH3COO) with hydrogen at high temperatures, resulting in formation of metallic copper nanoparticles ~1–2 nm in diameter, scattered irregularly across the surface of TiO2 crystals. Copper-based nanoparticles are visible in all copper-modified samples and are confirmed by an XRD scan (Figure 3b–e) in Section 2.2. The graphene material is not clearly visible in most of the samples, despite the Raman spectra indicating its presence. Lack of any discrete, carbon-based particles (flakes, sheets, rods, tubes etc.) coupled with clearly pronounced D and G band peaks lead to the conclusion that the copper-modified TiO2 particles are indeed covered in graphene-like material as intended. A thin graphene layer, easy to miss, is visible around TiO2-Cu (marked in TiO2-Cu-C-550-10, TiO2-Cu-C-550-180, TiO2-Cu-C-550-60, TiO2-Cu-C-850-60 images in Figure 4), especially at places where two particles come in contact creating a cavity where excess carbon is deposited and becomes visible. The above leads to a conclusion, that the obtained material is in the form of copper modified TiO2 particles covered/encapsulated in a very thin graphene coat.

2.2. XRD

Figure 3 presents pXRD patterns for a series of studied samples. Experimental data points are shown by points whereas a solid blue line represents a model containing two tetragonal phases of TiO2: atanase (I 41/amd) and rutile (P42/mnm).
The profile refinement (LeBail method) was used to calculate lattice parameters (gathered in Table 2) and confirm chemical purity of the samples.
As can be seen in panels (a)–(d) the starting material (P25) and samples treated below 600 °C contain both anatase and rutile form of TiO2. The estimated lattice parameters are almost the same—they do not change more than 0.1%. A rough estimation of the crystallite size (d) of the anatase was done by using the Scherrer equation and the shape of the first (011) reflection, 2θ = 25.3 deg. The rough estimation gives d~200 Å. Higher temperature (800 °C) causes full anatase transition to the rutile form with calculated lattice parameters comparable with the values obtained for samples treated at lower temperatures. Two, small intensity reflections of Cu were detected for sample TiO2-Cu-850 (Figure 3e) and are marked by arrows. We certainly do not observe traces of graphite. This is in agreement with the work by Wang et. al. [19] who attributes the lack of graphitic material traces in XRD scans to the proximity of the main graphene and anatase peaks and also to a very low mass fraction of graphene in the obtained material.
The DRS-UV-VIS spectra of the obtained samples are demonstrated in Figure 4 The pristine TiO2 nanoparticles show a pronounced absorption in the UV region.
The addition of graphene increased light absorption intensity and had a slight red shift and this results it can be caused by the hybridization of C2p and O2p atomic orbits to form a new valance band [27]. Additionally, the presence of copper shifts its absorption edge toward higher wavelength. In the case sample TiO2-Cu-850 the redshift of the absorption edge is associated to the narrowing of the bandgap as a result of the transformation of anatase to rutile phase on annealing. This is in accordance with the observation from the XRD measurements. Other than this absorption band, copper-modified specimens were shown to possess a band in the low-energy region, centered at around 700–800 nm, and belonging to Cu2+ d–d electronic transitions [28].

2.3. XPS

Chemical composition analysis of the samples was performed using XRAY photoelectron spectroscopy (XPS). High resolution XPS spectra of the Ti2p (Figure 5a) region reveals spin-orbit doublet with two peaks centered at around 458.7 eV BE (Ti2p 3/2) and 464.4 eV BE (Ti2p1/2). Position of the Ti2p 3/2 peak as well as a doublet separation (5.7 eV) are typical for titanium oxide (IV) [29].
Those data are in an agreement withthe XRD measurement. Titanium XPS spectra of the treated samples remain very similar to the reference TiO2 sample indicating that no chemical changes to TiO2 occurs in the course of the treatment. XPS confirms the presence of the copper in the treated samples. Due to spin-orbit coupling Cu2p state is present (Figure 5b) as a peak doublet (2p3/2 and 2p1/2) with two group of peaks at around 933 eV (Cu 2p3/2) and 953 eV (Cu 2p1/2). Deconvolution of Cu2p3/2 peak suggests 2 chemical states of copper. The Cu 2p3/2 peak located at around 932.7 eV could be attributed to a presence of the copper (0) or copper oxide (I) since both those compounds occupy the same position on the XPS spectrum [30]. That suggestion is a good agreement with the TEM and XRD data, confirming presence of the copper in samples. Unfortunately, further differentiation of those substances in our samples is nearly impossible due to overlapping of the Ti2s peak and auger Cu LMM peak that usually used for that purpose [31]. The origin of the second Cu 2p3/2 peak located at higher binding energy (935 eV) could be the initial source of the copper in samples—copper acetate [32]. That theory is also confirmed by the high intensity of the C1s peak observed at 289 eV usually attributed to COOR group [33].

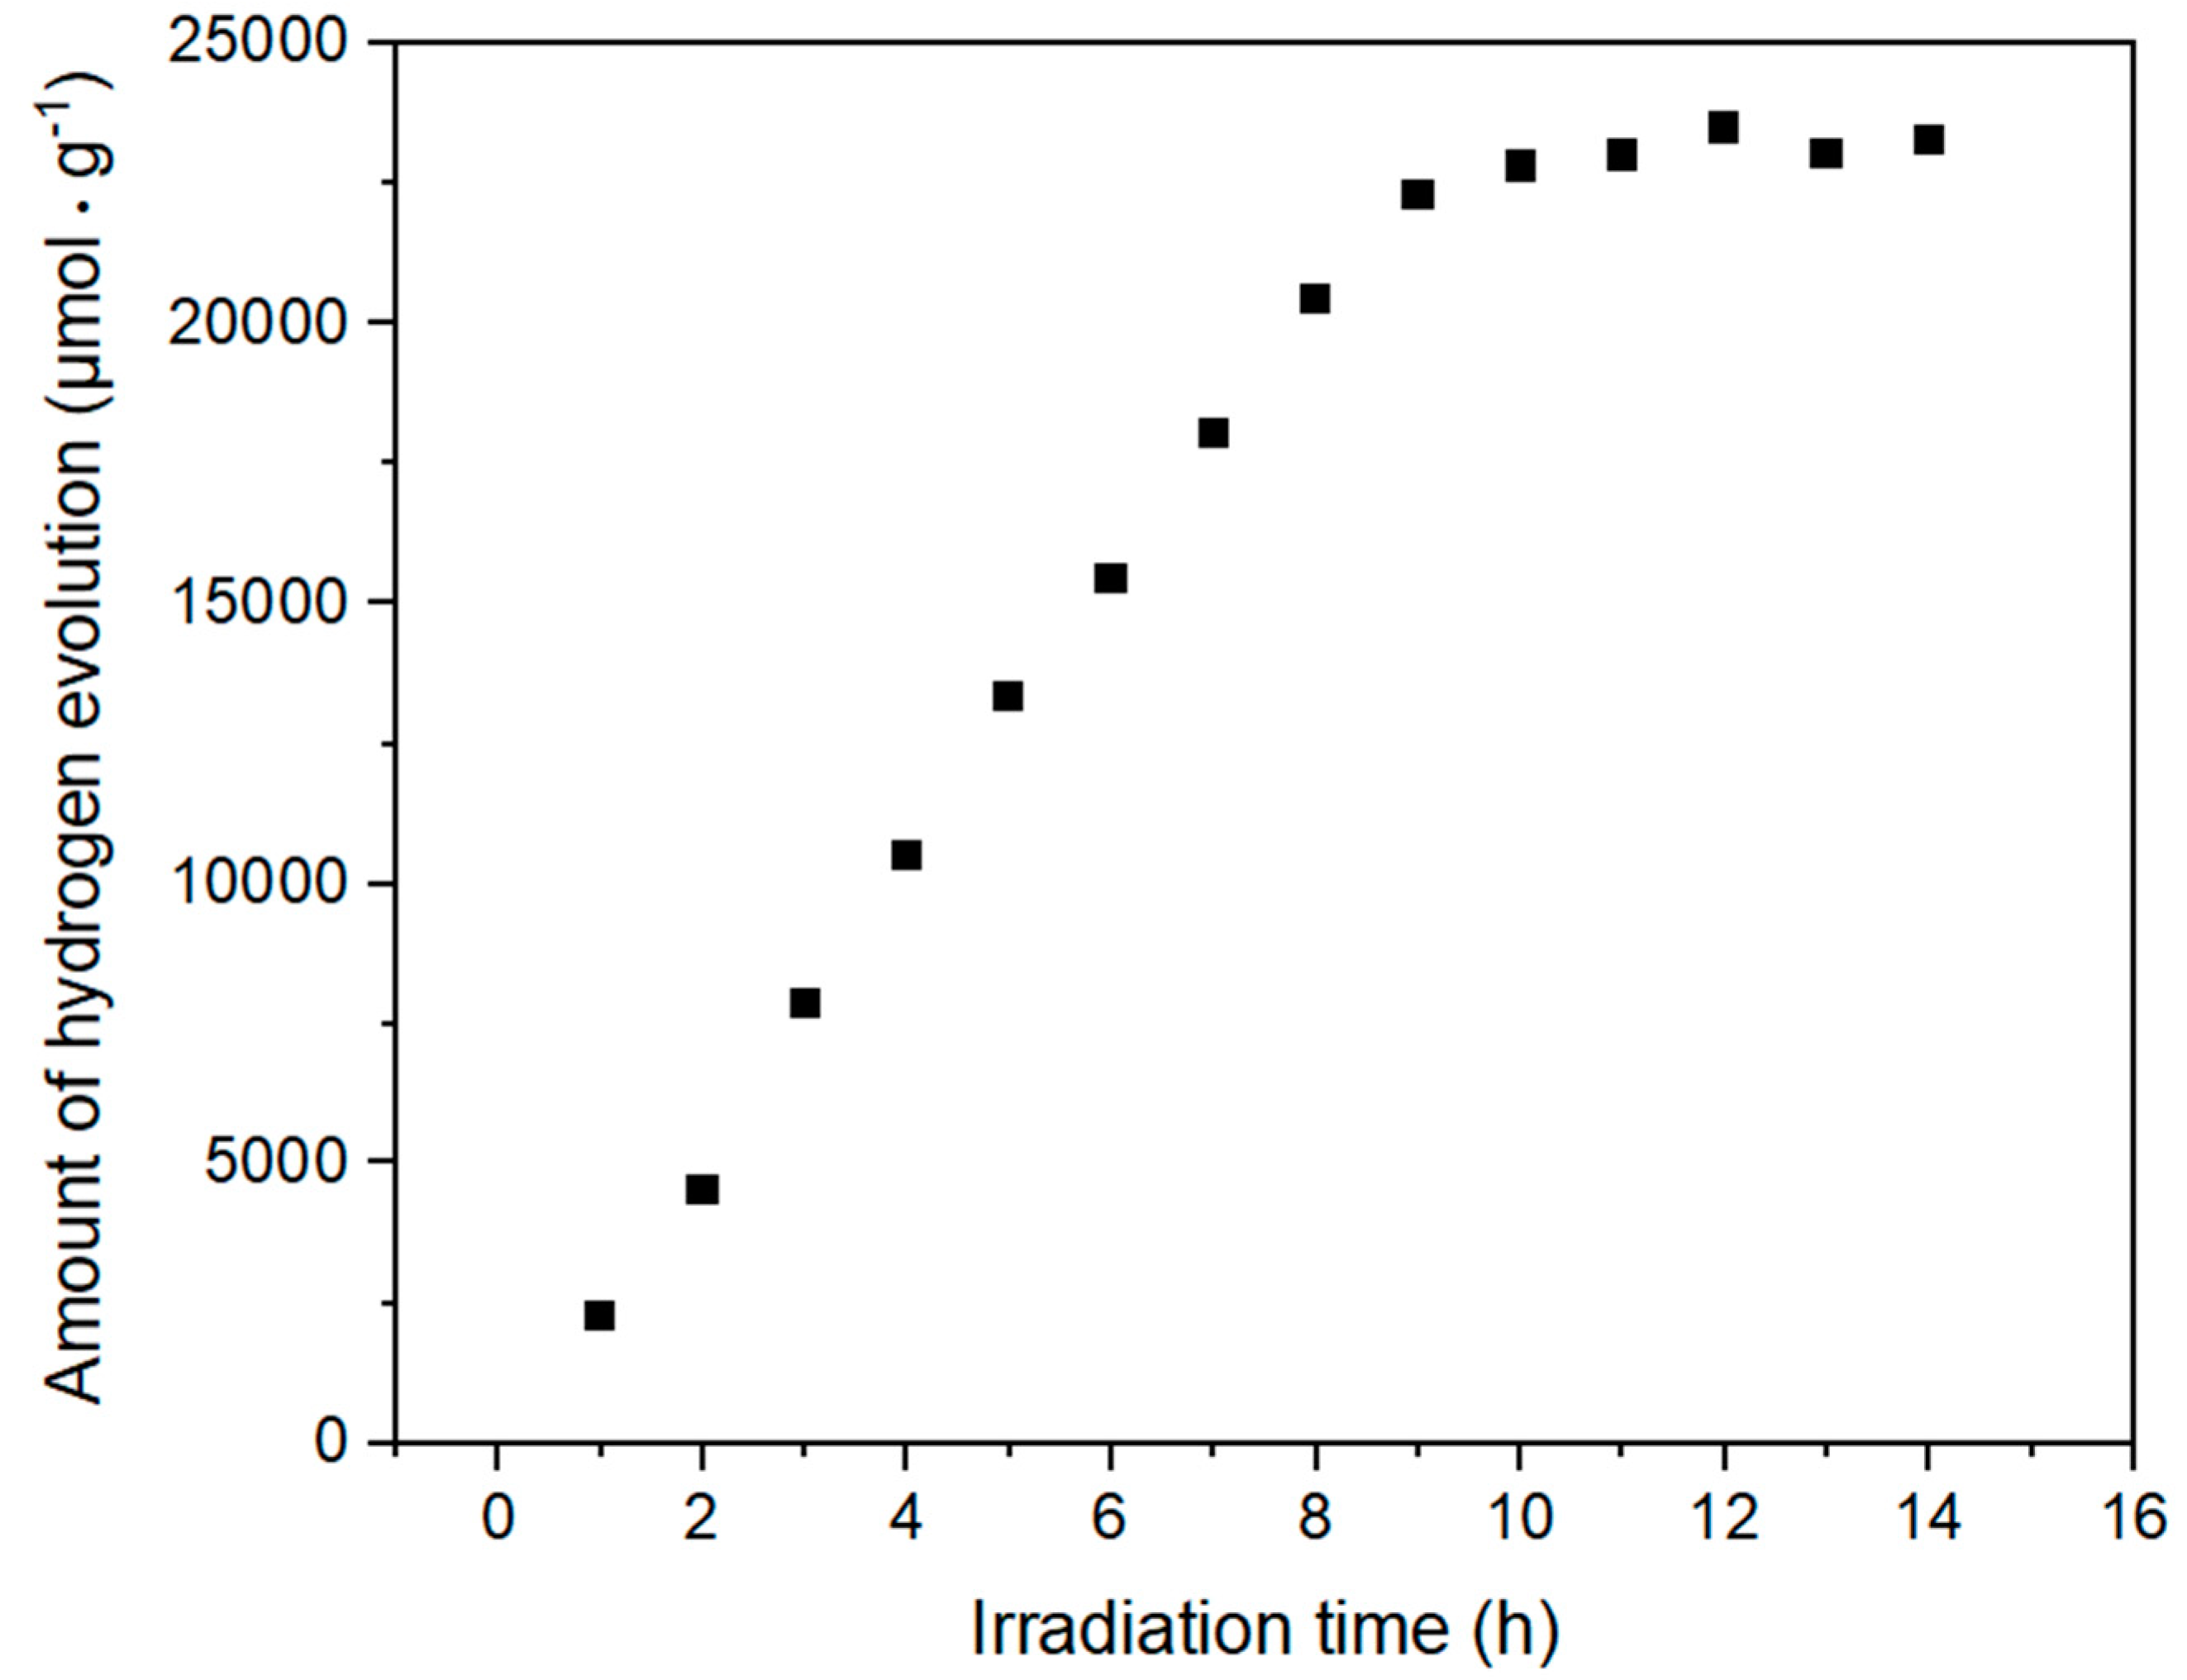
2.4. Hydrogen Evolution Results

The results of hydrogen evolution, normalized for μmol H2 produced/hour of irradiation/1 g of catalyst, are presented in Table 3.
The 10% methanol solution yielded results indistinguishable from background noise of the apparatus in the case of photo-induced water conversion experiment. Pure TiO2 in the form of P25 powder produced~86 µmol H2 h−1 gcat−1. Samples synthesized in 600° and beyondproved to be the least efficient photocatalysts of the series, in one case (TiO2-Cu-850-60) being even less active than pure TiO2. Additionally, in case of these samples, graphene covering often proved detrimental to photoactivity (both TiO2-Cu-850, TiO2-Cu-600 are more active than their covered counterparts). This trend changes for the materials obtained at 550 °C and below. Temperature of synthesis clearly plays a very important role and is inversely correlated with photoactivity. Samples synthesized at T ≤ 550 °C were the most active, topping at 2296.27 µmol H2 h−1 gcat−1 for TiO2-Cu-C-500-25 (over 26 times the efficiency of pure TiO2). Additionally, in the series ≤ 550 °C, the results suggest that graphene cover improves the efficiency of hydrogen production. The relation between synthesis conditions and photoactivity is further discussed in the next section.
A long-term (15 h) stability experiment was performed for the most active sample (TiO2-Cu-C-500-25) for the photocatalytic H2 evolution (Figure 6). As a result, hydrogen was constantly producedthe—sample demonstrated good stability. It is supposed that, the chemical structure and composition of TiO2-graphene-Cu can be maintained well even after recycling usage. The obtained results are consistent with the literature data for this TiO2-graphen-Cu material [15].
The literature review shows that TiO2-graphene-Cu composites used for photocatalytic hydrogen generation are still rare. The previous works deal with metallic copper and graphene oxide as co-catalysts [14,15] and nanocomposites constructed with: copper in the form of CuxO incorporated with TiO2, and reduced graphene oxide [16,17,19]. The comparison of the results of other researchers’s hydrogen evolution experiments, performed with the use of materials similar in composition to the material presented in current work have been placed in Table 4.
The differences in the photocatalytic generation of hydrogen for individual works were observed. They may have arisen from different: (i) preparation methods, (ii) individual forms of components of the nanocomposite, and (iii) techniques of hydrogen production between the experiments. The combination of TiO2 with graphene and copper leads to an improvement of the photocatalytic performance and their practical application in the photocatalytic evolution of hydrogen can be promoted. The higher photocatalytic activity of nanocomposites can be attributed to the synergistic effect between copper and graphene.

2.5. Computer-Aided Modelling

To capture the interrelationships between the most intuitive and/or potentially key synthesis parameters that might affect the efficiency of hydrogen production, a simple scatter plot was considered. Analysis of the plot of the synthesis temperature vs. synthesis time depicted in Figure 7a, revealed that the highest photocatalytic activity for water splitting for green hydrogen production exhibit the samples synthezised at temperatures lower than or equal to 550 °C for about 30 s or more.
The same conclusion can be drawn from the analysis of the correlation coefficients. A closer look at the correlogram shown in Figure 8 confirmed the strong negative correlation between photoactivity and synthesis temperature (r = −0.86), which means that photoactivity increases when the synthesis temperature decreases.
At the same time the weak positive correlation between photoactivity and the time of graphene synthesis (r = 0.13) can be observed. Hence, to meet one of the research objectives and to answer the question about the optimal synthesis parameters, computer-aided modelling was additionally performed. Prior to a predictive model development, a data set of 21 experimentally measured was divided into a training set (T) of 15 samples and a validation set (V) of 6 samples. For this purpose, splitting algorithm based on sorted in descending order the response values (i.e., H2 h−1gcat−1 [µmol]) was used. Afterwards, an in silico model was developed using kernel-weighted local polynomial regression approach. The conceptual and theoretical frameworks for this method have been broadly discussed elsewhere in the related literature [35,36,37,38]. In essence, the modelling algorithm seeks to perform the pointwise approximation of the unknown regression function f(x) employing a polynomial of order p (here: local constant estimator (Nadaraya-Watson), p = 0) at each point of interest, considering only a few training data points that are most similar to a given target point. The local neighborhood is determined by: (1) kernel function that dictates the shape of the neighborhood (here: gaussian kernel) and (2) bandwidth that controls the width of neighorhood (here: fixed bandwidth obtained with least-squares cross-validation method; bandwidth values were 0.0919 and 0.1352 for synthesis temperature and synthesis time, respectively). Once the model was trained with training data samples its predictive abilities were evaluated based on an external (validation) set samples that were not used in developing the model. To make the assessment of the obtained model scientifically sound, a number of different metrics recommended as the gold standards in evaluating the quality and relevance of in silico models were calculated [39,40,41,42]. The determination coefficient (R2) was used as a measure of the goodness-of-fit, while evaluation of the real predictive capability of model was verified by external validation coefficients (Q2F1, Q2F2, Q2F3) as well as concordance correlation coefficient (CCC). Moreover, the root means square error (RMSE), which gives a good estimate of the overall error between the model and the observations, was used to assess the prediction accuracy in the training set (RMSET) and in the validation set (RMSEExt). As can be seen from Table 5, the developed model demonstrated remarkable goodness-of-fit and predictive power.
Moreover, a very good agreement between the experimental and predicted hydrogen production values (H2 h−1gcat−1 (µmol)) graphically shown in Figure 9 provides further evidence to support the above-mentioned conclusion.
Subsequently, developed predictive model has been employed to estimate the efficiency of hydrogen production (H2 h−1gcat−1 (µmol)) for combinatorically generated samples of dozens possible combinations of synthesis temperature and time changing in ranges 500–850 °C and 0–60 s, respectively. Notably, such a choice of temperature/time range was motivated by the desire to avoid extrapolation beyond the range of the experimentally measured data. In line with our expectations, the obtained results indicated that the optimum combination of the synthesis parameters was 500 °C and 15–45 s, resulted in the generation of 2151.66 µmol H2 h−1gcat−1 (Table 5 and Table S1, Figure 7b). To verify, whether the outcome is trustworthy or not, an additional sample was synthesised and then experimentally tested. This additional sample (TiO2-Cu-C-500-25) was synthesised at 500 °C for 25 s. As can be seen from Table 6 and Table S1, the estimated photoactivity value for TiO2-Cu-C-500-25 sample is in excellent agreement with experimental one (H2 h−1gcat−1 = 2296.27 (µmol)), strongly supporting the accuracy and validity of the developed predictive model.

3. Discussion and Proposed Mechanism

The presence of graphene layer slightly improves the photocatalytic activity of the TiO2-Cu-C composites, yet the presence of copper and other factors clearly play a much more prominent role. The inverse correlation between photoactivity and temperature of synthesis is most likely caused by two factors: As demonstrated by SEM images, higher temperatures of synthesis lead to formation of bigger grains of TiO2 which decreases surface area/mass of the catalyst. Additionally, anatase to rutile conversion occurs in temperatures above 600 °C causing structural changes in the crystals of Titania, possibly detrimental to photoactivity. As the graphene layer generation is initiated instantly after copper reduction to its metallic form, it is assumed that metallic copper is shielded from atmospheric oxygen and remains reduced until the graphene cover is mechanically or otherwise breached. Yet it is not unthinkable that the cover may be imperfect leading to oxidation of at least some of the copper nanoparticles. It has been proven in other experiments, that unprotected metallic copper oxidation may occur almost immediately after exposure to air [43,44]. A study done by Hu et. al. [45] concludes that, deposited on TiO2, CuO is inevitably reduced to Cu2O during photocatalytic water splitting. The presence of a graphene layer, may act as a shielding agent, preventing the mentioned oxidation, but it is reasonable to assume that graphene cover is not always 100% tight and sometimes only delays the oxidation process leading to creation of TiO2-Cu-CuxOy-C composites. If this was the case, there is a possibility of copper oxide quantum dots being created from metallic copper nanoparticles that are below 3 nm in diameter. This leads to three possible mechanisms of photoinduced water splitting. TiO2 with metallic copper as co-catalyst, TiO2 with CuxOy as composite semiconductors and both former materials mixed, and graphene covered. In both cases the graphene cover would act as an additional, Schottky-like cocatalyst, serving as a conduit for electrons and preventing charge recombination. The weak positive correlation between graphene synthesis time and photoactivity may be caused by the fact that prolonged synthesis does not necessarily lead to obtaining larger surface area. It is possible that graphene is only generated up to a certain point, until whole copper is covered and thus insulated from surrounding environment. This could explain why TEM images of samples with 30, 60 and 180 s of graphene generation do not show significant differences in morphology.

4. Materials and Methods

4.1. Chemicals

In this study, the fallowing chemical reagents were used: Copper (I) acetate (Cu(CH3COO)), methanol (CH3OH) were purchased from Sigma Aldrich (Poznan, Poland), TiO2 P-25 was purchased from Degussa.

4.2. Photocatalyst Synthesis

4.2.1. Apparatus

The setup used for the procedure is depicted in Figure 10 and supporting information (Figure S1). Alicat electronic flowmeters were used, with the capacity of 1–1000 cm3 min−1. The high temperature oven and the reaction vessels were custom made. The setup and method are patent pending [18].

4.2.2. Base Material Preparation

Fabrication of graphene covered photocatalysts was initiated by preparing base material as follows: 0.0572 g of Cu(CH3COO) was dissolved in 100 cm3 of distilled water. Subsequently 2 g of TiO2 (P25), which is a fine powder, were added to the solution and the obtained suspension was mixed thoroughly with a magnetic stirrer for a period of 60 min in order to adsorb Cu+ ions onto the surface of TiO2. The mixture was then placed in a dryer at 60 °C until completely dry. The obtained material was thoroughly ground in a mortar to regain a powder structure. Material obtained in this way served as basis for the synthesis of photocatalyst samples and henceforth is called “base material” in this paper. All the copper-modified samples in this work have 1.6% mass ratio of Cu/TiO2.

4.2.3. Modification of TiO2 with Metallic Copper

Modifying TiO2 with metallic copper was performed by taking 0.5 g of the base material and placing it in the fluidized bed reactor, in a glass vessel inside a high temperature oven, where fluidization process was induced by flowing 1000 cm3 min−1 of argon through the vessel. Subsequently the oven was turned on, and the material was heated up to the reaction temperature (500 to 850 °C depending on the sample) while continuously being fluidized with argon. Once the set temperature has been reached, 10 vol.% hydrogen in argon mix was flown through the vessel at 1000 cm3 min−1 for a period of 20 min to reduce copper to metallic form. At this step the procedure was complete for samples with no graphene layer intended and the samples were cooled to room temperature in argon atmosphere. As for the samples meant to be covered in graphene, the procedure continued as described in Section 4.2.4 without any interruption.

4.2.4. Graphene Cover Synthesis

A mixture of 995 cm3 min−1 of argon and 5 cm3 min−1 of acetylene (C2H2) was flown through the vessel to synthesize a graphene layer via chemical vapour deposition process (CVD). The time of this step varied from 10 s to 3 min depending on the sample. Several samples have been synthesized with different graphene generation times. Next, the flow of 1000 cm3 min−1 of pure argon was restored. The vessel was removed from the oven and left to cool down in room temperature. The fluidization process and argon flow were uninterrupted during the whole procedure until the vessel and the material inside reached room temperature. No oxygen exposure occurred until the end of the process- this concluded the synthesis procedure. A schematic diagram of the preparation procedure is depicted in Figure 11.

4.3. Characterization

For all obtained samples, SEM pictures were taken, Raman spectra were measured. Due to limited resources, TEM imaging, XPS spectra and XRD analysis was done only for selected samples. Raman spectra were measured with Thermo Fisher scientific DXRtm3 Raman spectrometer. Samples were compressed into pellets and measured with the use of 532 nm laser. The power level of the laser used was dependent on the sample, thus Raman spectra were later normalized as described in the results section. TEM images were collected using FEI Europe, model Tecnai F20 X-Twin transmission electron microscope. SEM images were collected with the use of JEOL JSM 7000 scanning electron microscope. Powder X-ray diffraction (pXRD) analysis on well-ground powder of samples was carried out on a Bruker D2 Phaser diffractometer with Cu Kα radiation and a LynxEye-XE detector. Having the crystallographic data of anatase and rutile, LeBail refinement of this data was performed by employing the measurements were performed using a PHI 5000 VersaProbe (ULVAC-PHI) spectrometer with monochromatic Al Kα radiation (hν = 1486.6 eV) from an X-ray source operating at 100 µm spot size, 25 W and 15 kV. The high-resolution (HR) XPS spectra were collected with the hemispherical analyzer at the pass energy of 23.5 eV and the energy step size of 0.1 eV. The X-ray beam was incident at the sample surface at the angle of 45° with respect to the surface normal, and the analyzer axis was located at 45° with respect to the surface. The CasaXPS software was used to evaluate the XPS data. Deconvolution of all HR XPS spectra were performed using a Shirley background and a Gaussian peak shape with 30% Lorentzian character. UV-VIS spectra of the samples were collected with a standard UV-VIS Spectrophotometer. Samples were scanned in the form of powder.

4.4. Photocatalytic Activity Experiments

Hydrogen evolution was carried out in 100 cm3 quartz reactors containing 100 mg of the photocatalyst and 80 cm3 of 10% methanol solution in distilled water. The reactor was sealed with a rubber septum and the air remaining inside was flushed out and thus replaced with nitrogen. The reactor was thermostated at 10 °C. All the samples were stirred throughout the process. Hydrogen was analyzed using Gas Chromatography with a TCD detector. Each sample was initially kept in darkness for a period of 30 min for stabilization and subsequently illuminated for a period of three hours. A 1000-Watt Xenon lamp was used for irradiation, producing UV-VIS light of 50 mW cm−2 as measured at the surface of the reactor.

5. Conclusions

The past few decades have witnessed an unprecedented growth in the number of new initiatives taken to accelerate the shift towards cleaner and safer production that reconciles economic growth and environmental sustainability. Apart from the obvious benefits of cleaner production strategy such as diminishing raw material and waste disposal costs, reducing the need for time consuming and labor-intensive tests, cleaner production is also leading to the optimally designed chemicals/materials/products. It should surprise no one, therefore, the widespread use of advanced computational modelling that enable to design and evaluate the specific properties/functionalities/toxicity at early stages of new product development (even before actual synthesis), sifting through hundreds or thousands of candidate chemicals/materials/products. Bearing in mind that the development of efficient photocatalysts for water splitting that would reduce the present dependence on oil and gas supplies is of high interest, the intention of the present study was to propose an effective method to synthesize high purity graphene-based composite material for green hydrogen production with great attention paid to computer-aided modelling for the optimal synthesis parameters define.
TiO2-copper-graphene composite material for photoinduced water splitting was successfully synthesized with the proposed method. It is possible that copper undergoes partial or complete oxidation, over time forming CuxOy quantum dots, coexisting with, or replacing metallic copper on the surface of TiO2. Graphene cover slightly improves photocatalytic properties of the samples, as a good conductor it may act as electron relay preventing electron-hole recombination. Additionally, it may prevent or delay oxidation of metallic copper. As a downside, it is possible graphene can create a tight seal around the photocatalyst, insulating it from surrounding environment and thus auto-terminating its own synthesis, which would explain the weak correlation of graphene synthesis time and photoactivity. Hydrogen evolution efficiency is reverse proportional to the temperature of photocatalysts synthesis within the range of 500–850 °C, possibly due to anatase to rutile conversion in temperatures above 600 °C and the reduction of surface area. The CVD method with the use of fluidized bed reactor hold potential, yet high temperatures of synthesis carry a threat of altering the crystal structure of the matrix (in this case TiO2). Moreover, by tightly combining experimental and theoretical studies new insights into the optimal synthesis parameter combination for the maximum yield of hydrogen generation was provided. The overall modelling results clearly demonstrate that the optimum conditions for synthesis of graphene composite photocatalyst for water splitting are as follows: synthesis temperature—500 °C and synthesis time—30 s or less. Finally, theoretical finding was further confirmed through experiment. Lastly, the results of the present study provide vital evidence that contrary to the trial-and-error experiment-based approaches, the use of computer-aided modelling result in improved graphene-based composite material quality in lowering the time and cost of research.

Supplementary Materials

The following are available online at https://0-www-mdpi-com.brum.beds.ac.uk/article/10.3390/catal11060698/s1, Figure S1: Fluidized bed, Figure S2: Raman spectrum of photocatalysts, Table S1. Summary table of selected synthesis parameters and computational results (for the complete table with the predicted values please refer to the supporting material).

Author Contributions

Conceptualization, A.Z.-M.; methodology, Ł.L.; TEM-analysis, G.T.; XPS analysis, W.L. and K.N.; XRD analysis, T.K.; data curation, Ł.L.; computational analysis, A.G.-S.; writing—original draft preparation, Ł.L., A.G.-S. and A.G.; writing—review and editing, A.Z.-M. and A.G.; supervision, A.Z.-M. All authors have read and agreed to the published version of the manuscript.

Funding

This research was financially supported by National Science Centre, Poland (grant entitled: Mechanism of quantum dots excitation in photocatalytic reaction, 2016/23/B/ST8/03336).

Data Availability Statement

Data is contained within the article or Supplementary Materials.

Acknowledgments

A.G-S thanks the European Union’s Horizon 2020 research and innovation program (grant agreement No 953183) for financial support.

Conflicts of Interest

The authors declare no conflict of interest.

References

  1. Guan, S.; Hao, L.; Yoshida, H.; Itoi, T.; Cheng, Y.; Seki, S.; Nishina, Y.; Lu, Y. Enhanced photocatalytic activity and stability of TiO2/graphene oxide composites coatings by electrophoresis deposition. Mater. Lett. 2021, 286, 129258. [Google Scholar] [CrossRef]
  2. Park, S.; Dikin, D.A.; Nguyen, S.T.; Ruoff, R.S. Graphene Oxide Sheets Chemically Cross-Linked by Polyallylamine. J. Phys. Chem. C 2009, 113, 15801–15804. [Google Scholar] [CrossRef]
  3. Li, D.; Sun, J.; Shen, T.; Song, H.; Liu, J.; Wang, C.; Wang, X.; Zhao, R. Influence of morphology and interfacial interaction of TiO2-Graphene nanocomposites on the visible light photocatalytic performance. J. Solid State Chem. 2020, 286, 121301. [Google Scholar] [CrossRef]
  4. Chen, J.; Zhang, Z.; Zhu, W.; Zhang, L.; Zhao, B.; Ji, Y.; Li, G.; An, T. Superoxide radical enhanced photocatalytic performance of styrene alters its degradation mechanism and intermediate health risk on TiO2/graphene surface. Environ. Res. 2021, 195, 110747. [Google Scholar] [CrossRef] [PubMed]
  5. Tismanar, I.; Obreja, A.C.; Buiu, O.; Duta, A. VIS-active TiO2-graphene oxide composite thin films for photocatalytic applications. Appl. Surf. Sci. 2021, 538, 147833. [Google Scholar] [CrossRef]
  6. Zhang, R.; Ma, Y.; Lan, W.; Sameen, D.E.; Ahmed, S.; Dai, J.; Qin, W.; Li, S.; Liu, Y. Enhanced photocatalytic degradation of organic dyes by ultrasonic-assisted electrospray TiO2/graphene oxide on polyacrylonitrile/β-cyclodextrin nanofibrous membranes. Ultrason. Sonochemistry 2021, 70, 105343. [Google Scholar] [CrossRef] [PubMed]
  7. Ayoubi-Feiz, B.; Mashhadizadeh, M.H.; Sheydaei, M. Degradation of diazinon by new hybrid nanocomposites N-TiO2/Graphene/Au and N-TiO2/Graphene/Ag using visible light photo-electro catalysis and photo-electro catalytic ozonation: Optimization and comparative study by Taguchi method. Sep. Purif. Technol. 2019, 211, 704–714. [Google Scholar] [CrossRef]
  8. Ghasemi, S.; Esfandiar, A.; Setayesh, S.R.; Habibi-Yangjeh, A.; Gholami, M.R. Synthesis and characterization of TiO2–graphene nanocomposites modified with noble metals as a photocatalyst for degradation of pollutants. Appl. Catal. A Gen. 2013, 462, 82–90. [Google Scholar] [CrossRef]
  9. Ghasemi, S.; Hashemian, S.J.; Alamolhoda, A.A.; Gocheva, I.; Setayesh, S.R. Plasmon enhanced photocatalytic activity of Au@ TiO2-graphene nanocomposite under visible light for degradation of pollutants. Mater. Res. Bull. 2017, 87, 40–47. [Google Scholar] [CrossRef]
  10. Hsieh, S.H.; Chen, W.J.; Wu, C.T. Pt-TiO2/graphene photocatalysts for degradation of AO7 dye under visible light. Appl. Surf. Sci. 2015, 340, 9–17. [Google Scholar] [CrossRef]
  11. Kadi, M.W.; Mohamed, R.M. Preparation and characterization of Pt, N-TiO2-graphene nanocomposites for hydrogen production. Ceram. Int. 2019, 45, 6058–6065. [Google Scholar] [CrossRef]
  12. Yang, Y.; Liu, E.; Dai, H.; Kang, L.; Wu, H.; Fan, J.; Hu, X.; Liu, H. Photocatalytic activity of Ag–TiO2-graphene ternary nanocomposites and application in hydrogen evolution by water splitting. Int. J. Hydrogen Energy 2014, 39, 7664–7671. [Google Scholar] [CrossRef]
  13. Khalid, N.R.; Ahmed, E.; Hong, Z.; Ahmad, M.; Zhang, Y.; Khalid, S. Cu-doped TiO2 nanoparticles/graphene composites for efficient visible-light photocatalysis. Ceram. Int. 2013, 39, 7107–7113. [Google Scholar] [CrossRef]
  14. Lv, X.-J.; Zhou, S.-X.; Zhang, C.; Chang, H.-X.; Chen, Y.; Fu, W.-F. Synergetic effect of Cu and graphene as cocatalyst on TiO2 for enhanced photocatalytic hydrogen evolution from solar water splitting. J. Mater. Chem. 2012, 22, 18542–18549. [Google Scholar] [CrossRef]
  15. Jo, W.-K.; Jin, Y.-J. 2D graphene-assisted low-cost metal (Ag, Cu, Fe, or Ni)-doped TiO2 nanowire architectures for enhanced hydrogen generation. J. Alloy. Compd. 2018, 765, 106–112. [Google Scholar] [CrossRef]
  16. Fan, W.; Yu, X.; Lu, H.-C.; Bai, H.; Zhang, C.; Shi, W. Fabrication of TiO2/RGO/Cu2O heterostructure for photoelectrochemical hydrogen production. Appl. Catal. B Environ. 2015, 7, 32. [Google Scholar] [CrossRef]
  17. Tobaldi, D.M.; Lajaunie, L.; Dvoranová, D.; Brezová, V.; Figueiredo, B.; Seabra, M.P.; Calvino, J.J.; Labrincha, J.A. Cooperative and fully reversible color switching activation in hybrid graphene decorated nanocages and copper-TiO2 nanoparticles. Mater. Today Energy 2020, 17, 100460. [Google Scholar] [CrossRef]
  18. Lewandowski, Ł.; Zaleska-Medynska, A. Method for Production of Carbon Layers Containing Graphene on Nanoparticles, Especially Quantum Dots, Containing at Least One Semiconductor Material, and a Reaction Vessel for Production of Carbon Layers Containing Graphene on Nanoparticles, Especially Quantum Dots, Containing at Least One Semiconductor Material. Patent Application P.430994, 29 August 2019. (In Polish). [Google Scholar]
  19. Wang, B.; Sun, Q.; Liu, S.; Li, Y. Synergetic catalysis of CuO and graphene additives on TiO2 for photocatalytic water splitting. Int. J. Hydrogen Energy 2013, 38, 7232–7240. [Google Scholar] [CrossRef]
  20. Schuepfer, D.B.; Badaczewski, F.; Guerra-Castro, J.M.; Hofmann, D.M.; Heiliger, C.; Smarsly, B.; Klar, P.J. Assessing the structural properties of graphitic and non-graphitic carbons by Raman spectroscopy. Carbon 2020, 161, 359–372. [Google Scholar] [CrossRef]
  21. Lu, J.; Yang, J.-X.; Wang, J.; Lim, A.; Wang, S.; Loh, K.P. One-pot synthesis of fluorescent carbon nanoribbons, nanoparticles, and graphene by the exfoliation of graphite in ionic liquids. ACS Nano 2009, 3, 2367–2375. [Google Scholar] [CrossRef] [PubMed]
  22. Zhang, W.; Cui, J.; Tao, C.A.; Wu, Y.; Li, Z.; Ma, L.; Wen, Y.; Li, G. A strategy for producing pure single-layer graphene sheets based on a confined self-assembly approach. Angew. Chem. 2009, 121, 5978–5982. [Google Scholar] [CrossRef]
  23. Zhou, Y.; Bao, Q.; Tang, L.A.L.; Zhong, Y.; Loh, K.P. Hydrothermal dehydration for the “green” reduction of exfoliated graphene oxide to graphene and demonstration of tunable optical limiting properties. Chem. Mater. 2009, 21, 2950–2956. [Google Scholar] [CrossRef]
  24. López-Díaz, D.; López Holgado, M.; García-Fierro, J.L.; Velázquez, M.M. Evolution of the Raman spectrum with the chemical composition of graphene oxide. J. Phys. Chem. C 2017, 121, 20489–20497. [Google Scholar] [CrossRef]
  25. Cuong, T.V.; Pham, V.H.; Tran, Q.T.; Hahn, S.H.; Chung, J.S.; Shin, E.W.; Kim, E.J. Photoluminescence and Raman studies of graphene thin films prepared by reduction of graphene oxide. Mater. Lett. 2010, 64, 399–401. [Google Scholar] [CrossRef]
  26. Admanabhan, N.T.; Ganguly, P.; Pillai, S.C.; John, H. Morphology engineered spatial charge separation in superhydrophilic TiO2/graphene hybrids for hydrogen production. Mater. Today Energy 2020, 17, 100447. [Google Scholar] [CrossRef]
  27. Muthirulan, P.; Devi, C.N.; Sundaram, M.M. TiO2 wrapped graphene as a high performance photocatalyst for acid orange 7 dye degradation under solar/UV light irradiations. Ceram. Int. 2014, 40, 5945–5957. [Google Scholar] [CrossRef]
  28. Tobaldi, D.M.; Kočí, K.; Edelmannová, M.; Lajaunie, L.; Figueiredo, B.; Calvino, J.J.; Seabra, M.P.; Labrincha, J.A. CuxO and carbon–modified TiO2–based hybrid materials for photocatalytically assisted H2 generation. Mater. Today Energy 2021, 19, 100607. [Google Scholar] [CrossRef]
  29. Chastain, J.; King, R.C., Jr. Handbook of X-ray photoelectron spectroscopy. Perkin-Elmer Corp. 1992, 40, 221. [Google Scholar]
  30. Biesinger, M.C. Advanced analysis of copper X-ray photoelectron spectra. Surf. Interface Anal. 2017, 49, 1325–1334. [Google Scholar] [CrossRef]
  31. Poulston, S.; Parlett, P.M.; Stone, P.; Bowker, M. Surface oxidation and reduction of CuO and Cu2O studied using XPS and XAES. Surf. Interface Anal. Int. J. Devoted Dev. Appl. Tech. Anal. Surf. Interfaces Thin Film. 1996, 24, 811–820. [Google Scholar] [CrossRef]
  32. Rudd, J.A.; Jones, D.R.; Dunnill, C.W.; Andreoli, E. Study of copper (II) oxide and copper (II) acetate on multiwalled carbon nanotubes by XPS. Surf. Sci. Spectra 2019, 26, 014013. [Google Scholar] [CrossRef]
  33. Terzyk, A.P. The influence of activated carbon surface chemical composition on the adsorption of acetaminophen (paracetamol) in vitro: Part II. TG, FTIR, and XPS analysis of carbons and the temperature dependence of adsorption kinetics at the neutral pH. Colloids Surf. A Physicochem. Eng. Asp. 2001, 177, 23–45. [Google Scholar] [CrossRef]
  34. Yang, Y.; Huang, W. Design of copper and titanium dioxide nanoparticles doped with reduced graphene oxide for hydrogen evolution by water splitting. Russ. J. Phys. Chem. A 2018, 92, 968–975. [Google Scholar] [CrossRef]
  35. Loader, C. Local Regression and Likelihoo; Springer Science & Business Media: Berlin/Heidelberg, Germany, 2006. [Google Scholar]
  36. De Brabanter, K.; De Brabanter, J.; De Moor, B.; Gijbels, I. Derivative Estimation with Local Polynomial Fitting. J. Mach. Learn. Res. 2013, 14, 281–301. [Google Scholar]
  37. Fan, J.; Gijbels, I. Local Polynomial Modelling and Its Applications: Monographs on Statistics and Applied Probability 66; CRC Press: Boca Raton, FL, USA, 1996; Volume 66. [Google Scholar]
  38. Gajewicz-Skretna, A.; Kar, S.; Piotrowska, M.; Leszczynski, J. The kernel-weighted local polynomial regression (KwLPR) approach: An efficient, novel tool for development of QSAR/QSAAR toxicity extrapolation models. J. Cheminformatics 2021, 13, 1–20. [Google Scholar] [CrossRef]
  39. Gramatica, P. Principles of QSAR models validation: Internal and external. QSAR Comb. Sci. 2007, 26, 694–701. [Google Scholar] [CrossRef]
  40. Tropsha, A. Best practices for QSAR model development, validation, and exploitation. Mol. Inform. 2010, 29, 476–488. [Google Scholar] [CrossRef]
  41. Chirico, N.; Gramatica, P. Real external predictivity of QSAR models: How to evaluate it? Comparison of different validation criteria and proposal of using the concordance correlation coefficient. J. Chem. Inf. Modeling 2011, 51, 2320–2335. [Google Scholar] [CrossRef] [PubMed]
  42. Roy, K.; Das, R.N.; Ambure, P.; Aher, R.B. Be aware of error measures. Further studies on validation of predictive QSAR models. Chemom. Intell. Lab. Syst. 2016, 152, 18–33. [Google Scholar] [CrossRef]
  43. Lignier, P.; Bellabarba, R.; Tooze, R.P. Scalable strategies for the synthesis of well-defined copper metal and oxide nanocrystals. Chem. Soc. Rev. 2012, 41, 1708–1720. [Google Scholar] [CrossRef] [PubMed]
  44. Gawande, M.B.; Goswami, A.; Felpin, F.-X.; Asefa, T.; Huang, X.; Silva, R.; Zou, X.; Zboril, R.; Varma, R.S. Cu and Cu-based nanoparticles: Synthesis and applications in catalysis. Chem. Rev. 2016, 116, 3722–3811. [Google Scholar] [CrossRef] [PubMed] [Green Version]
  45. Hu, Q.; Huang, J.; Li, G.; Chen, J.; Zhang, Z.; Deng, Z.; Jiang, Y.; Guo, W.; Cao, Y. Effective water splitting using CuOx/TiO2 composite films: Role of Cu species and content in hydrogen generation. Appl. Surf. Sci. 2016, 369, 201–206. [Google Scholar] [CrossRef]
Figure 1. SEM image of pristine P25 TiO2 and selected samples after graphene covering.
Catalysts 11 00698 g001
Figure 2. TEM image and Raman spectra of selected samples, white graph represent Raman spectra for the samples upon which they are overlaid, D and G band peaks are indicated where suitable, intensity is normalized. Selected copper nanoparticles have been marked by circles.
Catalysts 11 00698 g002aCatalysts 11 00698 g002b
Figure 3. Powder X-ray diffraction patterns for: (a) starting material TiO2, (b) TiO2-Cu-C-550-30, (c) TiO2-Cu-C-500-25, (d) TiO2-Cu-C-600-30, (e) TiO2-Cu-850, a blue line represents a profile refinement (LeBail) with the used TiO2-anatase and TiO2 rutile phases. The Bragg peak positions for the first phase are shown by green tick marks, whereas by orange tick marks for the second phase. Arrows show Cu reflections.
Catalysts 11 00698 g003
Figure 4. DRS-UV-Vis spectra of the obtained samples.
Catalysts 11 00698 g004
Figure 5. XPS spectras of: (a) Ti2p and (b) Cu2p for TiO2-Cu-C-500-25.
Catalysts 11 00698 g005
Figure 6. Results of sample stability long term experiment for the most active sample TiO2-Cu-C-500-25.
Catalysts 11 00698 g006
Figure 7. Scatter plot illustrating the relationship between synthesis temperature and synthesis time and their effect on the efficiency of hydrogen production: (a) experimentally measured samples; (b) combinatorially generated theoretical samples.
Catalysts 11 00698 g007
Figure 8. Correlation plot that by definition presents the correlation between any two variables. Color and the size of the circle indicate the strength and direction of a linear relationship: positive correlations are displayed in dark green and negative correlations in brown color. The small circles indicate smallest correlation coefficients, whereas big circles denote highest correlation coefficients.
Catalysts 11 00698 g008
Figure 9. Plot of experimentally measured versus predicted values of hydrogen production (H2 h−1 gcat−1 (µmol)).
Catalysts 11 00698 g009
Figure 10. Schematic illustration of the setup used for fabrication of graphene coated photocatalysts.1—pressurized gas tanks, 2—electric valves, 3—gas leads, 4—gas flow regulators, 5—gas mixer, 6—fluidization vessel, 7—high temperature oven [18].
Catalysts 11 00698 g010
Figure 11. Preparation procedure of TiO2-Cu-C composite sythesis.
Catalysts 11 00698 g011
Table 1. Results of TEM and Raman analysis for selected samples.
Sample IDGraphene Synthesis Time (s)Graphene Synthesis Temperature (°C)G/D Band RatioSize of Cu Nanoparticles * (nm)Thickness of Graphene Layer ** (nm)
TiO2-Cu-5500550-1.7-
TiO2-Cu-8500850-1.6-
TiO2-Cu-C-550-10105501.421.51.2
TiO2-Cu-C-550-15155501.441.71.4
TiO2-Cu-C-550-30305501.771.61.8
TiO2-Cu-C-550-60605500.62.11.1
TiO2-Cu-C-550-1801805501.351.31.4
TiO2-Cu-C-850-60608501.411.51.5
* estiamtion based on 10 nanoparticles, ** estimation based on TEM.
Table 2. Crystal lattice patterns of selected samples. All values in Å.
Sample IDAnataseRutile
acdac
TiO23.7841(2)9.5036(7)1904.5925(5)2.9565(5)20%
TiO2-Cu-C-550-303.7864(3)9.5077(9)1904.5964(5)2.9587(4)17%
TiO2-Cu-C-500-253.7858(3)9.5065(7)2004.5955(4)2.9582(3)18%
TiO2-Cu-C-600-303.7859(3)9.5058(8)2004.5948(6)2.9587(3)15%
TiO2-Cu-850---4.5924(1)2.9598(1)100%
Table 3. The results of hydrogen evolution experiment. Experimental conditions: photocatalyst concentration: 1.25 g/L, reaction time: 4 h, medium: CH3OH/H2O, incident radiation: UV-Vis light.
Sample LabelH2 h−1 gcat−1 (µmol)Synthesis Temperature (°C)Graphene Synthesis Time (s)
10% methanol0.00-0
TiO286.56-0
TiO2-Cu-850309.708500
TiO2-Cu-C-850-6029.9285060
TiO2-Cu-6001807.056000
TiO2-Cu-C-600-60404.7060060
TiO2-Cu-C-600-301141.3860030
TiO2-Cu-5501589.505500
TiO2-Cu-C-550-1802065.62550180
TiO2-Cu-C-550-602131.1155060
TiO2-Cu-C-550-451731.2555045
TiO2-Cu-C-550-302152.1755030
TiO2-Cu-C-550-151750.1955015
TiO2-Cu-C-550-101897.7255010
TiO2-Cu-5001825.265000
TiO2-Cu-C-500-302151.6650030
TiO2-Cu-C-500-252296.2750025
Table 4. Comparison of results of other researcher’s hydrogen evolution experiments, performed with the use of materials similar in composition to the material presented in current work.
No.Catalyst (As Reported)Hydrogen Evolution Result (As Reported in the Original Paper)Hydrogen Evolution Normalized to µmol H2 h−1 g−1catalystLight SourceRef.
1TiO2 + reduced graphene oxide + 1.5% copper11 mmol H2/8 h68,750.00Xenon Lamp[14]
2TiO2 + 0.5 mol% copper + 0.5 weight% GNP’s268 µmol H2/3 h/gcatalyst89.30Mercury Lamp[17]
3TiO2/RGO/Cu2O631.6 μmol/h·m2N/AXenon Lamp[19]
4CuO/TiO2-GR-0.5 weight%2905.60 mmol/(h·gcatalyst)2905.60Xenon Lamp[16]
5Cu-TiO2-graphene2.3 mmol/gcatalyst/6 h383.30Xenon Lamp[34]
6TiO2-Cu-C-500-25-2296.27Xenon Lampcurrent work
7Cu-2D_graphene-TiO222 mmol H2/5 h220,000.0Xenon Lamp[15]
Table 5. Predictive model evaluation metrics.
Quality MetricsMinimum Threshold
Goodness-of-fit
R20.98>0.7
RMSET47.86as low as possible
Predictive power
Q2F10.88>0.6
Q2F20.88>0.6
Q2F30.92>0.6
CCC0.91>0.7
RMSEExt193.68as low as possible
Table 6. Summary table of selected synthesis parameters and computational results (for the complete table with the predicted values please refer to the supporting material).
Sample IDSynthesis Temperature (°C)Synthesis Time (s)Measured H2 h−1 gcat−1 (µmol)Set *Predicted H2 h−1 gcat−1 (µmol)
TiO2-Cu-C-550-30s550302152.17T2117.96
TiO2-Cu-C-500-30s500302151.66T2151.66
TiO2-Cu-C-550-60s550602131.11V1756.58
TiO2-Cu-C-550-30s550302108.27T2117.96
TiO2-Cu-C-550-180s5501802065.62T2065.62
TiO2-Cu-C-550-10s550101897.72V1736.10
TiO2-Cu-550-0s55001830.22T1710.44
TiO2-Cu-C-600-0s60001807.05T1807.05
TiO2-Cu-C-550-10s550101801.03V1736.10
TiO2-Cu-C-550-60s550601761.61T1758.44
TiO2-Cu-C-550-15s550151750.19T1768.04
TiO2-Cu-C-550-45s550451731.25V1695.10
TiO2-Cu-C-550-45s550451650.60T1679.48
TiO2-Cu-550-0s55001589.50T1710.44
TiO2-Cu-C-550-15s550151573.01V1777.31
TiO2-Cu-C-600-30s600301141.38T1102.93
TiO2-Cu-C-600-30s600301064.48T1102.93
TiO2-Cu-850-0s8500416.46V309.70
TiO2-Cu-C-600-60s60060404.70T404.70
TiO2-Cu-850-0s8500309.70T309.70
TiO2-Cu-C-850-60s8506029.92T29.92
* T and V indicate training and validation sets, respectively.
Publisher’s Note: MDPI stays neutral with regard to jurisdictional claims in published maps and institutional affiliations.

