Article

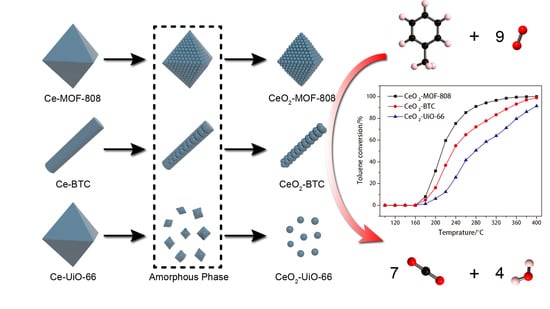
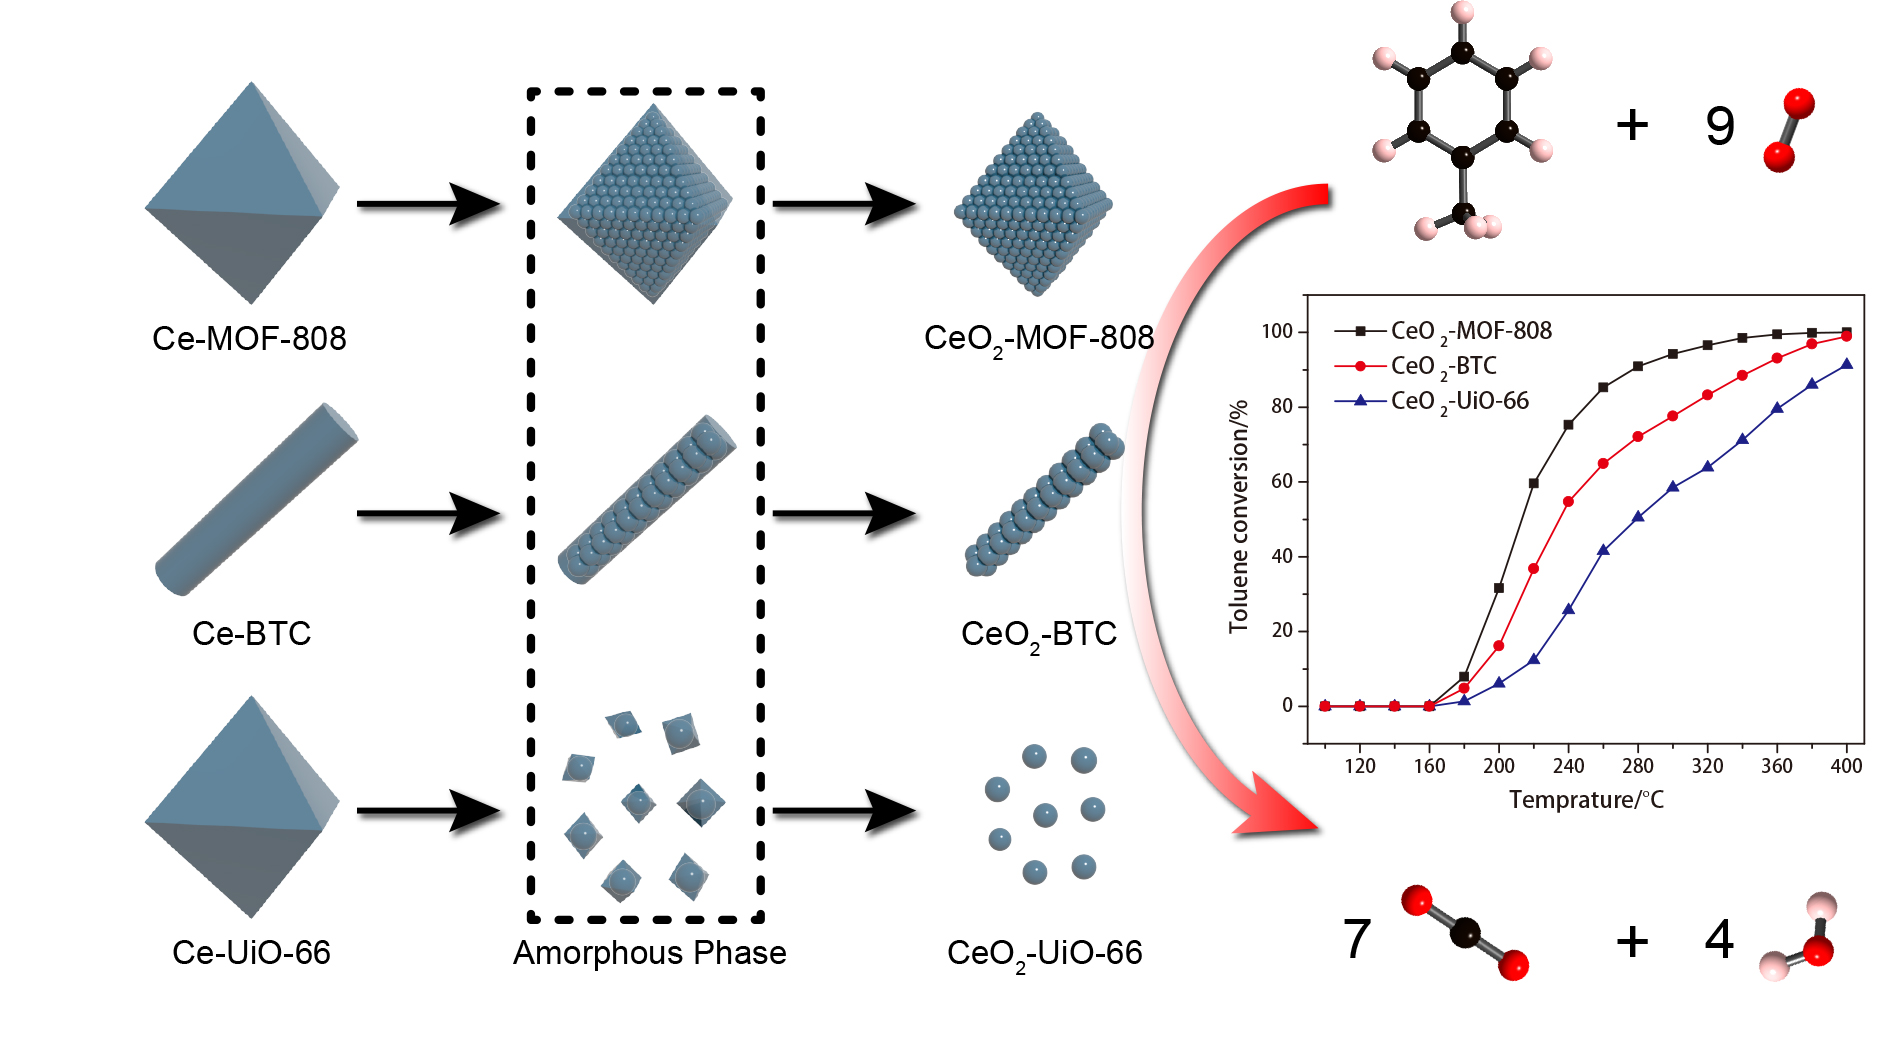
Insights into the Pyrolysis Processes of Ce-MOFs for Preparing Highly Active Catalysts of Toluene Combustion

Department of Chemistry, Shanghai Key Laboratory of Molecular Catalysis and Innovative Materials and Laboratory of Advanced Materials, Collaborative Innovation Center of Chemistry for Energy Materials, Fudan University, Shanghai 200433, China
*
Author to whom correspondence should be addressed.
Submission received: 15 July 2019 / Revised: 2 August 2019 / Accepted: 7 August 2019 / Published: 10 August 2019
(This article belongs to the Special Issue Catalytic Applications of CeO2-Based Materials)

Abstract

:
Metal organic frameworks (MOFs) have recently been used as precursors of the catalysts for the combustion of volatile organic compounds (VOCs). In the present work, three kinds of CeO2 catalysts were successfully synthesized from Ce-MOF-808, Ce-BTC, and Ce-UiO-66, with specific topological structures and coordinate environments. Catalysts with small particle size, stacking mode, and structural defects could be created by pyrolysis of Ce-MOFs, which affects the activity in the toluene combustion significantly. Raman spectra, XPS, and OSC studies were performed to reveal the formation of defect sites. The thermal redox properties were determined by H2-TPR. Catalytic activity tests were conducted on the toluene combustion, and CeO2-MOF-808 showed the best catalytic performance (T90 = 278 °C) due to its having the largest specific surface area, abundant active surface oxygen species, and low-temperature reducibility.

Graphical Abstract

1. Introduction

Recently, air pollution has received much attention because of the adverse effects for health and the environment [1,2]. Volatile organic compounds (VOCs) are one of the main culprits leading to air pollution, and the spread of VOCs into the atmosphere will give rise to photochemical smog and secondary aerosols [3]. As a representative VOC, toluene has been widely investigated as a model compound for reducing pollution of the environment. Several technologies such as adsorption, biological degradation, and catalytic oxidation have been developed to control toluene emission [4,5]. Among these, catalytic combustion is considered one of the most efficient methods for the elimination of toluene [6,7].
The Mars–Van Krevelen (MvK) mechanism is used to describe how toluene is oxidized to water and carbon dioxide with the oxide catalysts. Two main redox steps are included in the mechanism: (1) the reactive species oxidize toluene to water and carbon dioxide, (2) the oxygen in the gas oxidizes the surface of the oxides [8]. Thus, the transitional metal oxides which can provide activated oxygen species such as CuOx, CoOx, MnOx, and CeOx [9,10,11] have proved to be efficient catalysts for toluene combustion. Among them, ceria plays an important role due to its unique properties and the high abundance of oxygen in the lattice. Ceria-based catalysts have wide applications in water gas shift reaction [12], NH3 selective catalytic reduction (NH3-SCR) [13], catalytic elimination of N2O, and so on [14], due to their controllable morphological characteristics, high oxygen storage capacity, and abundant oxygen vacancies. For toluene catalytic combustion, the synthesis strategy will affect the morphology and lattice defects of ceria, and influence the active sites for the reaction [15]. Nanostructured ceria cubes and rods have demonstrated the importance of the concentration of surface oxygen defects for toluene combustion [16]. Hu et al. prepared a chestnut-like CeO2 catalyst using a self-assembly method [17]. The porous structure consisted of nanowire hierarchical microspheres, which provided a large surface area and surface oxygen vacancies, leading to the increased catalytic performance for toluene catalytic oxidation. The improved catalytic activity demonstrated the importance of structural regulation, and also indicated the possibility of further catalytic activity improvement by enhancing the defective sites.
Metal organic frameworks (MOFs) are compounds with regular structures consisting of metal clusters and ligands. In recent decades, great quantities of MOFs have been synthesized and applied in various fields [18]. Co-, Mn-, and Ce-MOFs have been synthesized and calcined to obtain the corresponding oxides for the catalytic combustion of VOCs [19,20]. Benefiting from the three-dimensional mesoporous structure formed by pyrolysis of MOFs, ceria catalysts showed good activity. After calcination, the morphology of Ce-MOF as a precursor, had a positive effect on the adsorption and desorption of toluene, enhancing catalytic activity [21]. CeO2 synthesized with Ce-BTC as the hard template was reported to have better activity and stability, compared with commercial ceria [22]. Ce-MOF-808 and Ce-UiO-66 show similarly stable structures as Ce-BTC. Meanwhile, precursors with more abundant pores and simple means of preparation could be candidates for preparing highly active ceria catalysts.
In this paper, three kinds of MOFs were synthesized as precursors of catalysts. To investigate the effects of the structure and ligands of Ce-MOFs on the structural properties of ceria through the pyrolysis process, various techniques were applied to determine the distinctions between the physical and chemical characteristics among these catalysts. The catalytic evaluation of the oxide catalysts was performed by the catalytic combustion of toluene.

2. Results and Discussion

2.1. Preparation of Ce-MOFs and the Pyrolysis Process

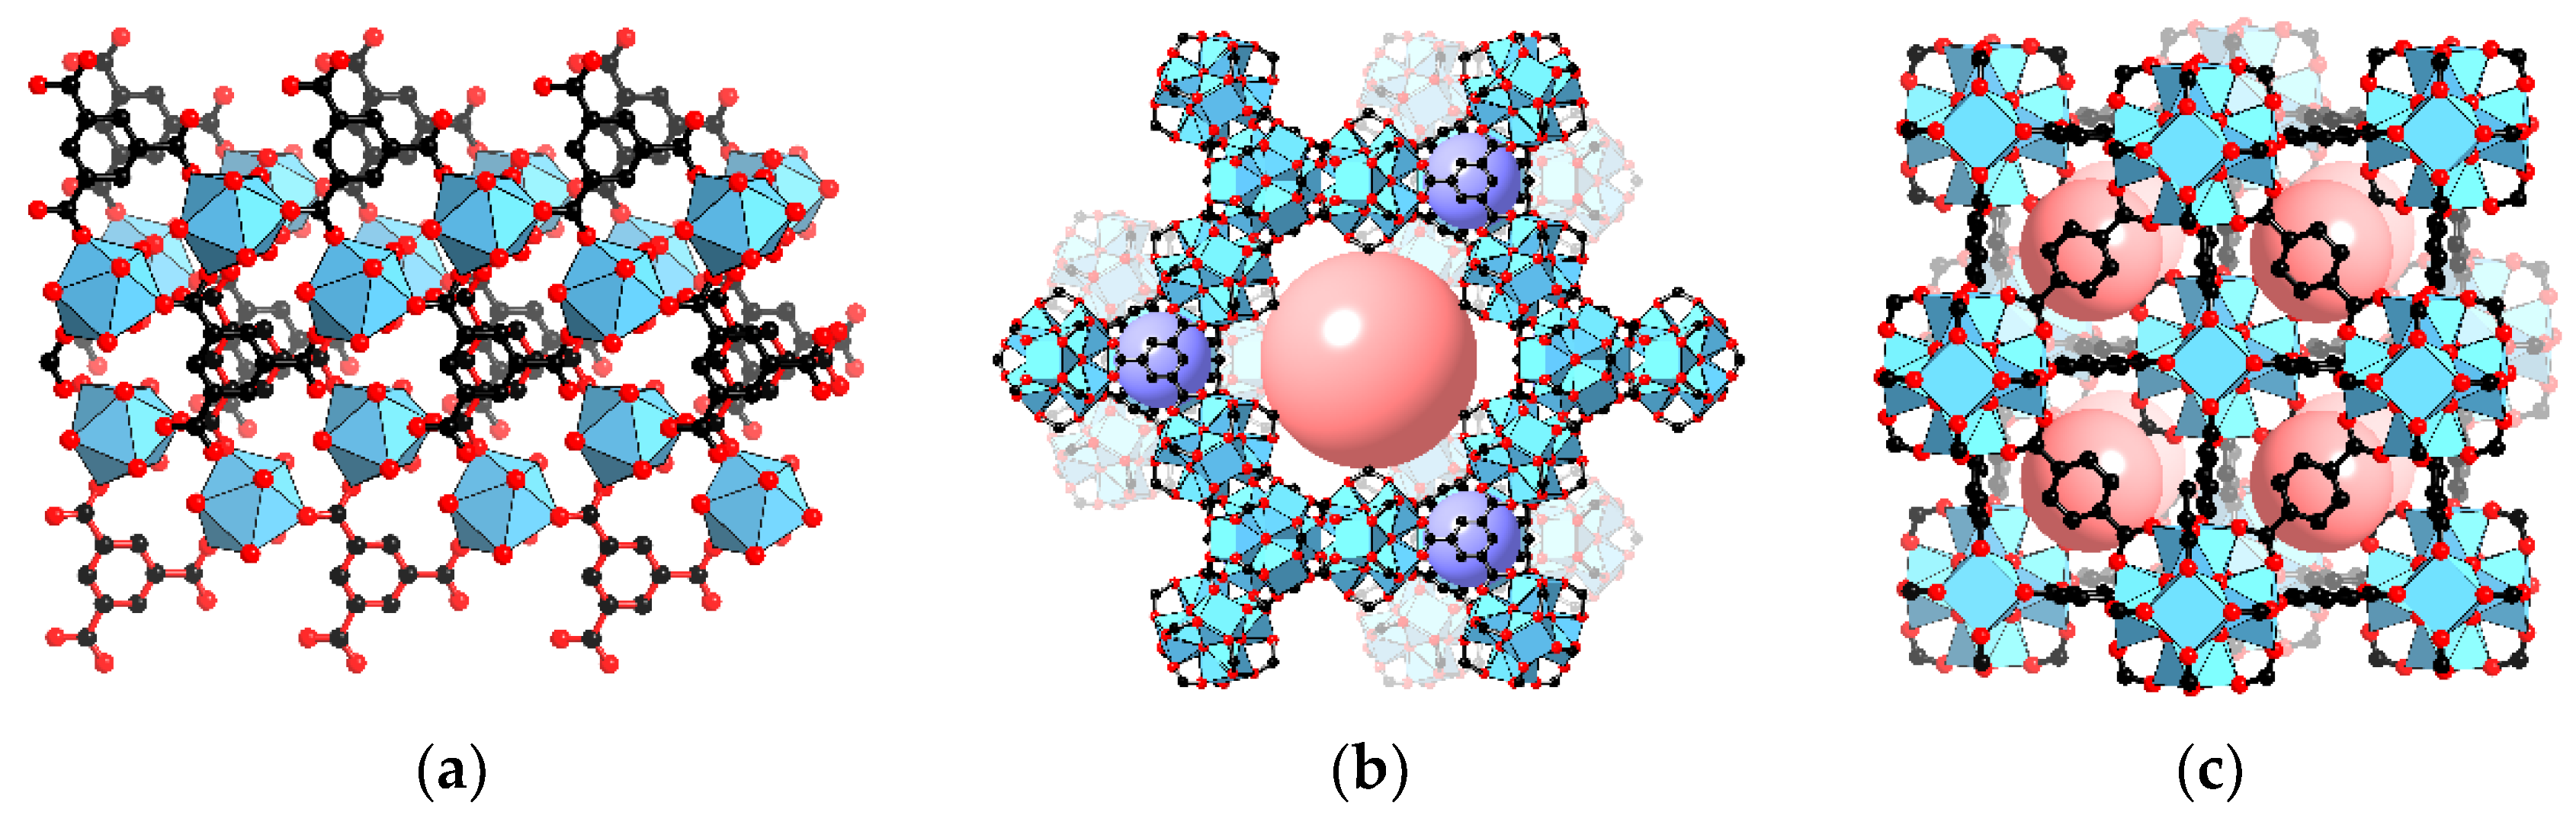
2.1.1. Structural Analysis of Ce-MOFs

To investigate the pyrolysis processes of Ce-MOFs, the Ce-MOFs including Ce-MOF-808, Ce-BTC, and Ce-UiO-66 were chosen as precursors for the catalyst synthesis. Ce-BTC consists of Ce atoms, water molecules, and 1,3,5-benzenetricarboxylic acid (H3-BTC). The composition of Ce-MOF-808 is similar to that of Ce-BTC with the main difference being the Ce6 clusters as the secondary building units. Ce-UiO-66 has the same Ce6 clusters as Ce-MOF-808 but involves a different ligand, 1,4-dicarboxybenzene (H2-BDC). The structures of these three kinds of Ce-MOFs are shown in Figure 1. The space groups of Ce-MOF-808, Ce-BTC, and Ce-UiO-66 are Fd-3m, Cc, and Fm-3m, respectively [23,24,25]. Through powder X-ray diffraction (PXRD), the purity and crystallinity of the Ce-MOFs were verified, as shown in Figure 2. The XRD patterns of Ce-MOFs were also simulated based on the Cambridge Crystallographic Data Centre (CCDC) database. The CCDC codes for Ce-MOF-808 and Ce-UiO-66 are CCDC 1509776 and CCDC 1036904, respectively. An isostructural MOF, La-BTC (La(BTC)(H2O)6) (CCDC 290771) was used to simulate Ce-BTC. The background of the experimental result was deducted for comparison. The peak positions of the experimental results were consistent with the simulated patterns. The differences between the experimental and simulated patterns were due to the preferred orientation, systematic absences, and the crystal defects.
Transmission electron microscopy (TEM) images of the MOFs (Figure 3) were used to determine the morphologies before calcination. Ce-MOF-808 and Ce-UiO-66 both formed particle shapes while Ce-BTC displayed regular stick morphology, as presented. Compared with Ce-MOF-808, Ce-UiO-66 had a more regular shape and relatively larger crystallite dimension.
The textural properties were calculated based on the N2 adsorption/desorption measurements, as listed in Table 1. It was shown that before pyrolysis, Ce-MOF-808 and Ce-UiO-66 exhibited large specific surface areas of 469.4 and 425.0 m2/g, respectively, while Ce-BTC possessed a specific surface area of 28.9 m2/g with small micropores [26]. The specific surface area values of Ce-MOF-808 and Ce-UiO-66 were lower than those previously reported [23,25]. The decrease of the specific surface areas may be caused by the structural defects, which were related to the scale up synthesis of the MOFs. The micropore widths of Ce-MOF-808 and Ce-UiO-66 were consistent with those already reported.

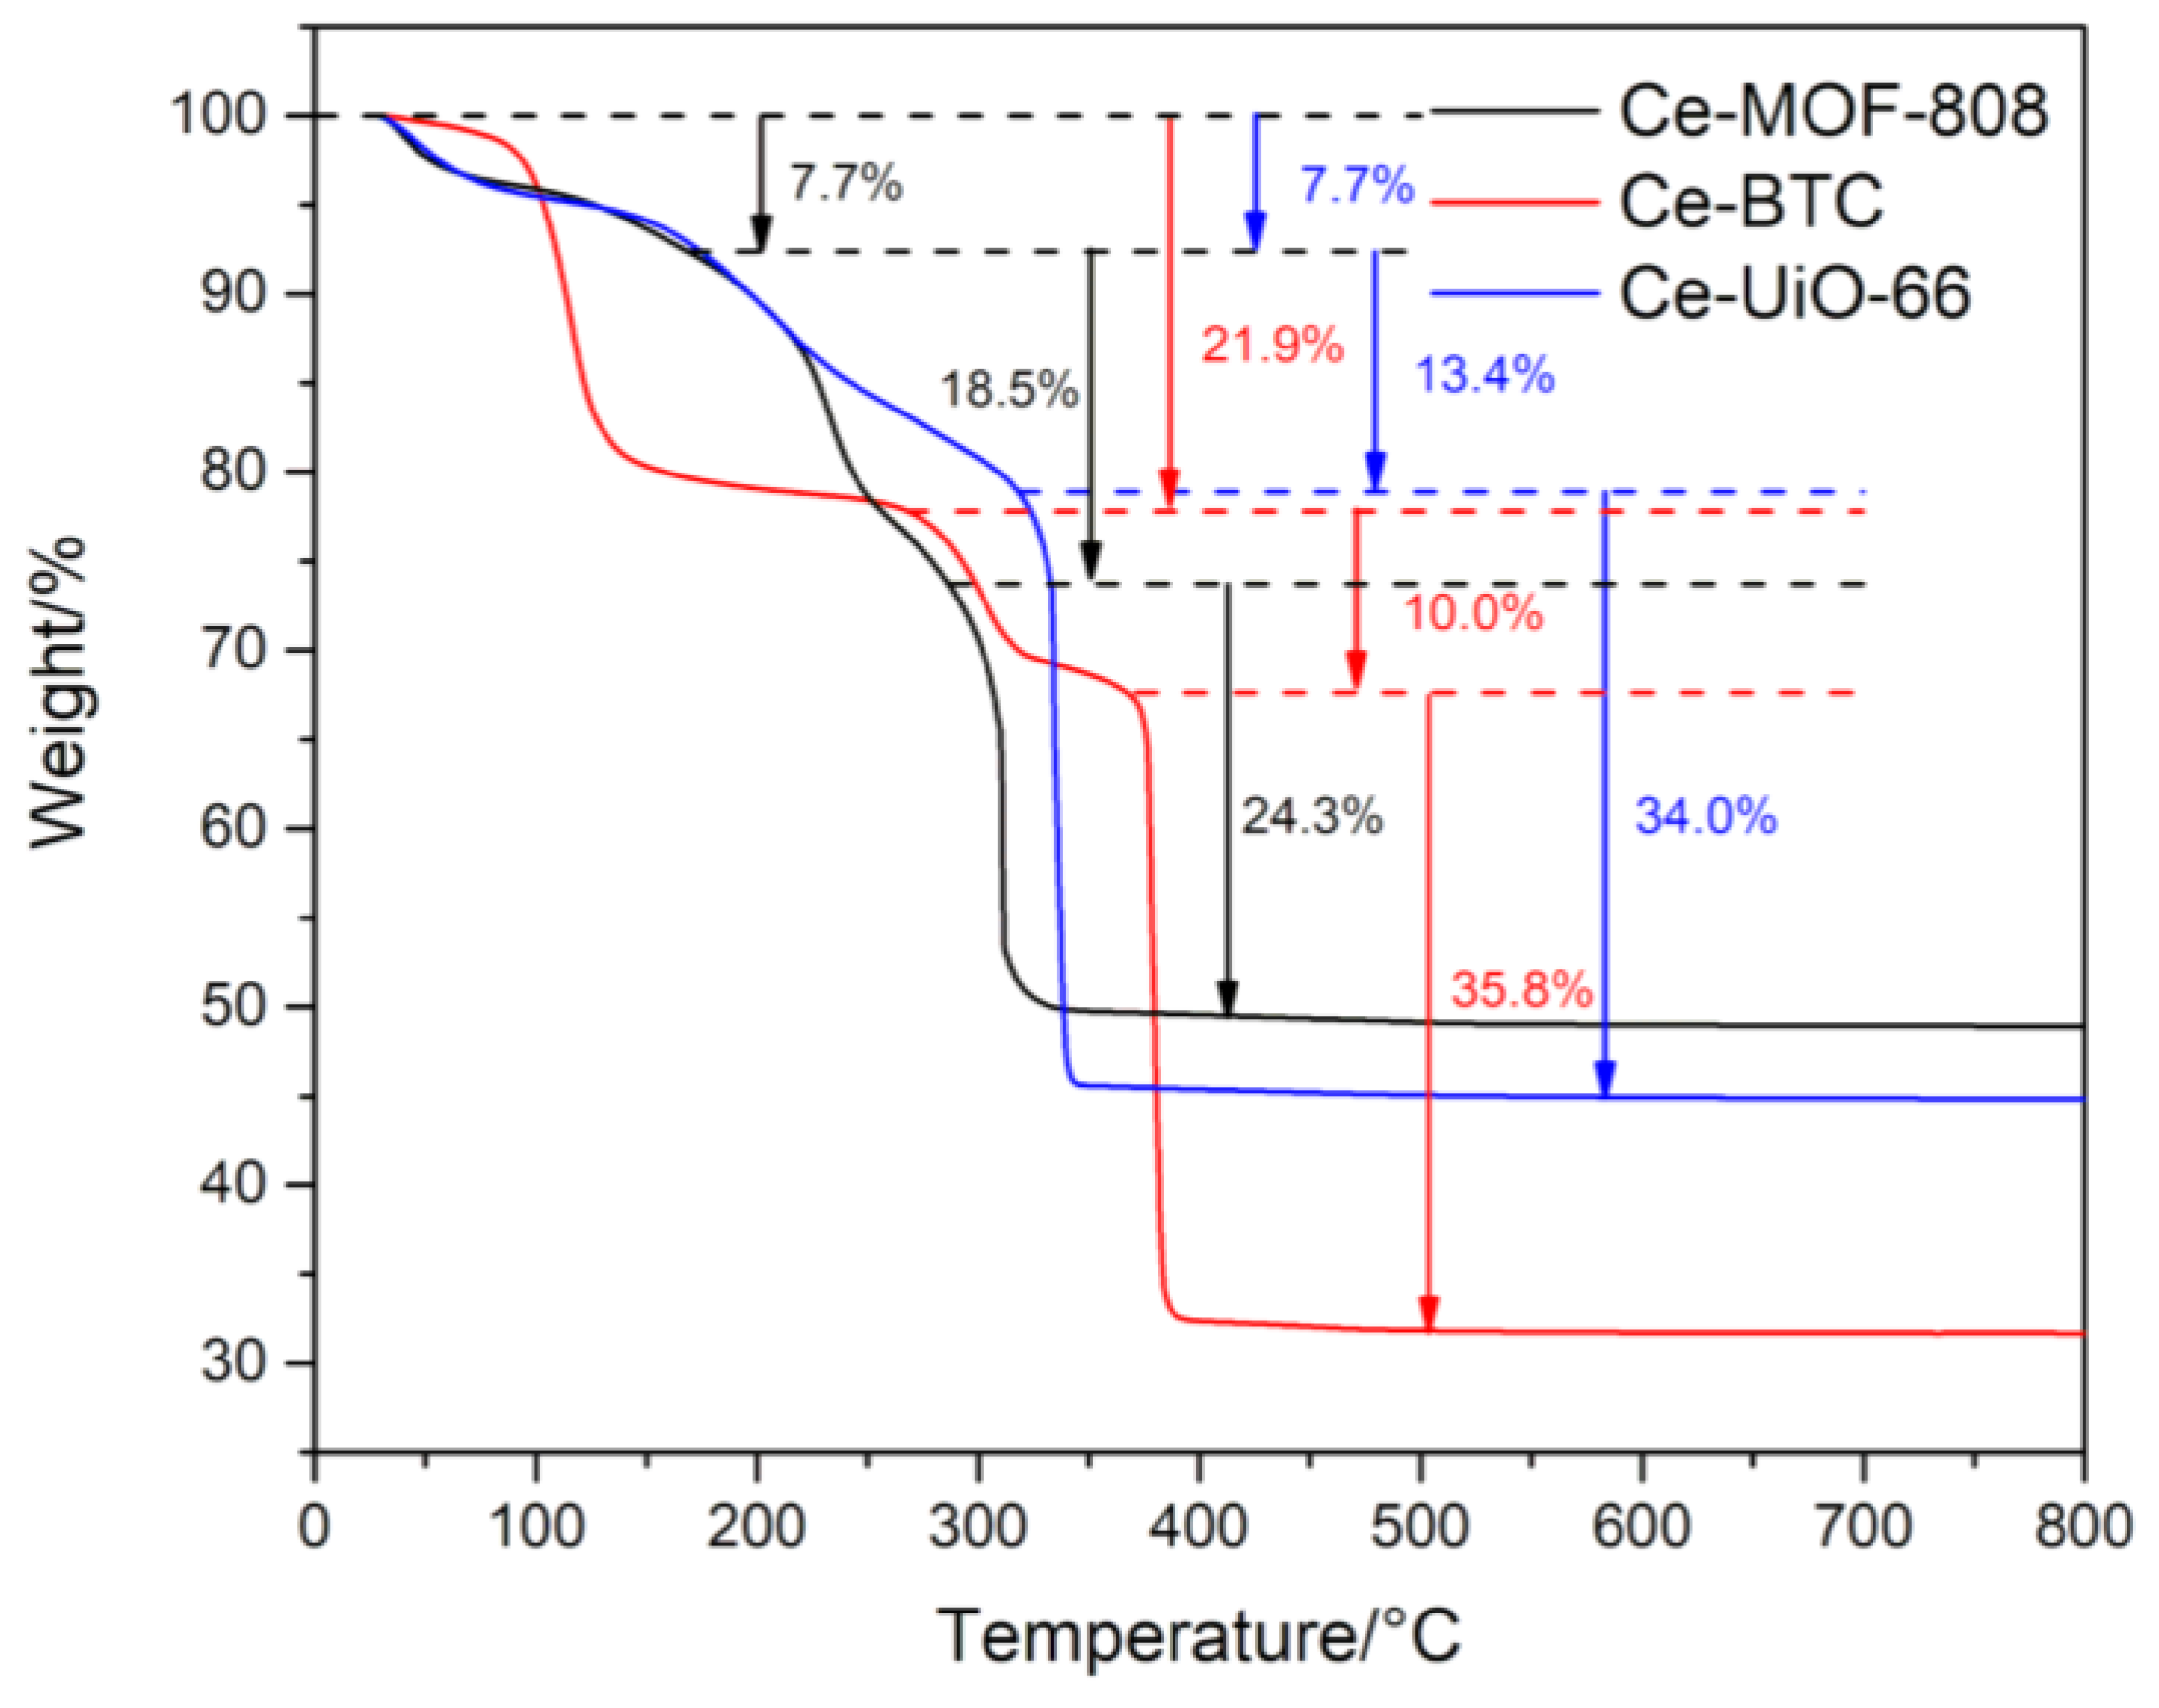
2.1.2. Changes in the Structures and Surface Morphologies upon Calcination

Weight losses of the samples were evaluated using thermal gravimetric analysis (TGA), as depicted in Figure 4. The first weight loss stage of the three samples below 150 °C was assigned to the removal of water molecules. For Ce-MOF-808 and Ce-UiO-66, the weight loss at this stage is mainly caused by adsorbed water. The coordination bond of the water molecule in Ce-BTC leads to a higher removal temperature. During the second stage, between 150 °C and 322 °C, the sample underwent slow decomposition, from 10% to 14.5%, releasing N,N-dimethylformamide (DMF), part of coordinate water, and formic acid ligands [27]. The third stage of weight loss links to the Ce-MOFs decomposition. Ce-MOF-808, Ce-BTC, and Ce-UiO-66 exhibited rapid weight loss of 24.3%, 35.8%, and 34.0% to form CeO2 at 311 °C, 378 °C, and 334 °C, respectively. In addition, a temperature of 500 °C was found to be enough to remove all the organic frameworks and form cerium oxides.
The samples derived from Ce-MOF-808, Ce-BTC, and Ce-UiO-66 after calcination at 500 °C, are denoted as CeO2-MOF-808, CeO2-BTC, and CeO2-UiO-66. The detailed crystalline changes were explored by PXRD measurements within the pyrolysis temperature range from 200 °C to 400 °C, during which the crystalline phase of the catalyst changed significantly, as shown in Figure 5. For MOFs, the lattice parameters led to strong diffraction peaks at low angles while there is no diffraction peak at low angle for the cerium oxides. As the calcination temperature increased, the structures of Ce-MOFs transformed into ceria. A clear phase transition occurred between 200 °C and 300 °C in MOF-808, while for the other two, it occurred at a higher temperature of between 300 °C and 350 °C. For MOF-808, from 220 °C, no obvious peaks were observed until the temperature reached 290 °C, accompanied by the appearance of the characteristic peaks for ceria at 2θ = 28°. For Ce-BTC, the characteristic diffraction band at 11.2° maintained at 340 °C, while the peaks attributed to ceria began to appear at 330 °C. This indicated that Ce-BTC and CeO2 co-existed in its calcination process. Ceria formed before the carbon burned out in the structure. The calcination process is obviously different for Ce-UiO-66 which holds a well-defined structure up to 300 °C. At the calcination temperature of 310 °C, the crystallinity of Ce-UiO-66 decreased significantly, and then almost no peaks were found at 320 °C, which means that the MOFs structures collapsed and carbon-coated compounds or a tiny number of ceria particles were formed. When the temperature increased to a higher level, a well-crystallized ceria phase was formed. During calcination, the phase transition from Ce-UiO-66 to CeO2-UiO-66 was much faster than those of other Ce-MOFs. Meanwhile, there was no similar state of coexistence of two species in the Ce-BTC calcination process. This suggests that, apart from Ce-UiO-66, the destruction of the other two MOFs’ structures partly coincided with the formation of CeO2 in the whole calcination process, which imposes a positive impact on the formation of the CeO2 structure and the maintenance of particle size.
Considering the structural effects of the MOFs skeleton on the final structure of ceria, samples calcined at critical temperatures were observed by TEM in Figure 3. According to the PXRD measurements at different temperatures, Ce-MOF-808 at 250 °C, Ce-BTC at 340 °C, and Ce-UiO-66 at 320 °C were selected as the crucial samples with amorphous phases, and named Ce-MOF-808-250, Ce-BTC-340, and Ce-UiO-66-320, respectively. It is very important to observe the amorphous phase transition to trace the calcination process. At the selected pyrolysis temperatures, Ce-MOF-808 and Ce-BTC samples retained their MOF frameworks, while highly dispersed particles began forming in the Ce-UiO-66-320. For Ce-MOF-808-250 and Ce-BTC-340, the overall morphology and structure showed little change, while small particles (small dots with deeper contrast) were being formed, which may indicate the nucleation process of ceria. For Ce-UiO-66-320, the particle size obviously decreased, compared with that of the sample before calcination. The dimension of these particles was slightly larger than those of CeO2-UiO-66 samples obtained by complete calcination. This indicates that at this temperature, the burning of ligands results in the formation of smaller particles, and then the pyrolysis process proceeds based on these small particles. This phenomenon supports the PXRD results, which confirms that the particle sizes and stacking forms of the oxide products are greatly affected by the way ligands are removed from the MOFs’ skeleton during calcination.

2.1.3. Structural Analysis of CeO2-MOFs

The PXRD patterns of ceria samples are shown in Figure 5d. After calcination at 500 °C, all the Ce-MOFs formed cubic ceria crystals, showing peaks at 28.6°, 33.1°, 47.5°, 56.3°, 59.1°, 79.4°, 76.7°, and 79.1° respectively, corresponding to the facets (111), (200), (220), (311), (222), (400), (331), and (420). The positions of the characteristic peaks were consistent with a fluorite structure (JCPDS Card No. 34-0394). The average particle sizes of CeO2-MOF-808, CeO2-BTC, and CeO2-UiO-66 were about 5.3 nm, 9.7 nm, and 10.6 nm, as listed in Table 2. Based on the results of the previous calcination process and the PXRD patterns, the crystallinity of CeO2-UiO-66 was relatively higher, and fewer defect sites might have been created on its surface than the others.
Figure 3 shows the morphologies of the CeO2-MOFs characterized by TEM after calcination. CeO2-MOF-808 and CeO2-BTC show aggregation of small particles, while CeO2-UiO-66 disperses into uniform small particles. Stacked structures are more likely to form defective surfaces. The existence of interfaces between the small particles increased lattice disorder and produced more defective surfaces, which are essential for efficient catalysts [28]. The particle sizes of these three cerium oxides were calculated, by counting, to be 6.7 nm, 9.8 nm, and 11.1 nm for CeO2-MOF-808, CeO2-BTC, and CeO2-UiO-66, respectively. These numbers are more or less the same as those calculated from PXRD. The scanning electron microscope (SEM) images of the samples during the calcination are provided in Figure S1. The SEM images show that during calcination, Ce-UiO-66 changed its shape from uniform particles to small pieces, while the other two underwent slight changes.
The specific surface areas of ceria prepared by MOFs precursor were calculated by the Brunauer–Emmett–Teller (BET) method and are listed in Table 2. The specific surface areas of MOF-808 and UiO-66 decreased greatly to 96.6 and 38.8 m2/g, respectively, while that of Ce-BTC increased to 71.5 m2/g. The increase of the Ce-BTC surface area was due to the formation of a porous structure after calcination [26].

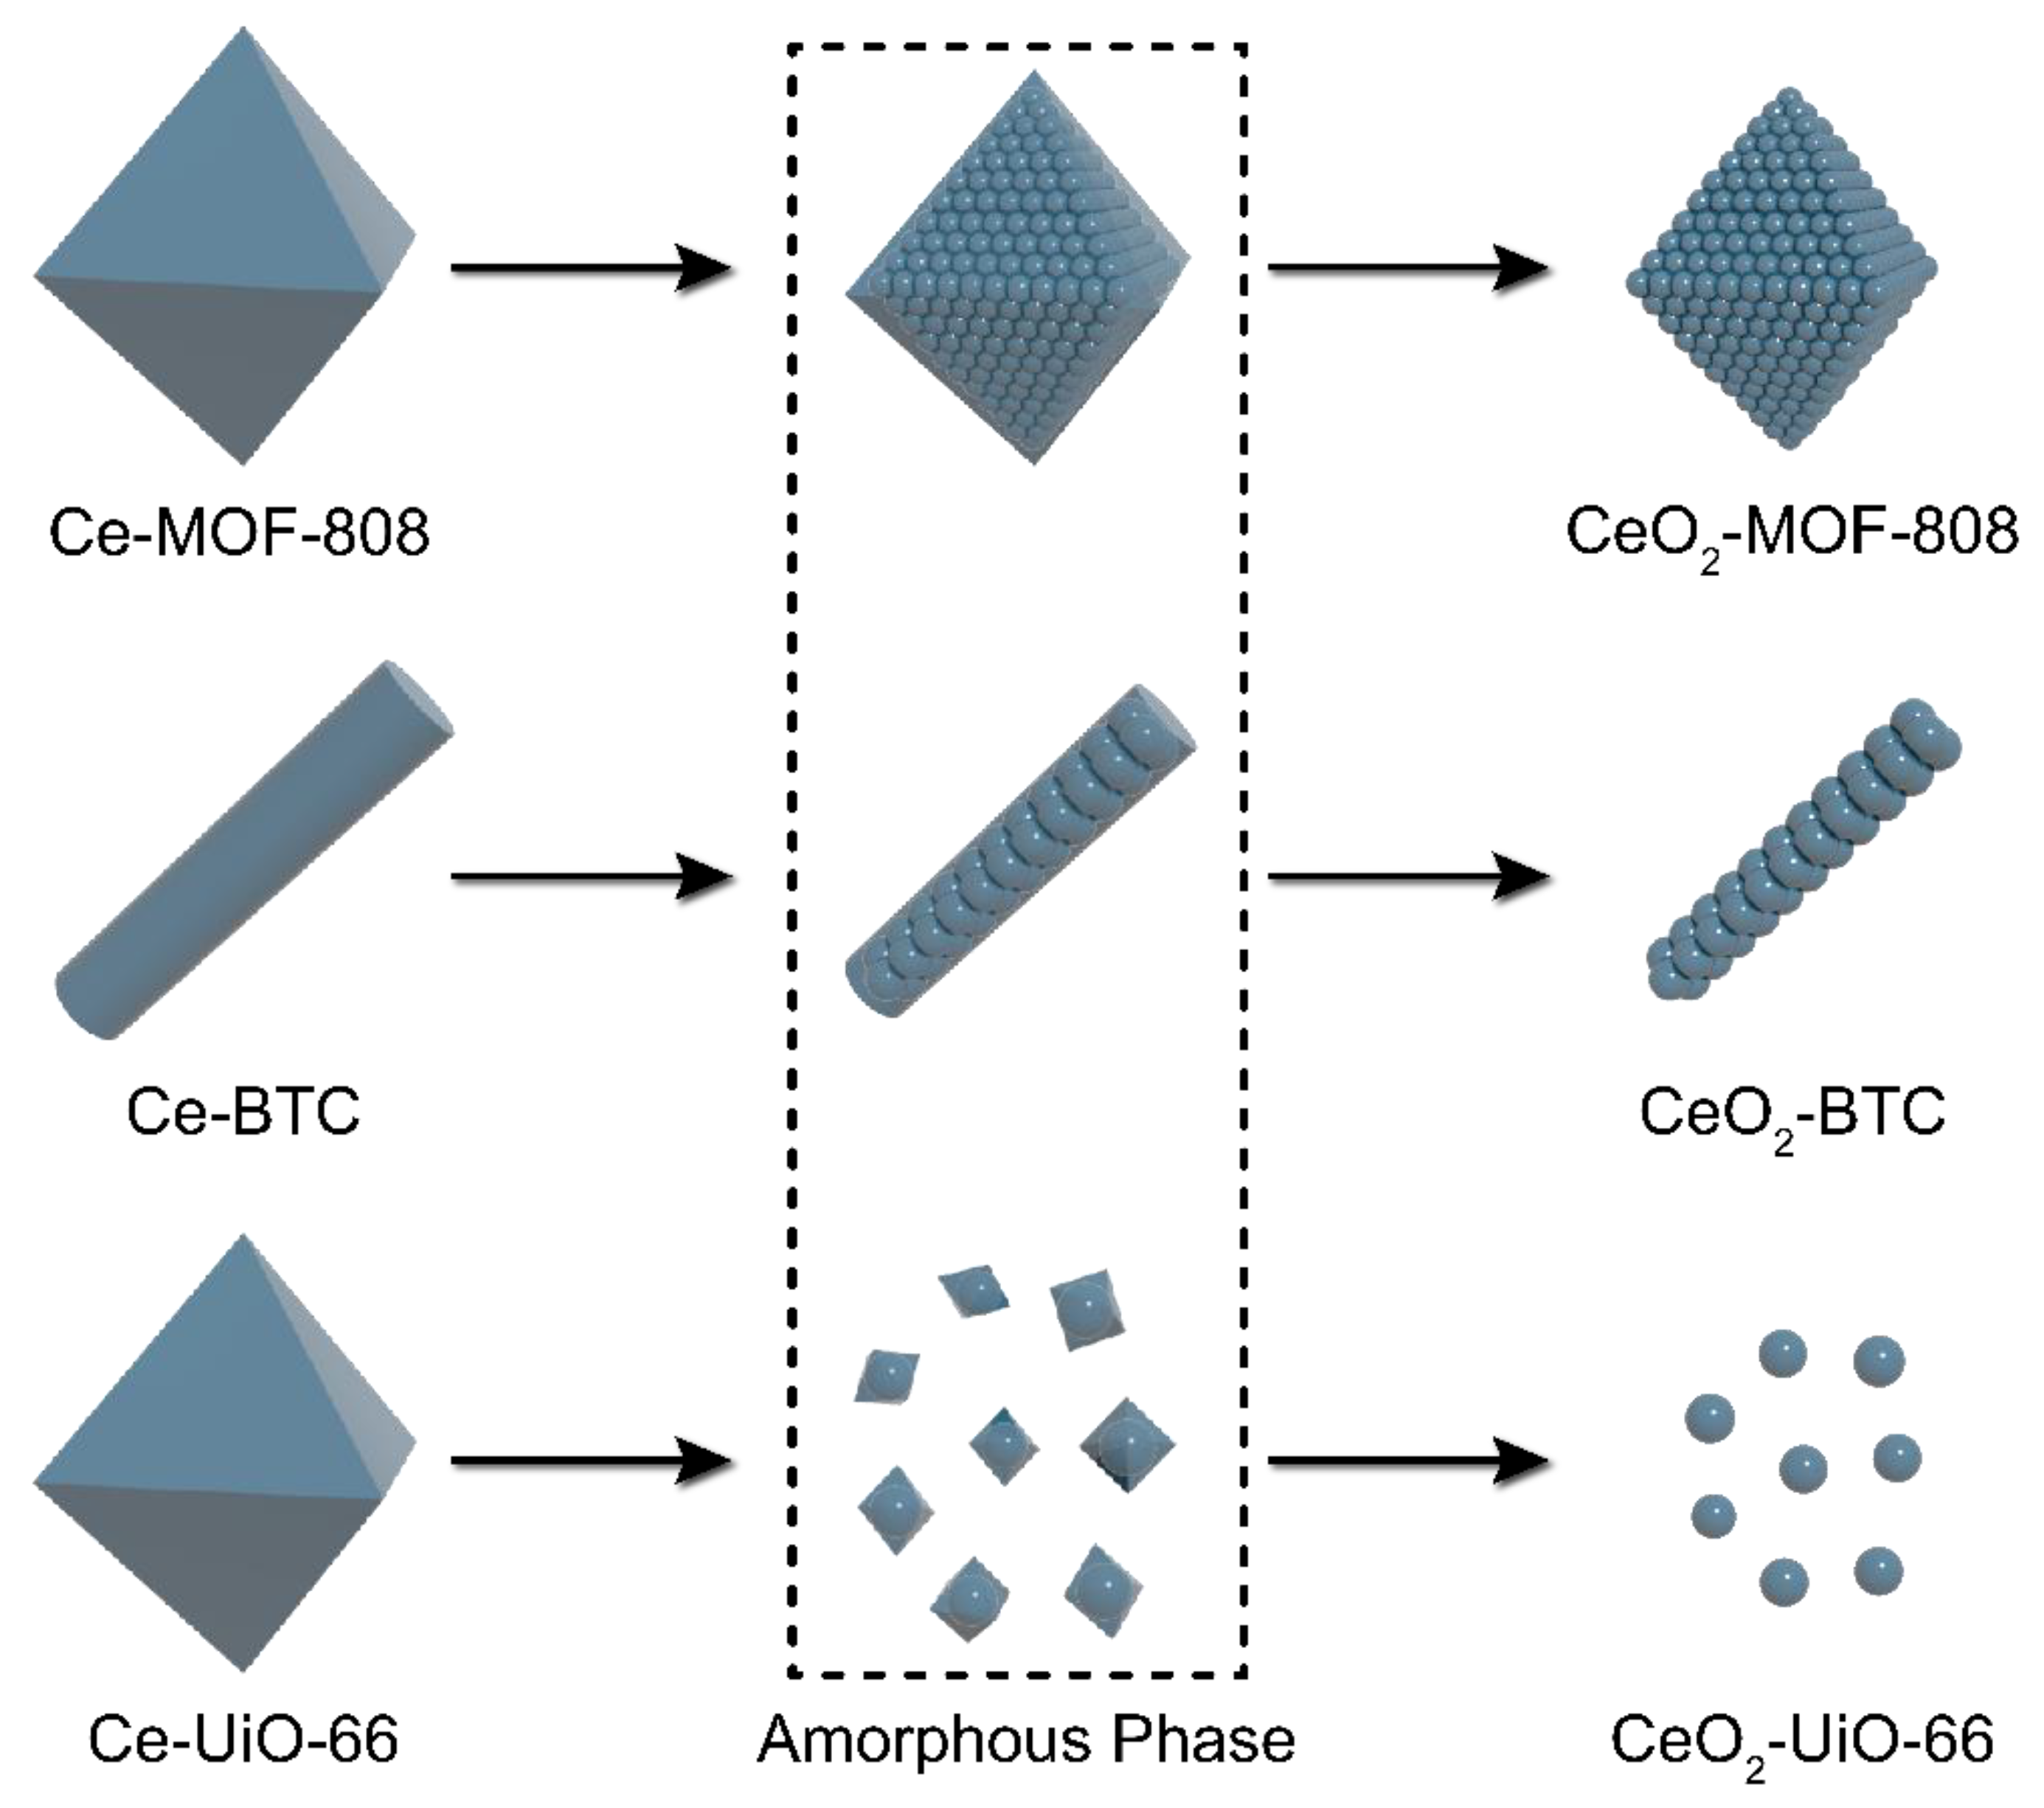
2.1.4. Proposed Mechanism of the Pyrolysis Processes

As shown by the above characterization, the pyrolysis processes were significantly different for the three MOFs, as presented in Scheme 1. For Ce-MOF-808, the coexistence of carbon skeleton and ceria was maintained for a long time in the calcination process. At a relatively low temperature (250 °C), the MOFs structures were destroyed to form a carbon skeleton as a support. This state lasted over a relatively long temperature range until the carbon was further burned to CO2, and then the ceria particles were formed. Because of the different ligands, the frameworks of Ce-UiO-66 first broke into smaller pieces during calcination. Then, structural changes of Ce-UiO-66 were more rapid so that the residual carbon burned out soon after the frameworks collapsed into pieces. Overall, the pyrolysis of Ce-MOF-808 and Ce-BTC were more similar to each other than to Ce-UiO-66. The absence of a carbon skeleton is beneficial to forming a final catalyst with smaller particle size, higher specific surface area, and more defect sites. Next, we focused on the characterization of these oxides and how the calcination process affected the surface composition and the structural defects. These play a crucial role in the catalytic combustion of toluene.

2.2. Characterization of CeO2-MOFs

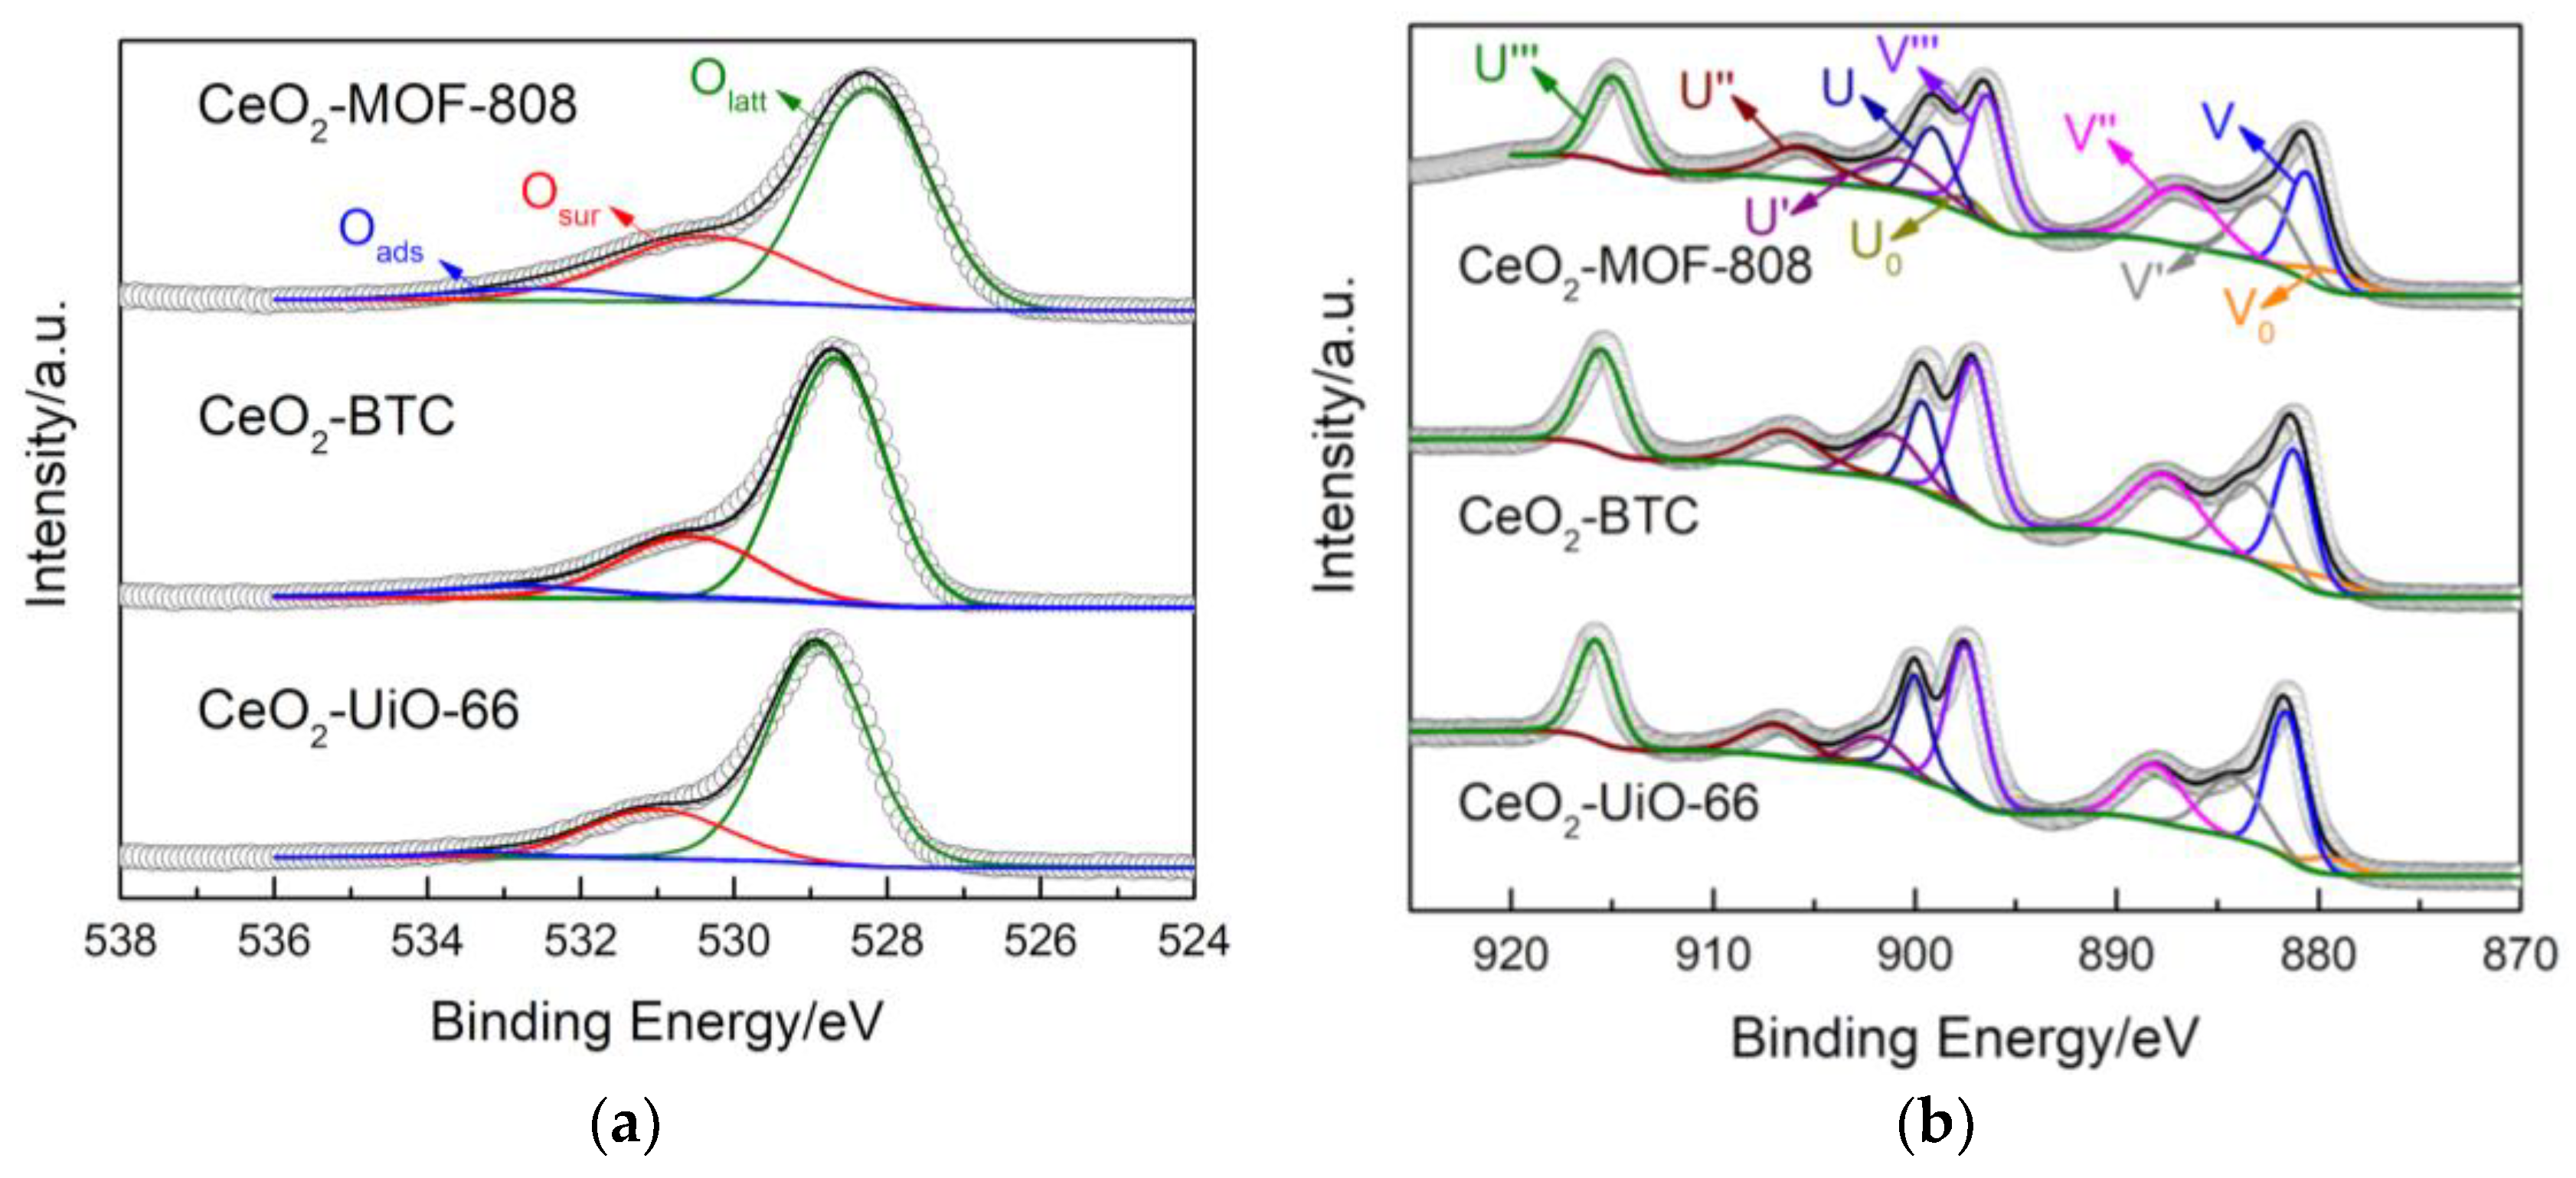
2.2.1. Surface Composition of CeO2-MOFs

Raman spectra were obtained to reveal the defect sites of the samples, as shown in Figure 6a. The strongest vibration peak at 460 cm−1 is attributed to the symmetric stretching (F2g) vibration mode in the cubic fluorite ceria [29]. As shown in the magnified inset (Figure 6a), peaks centered at ca. 600 cm−1 are observed, corresponding to the defect-induced (D) vibration mode. The intensity of the D mode peaks has a linear correlation with the amount of oxygen vacancies, which are caused by the existence of Ce3+ [30]. Accordingly, the ratio of the intensities of D mode and F2g mode peaks (ID/IF2g) can be regarded as an effective indicator for the relative concentration of the oxygen vacancies. As shown in Table 1, the sequence of the values of ID/IF2g was as follows: CeO2-MOF-808 (0.035) > CeO2-BTC (0.026) > CeO2-UiO-66 (0.018). The lattice disorders, rather than the particle sizes, influenced the ID/IF2g ratio [31]. Since there were more small grains of Ce-MOF-808 and Ce-BTC overlapping each other than those of Ce-UiO-66, the calcination process affected not only the grain sizes, but also the structural defects of the crystals. Samples with larger specific surface areas and more intrinsic defect sites more easily produced abundant oxygen defects for the catalytic deep oxidation.
The element contents and the valence states of elements on the surface of CeO2-MOFs were analyzed by X-ray photoelectron spectroscopy (XPS). The surface O1s and Ce3d spectra of three CeO2 samples are shown in Figure 7. By deconvoluting the peaks of O1s spectra at the binding energies of 529–530 eV, 530–531 eV, and 533–534 eV, the contents of adsorbed oxygen on the surface, lattice oxygen on the surface, and bulk lattice oxygen (marked as Oads, Osur, and Olatt, respectively) could be obtained [22,32,33]. Several kinds of active oxygen species such as peroxide species (O) and superoxide species (O2−) are included in Osur. CeO2-MOF-808 demonstrated a ratio of Osur/Olatt of 46.8%, which was much higher than the other two. The ratio of oxygen on the surface of ceria has a significant correlation with its catalytic activity, as a higher ratio of Osur/Olatt leads to stronger catalytic deep oxidation ability.
A distinction between Ce3+ and Ce4+ was also made by separating the Ce3d peaks. Ten peaks were divided according to the binding energy and were marked as V0, V, V′, V′′, V′′′, U0, U, U′, U′′, and U′′′, from lowest to highest. Peaks labeled with V and U were ascribed to Ce 3d3/2 and Ce 3d5/2, respectively. Peaks assigned to Ce3+ included the four peaks U0, U′, V0, and V′, while the peaks assigned to Ce4+ included the other six peaks U, U′′, U′′′, V, V′′, and V′′′. The order of the ratios of Ce3+/(Ce3+ + Ce4+) was CeO2-MOF-808 > CeO2-BTC > CeO2-UiO-66. The presence of Ce3+ suggests the loss of oxygen in stoichiometric CeO2, which is related to the oxygen vacancies [34]. The order of Ce3+ proportions exhibited was in accordance with the sequence of oxygen defects calculated by the Raman analysis.

2.2.2. Oxygen Storage Capacity (OSC) and Reducibility of CeO2-MOFs

OSC was employed to quantify the amount of stored oxygen species. CeO2-MOF-808 possessed 514 μmol(O2)/g(cat), while the OSC values of CeO2-BTC and CeO2-UiO-66 were 488 μmol(O2)/g(cat) and 118 μmol(O2)/g(cat), respectively. Compared with CeO2-UiO-66, CeO2-MOF-808 and CeO2-BTC had higher OSC values, which means that more molecular oxygen in these two is likely to be involved in the catalytic combustion [35].
The redox properties of CeO2-MOFs were assessed by H2-temperature programmed reduction (H2-TPR), as shown in Figure 6b. There are two peaks located around 500 °C and 840 °C, which stand for the reduction of surface oxygen and bulk oxygen, respectively. The lower the temperature at which the reduction peaks are located, the stronger the reducibility of the catalyst surface. Since the surface oxygen takes part in the reaction directly, the reduction peaks at low temperatures (<600 °C) were investigated. CeO2-MOF-808 and CeO2-BTC showed almost the same reducibility with reduction signals at 482 °C and 480 °C, respectively, significantly lower than that of CeO2-UiO-66 (508 °C).

2.3. Catalytic Performance Evaluation of CeO2-MOFs on Toluene Oxidation

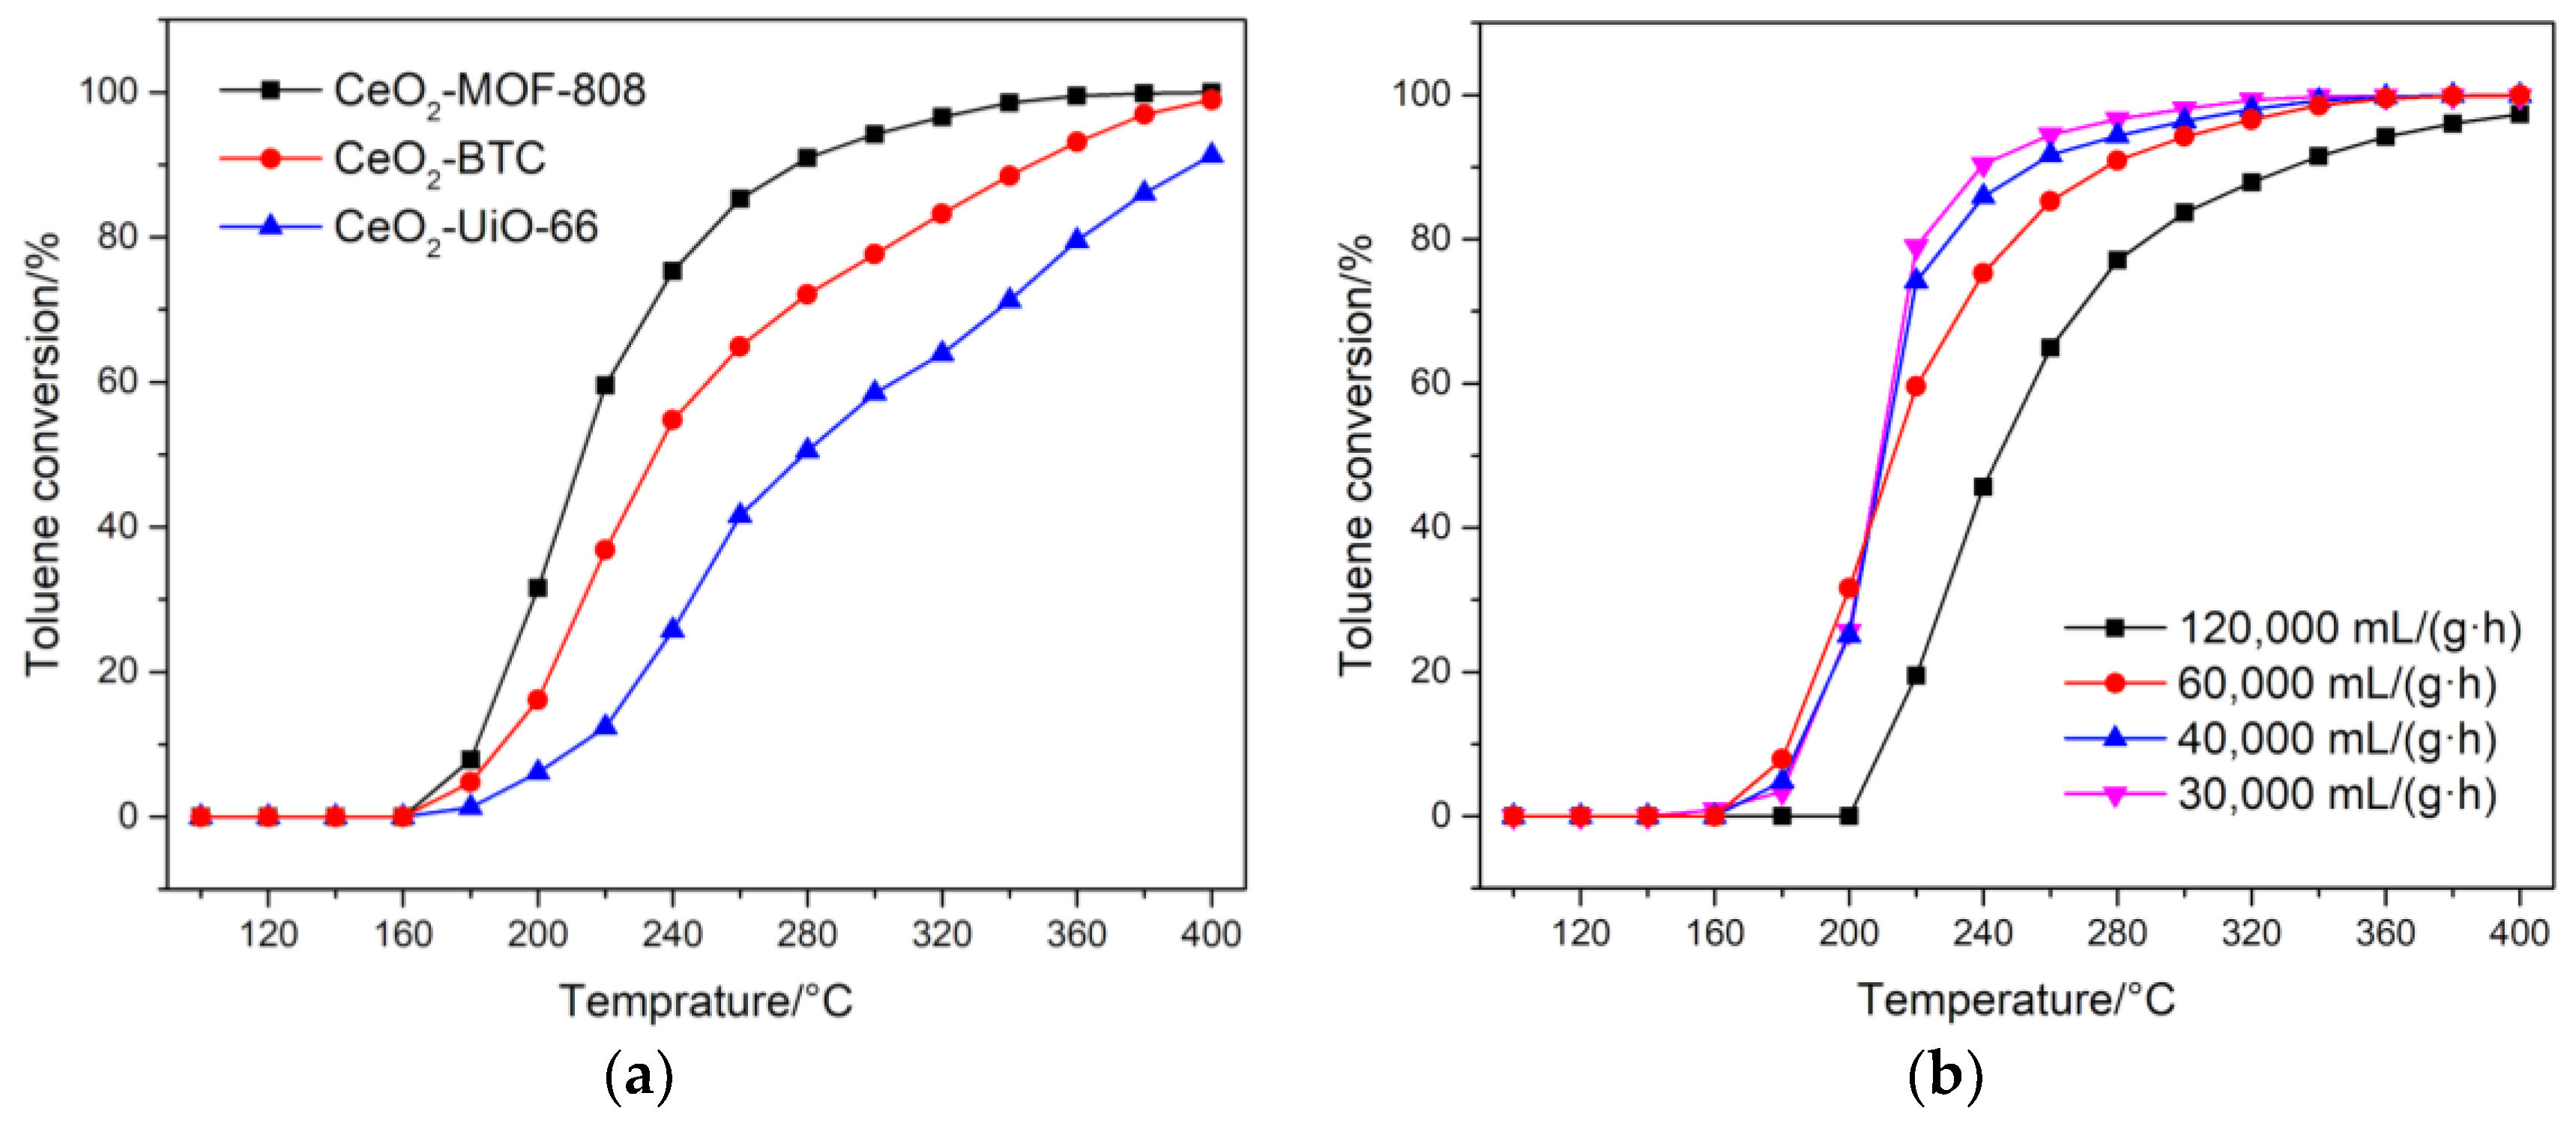
2.3.1. Catalytic Performance of the CeO2-MOFs for Toluene Oxidation

The catalytic activities of CeO2-MOFs were assessed by catalytic combustion of toluene. The test results are shown in Figure 8a. T50 and T90, the temperatures for 50% and 90% conversion are important parameters to evaluate catalytic activity. CeO2-MOF-808, which had the largest surface area, abundant defective sites, and great reducibility, showed the best performance with T50 and T90 at 218 °C and 278 °C, respectively. T50 and T90 of the other two ceria samples are also listed in Table 2, and the order of the ability for catalytic combustion of toluene is CeO2-MOF-808 > CeO2-BTC > CeO2-UiO-66. CeO2-BTC also formed a porous structure but had slightly lower activity because of its relatively larger particle size and lower density of defective sites. The catalyst with the worst catalytic performance was CeO2-UiO-66, which is related to the formation of larger dispersed particles after pyrolysis. For comparison, the catalytic performance of the transition metal oxides derived from MOFs are listed in Table 3. Among these oxides, the T50 value for CeO2-MOF-808 is the lowest when the gas hourly space velocity (GHSV) is no less than 60,000 mL/(g·h)). Since CeO2-MOF-808 performed the best among these three catalysts, the combustion activity of toluene at different space velocities was also tested. With the increase of GHSV from 30,000 to 120,000 mL/(g·h), T50 and T90 over CeO2-MOF-808 were similar, from 30,000 to 60,000 mL/(g·h), while the conversion of toluene decreased obviously at a GHSV of 120,000 mL/(g·h). This indicates that the active sites of CeO2-MOF-808 were enough for toluene combustion at low GHSV (GHSV ≦ 60,000 mL/(g·h)).

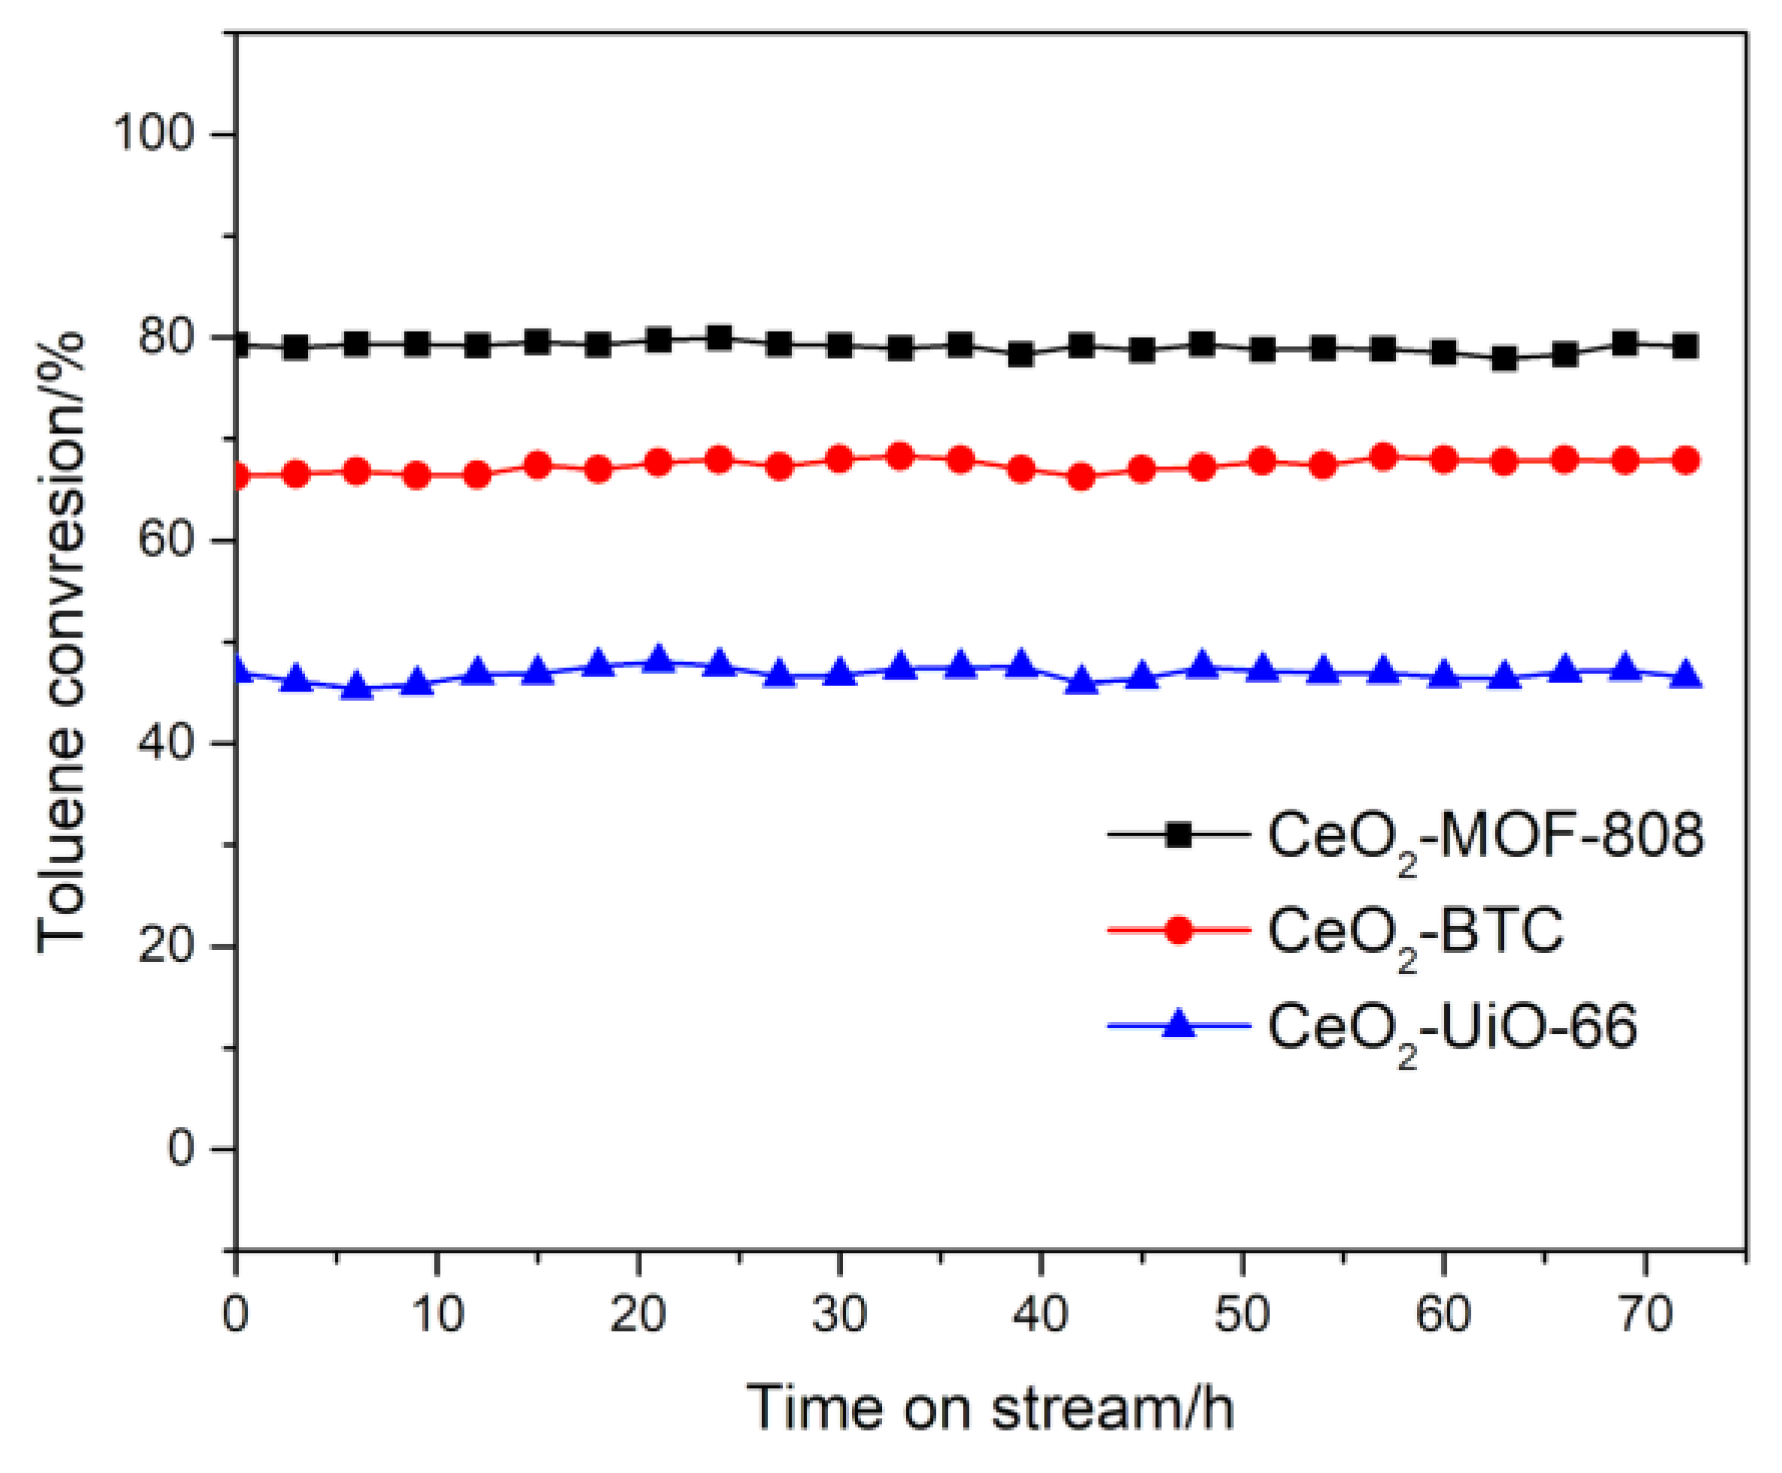
2.3.2. Stability Tests of CeO2-MOFs

The stability of these catalysts was evaluated at 260 °C, and the results are shown in Figure 9. In the 72-h test, a total amount of 432 L reaction gas containing 1000 ppm toluene passed through the catalysts. There was little change in the catalytic activity over the CeO2 catalysts derived from MOFs, which means the data for the catalytic performance are reliable. No organic by-product was detected during catalytic reaction and no carbonaceous deposition was observed after the test either. Therefore, we speculate that under reaction conditions, the physicochemical properties of the catalysts do not change significantly within the testing period.

3. Materials and Methods

3.1. Materials

All the reagents were analytical grade and were used without further purification. 1,3,5-benzenetricarboxylic acid (H3-BTC, C9H6O6, 98%), N,N-dimethylformamide (DMF, C3H7NO, 99.5%), formic acid (CH2O2, 98%), cerium nitrate (Ce(NO3)3·6H2O, 99%), ethanol (CH4O, 99.7%), and toluene (C7H8, 99.5%) were purchased from Sinoreagent (Shanghai, China). Cerium (IV) ammonium nitrate ((NH4)2Ce(NO3)6, 99%) and 1,4-benzenedicarboxylic acid (H2-BDC, C8H6O4, 99%) were purchased from Aladdin (Shanghai, China). Deionized water was obtained by a water purification system (Super-Genie E, RephiLe Bioscience, Ltd., Shanghai, China).

3.2. Synthesis of Three MOFs

Ce-MOFs were synthesized by solvent thermal methods. The synthesis processes were based on the literature and scaled up for catalytic tests [23,24,25].

3.2.1. Synthesis of Ce-MOF-808

To synthesize Ce-MOF-808, H3-BTC (0.224 g, 1.06 mmol) was dissolved in 12 mL DMF in a 50 mL vial. An aqueous solution of (NH4)2Ce(NO3)6 (6 mL, 0.533 M) was then added dropwise. HCOOH (98%, 2.57 mL, 68.3 mmol) was added to the mixture at the same time, as a modulator. After the vial was sealed and heated isothermally at 100 °C for 15 min, the suspension was centrifuged. Afterwards, Ce-MOF-808 powder was washed with 15 mL DMF three times and with 15 mL acetone three times, and then dried in a vacuum at 90 °C overnight.

3.2.2. Synthesis of Ce-BTC

For the synthesis of Ce-BTC, two solutions containing H3-BTC (2.10 g H3-BTC dissolved in 10 mL H2O and 10 mL ethanol) and Ce(NO3)3 (4.34 g Ce(NO3)3·6H2O dissolved in 45 mL H2O) were mixed together and heated with continuous stirring at 60 °C for 1 h. The white precipitate was centrifuged and washed with water and ethanol three times. After drying at 70 °C overnight, Ce-BTC was obtained.

3.2.3. Synthesis of Ce-UiO-66

The synthesis process for Ce-UiO-66 was similar to the process for Ce-MOF-808. H2-BDC (0.531 g, 3.20 mmol) was dissolved in 12 mL DMF in a 50 mL vial. (NH4)2Ce(NO3)6 aqueous solution (6 mL, 0.533 M) was then added. After the vial was sealed, the heating conditions, the washing method, and the drying procedure were the same as those for MOF-808.

3.3. Synthesis of CeO2-MOFs

The ceria derived from these MOF templates were obtained by calcination. To prevent severe pyrolysis of Ce-MOFs in the air, the heating rate was set at 2 °C/min. According to the TGA results, an appropriate calcination temperature was chosen to remove all the carbon. The Ce-MOFs above were heated at 500 °C and maintained for 4 h in the muffle furnace. Yellow powders were collected after cooling down. For catalytic tests, the oxides were compressed and crushed into pieces. Afterwards, 40–60 mesh particles were sifted.

3.4. Characterization

The powder X-ray diffractometer (PXRD, AXS D8, Bruker, Madison, WI, USA) equipped with Cu Kα radiation was operated to obtain the crystal structures and crystalline states. The increment and the rotation speed rate were set as 0.05° and 12°/min, respectively. The nitrogen adsorption/desorption tests of microporous samples (Ce-MOFs) were conducted with the automatic surface and micropore analyzer (ASAP 2020 Plus, Micromeritics, Norcross, GA, USA) at 77 K. Mesoporous samples (CeO2-MOFs) were tested by another machine (Tristar II 3020, Micromeritics, Norcross, GA, USA) under the same conditions. The Brunauer–Emmett–Teller (BET) method was used to calculate the specific surface area. The t-plot and the density functional theory (DFT) methods were employed to analyze the micropores. Thermogravimetric analysis (TGA, TGA8000, PerkinElmer, Waltham, MA, USA) was performed under air at the heating rate of 10 °C/min to record the mass change of the MOFs in the heating process. Transmission electron microscopy (TEM, JEM-2010, JEOL, Tokyo, Japan) and scanning electron microscopy (SEM, Phenom Prox, Phenom, Eindhoven, The Netherlands) were used to observe the morphology and the size of the samples. The analysis of the surface element and the valence states was conducted by X-ray photoelectron spectroscopy (XPS, Axis Ultra Dld, Kratos, Manchester, UK) with an Al Kα source (hv = 1486.6 eV). A chemisorption analyzer (Auto Chem II 2920, Micromeritics, Norcross, GA, USA) with a TPx system was used to record the data of the H2-temperature programmed reduction characteristic (H2-TPR). After pretreatment in pure helium at the rate of 30 mL/min at 300 °C for 30 min, the samples were purged with 5% H2/He gas. The temperature was ramped up at 10 °C/min from 50 °C to 900 °C and the hydrogen consumption was collected with a thermal conductivity detector. The oxygen storage capacity tests were also performed on the same chemisorption analyzer with H2-TPR. 5% H2/He gas was used to reduce the samples at 300 °C for 1h and then the samples cooled down with the protection of helium. 5% O2/He pulses were introduced at 300 °C until the peak areas of the O2 TCD signals remained unchanged.

3.5. Catalytic Performance

Tests of the above catalytic performance were carried out in a flow fixed-bed reactor (length = 405 mm, i.d. = 8 mm) loading 100 mg catalysts (40–60 mesh) mixed with 600 mg quartz sand. A stream of high-purity air (21% O2 + 79% N2) flow passed through toluene at 2 °C, maintained by a constant temperature water bath, and was then diluted by the other stream of high-purity air to obtain the reactant feed consisting of 1000 ppm toluene and air. The total flow rate was set from 50 mL/min to 200 mL/min to obtain a GHSV of 30,000 mL/(gcat·h) to 120,000 mL/(gcat·h). For the catalytic comparative tests and durability tests, the GHSV was set as 60,000 mL/(gcat·h). The temperature for the test ranged from 100 °C to 400 °C. After being maintained at a certain temperature for 30 min, the outlet was introduced into an online Trace GC Ultra equipped with flame ionization detector (FID) and PLOT Q column. Possible organic by-products, such as benzaldehyde and benzoic acid, were not detected in the experiments.
The conversion of toluene was calculated by the following equation:
Conversion = C i n C o u t C i n × 100 %
where Cin and Cout stand for the concentration of the inlet and outlet, respectively.

4. Conclusions

In summary, ceria samples derived from Ce-MOF-808, Ce-BTC, and Ce-UiO-66 have been synthesized and successfully applied in the catalytic combustion of toluene. The temperatures at which the organic frameworks transform to carbon and then the carbon skeletons burn out, are determined by the topological structures and coordinate environments of MOFs in the pyrolysis progress. Ceria catalysts with more defective sites can be formed by protection of the carbon skeleton in Ce-MOF-808 and Ce-BTC. These defects play an important role in the catalytic combustion. Thus, the catalysts perform with the activity sequence: CeO2-MOF-808 > CeO2-BTC > CeO2-UiO-66. CeO2-MOF-808 with the smallest particle size, the highest content of reactive oxygen species, and the greatest reductive properties, exhibited the best catalytic performance. Coordinate environments of MOFs are critical for the particle formation process. BTC as a ligand was more conducive to the maintenance of a skeleton than BDC during calcination. Surface properties of MOF precursors play an important role in the formation of oxides. The large surface area and abundant oxygen defects of CeO2-MOF-808 originate from the porous structure of the MOF-808 precursor.

Supplementary Materials

The following are available online at https://0-www-mdpi-com.brum.beds.ac.uk/2073-4344/9/8/682/s1, Figure S1: SEM images of Ce-MOF-808, Ce-BTC, and Ce-UiO-66 before calcination (a1, b1, c1), Ce-MOF-808-250, Ce-BTC-340 and Ce-UiO-66-320 after calcination at 250 °C, 340 °C, and 320 °C, respectively (a2, b2, c2) and the corresponding final CeO2-MOFs after calcination at 500 °C (a3, b3, c3).

Author Contributions

W.S. (Wenjie Sun) designed and performed the experiments, analyzed the data, and wrote the paper; X.L. prepared the MOFs; Z.H. and C.S. designed the reactor system; H.X. and W.S. (Wei Shen) conceived the project and reviewed the paper.

Funding

This research was supported by the National Key R&D Program of the Ministry of Science and Technology (Grant No. 2017YFB0602204), the National Natural Science Foundation of China (Grant No. 91645201), and the Shanghai Science and Technology Committee (Grant No. 14DZ2273900).

Conflicts of Interest

The authors declare no conflicts of interest.

References

  1. Kampa, M.; Castanas, E. Human health effects of air pollution. Environ. Pollut. 2008, 151, 362–367. [Google Scholar] [CrossRef] [PubMed]
  2. Wang, T.; Wei, X.L.; Ding, A.J.; Poon, C.N.; Lam, K.S.; Li, Y.S.; Chan, L.Y.; Anson, M. Increasing surface ozone concentrations in the background atmosphere of Southern China, 1994–2007. Atmos. Chem. Phys. 2009, 9, 6217–6227. [Google Scholar] [CrossRef]
  3. Hui, L.; Liu, X.; Tan, Q.; Feng, M.; An, J.; Qu, Y.; Zhang, Y.; Cheng, N. VOC characteristics, sources and contributions to SOA formation during haze events in Wuhan, Central China. Sci. Total Environ. 2019, 650, 2624–2639. [Google Scholar] [CrossRef] [PubMed]
  4. Zhou, K.; Ma, W.; Zeng, Z.; Ma, X.; Xu, X.; Guo, Y.; Li, H.; Li, L. Experimental and DFT study on the adsorption of VOCs on activated carbon/metal oxides composites. Chem. Eng. J. 2019, 372, 1122–1133. [Google Scholar] [CrossRef]
  5. Zhang, S.; You, J.; Kennes, C.; Cheng, Z.; Ye, J.; Chen, D.; Chen, J.; Wang, L. Current advances of VOCs degradation by bioelectrochemical systems: A review. Chem. Eng. J. 2018, 334, 2625–2637. [Google Scholar] [CrossRef]
  6. Liotta, L.F. Catalytic oxidation of volatile organic compounds on supported noble metals. Appl. Catal. B Environ. 2010, 100, 403–412. [Google Scholar] [CrossRef]
  7. Temerev, V.L.; Vedyagin, A.A.; Afonasenko, T.N.; Iost, K.N.; Kotolevich, Y.S.; Baltakhinov, V.P.; Tsyrulnikov, P.G. Effect of Ag loading on the adsorption/desorption properties of ZSM-5 towards toluene. React. Kinet. Mech. Catal. 2016, 119, 629–640. [Google Scholar] [CrossRef]
  8. Behar, S.; Gomez-Mendoza, N.-A.; Gomez-Garcia, M.-A.; Swierczynski, D.; Quignard, F.; Tanchoux, N. Study and modelling of kinetics of the oxidation of VOC catalyzed by nanosized Cu-Mn spinels prepared via an alginate route. Appl. Catal. A Gen. 2015, 504, 203–210. [Google Scholar] [CrossRef]
  9. Carrillo, A.M.; Carriazo, J.G. Cu and Co oxides supported on halloysite for the total oxidation of toluene. Appl. Catal. B Environ. 2015, 164, 443–452. [Google Scholar] [CrossRef]
  10. Piumetti, M.; Fino, D.; Russo, N. Mesoporous manganese oxides prepared by solution combustion synthesis as catalysts for the total oxidation of VOCs. Appl. Catal. B Environ. 2015, 163, 277–287. [Google Scholar] [CrossRef]
  11. Garcia, T.; Agouram, S.; Sanchez-Royo, J.F.; Murillo, R.; Maria Mastral, A.; Aranda, A.; Vazquez, I.; Dejoz, A.; Solsona, B. Deep oxidation of volatile organic compounds using ordered cobalt oxides prepared by a nanocasting route. Appl. Catal. A Gen. 2010, 386, 16–27. [Google Scholar] [CrossRef]
  12. Schilling, C.; Hess, C. Elucidating the Role of Support Oxygen in the Water-Gas Shift Reaction over Ceria-Supported Gold Catalysts Using Operando Spectroscopy. ACS Catal. 2019, 9, 1159–1171. [Google Scholar] [CrossRef]
  13. Huang, N.; Geng, Y.; Xiong, S.; Huang, X.; Kong, L.; Yang, S.; Peng, Y.; Chen, J.; Li, J. The promotion effect of ceria on high vanadia loading NH3-SCR catalysts. Catal. Commun. 2019, 121, 84–88. [Google Scholar] [CrossRef]
  14. Zhao, P.; Qin, F.; Huang, Z.; Sun, C.; Shen, W.; Xu, H. MOF-derived hollow porous Ni/CeO2 octahedron with high efficiency for N2O decomposition. Chem. Eng. J. 2018, 349, 72–81. [Google Scholar] [CrossRef]
  15. Feng, Z.; Ren, Q.; Peng, R.; Mo, S.; Zhang, M.; Fu, M.; Chen, L.; Ye, D. Effect of CeO2 morphologies on toluene catalytic combustion. Catal. Today 2019, 332, 177–182. [Google Scholar] [CrossRef]
  16. Manuel Lopez, J.; Gilbank, A.L.; Garcia, T.; Solsona, B.; Agouram, S.; Torrente-Murciano, L. The prevalence of surface oxygen vacancies over the mobility of bulk oxygen in nanostructured ceria for the total toluene oxidation. Appl. Catal. B Environ. 2015, 174, 403–412. [Google Scholar] [CrossRef]
  17. Hu, F.; Chen, J.; Peng, Y.; Song, H.; Li, K.; Li, J. Novel nanowire self-assembled hierarchical CeO2 microspheres for low temperature toluene catalytic combustion. Chem. Eng. J. 2018, 331, 425–434. [Google Scholar] [CrossRef]
  18. Jiao, L.; Wang, Y.; Jiang, H.-L.; Xu, Q. Metal-Organic Frameworks as Platforms for Catalytic Applications. Adv. Mater. 2018, 30. [Google Scholar] [CrossRef]
  19. Zhao, W.; Zhang, Y.; Wu, X.; Zhan, Y.; Wang, X.; Au, C.-T.; Jiang, L. Synthesis of Co-Mn oxides with double-shelled nanocages for low-temperature toluene combustion. Catal. Sci. Technol. 2018, 8, 4494–4502. [Google Scholar] [CrossRef]
  20. Luo, Y.; Zheng, Y.; Zuo, J.; Feng, X.; Wang, X.; Zhang, T.; Zhang, K.; Jiang, L. Insights into the high performance of Mn-Co oxides derived from metal organic frameworks for total toluene oxidation. J. Hazard. Mater. 2018, 349, 119–127. [Google Scholar] [CrossRef]
  21. Wang, H.; Liu, M.; Guo, S.; Wang, Y.; Han, X.; Bai, Y. Efficient oxidation of o-xylene over CeO2 catalyst prepared from a Ce-MOF template: The promotion of K+ embedding substitution. Mol. Catal. 2017, 436, 120–127. [Google Scholar] [CrossRef]
  22. Chen, X.; Chen, X.; Yu, E.; Cai, S.; Jia, H.; Chen, J.; Liang, P. In situ pyrolysis of Ce-MOF to prepare CeO2 catalyst with obviously improved catalytic performance for toluene combustion. Chem. Eng. J. 2018, 344, 469–479. [Google Scholar] [CrossRef]
  23. Lammert, M.; Glissmann, C.; Reinsch, H.; Stock, N. Synthesis and Characterization of New Ce(IV)-MOFs Exhibiting Various Framework Topologies. Cryst. Growth Des. 2017, 17, 1125–1131. [Google Scholar] [CrossRef]
  24. Liu, K.; You, H.; Jia, G.; Zheng, Y.; Huang, Y.; Song, Y.; Yang, M.; Zhang, L.; Zhang, H. Hierarchically Nanostructured Coordination Polymer: Facile and Rapid Fabrication and Tunable Morphologies. Cryst. Growth Des. 2010, 10, 790–797. [Google Scholar] [CrossRef]
  25. Lammert, M.; Wharmby, M.T.; Smolders, S.; Bueken, B.; Lieb, A.; Lomachenko, K.A.; De Vos, D.; Stock, N. Cerium-based metal organic frameworks with UiO-66 architecture: Synthesis, properties and redox catalytic activity. Chem. Commun. 2015, 51, 12578–12581. [Google Scholar] [CrossRef] [PubMed]
  26. Chen, G.; Guo, Z.; Zhao, W.; Gao, D.; Li, C.; Ye, C.; Sun, G. Design of Porous/Hollow Structured Ceria by Partial Thermal Decomposition of Ce-MOF and Selective Etching. ACS Appl. Mater. Interfaces 2017, 9, 39594–39601. [Google Scholar] [CrossRef]
  27. Isaeva, V.I.; Belyaeva, E.V.; Fitch, A.N.; Chernyshev, V.V.; Klyamkin, S.N.; Kustov, L.M. Synthesis and Structural Characterization of a Series of Novel Zn(II)-based MOFs with Pyridine-2, 5-dicarboxylate Linkers. Cryst. Growth Des. 2013, 13, 5305–5315. [Google Scholar] [CrossRef]
  28. Yang, X.; Yu, X.; Lin, M.; Ma, X.; Ge, M. Enhancement effect of acid treatment on Mn2O3 catalyst for toluene oxidation. Catal. Today 2019, 327, 254–261. [Google Scholar] [CrossRef]
  29. Agarwal, S.; Zhu, X.; Hensen, E.J.M.; Lefferts, L.; Mojet, B.L. Defect Chemistry of Ceria Nanorods. J. Phys. Chem. C 2014, 118, 4131–4142. [Google Scholar] [CrossRef]
  30. Gao, W.; Zhang, Z.; Li, J.; Ma, Y.; Qu, Y. Surface engineering on CeO2 nanorods by chemical redox etching and their enhanced catalytic activity for CO oxidation. Nanoscale 2015, 7, 11686–11691. [Google Scholar] [CrossRef]
  31. Wu, Z.; Li, M.; Howe, J.; Meyer, H.M., III; Overbury, S.H. Probing Defect Sites on CeO2 Nanocrystals with Well-Defined Surface Planes by Raman Spectroscopy and O2 Adsorption. Langmuir 2010, 26, 16595–16606. [Google Scholar] [CrossRef]
  32. Lu, H.-F.; Zhou, Y.; Han, W.-F.; Huang, H.-F.; Chen, Y.-F. Promoting effect of ZrO2 carrier on activity and thermal stability of CeO2-based oxides catalysts for toluene combustion. Appl. Catal. A Gen. 2013, 464, 101–108. [Google Scholar] [CrossRef]
  33. He, H.; Lin, X.; Li, S.; Wu, Z.; Gao, J.; Wu, J.; Wen, W.; Ye, D.; Fu, M. The key surface species and oxygen vacancies in MnOx(0.4)-CeO2 toward repeated soot oxidation. Appl. Catal. B Environ. 2018, 223, 134–142. [Google Scholar] [CrossRef]
  34. Wang, X.; Wu, J.; Wang, J.; Xiao, H.; Chen, B.; Peng, R.; Fu, M.; Chen, L.; Ye, D.; Wen, W. Methanol plasma-catalytic oxidation over CeO2 catalysts: Effect of ceria morphology and reaction mechanism. Chem. Eng. J. 2019, 369, 233–244. [Google Scholar] [CrossRef]
  35. Alikin, E.A.; Vedyagin, A.A. High Temperature Interaction of Rhodium with Oxygen Storage Component in Three-Way Catalysts. Top. Catal. 2016, 59, 1033–1038. [Google Scholar] [CrossRef]
Figure 1. The structural diagrams of (a) Ce-BTC, (b) Ce-MOF-808, and (c) Ce-UiO-66. Blue polyhedron: Ce cluster; red ball: O; black ball: C; pink and violet ball: pore.
Catalysts 09 00682 g001
Figure 2. The PXRD patterns for the Ce-MOFs.
Catalysts 09 00682 g002
Figure 3. TEM images of Ce-MOF-808, Ce-BTC, and Ce-UiO-66 before calcination (a1, b1, c1); Ce-MOF-808-250, Ce-BTC-340, and Ce-UiO-66-320 after calcination at 250 °C, 340 °C, and 320 °C respectively (a2, b2, c2); and the corresponding final CeO2-MOFs after calcination at 500 °C (a3, b3, c3).
Catalysts 09 00682 g003
Figure 4. The TGA profiles of the Ce-MOFs.
Catalysts 09 00682 g004
Figure 5. The PXRD patterns of (a) Ce-MOF-808, (b) Ce-BTC, and (c) Ce-UiO-66 at different temperatures, and (d) the CeO2-MOFs after calcination at 500 °C.
Catalysts 09 00682 g005
Scheme 1. Presentation of the roasting processes of three metal organic frameworks (MOFs).
Catalysts 09 00682 sch001
Figure 6. (a) The Raman curves of CeO2-MOFs and (b) the H2-TPR of CeO2-MOFs.
Catalysts 09 00682 g006
Figure 7. The surface (a) O1s and (b) Ce3d spectra of three CeO2-MOF samples.
Catalysts 09 00682 g007
Figure 8. The combustion curves of 1000 ppm toluene in air (a) catalyzed by CeO2-MOFs at a GHSV of 60,000 mL/(g·h), and (b) for CeO2-MOF-808 at different GHSV from 30,000 mL/(g·h) to 120,000 mL/(g·h).
Catalysts 09 00682 g008
Figure 9. The stability test of the three ceria samples. Reaction conditions: toluene concentration: 1000 ppm; gas hourly space velocity (GHSV): 60,000 mL/(g·h); temperature: 260 °C.
Catalysts 09 00682 g009
Table 1. The surface properties of Ce-MOFs.
Specific Surface Area (m2/g)Micropore Area (m2/g)Micropore Volume (cm3/g)Micropore Width (nm)
Ce-MOF-808469.4350.40.1821.948
Ce-BTC28.9---
Ce-UiO-66425.0234.30.1261.022
Table 2. The surface properties and catalytic performance of CeO2-MOFs.
Particle Size (nm) aParticle Size (nm) bSpecific Surface Area (m2/g)ID/IF2gCe3+/(Ce3+ + Ce4+) (%)Osur/Olatt (%)
CeO2-MOF-8085.26.796.60.03525.446.8
CeO2-BTC9.79.871.50.02624.436.8
CeO2-UiO-6610.611.138.80.01819.130.2
a crystallite size calculated by Scherrer’s formula. b average particle size obtained by TEM.
Table 3. The catalytic performance of transition metal oxides derived from MOFs.
OxidesPrecursorT50T90Toluene ConcentrationGHSVReference
CeO2Ce-MOF-808218278100060,000This work
CeO2Ce-BTC232343100060,000This work
CeO2Ce-UiO-66280392100060,000This work
CeO2Ce-BTC211223100020,000Reference [22]
233251 120,000Reference [22]
Co-MnCo-Mn-MOF22624050096,000Reference [20]
Co-MnZIF-74232248100060,000Reference [19]

