Article

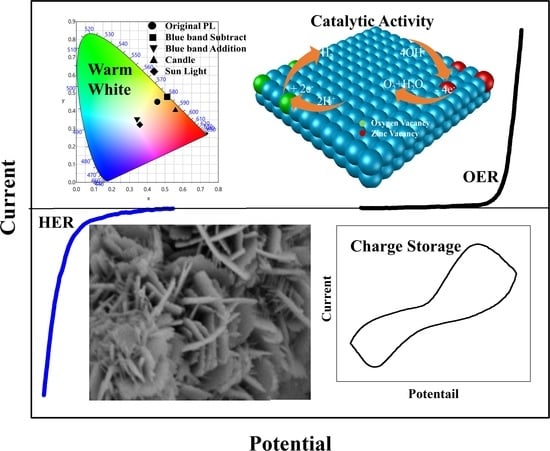
Multifunctional Hierarchically Architectured ZnO for Luminescence, Photocatalytic, Electrocatalytic, and Energy Storage Applications

1
School of Materials Science and Technology, Indian Institute of Technology, Banaras Hindu University, Varanasi 221005, India
2
Government Engineering College, Bharatpur 321001, India
3
Department of Electronics Engineering, Yeungnam University, Gyeongsan 38541, South Korea
4
Department of Electronics and Communication Engineering, Indian Institute of Information Technology, Allahabad 211015, India
5
Department of Physics & Center for Atomic, Molecular and Optical Sciences & Technologies, Indian Institute of Technology Tirupati, Yerpedu 517619, India
*
Authors to whom correspondence should be addressed.
First and second authors are equally contributed.
Submission received: 22 September 2020 / Revised: 28 October 2020 / Accepted: 5 November 2020 / Published: 10 November 2020

Abstract

:
Hierarchically ZnO nanoarchitecture synthesized through coprecipitation technique. Growth process has been analyzed by varying pH from 5.5 to 13 along with post heat treatment process through the observation of surface morphology from 2D plates, triangular, hexagonal rods, needles, and finally to hierarchical. X-ray diffraction (XRD) reveals many intermediate phases along with ZnO which has been eliminated through the proper pH and temperature. The native defects have been discussed by using Raman and positron annihilation spectroscopy. Further, multifunctional properties of synthesized material have been discussed by candle-like warm white luminescence, photocatalysis, electrocatalysis and energy storage applications. Specially hierarchically nanoarchitecture found suitable for warm white lighting along with effective for waste water treatment by visible light. The highly porous property of the same material made itself appropriate for effective oxygen evaluation reaction and hydrogen evolution reaction together with reduced overpotential and Tafel slope. The application for supercapacitor electrode (~780 F/g) also has been revealed which opened new dimension for hierarchical ZnO.

Graphical Abstract

1. Introduction

ZnO has the potential to be a highly multifunctional material with coexisting semiconducting, electromechanical, magnetic, and optical properties. Despite it being of great promise as a device material, limited success has been achieved till date. This lack of rapid progress is due, in part, to a lack of understanding of the roles of various defects in ZnO material and their effect on device performance. ZnO, with different morphologies and less native defects, is found to be important functional material to accommodate a large variety of applications. Control of the morphology of ZnO is essentially required to fulfill the production of future generation of smart and functional materials. The novel properties of nanomaterials depend on their size and shape as the various facets or directions in a crystal may exhibit different physical as well as chemical properties. Therefore, new synthetic strategies and a better understanding of the growth mechanisms are essentially required.
Recent research has demonstrated the formation of ZnO in highly oriented and ordered arrays. ZnO nanostructures, such as nanodots [1], nanowires (NWs) [2], nanorods (NRs) [3], nanobelts [4], nanorings [5], nanotubes (NTs) [6], nanocages [7] and hierarchical [8] patterns, etc., have been prepared by different methods. These structures have been synthesized under controlled growth conditions. There have been many existing preparative techniques for ZnO. In literature, there are various reports of the high-temperature growth techniques such as metalorganic chemical vapor deposition (MOCVD) [9], vapor phase transport (VPT) [10], vapor liquid–solid epitaxial (VLSE) mechanisms [11,12,13], vapor-phase epitaxy [14], and template-assisted growth [15] having been already presented. These gas-phase approaches generally require high temperature and expensive equipment. The main limitation of these epitaxial growth methods is that the crystals are attached to a substrate or embedded in a matrix. Most of the substrates are insulating, relatively expensive and not compatible with semiconductor integrated techniques, which limits the range of possible applications of ZnO nanostructures in photonic and electronic devices. On the other hand, some low-temperature growth techniques such as chemical reactions from aqueous solutions [16] and electrochemical techniques [17,18] have been used successfully for the synthesis of highly oriented arrays of anisotropic ZnO with different shapes.
Controlled precipitation is an extensively used method to synthesize ZnO, since it makes it likely to get a product with repeatable properties. Most of the synthesis techniques utilize different types of substrate (as a seed layer) including the addition of auxiliary agents, such as organic ligands and metal-ion impurities, to grow various morphologies. In particular, precipitation reactions in unpressurised aqueous media offer relatively low cost, high yield, and more controllable process compared to other methods of synthesis and have the potential to scale-up production without any use of surfactant or substrate. In the case of ZnO synthesis, precipitation method involves fast and spontaneous reduction of a solution of zinc salt by using a reducing agent. The most probable zinc salts are zinc nitrate, zinc chloride, zinc sulphate, zinc carbonate, and zinc acetate. NaOH, KOH, LiOH, and NH4OH can be used as a reducing agent. The precipitation process is normally initiated by the formation of an amorphous zinc hydroxide to a crystallized hydroxide, after that zinc hydroxide transforms into solid ZnO nuclei by thermal decomposition/dehydration processes. There is still considerable uncertainty regarding the possible role of zinc hydroxide in the mechanism by which the zinc hydroxide (if it forms) converts to zinc oxide, and the factors effecting product morphology. The shape and size of crystals formed from aqueous solutions are quite variable with slight variation in any parameter of the reaction. In a report of Jia et al., the transformation mechanism from Zn(OH)2 to ZnO is demonstrated [19]. Using ZnCl2 and NH4OH precursors and the cationic surfactant CTAB (cetyltrimethylammonium bromide), Wang et al. have synthesized highly crystalline ZnO with small and well-dispersed spherical nanoparticles [20]. Various shapes of ZnO forms like rice grains, nuts, and rods have been synthesized by Li et al. by using, Zn(NO3)2·6H2O and NaOH as precursors and sodium dodecyl sulfate (SDS) and triethanolamine (TEA) as cationic surfactants [21]. Furthermore, several studies have examined the very significant effects of change in various growth parameters such as stirring, temperature, or pH on the morphology of the product [22,23].
ZnO nanostructures have been gained significant interest for light emitting devices from UV to full visible spectrum, energy conversion, and generation application including for energy storage. Conventional sol-gel including co-precipitation method have been utilized for white light emitting diodes by just tuning of different inter band levels of interstitial oxygen (Oi), oxygen vacancies (VO), interstitial zinc (Zni), and antisite oxygen (OZn) [24,25]. ZnO nanocrystals have also been successfully used for electrochemical water splitting and hydrogen generation [26,27]; however, their application is limited with reasonable performance. The significant tailoring of ZnO features have been utilized even for catalytic reactions induced by light [28]. The doped and undoped ZnO along with their composites have been reported as photo-catalysts and electro-catalysts for oxygen evolution, hydrogen evolution and dye degradation. Moreover, worldwide scholars are also focusing toward energy production and storage to fulfill the future demand of clean energy and moving to replace the conventional costly electrode materials by making them cost effective, and eco-friendly. ZnO materials system have shown their strength to fulfill this demand with new challenges for renewable and sustainable society. Among all energy storage devices, supercapacitor has been established as a futuristic approach along with high energy density and fast charging and discharging features. ZnO also marked itself in this most innovative and fastest growing field of research with significant prospects. Many innovative ideas with ZnO have been introduced to achieved high specific capacitance and energy density, such as carbon sphere @ZnO core-shell nanocomposites, ZnO/carbon nanotube composite, and ZnO/graphene composite [29,30,31,32]. Basically, most studies focused on designing the composite form for ion and charge diffusion, and much effort is also needed for pristine material to enhance the capacity. Among vastly explored ZnO morphologies, functionalities are also limited due to many physical and structural point of view.
Therefore, this study has tried to fulfill the demand of multifunctionalities by synthesizing hierarchically architectured ZnO by using a conventional coprecipitation technique. This study has presented synthesis of hierarchical ZnO nanostructured by just tuning pH value during the reaction with new insight into previous work to open the new domain of application. The results have discussed different applications for this single unique morphology through warm white luminescence, photocatalytic, electrocatalytic, and energy storage, which makes this nanostructure unique. This is an original foremost report which deliberate such a vast domain of application for a single ZnO morphology. Their growth mechanism has been also discussed with the support of reaction mechanism and scanning electron microscopy (SEM) along with structural analysis through XRD, Raman, Photoluminescence, and Positron annihilation spectroscopic techniques. The synthesized hierarchical ZnO able to open the further exploration for more favorable photo and electron induced kinetics with high surface area and active sites for satisfied electrochemical, and photonic performance.

2. Materials and Methods

To synthesize ZnO nanopowder through the conventional co-precipitation technique, the desired quantity of Zinc nitrate (Zn(NO3)2·6H2O, (99.0%, Himedia, Mumbai, India)) of 1 M solution was taken in a beaker. Aqueous solution of NaOH (Merk-AR) of 1 M was added drop wise with constant stirring to the zinc nitrate solution till the required pH of the precipitation was attained. A white product was obtained after filtering and washing the precipitate several times with distilled water followed by acetone. Finally, the product was dried at 80 °C for 24 h in a vacuum oven. The ZnO samples were synthesized at 6 different pH such as 5.5, 7, 9, 10, 11.5, and 13. Furthermore, all samples were dried at 250 °C for 5 h. The mechanism of the reaction is given in Equations (1)–(4), where Equations (1) and (2) were followed for pH ≤ 7, Equation (3) was fallowed for pH of solution in between 7 to 10; however, Equation (4) represent the reaction at pH ≥ 10 of solution.
5Zn2+ + 8OH + 2NO32− + 2H2O → Zn5(OH)8(NO3)2·2H2O↓
Zn 5 ( OH ) 8 ( NO 3 ) 2 · 2 H 2 O   Δ ( heat )   5 ZnO + 2 HNO 3 + 5 H 2 O
Zn 2 + + 2 OH     Zn ( OH ) 2   Δ ( heat )   ZnO + H 2 O
Zn ( OH ) 2 + 2 OH     [ Zn ( OH ) 4 ] 2 + 2 H +   Δ ( heat )   ZnO + 3 H 2 O
The samples dried at 80 °C and 250 °C were subjected to various characterizations like; X-ray diffraction, Raman spectroscopy, field emission-scanning electron microscopy, photoluminescence (PL) spectroscopy, and positron annihilation lifetime spectroscopy. X-ray diffraction (XRD) was performed by using an 18 kW rotating anode (Cu Kα) based Rigaku powder diffractometer. The photoluminescence study was carried out by using pulsed Nd:YAG laser (Spitlight600, Innolas, Germany,) as a light source (355 nm wavelength) with Ocean Optics QE65000 spectrometer (Ocean Optics, Largo, FL, USA). Raman scattering was performed on a micro-Raman setup of Renishaw, Wotton-under-Edge (Gloucestershire, UK) equipped with a grating of 1800 lines/mm and a peltier cooled charge coupled device (CCD) detector. The Ar+ laser (514.5 nm) was adopted as the excitation source. A microscope from Olympus (Model: MX50 A/T, Tokyo, Japan) was attached with the spectrometer, which focuses the laser light onto the sample. The GRAM-32 software (GRAM-32 software, Seoul, Korea) was used for data collection. Positron annihilation lifetime (PAL) measurement was carried out using a fast–fast coincidence system consisting of two 1 in. tapered off BaF2 scintillators coupled with XP 2020Q photomultiplier tubes. The prompt time resolution of the system using a 60 Co source with 22 Na gate was 298 ps. The lifetime spectra were deconvoluted using the code PATFIT 88 [33].
Photocatalytic performances were investigated on UV-VISIBLE spectrophotometer (SHIMADZU, UV-1650, Tokyo, Japan) for photodegradation of methylene blue (MB) dye in neutral medium under the white light irradiation. Electrochemical tests were performed by cyclic voltammetry (CV) on potentiostat–galvanostat (CHI 660E) at 25 °C in 0.5 M KOH. Pt-wire and Ag/AgCl electrodes were regarded as counter and reference electrodes correspondingly. The working electrode for oxygen evolution and hydrogen evolution reaction was prepared by pasting the slurry of ZnO in isopropanol and nafion solution on the glassy carbon (GC) electrode. For energy storage application, electrode is prepared by pasting the slurry on the pretreated Ni foam with diluted hydrochloric acid and absolute ethanol made by active material (ZnO), acetylene black and polyvinylidene difluoride (PVDF) in nafion solvent in the weight ratio 85:10:5. The prepared working electrode was dried in oven at 70 °C prior to use.

3. Results and Discussions

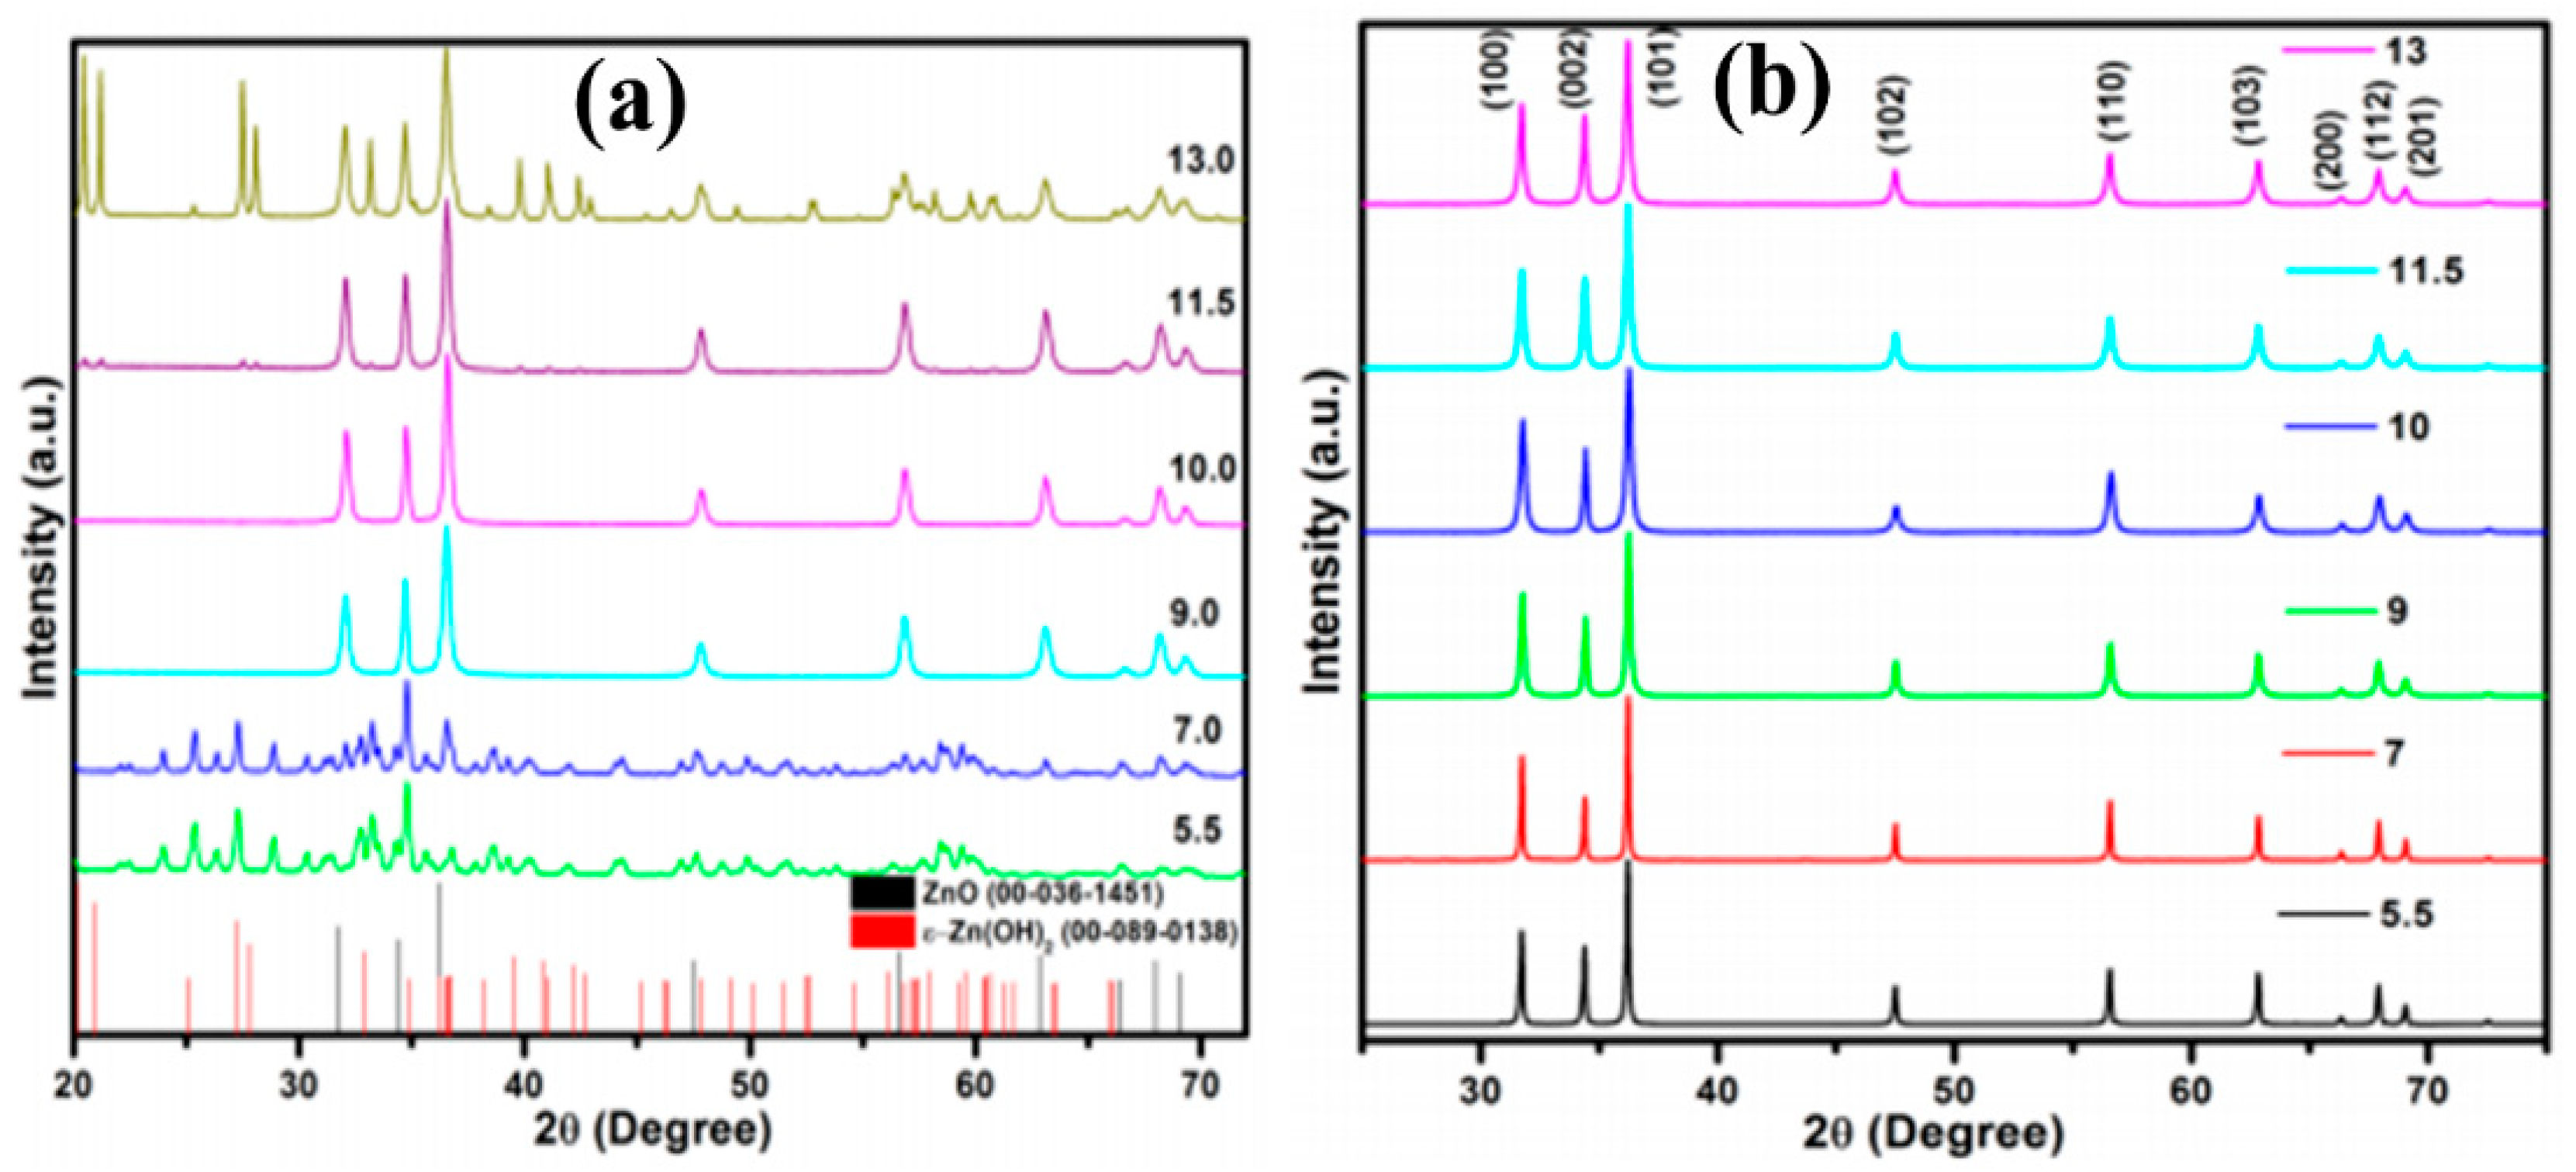
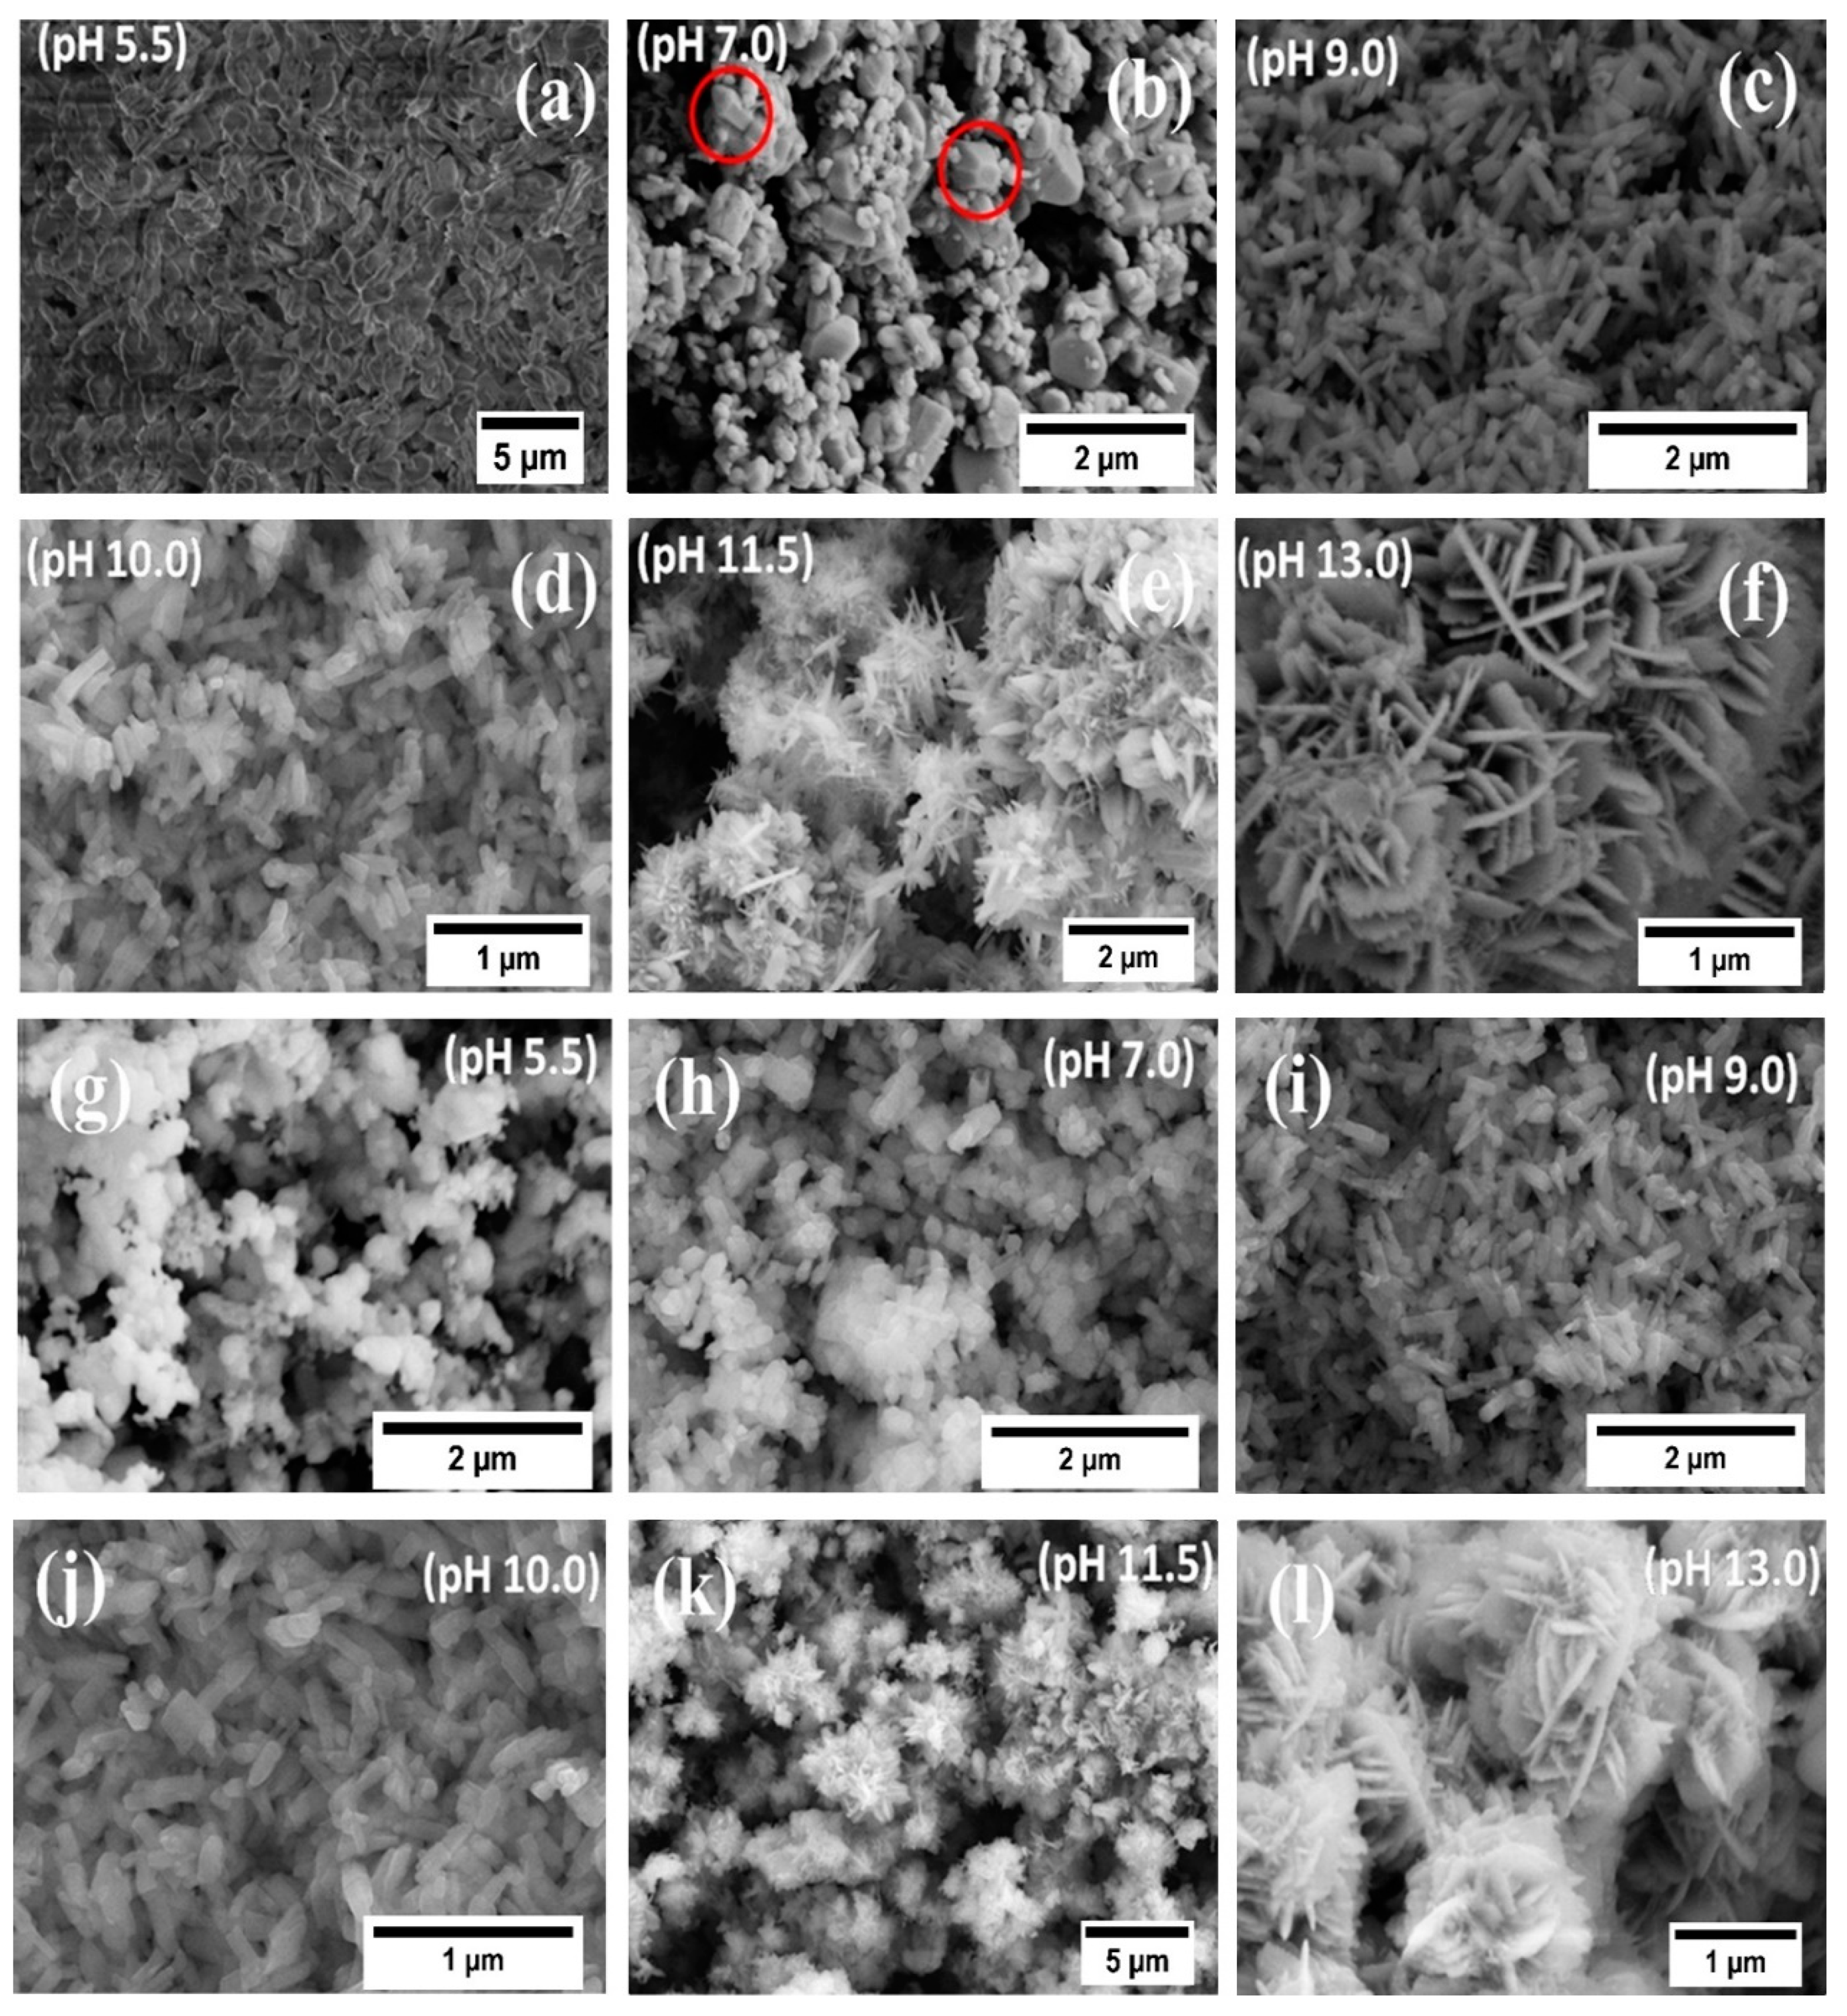
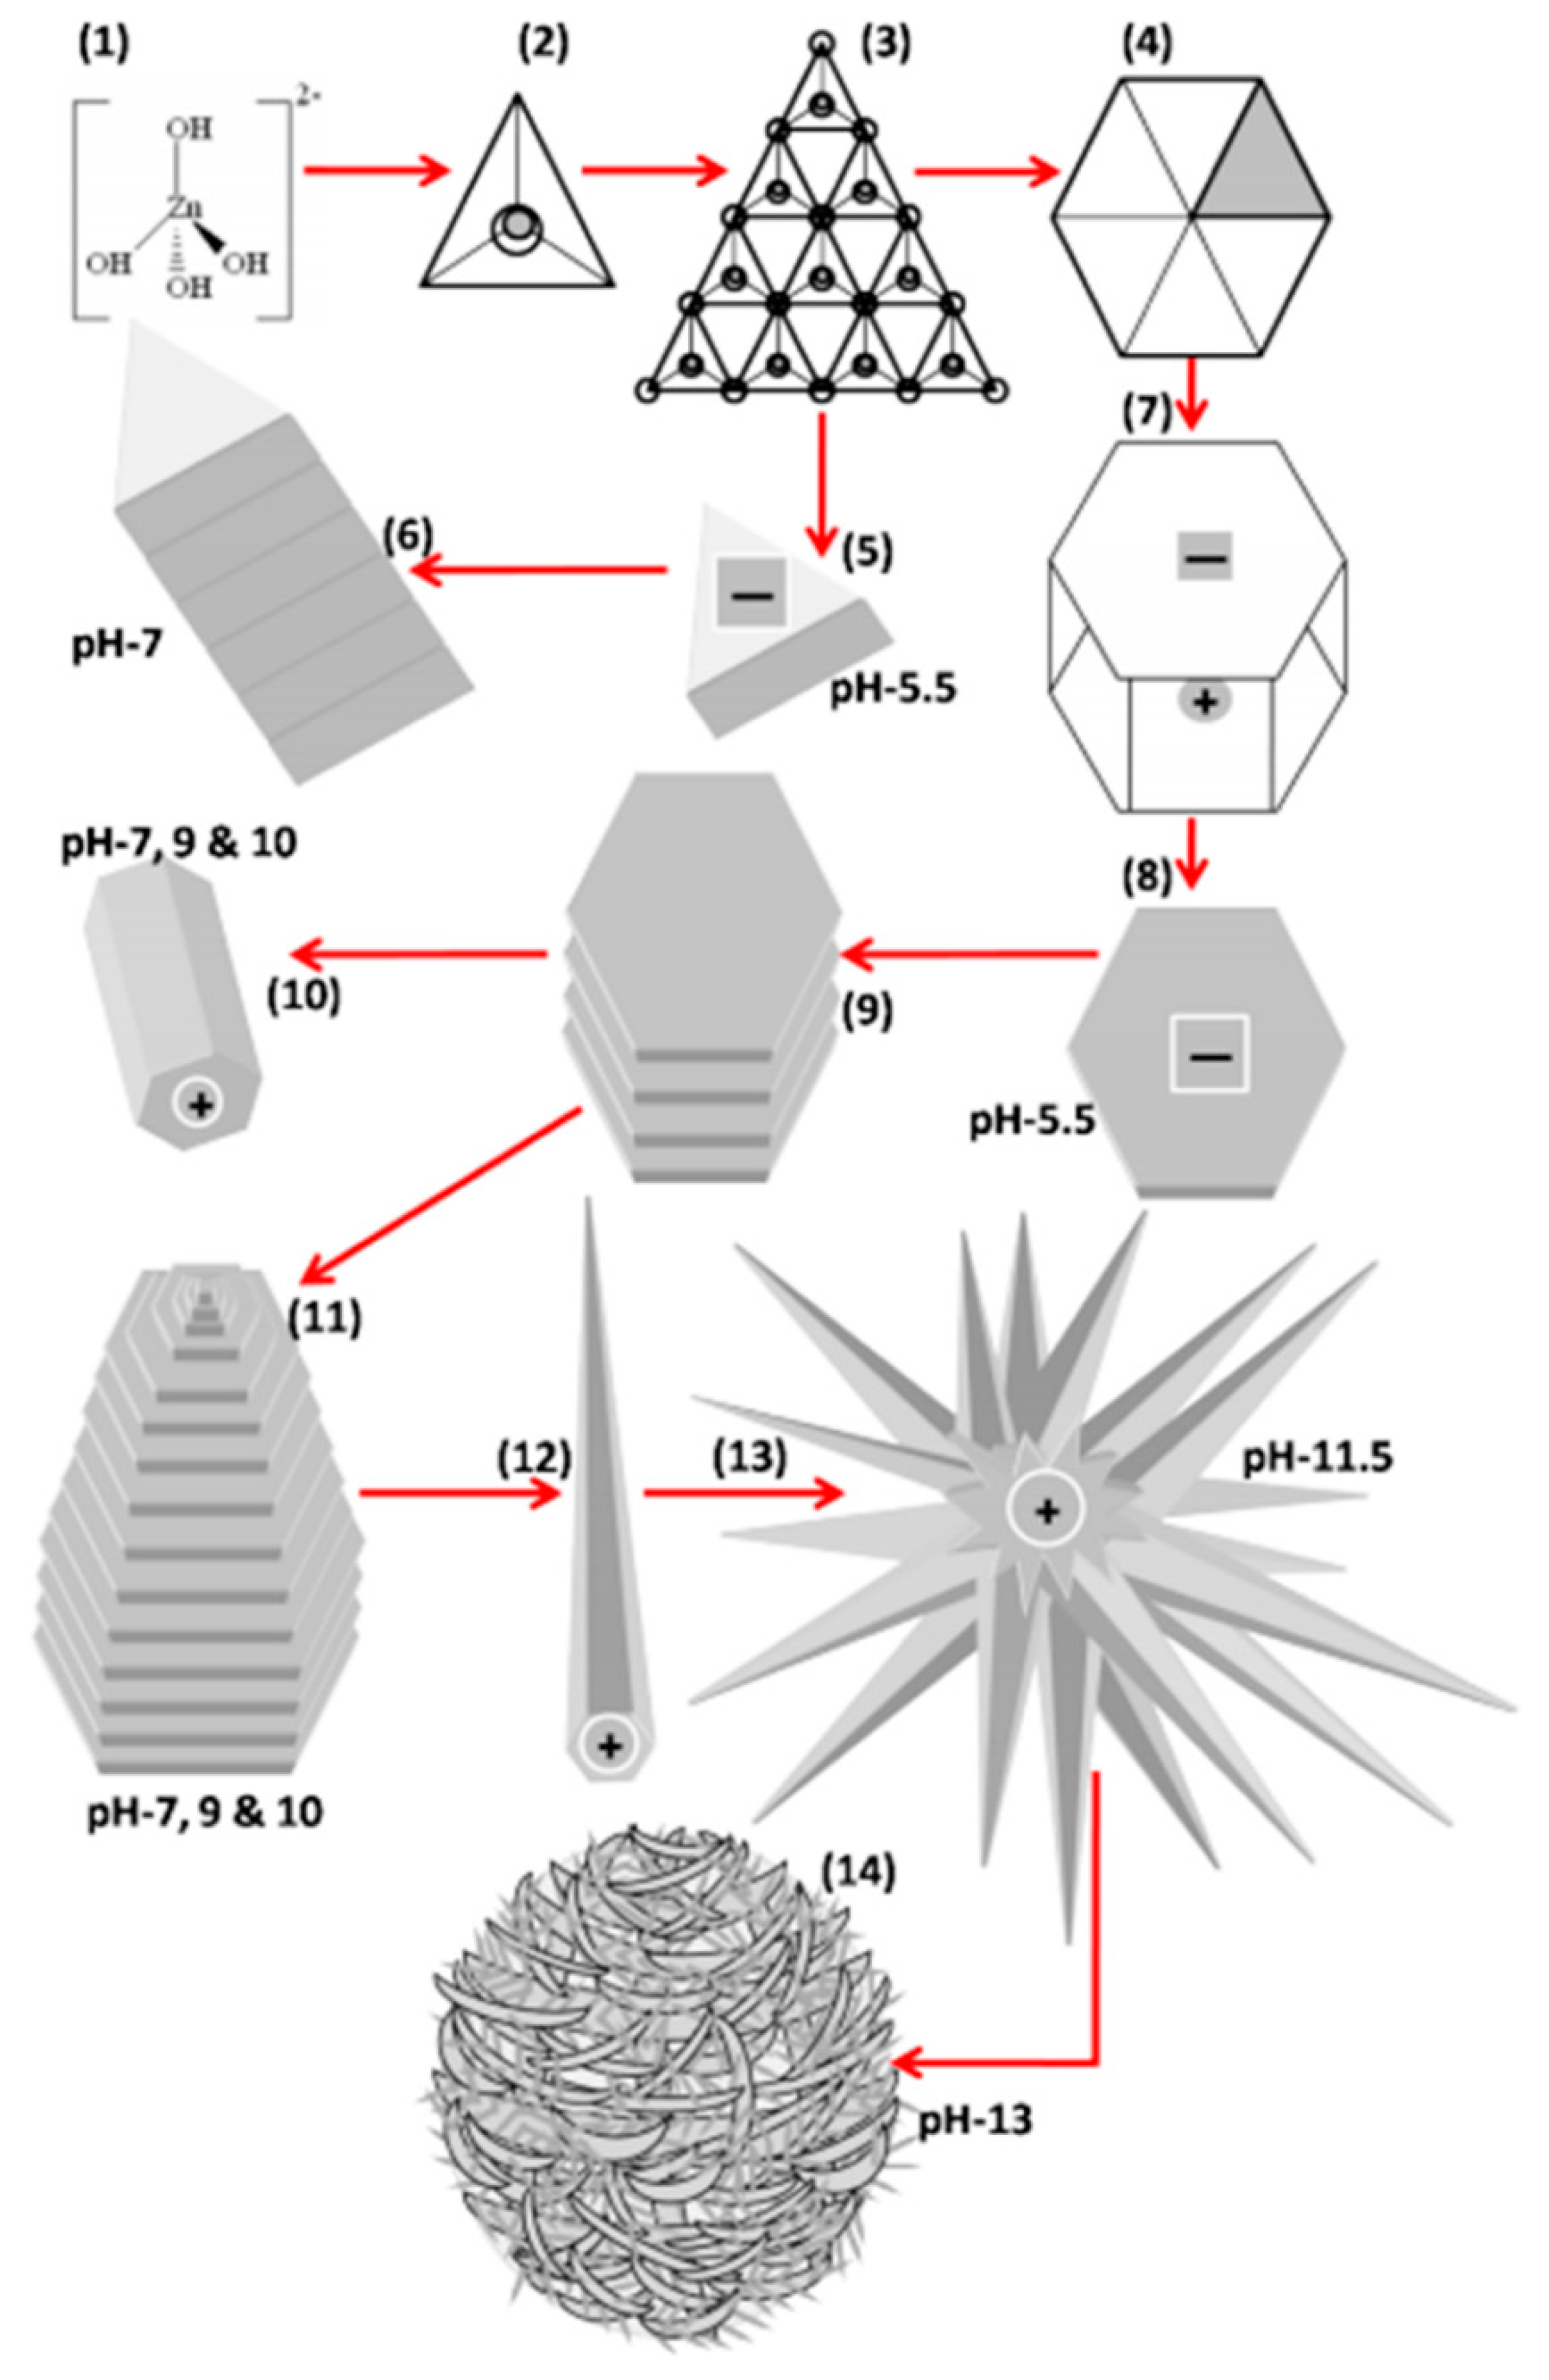
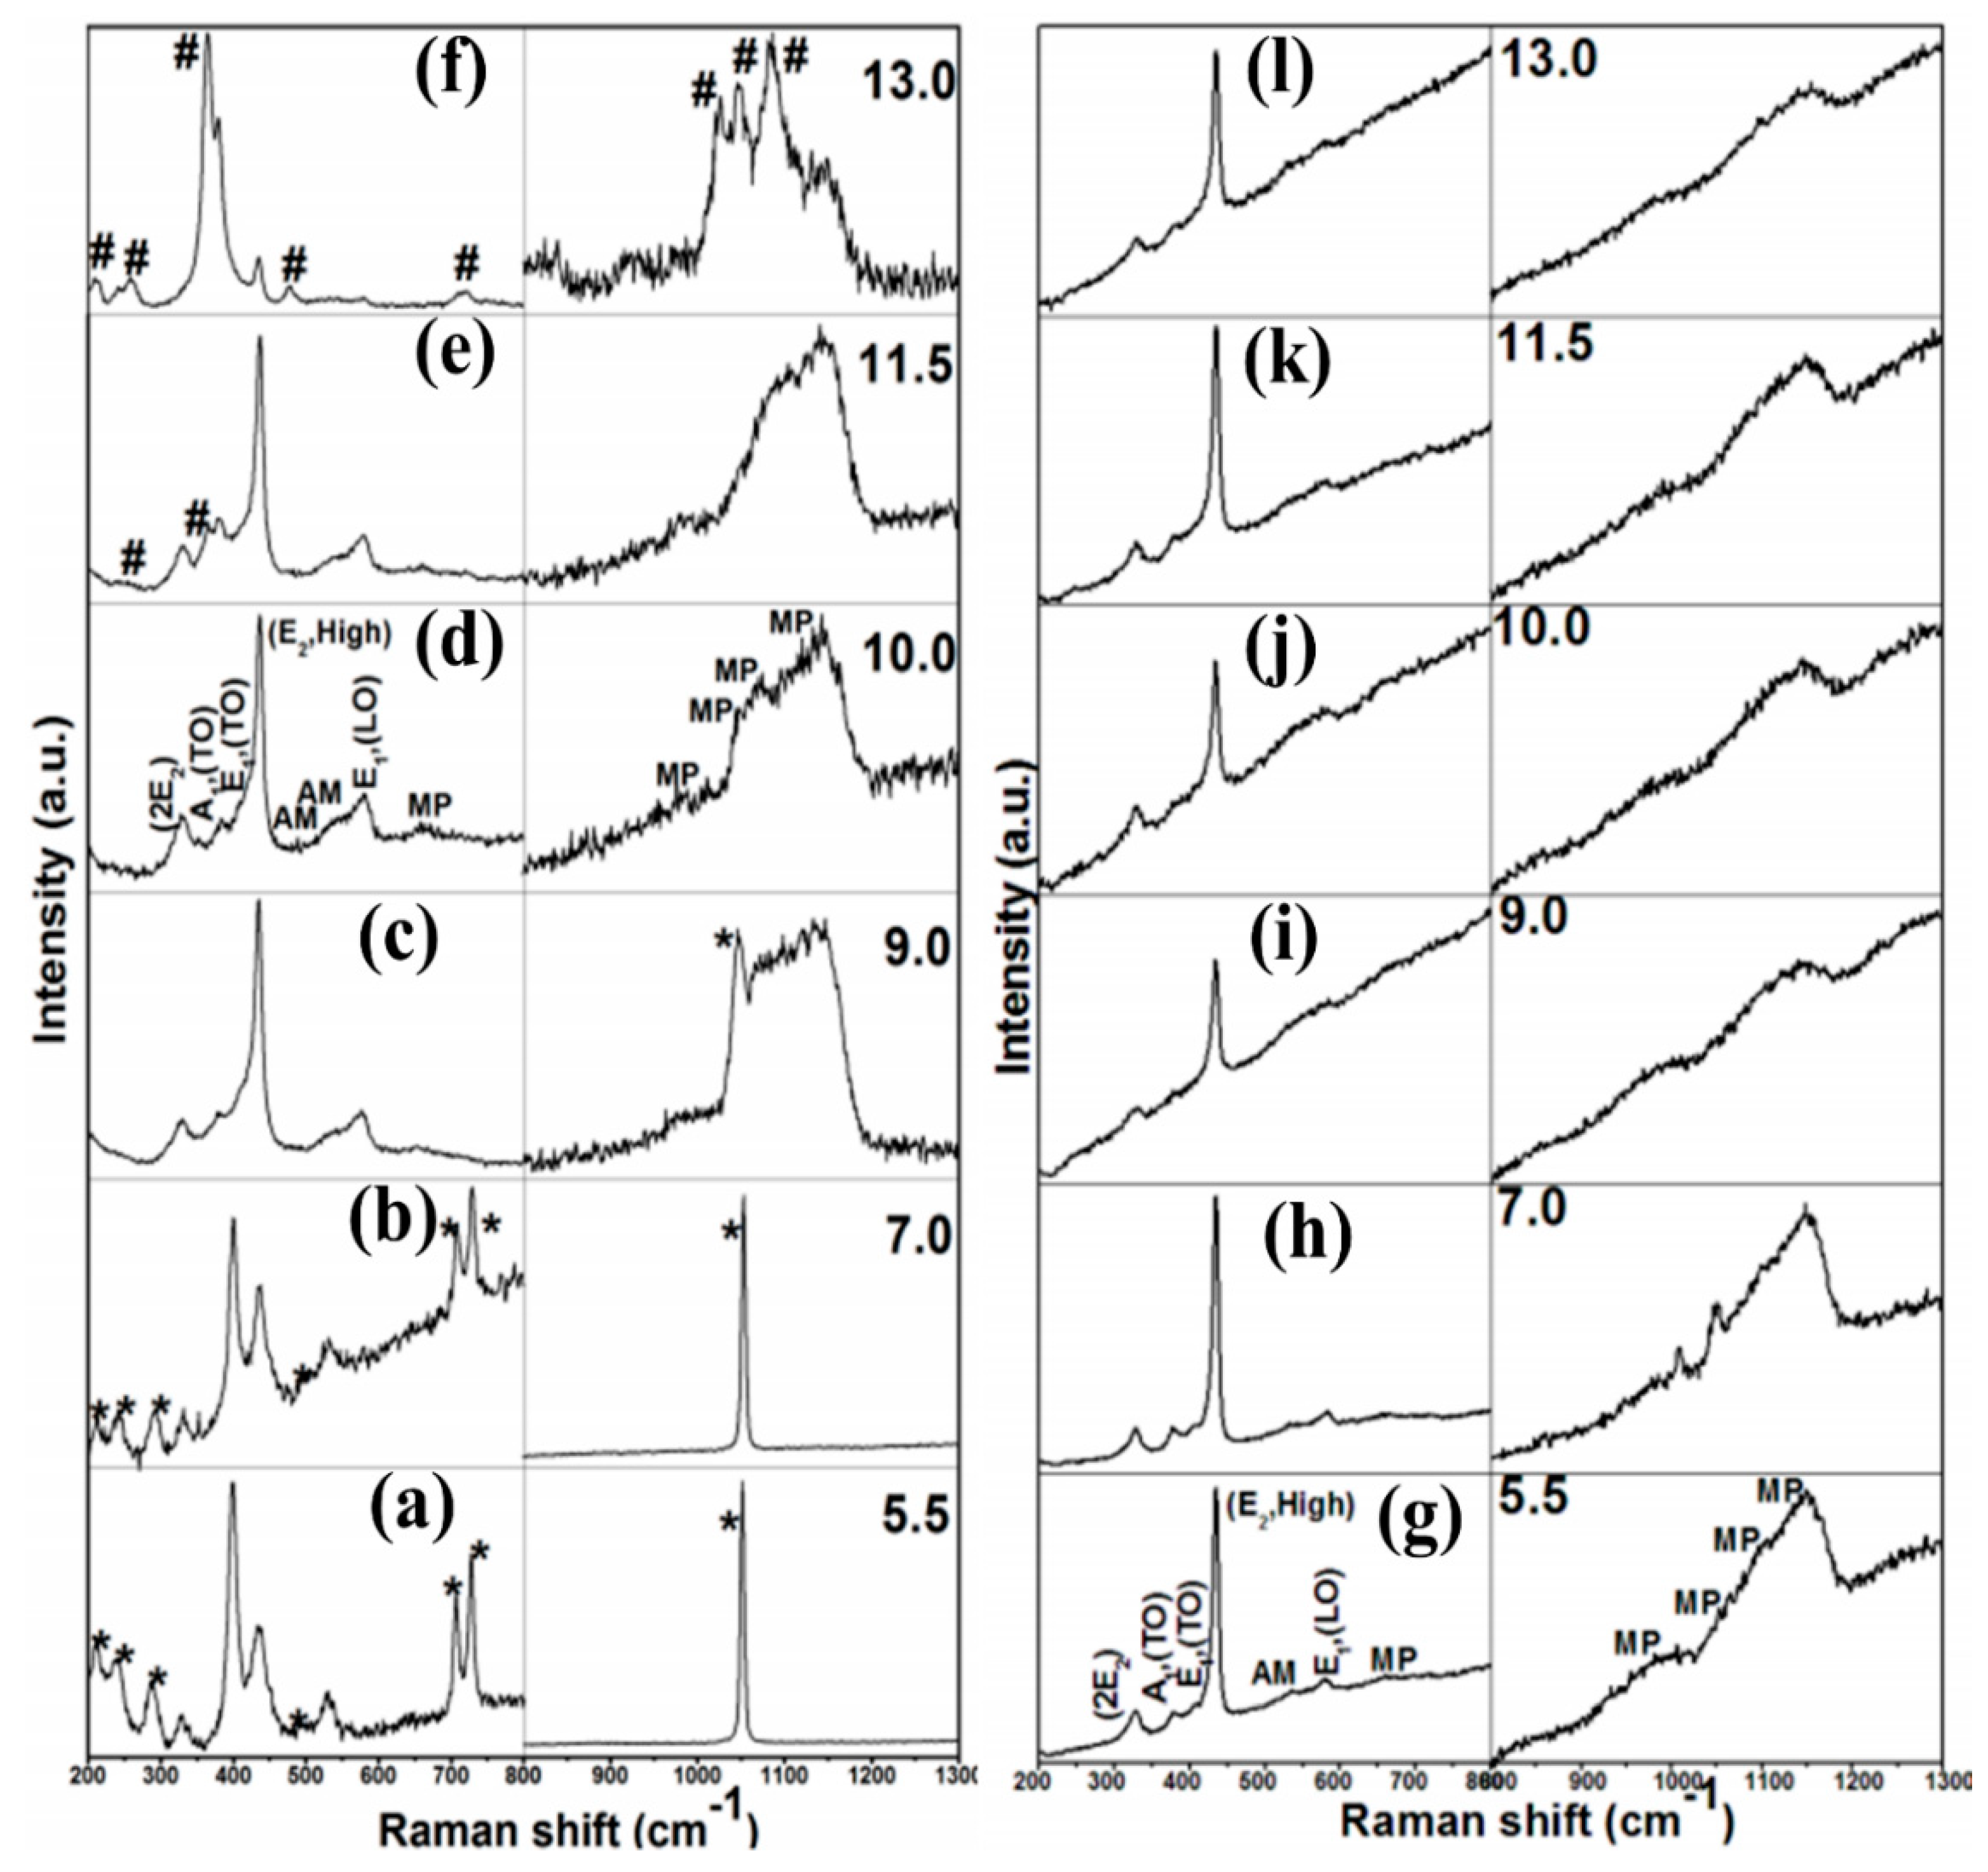
3.1. Structural Assessment

X-ray diffraction (XRD) patterns of the ZnO powder dried at 80 °C for 24 h, are shown in Figure 1a. At lower pH (5.5 and 7.0), in addition to ZnO (JCPDS file no. 36-1451), phase of zinc hydroxide nitrate hydrate (Zn5(OH)8(NO3)2(H2O)2 (JCPDS file no. 72-0627 and 24-1460)) also observed. XRD patterns of the samples synthesized at pH 9.0 and 10.0 show the pure wurtzite phase of ZnO. All observed peaks match well with the diffraction peaks corresponding to (100), (002), (101), (102), (110), and (103) planes of wurtzite structure of ZnO (JCPDS file no. 36-1451). With increasing pH to 11.5 and 13.0, the appearance of intermediate secondary phase of wulfingite ε-Zn(OH)2 (JCPDS file no. 89-0138) was observed along with the ZnO phase. The XRD patterns for samples dried at 250 °C for 5 h, are shown in Figure 1b. No characteristic peaks of any intermediate or secondary phase related to Zn5(OH)8(NO3)2(H2O)2 or ε-Zn(OH)2 could be detected from the diffraction pattern. At 250 °C calcination, the Zn5(OH)8(NO3)2(H2O)2 and Zn(OH)2 completely transforms into crystalline ZnO.
Morphologies of the products characterized through Field Emission Scanning Electron Microscopes (FE-SEM), synthesized at different pH (5.5, 7, 9, 10, 11.5, and 13.0) and dried at 80 °C for 24 h, are shown in Figure 2. We observe two-dimensional micron sized plates at pH 5.5, mixed triangular and hexagonal rods at pH 7, hexagonal rods at pH 9 and 10, needle-like crystals at pH 11.5, and hierarchical structures at pH of 13. It is clear from the micrographs that not only size, the shape of ZnO nanoparticles greatly depends on the pH of precipitation. Sequential growth of 2D plates to triangular, hexagonal rods, needle shaped crystals, and finally flower like morphologies are quite interesting results obtained in case of ZnO, just by increasing pH of precipitate. The hexagonal facts @7 pH are quite visible in Figure 2b. These samples of different pH (5.5, 7, 9, 10, 11.5, and 13.0) are further dried at 250 °C for 5 h and the morphologies observed through FE-SEM are shown in Figure 2. After drying at 250 °C, except for the sample synthesized at 5.5 and 7 pH the morphologies of the other samples synthesized at different pH remain almost same. Drying at 250 °C, morphology of the sample synthesized at pH 5.5 converts from two-dimensional micron sized plates to spherical agglomerated particles. However, the morphology of the sample synthesized at pH 7 is found to accompany with very small rods and spherical agglomerated particles.
Sequences of growth of various morphologies are depicted in Figure 3. At lowest pH 5.5, it has been reported that the (100) plane of Zn5(OH)8(NO3)2(H2O)2 compound consists of a high density of Zn–O atoms which have a pseudohexagonal arrangement on the projection and generally forms like plate from the above layered compound that supports our result [34]. At pH 7, in addition to plate like morphology, the triangular and hexagonal rods were also observed. Increasing the pH from 7 to 11.5, rods and needles were observed. It was shown that, formation of rods, needles, or wires were due to the growth along [0001] direction of ZnO. The mechanism behind the growth of different morphology along [0001] direction observed in our case can be described by stacking of a number of tetrahedrally coordinated O2− and Zn2+ ions either side by side or along the c-axis. It is well known that the neutral and alkaline solution of Zn2+ ion hydrolyzed in the series of species of Zn(OH)n(2−n) (n = 1–4) [35]. The hydrolysis products of Zn(OH)2 and Zn(OH)2–4 have tetrahedral geometry and the same coordination numbers along with Zn–O distance to the ZnO [36]. The growth unit of the ZnO crystal thus has tetrahedral coordination. The tetrahedrally coordinated O2− and Zn2+ ions represented in step-1 as shown in Figure 3 forms the building block or basis for the growth of various morphologies of ZnO. The basis is represented as a tetragonal shape, shown in step-2. The stacking of this basis side by side (perpendicular to c-axis), or alternatively along the c-axis, results into either triangular and/or hexagonal rod. The stacking of this basis side by side in triangular or hexagonal shapes has shown in step 3 and 4, respectively. As the surface is polar in nature, the stacking occurs alternatively along the c-axis in addition to side by side perpendicular to c-axis that results into triangular and hexagonal bar as shown in step 5 and 7, respectively. At neutral pH sample, i.e., 7, stacking the triangular and hexagonal bars alternatively along the c-axis, we thus observe triangular and hexagonal rod shape shown as step 6 and step 8, 9 and 10. Increasing pH to 10, the growth of rods occurs observed about ~70 nm diameter and ~180 nm length throughout the samples. The mechanism for growth of the hexagonal rod involves step 8, 9, and 10, where the rods are formed by stacking the hexagonal bars alternatively along the c-axis consistent with expected layer-by-layer growth mechanisms. SEM image of pH 11.5 samples demonstrate very dense bunches of flowers. A close view indicates that a single flower is composed of large number of needle-like petals arising from the center of the flower. The lengths of needles are 100–300 nm. The tapered needle- or obelisk-like ends of high-aspect-ratio rod are formed by multiple steps of stacking of hexagonal layers with decreasing surface area, as shown in step 11, 12, and 13. A quite different morphology along with [0001] orientation direction for wurtzite ZnO was observed because of easy one-dimensional anisotropic growth. The flower like structure is observed in sample synthesized at pH 13, which is different from that of the sample synthesized at pH 11.5. The magnified view of the sample made at pH 13 indicates that the micro sized flowers exhibit a hierarchical structure. Interestingly, the flower-like 3D structures are assembled by a large number of nanosheets and small needles. The nanosheets intersect with each other, which results in a net-like structure and the needles are grown on these sheets are shown in step 14 of Figure 3. The above results demonstrate that the growth environment has a significant influence on the final morphology of ZnO crystals.
Raman scattering is also used to study crystal structure, structural disorder in lattice and defects in micro-/nanostructures. The Raman spectra of ZnO powder synthesized at different pH (5.5, 7.0, 9.0, 10.0, 11.5, and 13.0) and dried at 80 °C are shown in Figure 4. In the lower range of the Raman spectrum 200–800 cm−1, for samples synthesized at 5.5 and pH 7.0, extra Raman peaks marked as “*” observed in addition to first order Raman modes of ZnO, such as E1(TO), E2(high), second order phonon mode, 2E2, as well as few multi phonon modes (MP). These additional peaks may arise due to intermediate phase of Zn5(OH)8(NO3)2(H2O)2 and the presence of residual nitrate precursor in the sample. One additional mode around 531 cm−1 is also observed in the spectra. The first order Raman modes A1(TO), E1(TO), E2(high), A1(LO), E1(LO) and second order phonon mode, 2E2, are completely matched in samples synthesized at pH 9.0 and pH 10.0. Two additional modes (AM) appear at 515 and 531 cm−1 for samples synthesized at pH 9.0 and 10.0. Increasing the pH from 10 to 11.5, in addition to regular peaks of ZnO, low intensity peaks are also observed. These Raman peaks are represented as “#” and become dominant in sample synthesized at pH 13 (Figure 4). The extra Raman peaks could be due to the secondary phase of wulfingite ε-Zn(OH)2 as detected from XRD [28]. In addition to the first order and second order phonon modes, a few additional modes (AM) appear at 515 and 531 cm−1 in our samples.
In the higher wave number range starting from 800 to 1300 cm−1, sharp Raman peak at 1053 cm−1 in sample synthesized observed for pH 5.5, 7, and pH 9. It has been reported as symmetric stretching (ν1) of NO3 ion [32,33,34]. The peaks at 708 and 728 cm−1 are responsible for in-plane deformation or bending (ν4) of NO3 ion. The unperturbed NO3 has D3h symmetry and gives rise to symmetric stretching (ν1), out-of-plane deformation (ν2), asymmetric stretching (ν3), and in-plane deformation or bending (ν4) modes. The ν3 and ν4 modes are both Raman and IR active whereas the ν1 is Raman active and ν2 is IR active. At higher pH 9 to 11.5, we observe a broad band from 950 to 1200 cm−1 with few sharp features. This broad band is made up with several multi-phonon (MP) Raman modes of ZnO (Figure 4) [37]. In case of pH 13, the broad band is made up of the multi-phonon Raman modes of ZnO as well as due to the secondary phase of wulfingite ε-Zn(OH)2. The Raman spectrum of ZnO powder synthesized at different pH and dried at 250 °C for 5 h are shown in Figure 4. The Raman spectroscopy of all the ZnO samples dried at 80 °C, exhibiting Raman scattering peaks only, without any luminescent background. However, for all the samples dried at 250 °C possessed very strong luminescent backgrounds. The Raman modes of all samples matched well with the ZnO and no characteristic peaks of any intermediate or secondary phase is detected.

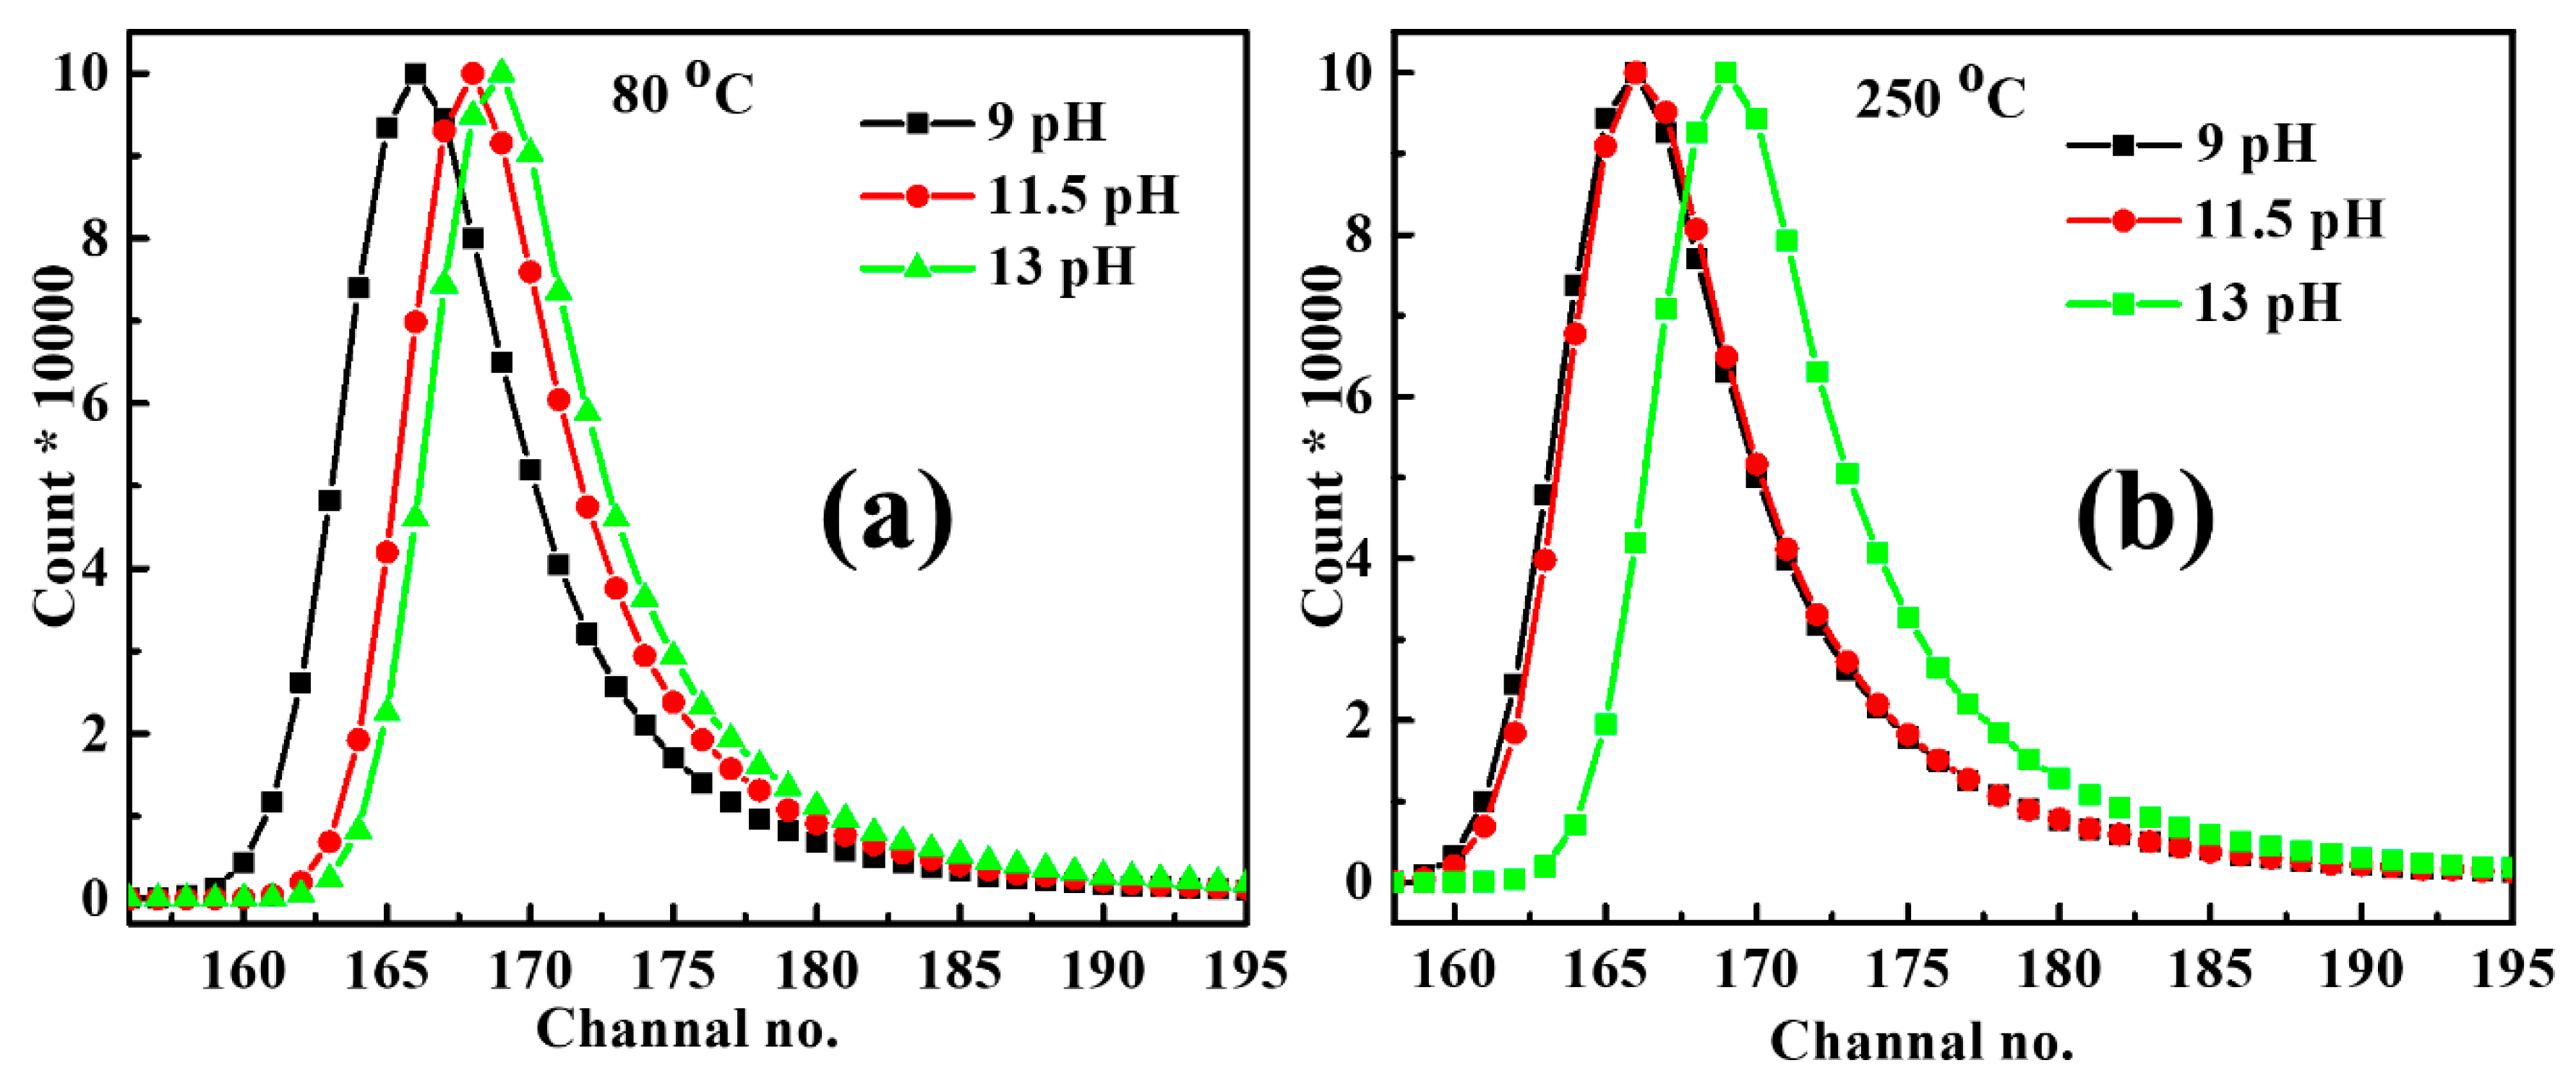
3.2. Positron Annihilation Spectroscopy
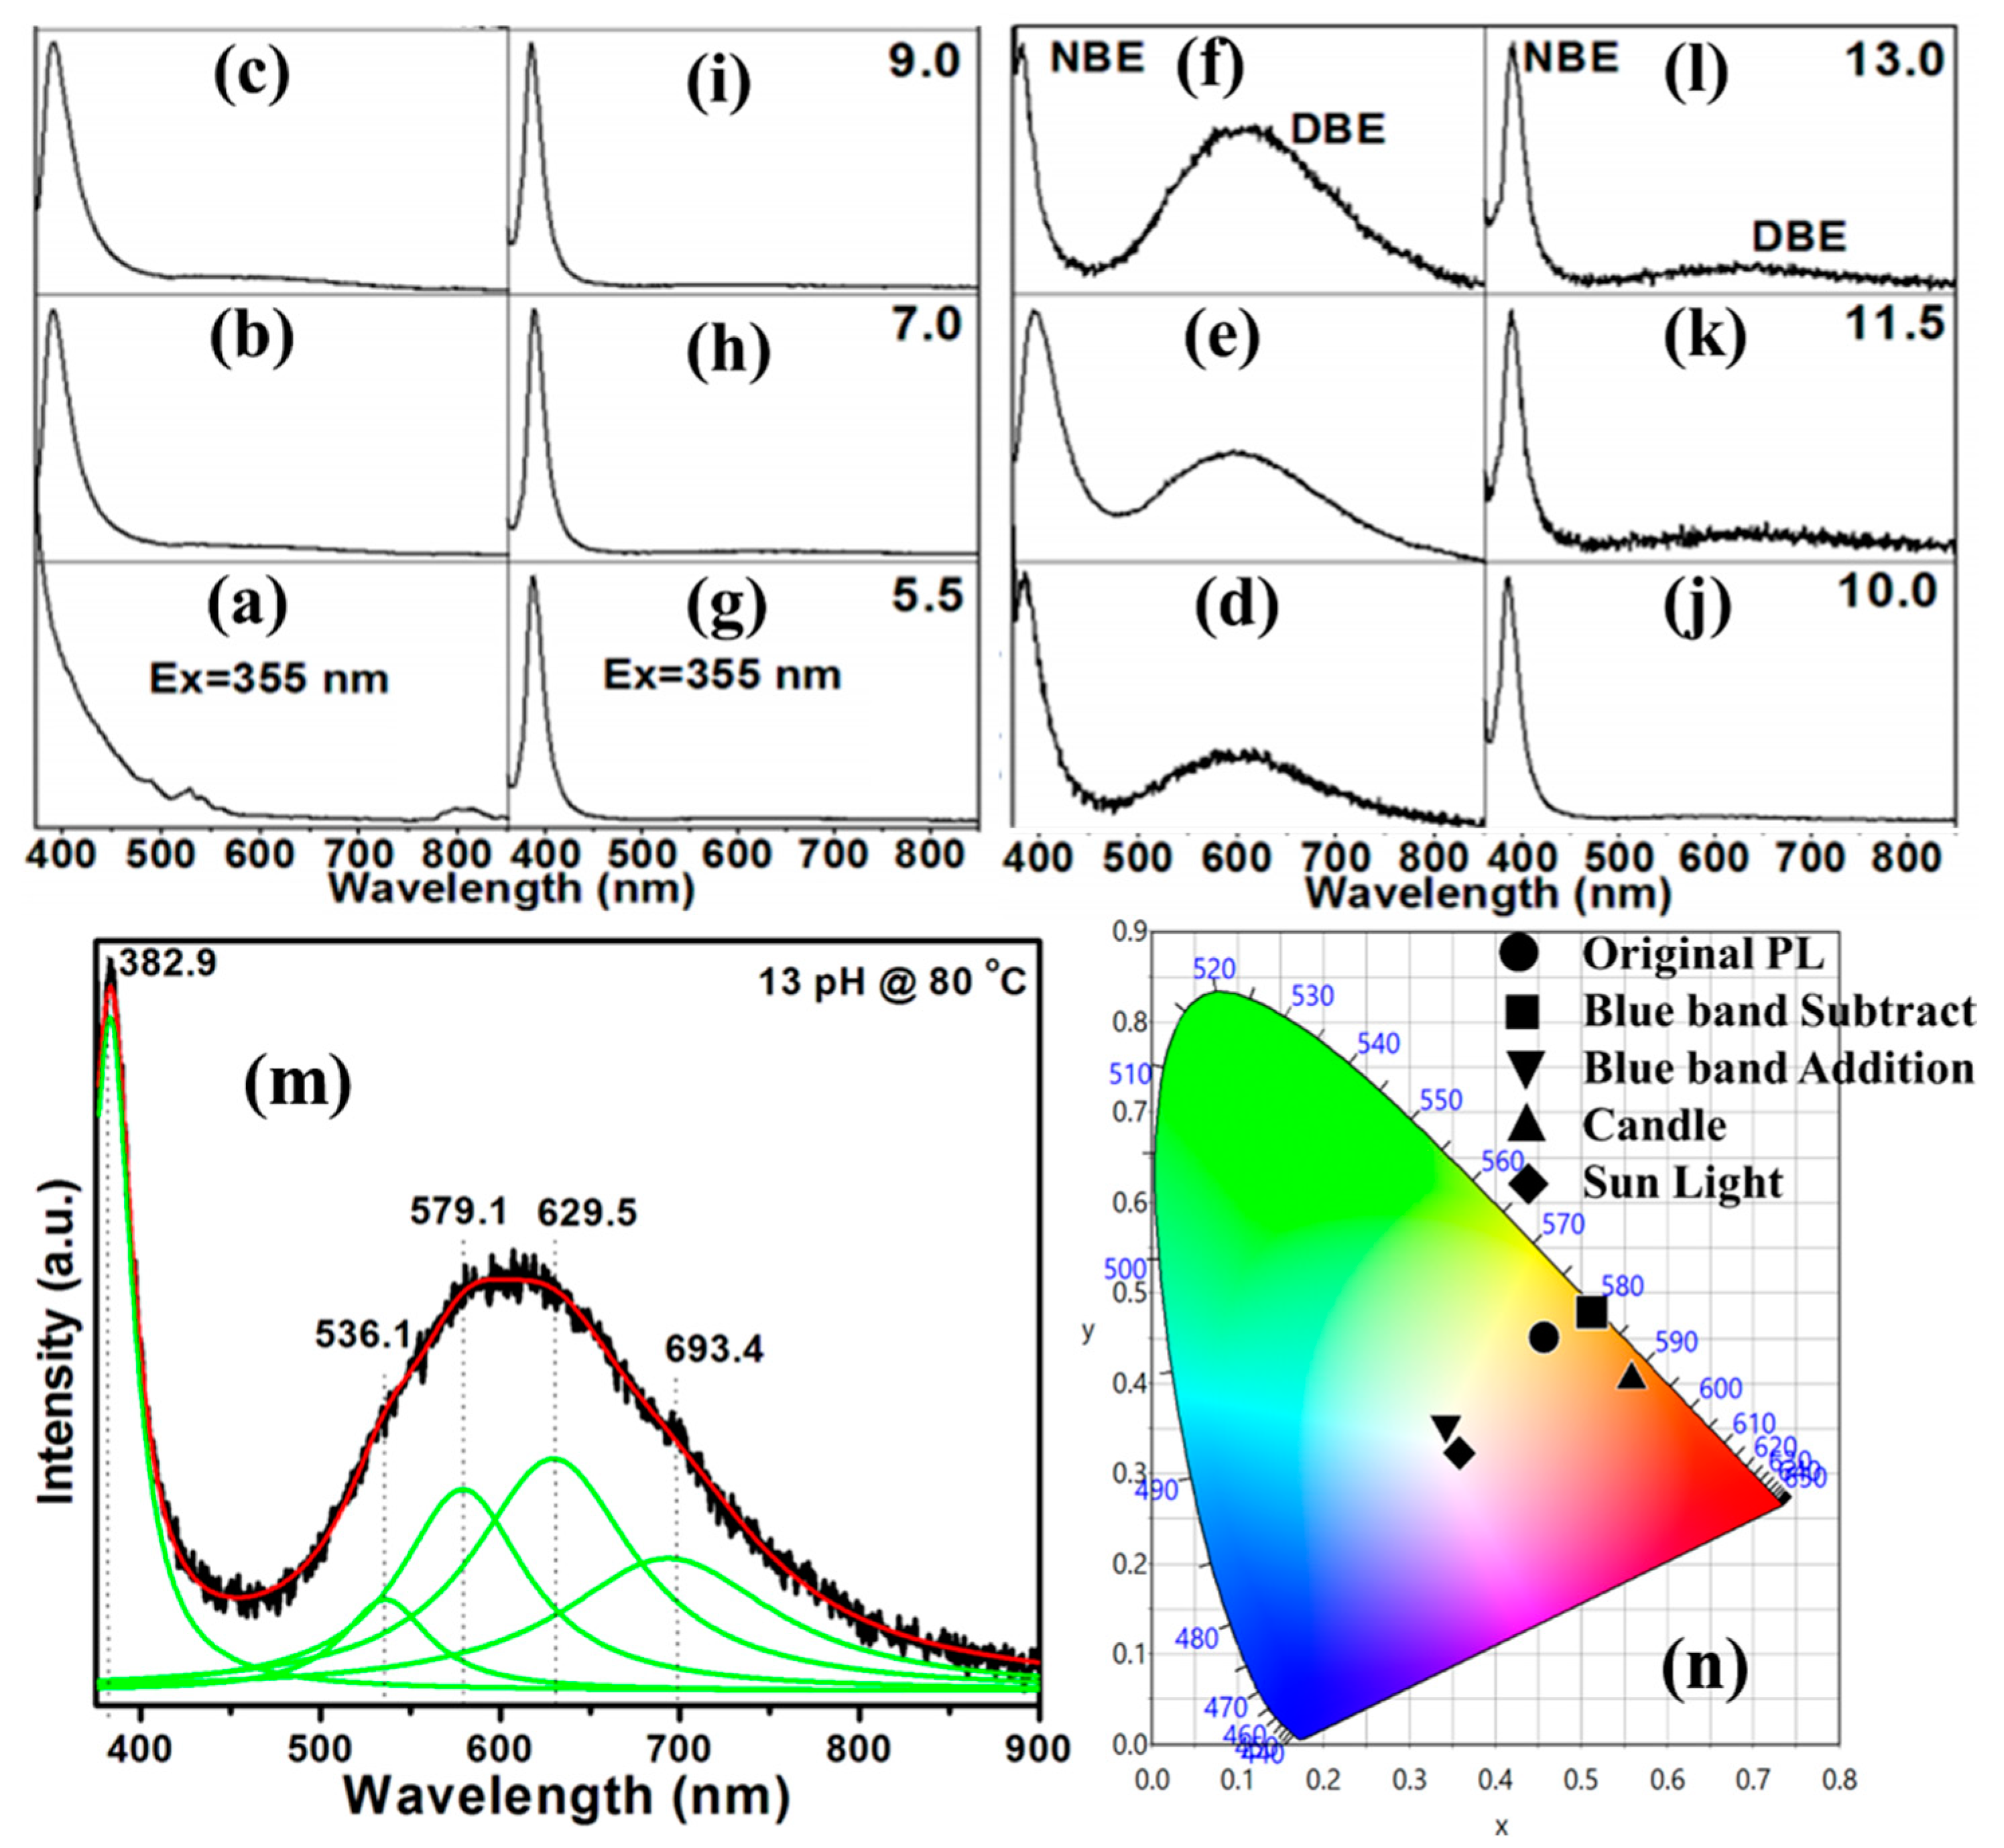
Positron annihilation spectroscopy is further carried out as it is a unique tool to study the cationic defects. The defects in ZnO could be Zn vacancy (VZn), O vacancy (VO), defect clusters, voids, etc. The life time of positrons trapped in defects is comparatively larger than the life time of positrons that annihilated at defect free regions. Figure 5a,b depicts the positron annihilation lifetime spectra (PAL) of ZnO powder synthesized at different pH and dried at 80 °C and 250 °C, respectively. The spectra shown in Figure 5a,b is best fitted with three lifetime components such as τ1, τ2, and τ3. The fitted parameters are shown in Table 1.
The shortest lifetime component, τ1 with the intensity I1 corresponds to positron annihilation at structural defects in the grain boundaries. It may be noted that in a bulk material, τ1 represents free annihilation of positrons in the defect-free region. However, in nanomaterials with size ~50 nm, positrons diffuse through the grains and get trapped at the grain boundaries that are strong trapping centers for the positrons [38]. The intermediate lifetime, τ2 with intensity I2, represents positron annihilation at nanovoids at the intersection of three or more grain boundaries (e.g., triple junctions). The longest lifetime component, τ3 with intensity about 2%, has been attributed to the pick-off annihilation of orthopositronium formed in the intercrystalline region characterized by large volumes [39]. In ZnO, oxygen vacancy (VO) is invisible in positron annihilation spectroscopy (PAS) measurement as the positron binding energy of VO (0.04 eV) is much less than that of VZn (0.39 eV). Thus, one may observe only positron annihilation due to Zn vacancies which is a common phenomenon in metal oxides. The τ1, in the present case is found to be about 166, 168, and 198 ps for samples synthesized at pH 9, 11.5, and 13 and dried at 80 °C, respectively, which are higher than the positron life time in bulk (158 ps) [40] and are found to increase gradually with increasing pH. In comparison with τ1, the value of τ2 (317, 340, and 507 ps, respectively) also increases with pH and becomes higher in comparison to the normal cases. As the impurity of Zn(OH)2 is found to present in 80 °C dried samples, these positron annihilation life times cannot be due to the presence of defects alone. The higher annihilation lifetime in 80 °C dried samples is must be due to the combined effects of native defects as well as formation of Zn(OH)2 phase that increases with increase in pH. In 250 °C dried samples synthesized at pH 9, 11.5, and 13, τ1 is found to be 183, 197, and 185 ps, respectively. Such higher positron annihilation lifetime (180–200 ps) for pure ZnO in comparison with bulk (158 ps) is surprising. In general, with heat treatment positron annihilation lifetime τ1 is found to decrease but in the present case for pH 9 and 11.5 samples, the annihilation lifetime τ1 has increased. The annihilation life time τ1 for 250 °C dried samples lie in between the annihilation lifetime reported for bulk and zinc vacancy (VZn). It has been calculated theoretically that if hydrogen is attached to VZn, the positron life time decreases successively. For example, while one hydrogen attached to VZn yields a positron life time of ~200 ps, two hydrogen attached to VZn reduces the life time to 176–182 ps [41]. Thus, τ1 in our case matches well with the life time of VZn attached to a hydrogen. In the present case, the source of this hydrogen could be water (H2O) or hydroxyl (OH) ion. During precipitation, the hydrogen atoms are attached to zinc vacancy sites (VZn) and form the hydrogen complexes such as VZn–H. In the form of hydrogen defect complexes such as VZn–H, hydrogen is more tightly bonded than the hydroxyl groups and is retained up to the temperature 800 °C in ZnO. Desorption of hydrogen starts above the heat treatment at approximately 420 °C [42]. In addition to the demolition of hydroxyl group for 250 °C dried samples, formation of hydrogen related defect complexes like VZn–H are found responsible for the passivation of native defects, resulting into the suppression of defect band emission (DBE) observed in PL. The intermediate lifetime (τ2) for pH 9, 11.5, and 13 samples dried at 250 °C are found to be 400, 424, and 393 ps, respectively. This positron annihilation lifetime (τ2) could be due to multiples of Zn + O divacancies [43].

3.3. Luminescence

All photoluminescence spectra obtained at room temperature for ZnO, synthesized at different pHs and dried at 80 and 250 °C, are shown in Figure 6 on excitation wavelength of 355 nm. Figure 6a for pH 5.5 shows the two different luminescence bands in UV and visible region with sharp and broad characteristics. The sharp band in UV region belongs to near band edge (NBE) emission and the broad visible region band emerges due to defect related deep band emission (DBE) from the recombination of free excitons and interband defects related emission, respectively. After drying at 250 °C, the NBE band becomes narrower and intense along with suppression of DBE emissive band completely as shown in Figure 6g which is mainly happened because of removal of surface vacancies and defects after the agglomeration of nanoparticles. Further, the same observation has been made for all pH samples. Along with it, the improved crystal quality of ZnO with the increase in post heat treatment temperature is also responsible for the enhancement of NBE emission at the coast of DBE suppression and also supported with Raman as well as XRD studies. Intensity of DBE visible luminescence band is observed to be increased with increasing pH value and became significantly intense for at pH 11.5 and 13 for both type of heat-treated samples. The visible DBE broad band is mainly arisen with increase in amorphous surface with a large number of vacancies and complexes responsible for blue, green, yellow, and orange emissions and makes a broad emission envelope from 460 to 900 nm. Thus, the whole spectrum is deconvoluted with Lorentzian fitting and a typical fitting for pH 13 sample is shown in Figure 6m. Four bands centered at 536.1/2.31, 579.1/2.14, 629.5/1.97, and 693.4/1.79 nm/eV are observed and assigned as band I, II, III, and IV. The origin of DBE accompanied with the band I, II, and III is corelated to Zn vacancies (VZn), O interstitials (Oi), and O vacancies (VO), respectively. However, the appearance of a broad smooth envelope and band IV indicate towards the large number of interband states in the form of different individual and complexes like VZn–VO, which might be possible because the opposite polarity of both constituent defects. Some ionized state of oxygen vacancy might also be responsible for longer wavelength luminescence such as band IV. Furthermore, this pH 13 @80 °C luminescence is analyzed by adding and subtracting the blue visible band and shown in Figure 6n through Commission Internationale de l’Éclairage (CIE) coordinate system. The original signal shows the CIE coordinates (0.4563, 0.4505) with 3046 K CCT. After subtracting the blue band completely, the coordinates shifted to (0.5125, 0.4785) with lower correlated color temperature (CCT) value (2541) close to candle-like spectra ~(0.5585, 0.4060) and 1726 CCT. It should be noticed that even in original PL spectra of pH 13 @80 °C, the blue band is comparatively week with the other visible bands. Therefore, after adding the equivalent intensity blue band with the original spectra, its coordinates shifted to (0.3583, 0.3226) with 4298 CCT close to standard white light spectra with (0.3333, 0.3333) and 5000 CCT with much warmer property, required for outdoor lighting. However, further effort is needed for real time application for this type of hierarchical structures. As compared to the previous report [24,25], the present results are quite encouraging to achieve the warm white light.

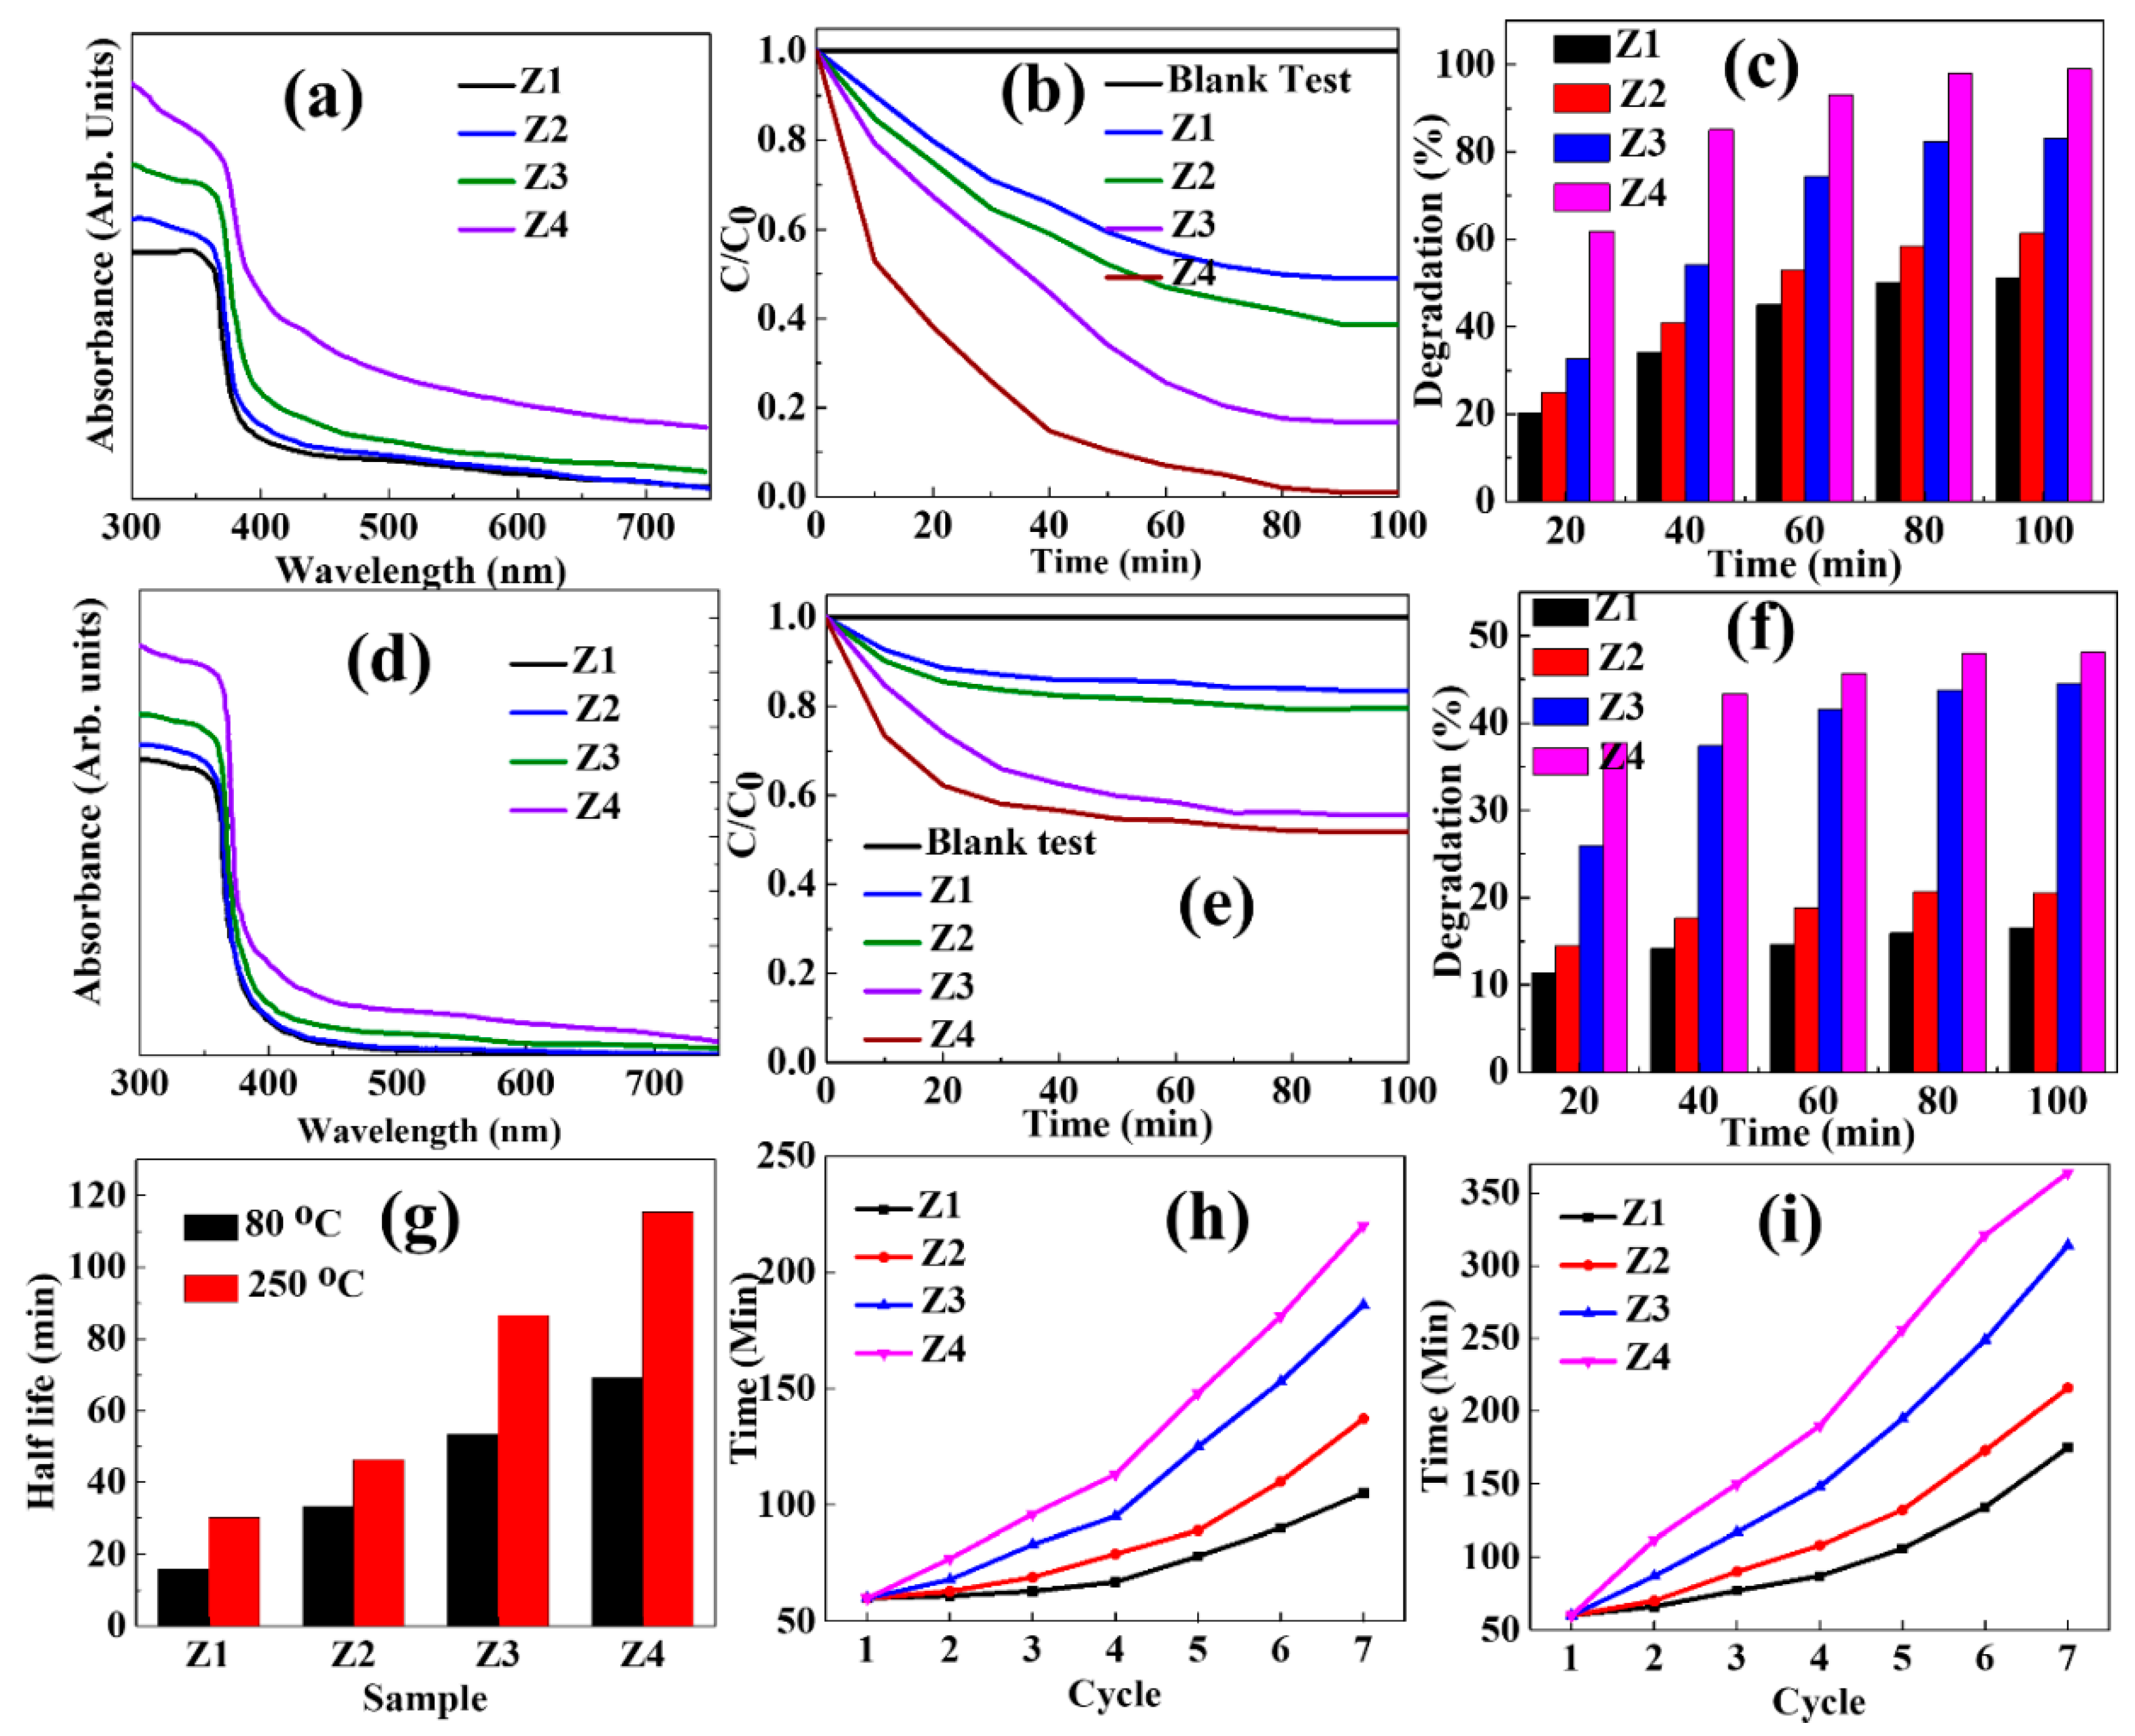
3.4. White Light Photocatalytic Activity
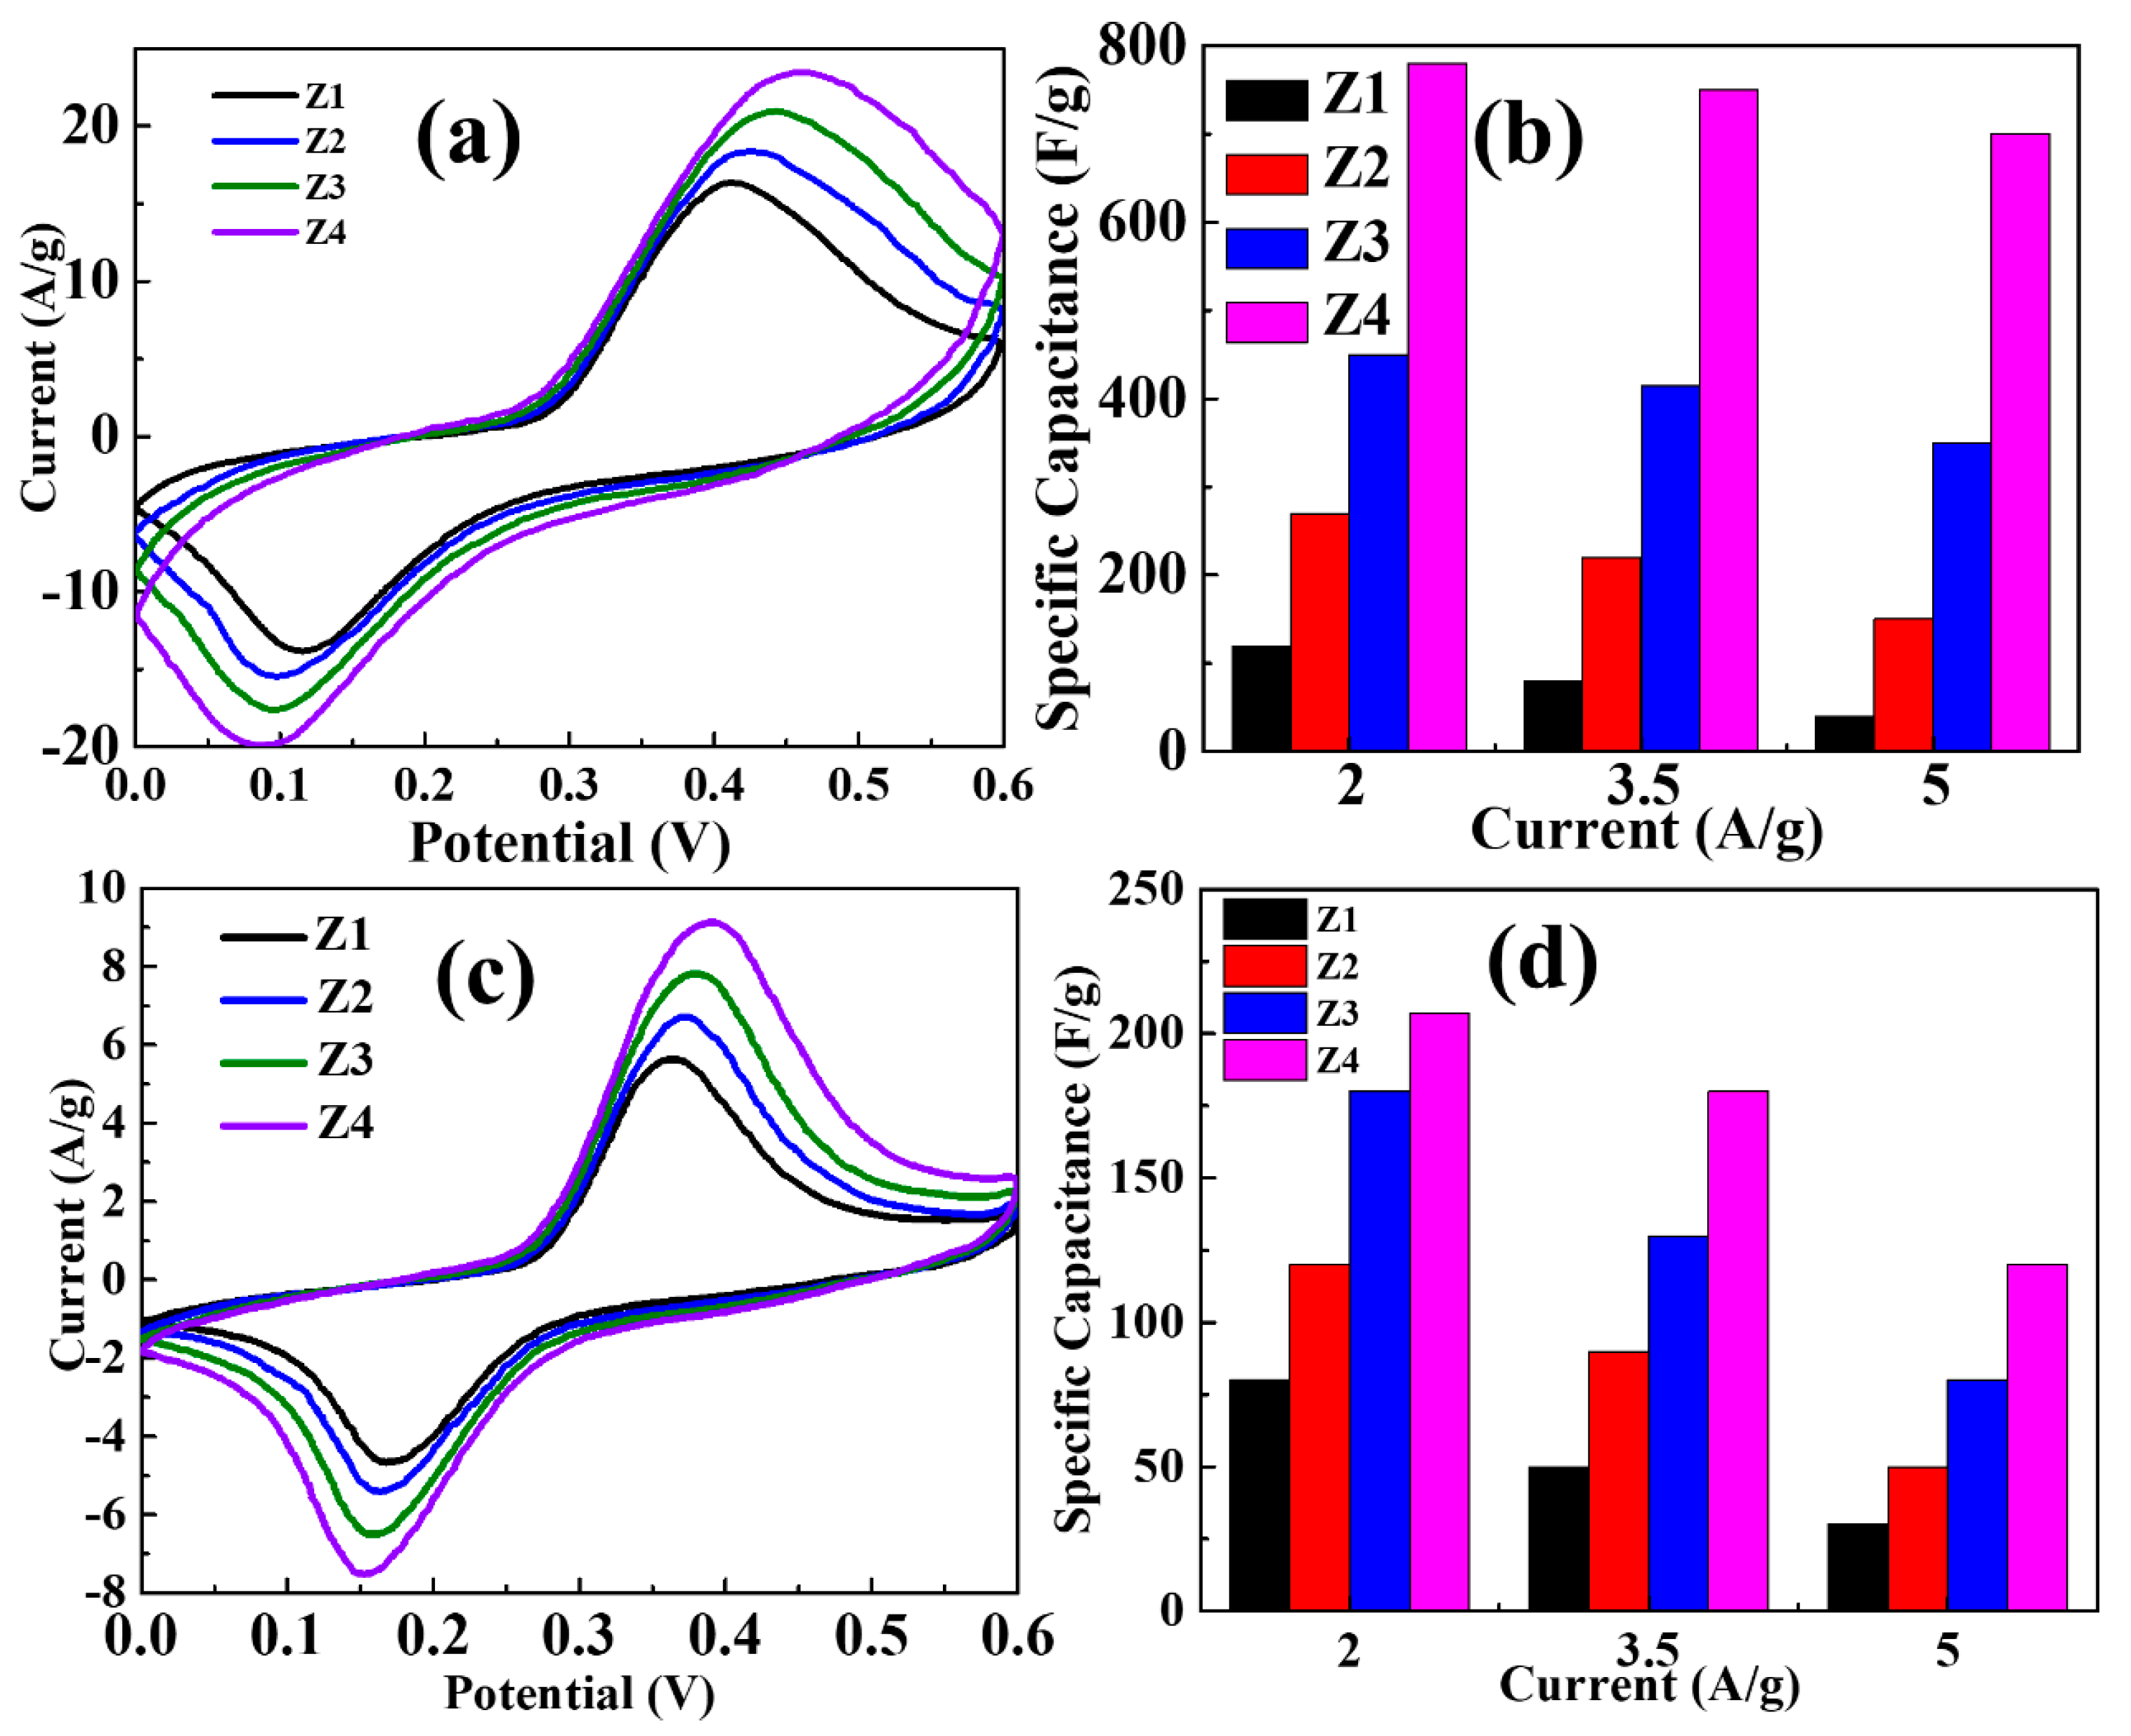
Photocatalytic properties of synthesized ZnO samples were investigated using the UV-visible absorption spectroscopy for the degradation Rh–B dye solution in presence of white light at neutral medium. Basically, the absorption intensity of dye reduces consistently with time in the presence catalytic agent under the light irradiation which generally explained by the formation of hydroxyl and super-oxide free radicals from electron-hole pairs followed by the attack on the dye molecule to oxidize in inorganic minerals, which is monitored by UV-Vis spectra. It should be noticed here that only four pH (7, 9, 11.5, and 13) based ZnO samples are considered for study along with both post heat treatment. Sample for pH 7, 9, 11.5, and 13 represented as Z1, Z2, Z3, and Z4, respectively. The absorbance spectra for synthesized ZnO are shown in Figure 7a,d for both 80 and 250 °C annealing temperature, respectively, in the range of 300–750 nm.
Both figures show the increment in visible light absorption with the increment in pH during the reaction because of the evolvement of interband gap states represented from different defects and vacancies as discussed with PL and PAS data. However, the ratio of UV to Visible absorption found to be lower for lower temperature (80 °C) heat treatment, which reflects the higher level of interband gap states. After the higher temperature heat treatment, the decrement in the visible absorption has been observed along the increment in the UV region. In other way, the UV to visible band absorption ration has been increased as expected which is in in agreement with the XRD and PAS data, which shows the better crystallinity of ZnO nanoparticles and higher defects states, respectively. Higher temperature treatment removes the oxygen vacancies specially from the amorphous surface and contributes to the reduction of visible light absorption and increment in UV region. This heat treatment at 250 °C process also expected to increase the grain size as visible in SEM images also through the agglomeration.
Figure 7b,e shows the (Ct/C0) versus time of the Rh–B degradation for all four consider pH and both heat-treated type of samples. Obviously, the degradation rate was found to increase with an increase in pH used for synthesis for ZnO because of increments in the absorption of visible light as shown in Figure 7a,d. The sample for pH 13 @80 °C degraded Rh–B almost completely after 100 min; however, the rest of the samples took much longer time for the same. Percent degradation of Rh–B with time is plotted in Figure 7c,f, which shows the 98% degradation for hierarchical ZnO nanostructures @80 °C samples. Therefore, hierarchical ZnO at lower heat-treated samples outperforms over the rest of samples, which might a better result in compare to previously reported results with ZnO. The stability and reusability of synthesized photocatalysts are important features, which are presented in Figure 7g–i, respectively, through calculated of half-life and cyclic degradation process. Obviously, the half-life for samples annealed at 80 °C were found reduced with fast catalytic process, as observed in Figure 7b. The same samples were outperformed in comparison to their counterparts annealed at 250 °C. However, the required time to complete the next cycle was observed to be increase for both type of samples in compare to the previous cycle. This cyclic performance was decreased for the sample synthesized at lower pH value, which might be due to reduced porosity. The degradation of photocatalytic cyclic performance found might be due to the remaining amount of dye into the pores, which reduced the actual absorption of the samples even after the proper washing protocol. Both half-life and cyclic results revealed good applicability of the synthesized ZnO samples. The present study shows quite significant improvement in the effectiveness of white light induced photocatalytic activity of undoped ZnO nanoparticles as compare to previously reported results [28].

3.5. Energy Storage

Energy storage application is tested by electrochemical performance through cyclic voltammetry (CV) measurement for all samples with Ni-foam as a current collector. Same nomenclature has been used for samples as used in electrocatalytic measurement. Figure 8a,c shows the cyclic voltammogram for 80 and 250 °C temperature heat treated samples, respectively. Symmetric redox peaks with almost equal peak current may represents the Faradic reduction–oxidation process for 50 mV/s scan rate because of intercalation and deintercalation of potassium ions into ZnO. Significant capacitive current has been observed which is found to be increase with the increase in the synthesis pH value for ZnO for both set of samples, which also reflects the pseudocapacitive action on the electrodes. The change in the shape of CV curve is also observed with the pH value which might be due to the change in surface morphology as observed in SEM images. The change in shape along with increment in current would actually ensure the facilitated path for electrons and ions to diffuse into the electrode. A significant increment in capacitive current and curve area is also observed by lowering the post heat treatment temperature which specifically belong to the increase in porous nature of ZnO samples. These changes are found highly prominent for hierarchical structures for acquiring the highest level of porous nature, which also able to ensure the lowest level of contact resistance between electrode and electrolyte. The separation between redox peak observed to be increase along with the peak broadening by the increase in pH and decrease in post heart treatment temperature which might be the symbol of stable and fully reversible redox process to maintain Nernstian equilibrium. Specific capacitance was calculated using the formula Csp = ∫IdV/2*mvΔV, where Csp is the specific capacitance, ∫IdV is the integrated area of the CV curve, m is the mass of the active material, v is the scan rate, and ΔV is the potential window.
The calculated specific capacitance of two set of four type of samples are shown in Figure 8b,d, which also shows the variation of specific capacitance with current. Obviously, the specific capacitance has been observed to be increased with the increase of pH value used for synthesis of ZnO and deceased in post heat treatment temperature as expected with result of increased area of cyclic voltammogram in Figure 8a,c. Increased active surface area and porosity of samples are mainly responsible for this increment in specific capacitance which utilizes the electrode material fully for charge storage and endorses the fast ion diffusion as well as stable cyclic process. The hierarchical architecture ZnO @pH 13 and 80 °C display a superior specific capacitance among all samples of 780 F g−1 at j = 2 A g−1, which is an improved specific capacitance performance in compare to the earlier reported value [29,30,31,32]. This specific capacitance found nominally reduced with increasing current because of stable redox process. However, the decrement in Csp with current found more sensitive for other samples because of lesser active surface area and porosity. Therefore, the highly porous hierarchical ZnO found effective in compare to other synthesized surface morphology and need to explore more to make them competitive for energy storage.

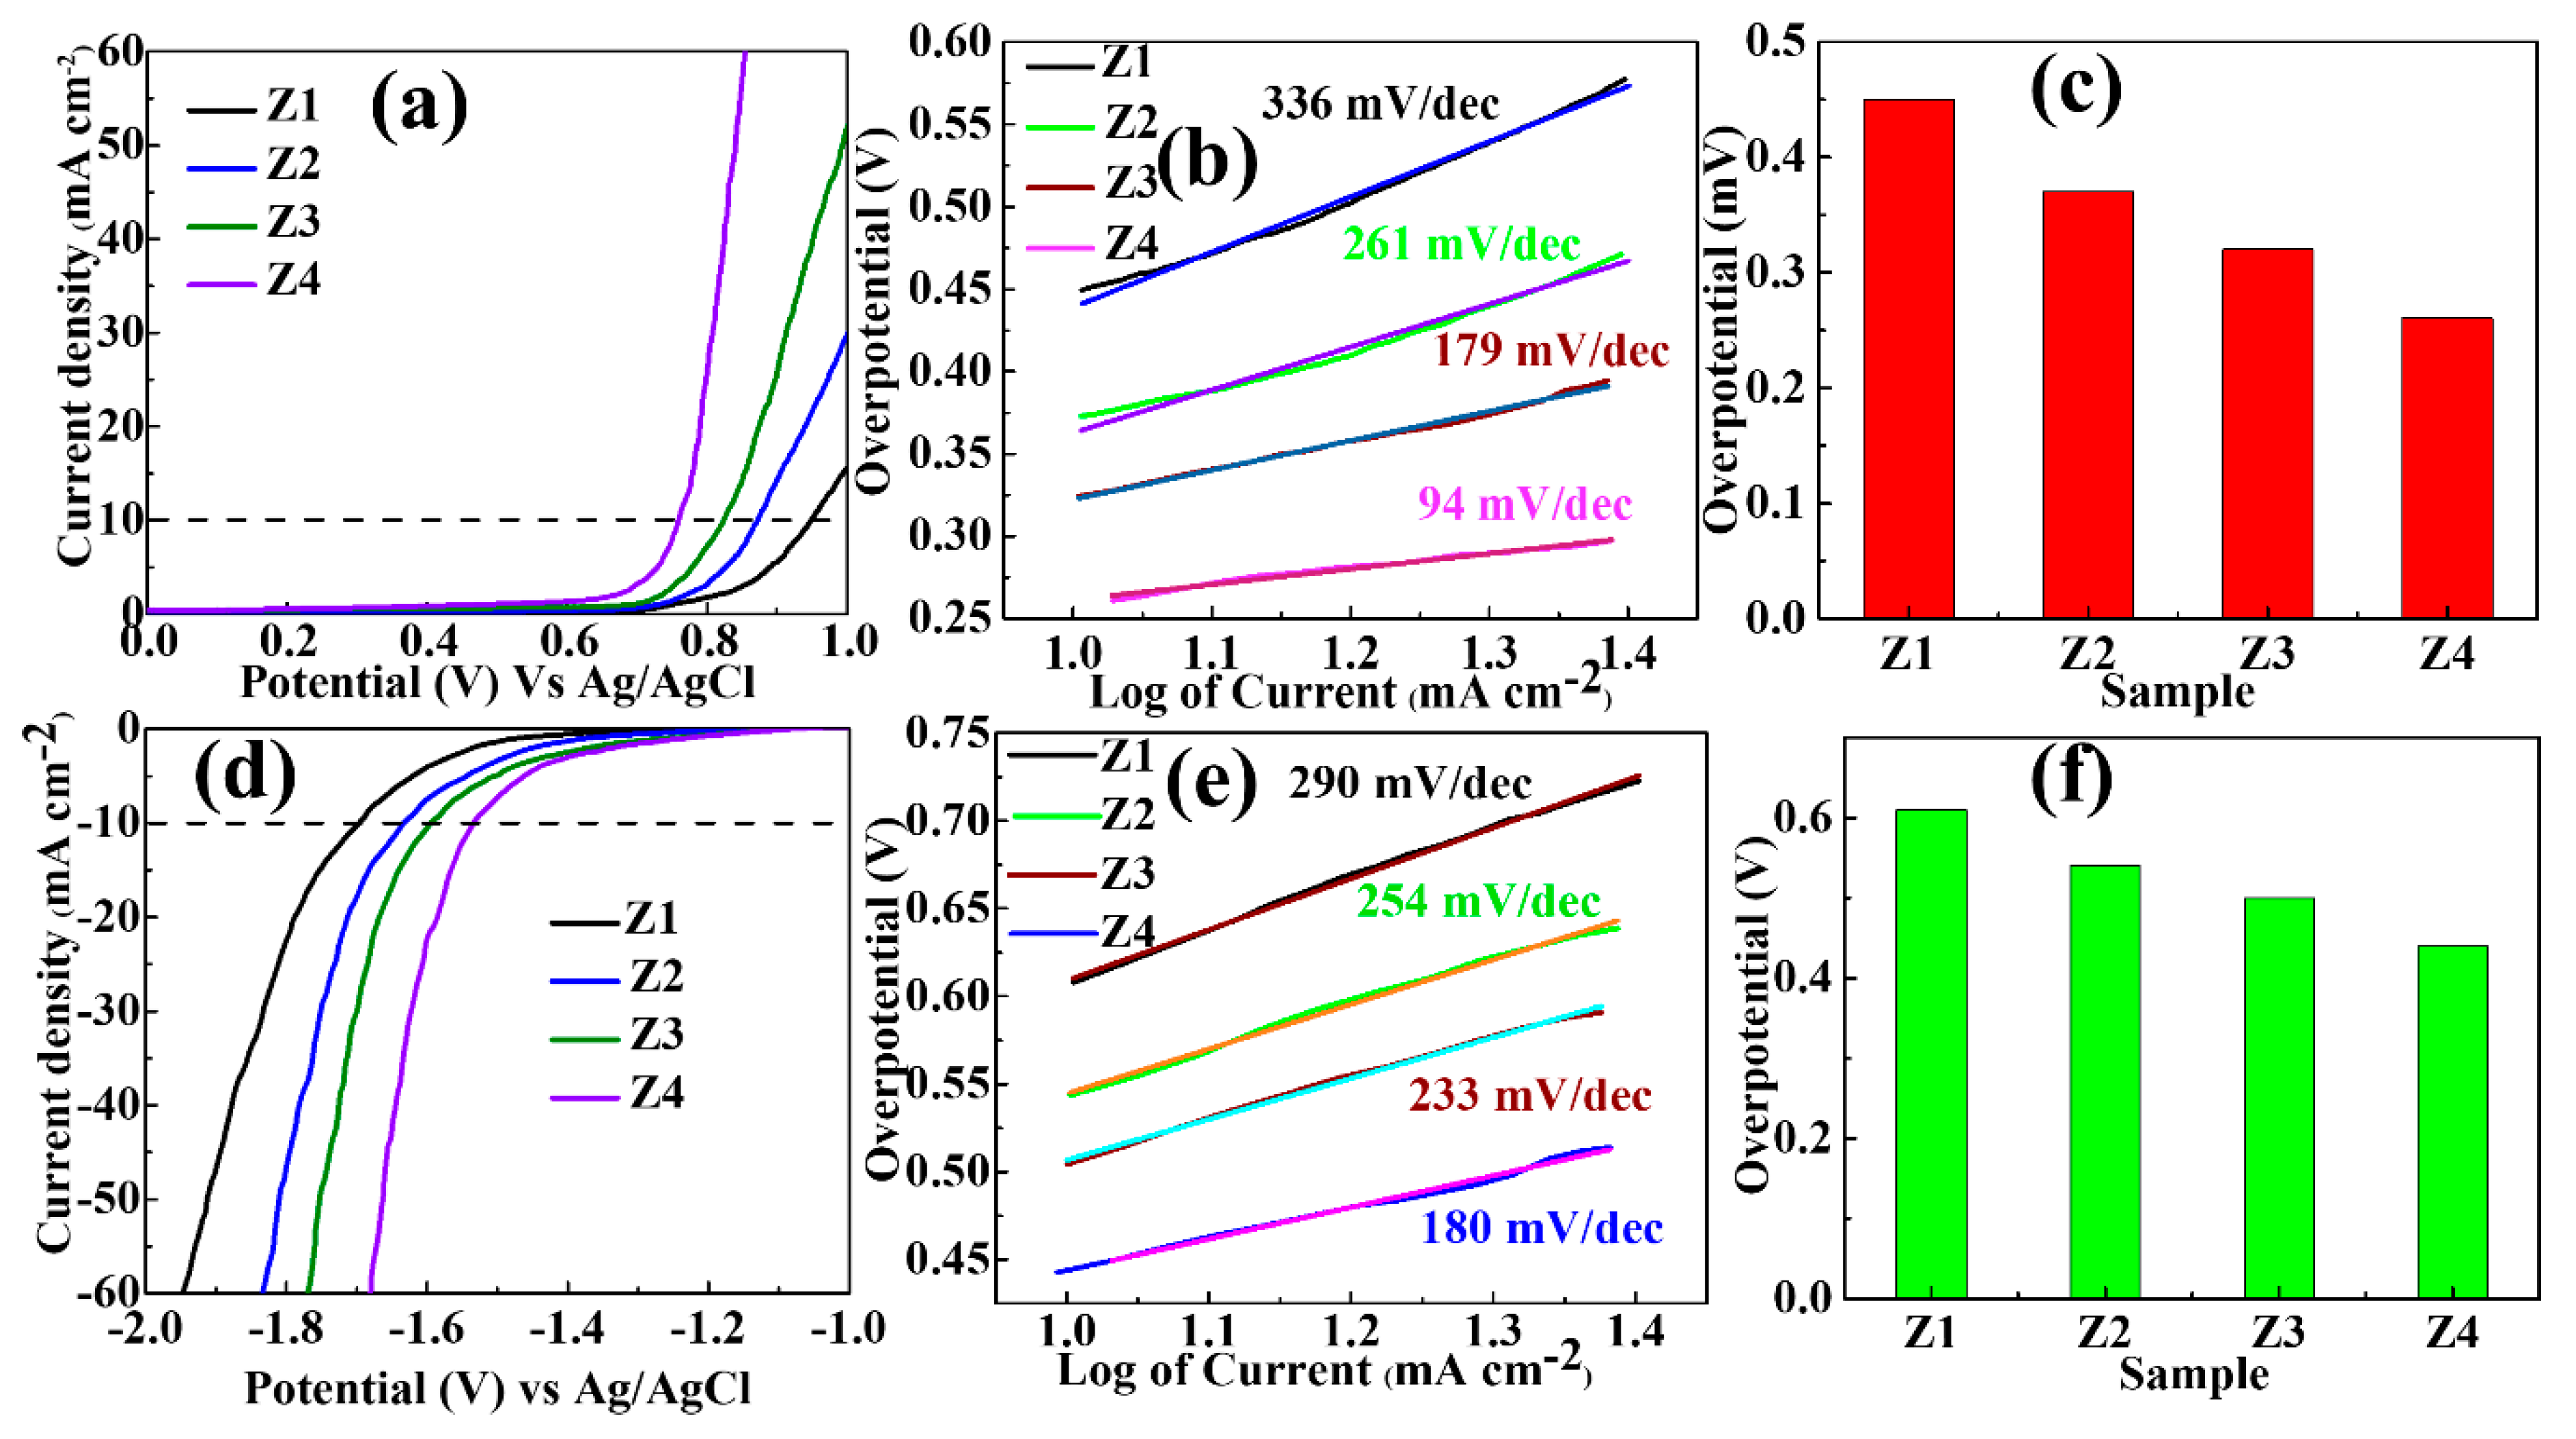
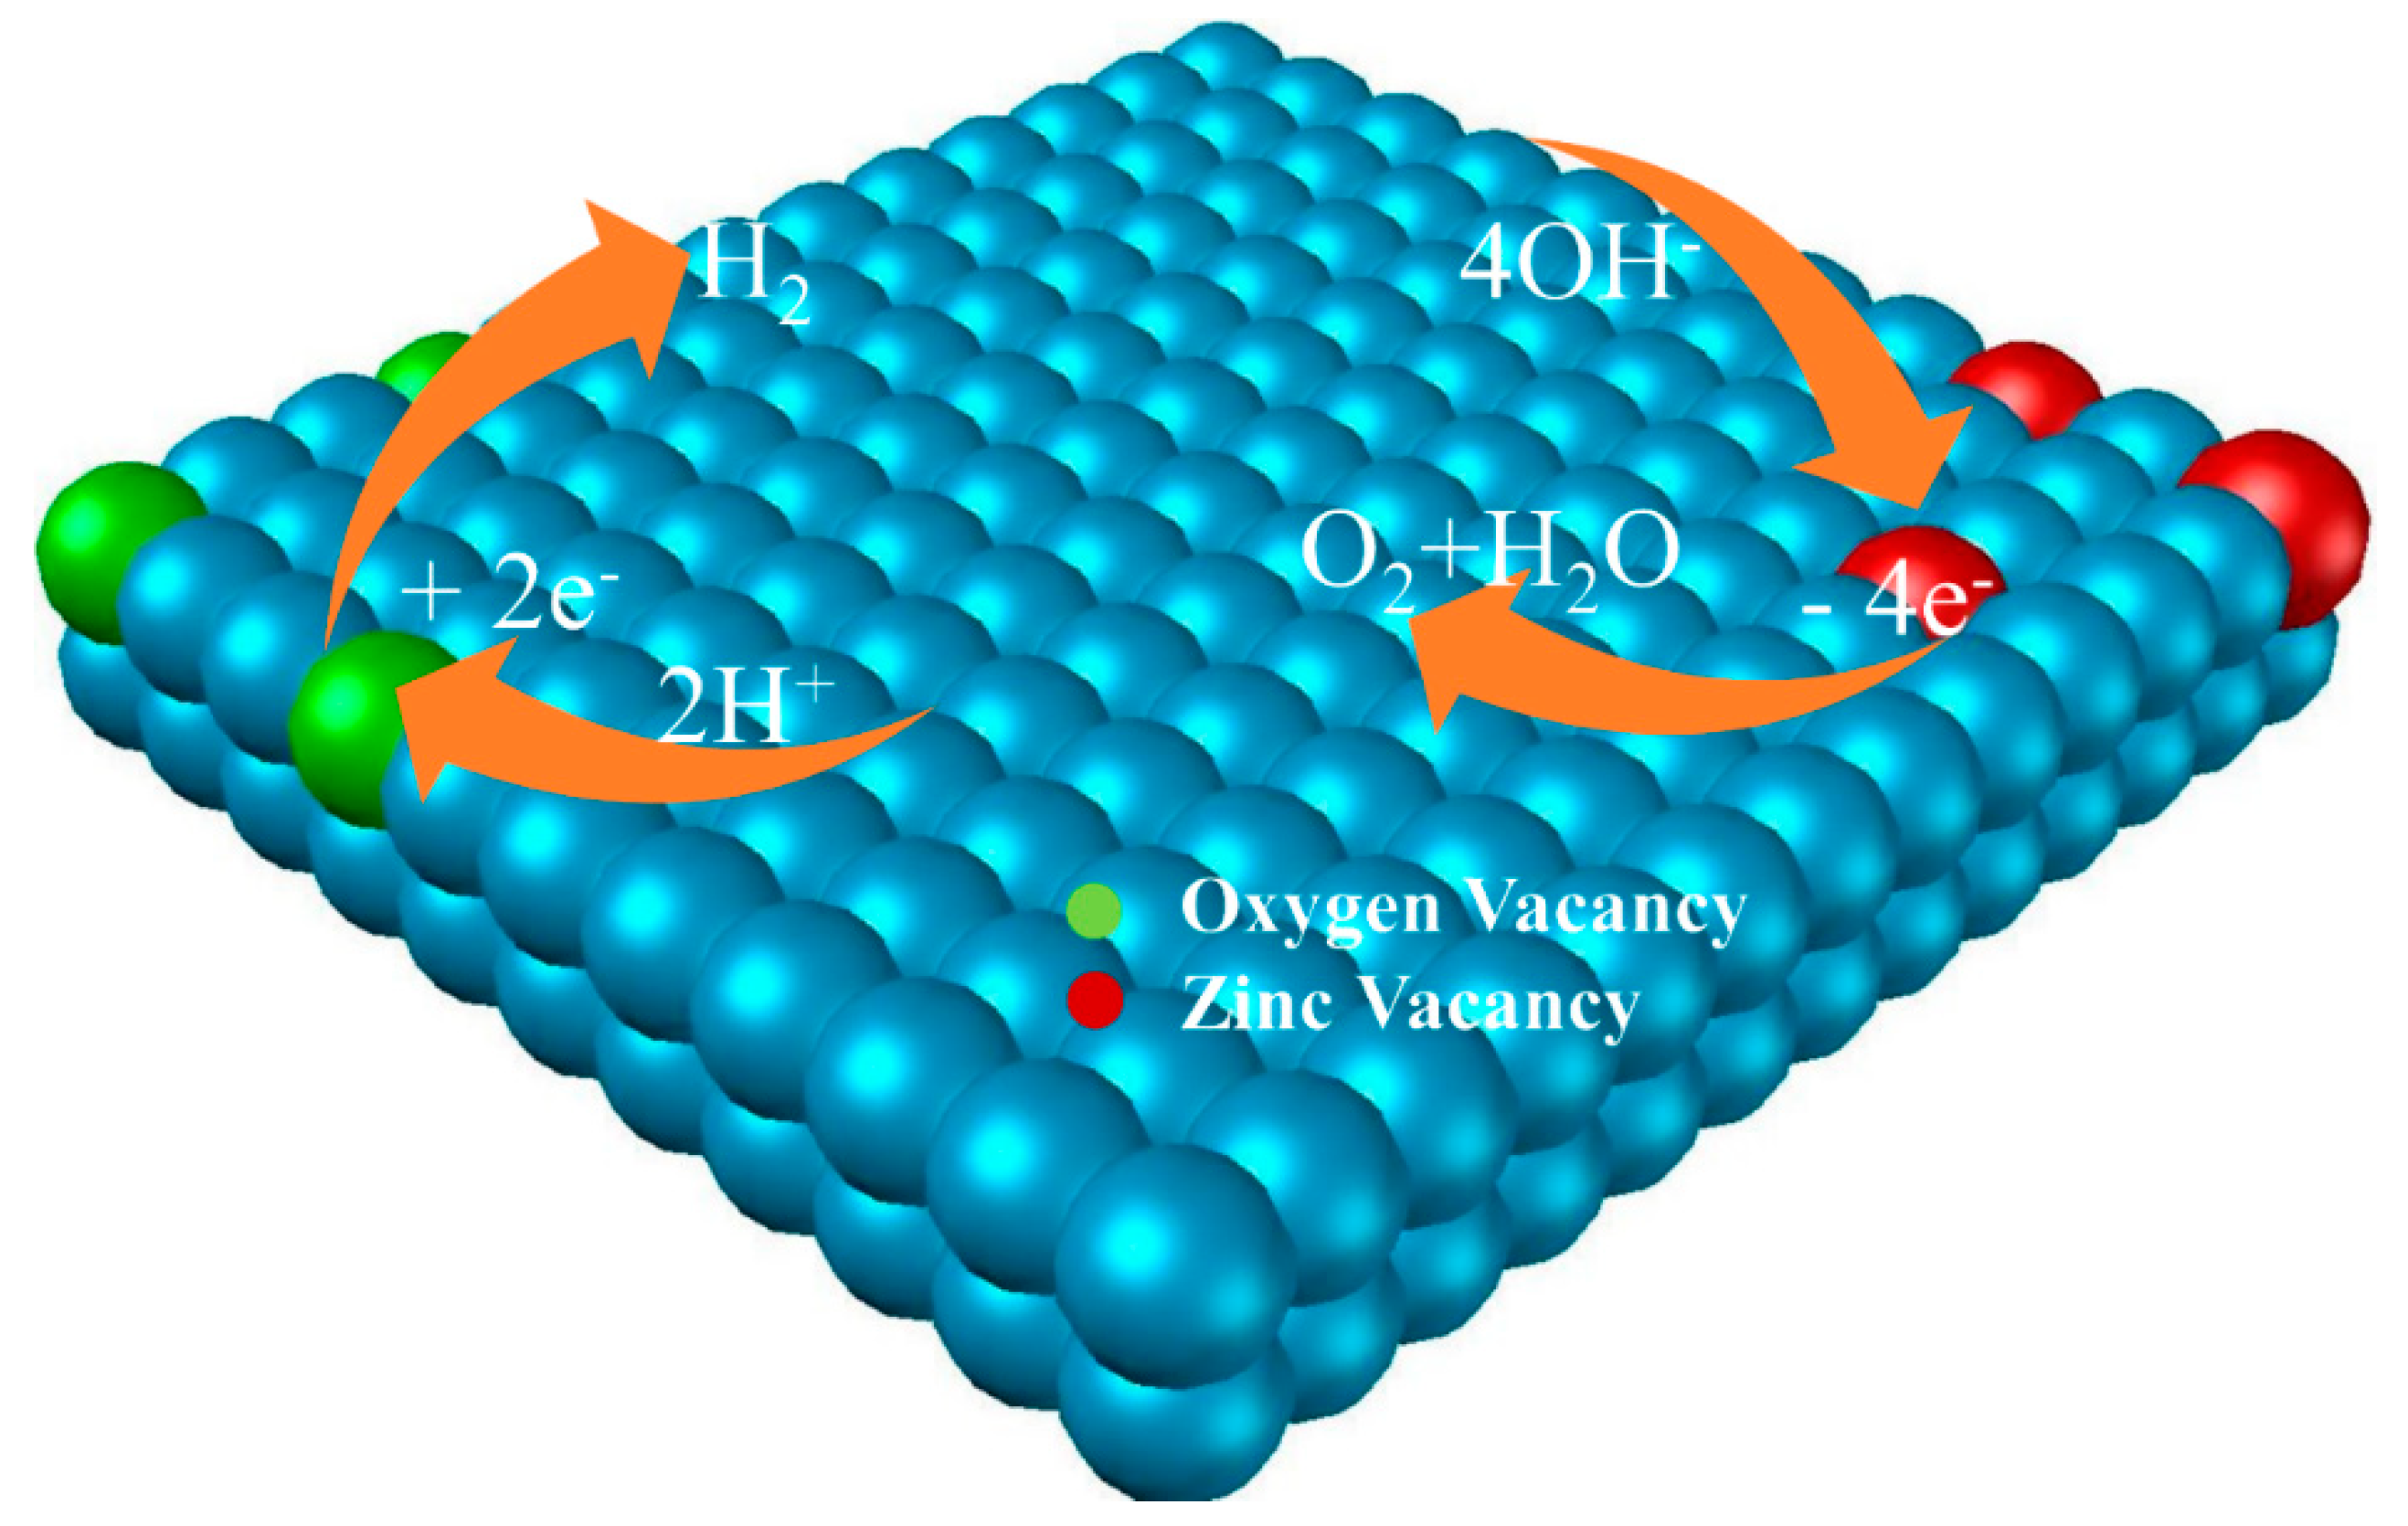
3.6. Electrocatalytic Activity

With better electrochemical response from the cyclic voltammetry, further electrocatalytic studies have been performed only for 80 °C heat threated sample. Electrocatalytic studies for synthesized ZnO of four pH value (7(Z1), 9(Z2), 11.5(Z3), and 13(Z4)) samples were considered for hydrogen evolution reaction (HER) and oxygen evolution reaction (OER) with 0.5 M KOH electrolyte. Results in Figure 9 depicts the significant HER and OER activity with exceptional material properties in cathodic and anodic regions, respectively. Figure 9a,d shows the linear sweep voltammogram (LSV) for OER and HER, respectively.
It should be noticed that the current density found consistently increased with the pH value used for the synthesis of ZnO, which is definitely the effect of increased effective surface available for electrochemical reaction. The effectiveness of synthesized material against the electrocatalytic process was observed with the significant decrease in onset potential at 10 mA cm−2 as expected for both OER and HER. Hence, good OER–HER activity confirms the property of bifunctional catalyst. Figure 9b,e shows the Tafel plot to test the material’s capability against the potential versus current. Tafel slope is calculated by fitting the linear part of LSV plot by Tafel equation. The values of Tafel slope against OER electrocatalysts from Figure 9b: 336, 261, 179, and 94 mV per decade for 7, 9, 11.5, and 13 pH values, respectively. Similarly, for HER, slope values found from Figure 9e: 290, 254, 233, and 180 mV per decade for 7, 9, 11.5, and 13 pH values, respectively. The hierarchical structures’ response found excellent in terms of lowest Tafel slope for both OER and HER activity and also effective when compared to previously reported values [19]. Further, the overpotential required to reach current density 10 mA cm−2 plotted in Figure 9c,f for OER and HER activity, respectively. For OER, pH 13, used for synthesis of ZnO, demonstrates the lowest overpotential of 260 mV, which is significantly lower than 320, 370, and 450 mV for 11.5, 9, and 7 pH, respectively, from Figure 9c. The calculated overpotentials for HER shown in Figure 9f: 610, 540, 500, and 440 mV for 13, 11.5, 9, and 7 pH, respectively. Therefore, the hierarchical structures also outperformed for electrocatalytic activity among all the samples, and the effective ability to catalyze the HER and OER ensures their application as an electrolyzer’s anode and cathode. Further, more development for ZnO based catalysts are still required to improve the performance. To explain the mechanism of the bifunctional electrocatalytic activity, the schematic diagram for working model of OER and HER at different active sites is shown in Figure 10. It has to be noticed that both Vzn and VO coexist in our samples, which was confirmed form above discussed results of different spectroscopic techniques; therefore, it can be concluded that domains related to these defects are responsible for OER and HER, respectively.
In the support of photo-and electrocatalytic activity, Figure 11 presented the N2 adsorption isotherms to discuss the relative porosity for the outperformed ZnO samples synthesized at 80 °C. The analysis revealed that pore volume found increase for the samples synthesized at higher pH value. These finding also support the higher photo-and electrocatalytic activity for the samples synthesized at higher pH value as discussed above. It can be decided that the increase in active surface area of the resulting samples found to be increased with the increase in reaction pH value.

4. Conclusions

Among the synthesized different ZnO morphology of samples through coprecipitation technique by varying pH value, hierarchical structures fulfilled the demand of realistic multifunctional properties along facile growth process. The change in pH value showed a significant and obvious transformation in morphologies from 2D plates, triangular, hexagonal rods, needles, and finally to hierarchical one. Only the high pH (~13) value synthesized ZnO show the pure wurtzite structure and was found suitable to achieve highly porous hierarchical morphology at lower post heat treatment (~80 °C). This hierarchical sample, especially with lower heat treatment, was/is able to provide a candle like luminescence and warm white after addition a blue band, which might be able to open an application in UV excited candle-like warm lighting along with blue excited natural white lighting. Further, hierarchical morphology also found more effective and stable for photocatalytic application by dye degradation very fast (100 min) and effectively (98%) of waste water treatment. This extraordinary hierarchical ZnO also found suitable for bifunctional electrocatalysts for OER and HER with significant reduced overpotential and Tafel slope. This bifunctional activity is attributed to high porosity nanostructure and might be able to use for symmetrical electrolysis cell for water electrolysis. Finally, the same hierarchical nanostructure successfully demonstrated the charge storage application with improved specific capacity (780 F g−1) and stability at high current density.

Author Contributions

Conceptualization, V.P.S., M.K., B.P.R., S. and R.K.G.; data curation, V.P.S., M.K., S. and R.K.G.; formal analysis, V.P.S. and M.K.; funding acquisition, M.K., B.P.R., S., R.K.G. and C.R.; investigation, V.P.S. and M.K.; methodology, V.P.S., M.K. and B.P.R.; project administration, C.R.; resources, C.R.; supervision, C.R.; validation, V.P.S., M.K., B.P.R., S., R.K.G. and C.R.; writing—original draft, V.P.S., M.K., S. and R.K.G.; writing—review and editing, V.P.S., M.K., B.P.R., S. and R.K.G. All authors have read and agreed to the published version of the manuscript.

Funding

This research received no external funding.

Acknowledgments

V.P. Singh acknowledges the AICTE/NPIU for providing the research grant under the CRS scheme. UGC-DAE Consortium for Scientific Research, Kolkata Centre, is acknowledged for providing the PAS facilities.

Conflicts of Interest

The authors declare no conflict of interest. The funders had no role in the design of the study; in the collection, analyses, or interpretation of data; in the writing of the manuscript, or in the decision to publish the results.

References

  1. Xu, W.L.; Zheng, M.J.; Ding, G.Q.; Shen, W.Z. Fabrication and optical properties of highly ordered ZnO nanodot arrays. Chem. Phys. Lett. 2005, 411, 37–42. [Google Scholar] [CrossRef]
  2. Huang, M.H.; Mao, S.; Feick, H.; Yan, H.; Wu, Y.; Kind, H.; Weber, E.; Russo, R.; Yang, P. Room-temperature ultraviolet nanowire nano lasers. Science 2001, 292, 1897–1899. [Google Scholar] [CrossRef] [Green Version]
  3. Guo, L.; Ji, Y.L.; Xu, H.; Simon, P.; Wu, Z. Regularly shaped, single-crystalline ZnO nanorods with wurtzite structure. J. Am. Chem. Soc. 2002, 124, 14864–14865. [Google Scholar] [CrossRef]
  4. Pan, Z.W.; Dai, Z.R.; Wang, Z.L. Nanobelts of semiconducting oxides. Science 2001, 291, 1947–1949. [Google Scholar] [CrossRef] [Green Version]
  5. Kong, X.Y.; Ding, Y.; Yang, R.; Wang, Z.L. Single-crystal nanorings formed by epitaxial self-coiling of polar nanobelts. Science 2004, 303, 1348–1351. [Google Scholar] [CrossRef] [Green Version]
  6. Zhang, J.; Sun, L.; Liao, C.; Yan, C. A simple route towards tubular ZnO. Chem. Commun. 2002, 3, 262–263. [Google Scholar] [CrossRef]
  7. Fan, H.J.; Scholz, R.; Kolb, F.M.; Zacharias, M.; Gösele, U. Growth mechanism and characterization of zinc oxide microcages. Solid State Commun. 2004, 130, 517–521. [Google Scholar] [CrossRef] [Green Version]
  8. Lao, J.Y.; Wen, J.G.; Ren, Z.F. Hierarchical ZnO nanostructures. Nano Lett. 2002, 2, 1287–1291. [Google Scholar] [CrossRef]
  9. Kim, K.-S.; Kim, H.W. Synthesis of ZnO nanorod on bare Si substrate using metal organic chemical vapor deposition. Phys. B Condens. Matter 2003, 328, 368–371. [Google Scholar] [CrossRef]
  10. Ng, H.T.; Chen, B.; Li, J.; Han, J.; Meyyappan, M.; Wu, J.; Li, S.X.; Haller, E.E. Optical properties of single-crystalline ZnO nanowires on m-sapphire. Appl. Phys. Lett. 2003, 82, 2023–2025. [Google Scholar] [CrossRef]
  11. Lyu, S.C.; Zhang, Y.; Ruh, H.; Lee, H.-J.; Shim, H.-W.; Suh, E.-K.; Lee, C.J. Low temperature growth and photoluminescence of well-aligned zinc oxide nanowires. Chem. Phys. Lett. 2002, 363, 134–138. [Google Scholar] [CrossRef]
  12. Gao, P.X.; Wang, Z.L. Substrate atomic-termination-induced anisotropic growth of ZnO nanowires/nanorods by the VLS process. J. Phys. Chem. B 2004, 108, 7534–7537. [Google Scholar] [CrossRef] [Green Version]
  13. Zhang, Y.; Jia, H.; Luo, X.; Chen, X.; Yu, D.; Wang, R. Synthesis, microstructure, and growth mechanism of dendrite ZnO nanowires. J. Phys. Chem. B 2003, 107, 8289–8293. [Google Scholar] [CrossRef]
  14. Roy, V.A.L.; Djurišić, A.B.; Chan, W.K.; Gao, J.; Lui, H.F.; Surya, C. Luminescent and structural properties of ZnO nanorods prepared under different conditions. Appl. Phys. Lett. 2003, 83, 141–143. [Google Scholar] [CrossRef] [Green Version]
  15. Jiansheng, J.; Wang, G.; Wang, Q.; Chen, Y.; Han, X.; Wang, X.; Hou, J.G. Synthesis and Characterization of Aligned ZnO Nanorods on Porous Aluminum Oxide Template. J. Phys. Chem. B 2004, 108, 11976. [Google Scholar]
  16. Vayssieres, L.; Keis, K.; Lindquist, S.-E.; Hagfeldt, A. Purpose-built anisotropic metal oxide material: 3D highly oriented microrod array of ZnO. J. Phys. Chem. B 2001, 105, 3350–3352. [Google Scholar] [CrossRef]
  17. Li, Y.; Meng, G.W.; Zhang, L.D.; Phillipp, F. Ordered semiconductor ZnO nanowire arrays and their photoluminescence properties. Appl. Phys. Lett. 2000, 76, 2011–2013. [Google Scholar] [CrossRef]
  18. Zheng, M.J.; Zhang, L.D.; Li, G.H.; Shen, W.Z. Fabrication and optical properties of large-scale uniform zinc oxide nanowire arrays by one-step electrochemical deposition technique. Chem. Phys. Lett. 2002, 363, 123–128. [Google Scholar] [CrossRef]
  19. Jia, W.; Dang, S.; Liu, H.; Zhang, Z.; Yu, C.; Liu, X.; Xu, B. Evidence of the formation mechanism of ZnO in aqueous solution. Mater. Lett. 2012, 82, 99–101. [Google Scholar] [CrossRef]
  20. Wang, Y.; Ma, C.; Sun, X.; Li, H. Preparation of nanocrystalline metal oxide powders with the surfactant-mediated method. Inorg. Chem. Commun. 2002, 5, 751. [Google Scholar] [CrossRef]
  21. Li, P.; Wei, Y.; Liu, H.; Wang, X. Growth of well-defined ZnO microparticles with additives from aqueous solution. J. Solid State Chem. 2005, 178, 855–860. [Google Scholar] [CrossRef]
  22. Zhang, H.; Yang, D.; Li, D.; Ma, X.; Li, S.; Que, D. Controllable growth of ZnO microcrystals by a capping-molecule-assisted hydrothermal process. Cryst. Growth Des. 2005, 5, 547–550. [Google Scholar] [CrossRef]
  23. Govender, K.; Boyle, D.S.; Kenway, P.B.; O’Brien, P. Understanding the factors that govern the deposition and morphology of thin films of ZnO from aqueous solution. J. Mater. Chem. 2004, 14, 2575–2591. [Google Scholar] [CrossRef]
  24. Kumar, M.; Dubey, S.; Rajendar, V.; Park, S.H. Fabrication of ZnO Thin Films by Sol-Gel Spin Coating and Their UV and White-Light Emission Properties. J. Electron. Mater. 2017, 46, 6029–6037. [Google Scholar] [CrossRef]
  25. Kumar, M.; Kumar, A.; Seong, K.S.; Park, S.H. Single-Crystalline ZnO/Graphene Quantum Dots Phosphors-Converted White Light-Emitting Diodes. IEEE Photonics Technol. Lett. 2019, 31, 203–205. [Google Scholar] [CrossRef]
  26. Ubaidullah, M.; Al-Enizi, A.M.; Shaikh, S.; Ghanem, M.A.; Mane, R.S. Waste PET plastic derived ZnO@NMC nanocomposite via MOF-5 construction for hydrogen and oxygen evolution reactions. J. King Saud Univ. Sci. 2020, 32, 2397–2405. [Google Scholar] [CrossRef]
  27. Wang, N.; Tao, B.; Miao, F.; Zang, Y. Electrodeposited Pd/graphene/ZnO/nickel foam electrode for the hydrogen evolution reaction. RSC Adv. 2019, 9, 33814–33822. [Google Scholar] [CrossRef] [Green Version]
  28. Aryanto, D.; Hastuti, E.; Taspika, M.; Anam, K.; Isnaeni, I.; Widayatno, W.B.; Wismogroho, A.S.; Marwoto, P.; Nuryadin, B.W.; Noviyanto, A. Characteristics and photocatalytic activity of highly c-axis-oriented ZnO thin films. J. Sol-Gel Sci. Technol. 2020, 96, 226–235. [Google Scholar] [CrossRef]
  29. Xiao, X.; Han, B.; Chen, G.; Wang, L.; Wang, Y. Preparation and electrochemical performances of carbon sphere @ZnO core-shell nanocomposites for supercapacitor applications. Sci. Rep. 2017, 7, 40167. [Google Scholar] [CrossRef] [Green Version]
  30. Zhang, Y.; Sun, X.; Pan, L.; Li, H.; Sun, Z.; Sun, C.; Tay, B.K. Carbon nanotube-ZnO nanocomposite electrodes for supercapacitors. Solid State Ion. 2009, 180, 1525–1528. [Google Scholar] [CrossRef]
  31. Lu, T.; Pan, L.; Li, H.; Zhu, G.; Lv, T.; Liu, X.; Sun, Z.; Chen, T.; Chua, D.H. Microwave-assisted synthesis of graphene-ZnO nanocomposite for electrochemical supercapacitors. J. Alloys Compond. 2011, 509, 5488–5492. [Google Scholar] [CrossRef]
  32. Ayaz, S.; Mishra, P.; Sen, S. Structure correlated optoelectronic and electrochemical properties of Al/Li modified ZnO. J. Appl. Phys. 2019, 126, 024302. [Google Scholar] [CrossRef]
  33. Kirkegaard, P.; Pedersen, N.J.; Eldrup, M. PATFIT-88: A Data-processing System for Positron Annihilation Spectra on Mainframe and Personal Computers; RISØ-M-2740; Risø National Laboratory: Roskilde, Denmark, 1989; Available online: www.risoe.dk/rispubl/reports/ris-m-2740.pdf (accessed on 21 September 2020).
  34. Musić, S.; Dragčević, Đ.; Popović, S. Influence of synthesis route on the formation of ZnO particles and their morphologies. J. Alloys Compd. 2007, 429, 242–249. [Google Scholar] [CrossRef]
  35. Degen, A.; Kosec, M. Effect of pH and impurities on the surface charge of zinc oxide in aqueous solution. J. Eur. Ceram. Soc. 2000, 20, 667–673. [Google Scholar] [CrossRef]
  36. Lippincott, E.R.; Psellos, J.A.; Tobin, M.C. The Raman spectra and structures of aluminate and zincate ions. J. Chem. Phys. 1952, 20, 536. [Google Scholar] [CrossRef]
  37. Cuscó, R.; Alarcón-Lladó, E.; Ibanez, J.; Artús, L.; Jiménez, J.; Wang, B.; Callahan, M.J. Temperature dependence of Raman scattering in ZnO. Phys. Rev. B 2007, 75, 165202. [Google Scholar] [CrossRef]
  38. Look, D.C.; Reynolds, D.C.; Sizelove, J.R.; Jones, R.L.; Litton, C.W.; Cantwell, G.; Harsch, W.C. Electrical properties of bulk ZnO. Solid State Commun. 1998, 105, 399–401. [Google Scholar] [CrossRef]
  39. Tuomisto, F.; Ranki, V.; Saarinen, K.; Look, D.C. Evidence of the Zn vacancy acting as the dominant acceptor in n-type ZnO. Phys. Rev. Lett. 2003, 91, 205502. [Google Scholar] [CrossRef] [Green Version]
  40. Brauer, G.; Anwand, W.; Grambole, D.; Grenzer, J.; Skorupa, W.; Čížek, J.; Kuriplach, J.; Procházka, I.; Ling, C.C.; So, C.K. Identification of Zn-vacancy-hydrogen complexes in ZnO single crystals: A challenge to positron annihilation spectroscopy. Phys. Rev. B 2009, 79, 115212. [Google Scholar] [CrossRef] [Green Version]
  41. Anwand, W.; Brauer, G.; Cowan, T.E.; Grambole, D.; Skorupa, W.; Čížek, J.; Kuriplach, J.; Procházka, I.; Egger, W.; Sperr, P. Structural characterization of H plasma-doped ZnO single crystals by positron annihilation spectroscopies. Phys. Status Solidi A 2010, 207, 2415–2425. [Google Scholar] [CrossRef]
  42. Xie, R.; Sekiguchi, T.; Ishigaki, T.; Ohashi, N.; Li, D.; Yang, D.; Liu, B.; Bando, Y. Enhancement and patterning of ultraviolet emission in ZnO with an electron beam. Appl. Phys. Lett. 2006, 88, 134103. [Google Scholar] [CrossRef]
  43. Chen, Z.Q.; Maekawa, M.; Yamamoto, S.; Kawasuso, A.; Yuan, X.L.; Sekiguchi, T.; Suzuki, R.; Ohdaira, T. Evolution of voids in Al+-implanted ZnO probed by a slow positron beam. Phys. Rev. B 2004, 69, 035210. [Google Scholar] [CrossRef] [Green Version]
Figure 1. The X-ray diffraction (XRD) patterns of the ZnO powder synthesized at different pH (5.5, 7, 9, 10, 11.5, and 13.0), (a) dried at 80 °C for 24 h, (b) dried at 250 °C for 5 h.
Crystals 10 01025 g001
Figure 2. The scanning electron microscopy (SEM) image of synthesized ZnO powder: (af) for pH 5.5, 7, 9, 10, 11.5, and 13.0, respectively dried at 80 °C for 24 h; (gl) for pH 5.5, 7, 9, 10, 11.5, and 13.0, respectively dried at 250 °C for 5 h.
Crystals 10 01025 g002
Figure 3. Schematic diagram of the growth mechanism of ZnO under coprecipitation route with varying the pH (5.5, 7, 9, 10, 11.5, and 13.0) of solution during synthesis.
Crystals 10 01025 g003
Figure 4. The Raman spectrum of synthesized ZnO powder: (af) for pH 5.5, 7, 9, 10, 11.5, and 13.0, respectively dried at 80 °C for 24 h; (gl) for pH 5.5, 7, 9, 10, 11.5, and 13.0, respectively dried at 250 °C for 5 h.
Crystals 10 01025 g004
Figure 5. Positron lifetime spectrum of ZnO powder synthesized at different pH of 9.0, 11.5, and 13.0 (a) dried at 80 °C for 24 h, (b) dried at 250 °C for 5 h.
Crystals 10 01025 g005
Figure 6. Photoluminescence (PL) spectrum for synthesized ZnO powder: (af) for pH 5.5, 7, 9, 10, 11.5, and 13.0, respectively dried at 80 °C for 24 h; (gl) for pH 5.5, 7, 9, 10, 11.5, and 13.0, respectively dried at 250 °C for 5 h; (m) deconvoluted PL spectra of sample synthesized at pH 13 and dried at 80 °C for 24 h; (n) simulated PL spectra of pH 13 and dried at 80 °C for 24 h along with the possibility of application for achieving the candle-like and sun equivalent spectra.
Crystals 10 01025 g006
Figure 7. (ac) shows the absorbance spectra, photocatalytic activities, and percentage dye degradation, respectively for synthesized ZnO dried at 80 °C; (df) shows the absorbance spectra, photocatalytic activities and percentage dye degradation, respectively with synthesized ZnO dried at 250 °C; (g) Calculated half-life for different samples; (h) Cyclic behavior for samples synthesized at 80 °C; (i) Cyclic behavior for samples synthesized at 250 °C.
Crystals 10 01025 g007
Figure 8. (a,b) show the cyclovoltammetry curves and specific capacitance against current density for synthesized ZnO dried at 80 °C; (c,d) show the cyclovoltammetry curves and specific capacitance against current density for synthesized ZnO dried at 250 °C.
Crystals 10 01025 g008
Figure 9. (ac) show the linear sweep voltammogram (LSV), Tafel plots and overpotential for oxygen evolution reaction (OER) for synthesized ZnO dried at 80 °C; (df) show the LSV, Tafel plots and overpotential for hydrogen evolution reaction (HER) for synthesized ZnO dried at 80 °C.
Crystals 10 01025 g009
Figure 10. Schematic diagram for working model of OER and HER at different active sites.
Crystals 10 01025 g010
Figure 11. (ad) N2 adsorption isotherms for different ZnO synthesized @80 °C samples used for catalytic activity.
Crystals 10 01025 g011
Table 1. Positron annihilation lifetimes (τ) and corresponding intensities (I) of ZnO powder synthesized through coprecipitation route at different pH, dried at 80 °C @24 h and 250 °C @5 h, respectively.
ZnO
at Different pH
Positron Lifetime (ps)Defect Relative Intensities
τ1τ2τ3I1I2I3
9Raw166.1 ± 11.1317.6 ± 23.7812.7 ± 226.250.4 ± 8.548.03 ± 7.41.57 ± 1.4
250183.7 ± 4.1400 ± 7.63168.2 ± 249.139.11 ± 2.140.36 ± 2.10.54 ± 0.1
11.5Raw168.0 ± 5.6340.0 ± 11.61360.5 ± 248.355.74 ± 3.943.57 ± 3.70.69 ± 0.3
250197.5 ± 3.2424 ± 9.44238.8 ± 155.267.46 ± 1.931.36 ± 1.91.18 ± 0.1
13Raw198.3 ± 2.3507.9 ± 15.72161.2 ± 97.676.05 ± 1.222.01 ± 1.41.94 ± 0.2
250185.6 ± 3.9393.3 ± 7.43936.6 ± 131.758.10 ± 2.240.58 ± 2.21.31 ± 0.1
τ1, τ2, and τ3 are Positron Life Time with Relative Intensities I1, I2, and I3.
Publisher’s Note: MDPI stays neutral with regard to jurisdictional claims in published maps and institutional affiliations.

