Article

Development of a Microbial Fuel Cell Using Methylococcus Chroococcus Bacteria as a Biocatalyst

Mechanical Engineering Department, College of Engineering, King Saud University, P.O. Box 800, Al-Riyadh 11421, Saudi Arabia
*
Author to whom correspondence should be addressed.
Submission received: 20 September 2021 / Revised: 20 October 2021 / Accepted: 24 October 2021 / Published: 26 October 2021
(This article belongs to the Special Issue Advances in Nanocomposites and Alloys in Saudi Arabia)

Abstract

:
Methane is an extensively accessible green energy that can be obtained organically just by way of through natural gases. However, using methane in fuel at ambient temperature conditions is quite challenging, due to its high thermodynamically stability. In this present investigation, the feasibility of using methane in the low-temperature microbial fuel-cell (MFC) with an unadulterated culture of Methylococcus chroococcus without the inclusion of any additional electron mediators is investigated. The microbial fuel cell setup was prepared using a salt bridge. Through potentiodynamic study, power density, and OCV, it can be seen that the setup delivers a sufficient amount of voltage and power as the days progress. Electrochemical Impedance Spectroscopic investigations also depict the fact that the cell required roughly one day to balance out, and kept working at full force for up to seven days. This work exhibits the chance of creating power utilizing methane as one of the main carbon sources at ambient temperature with an M. chroococcus unadulterated culture as the direct electron-transporting MFC biocatalyst.

1. Introduction

In recent years, there has been an increase in energy demand. Non-renewable energy sources, such as petroleum derivatives and atomic force, are generally utilized across the planet [1]. With regards to petroleum products, this source of energy harms the environment, and continuous utilization of non-renewable energy sources discharges carbon dioxide, which becomes poisonous when there are high concentrations of it around. The quick exhaustion of petroleum products has fundamentally affected human existence through air contamination and a worldwide temperature increase [2,3,4]. Be that as it may, numerous countries worldwide have made remarkable endeavors to find a practical choice to address the energy issue, by zeroing in on inexhaustible wellsprings of energy, such as solar energy, water energy, and wind energy [5,6,7]. These endeavors gave another approach to deliver power that uses an energy unit including metal impetuses of high worth (in the customary form). Indeed, many advantages can be acquired by utilizing power devices contrasted with other energy makers, for example, the discharge of zero earth dirtying gases, for instance, CO2, CO, NOx, and SOx, with more prominent proficiency, and the shortfall of portable parts, bringing about less sonic “contamination” [8]. The solitary weaknesses of these new energy sources are their significantly high cost and mass use [8]. Microbial Fuel Cell (MFC) is a type of bio-electrochemical energy unit that requires the presence of dynamic microscopic organisms, functioning as biocatalysts, for bioenergy generation in anodic chambers [9,10]. In the year 1911, Potter [11] revealed that bacteria were fit for creating an electric current. In later years, great outcomes were noticed, despite being low in frequency. [12]. Incidentally, the power device became the focal point of consideration toward the start of the 1990s, and, subsequently, MFC innovation was additionally considered [13]. Moreover, more exploration was conducted in the year 1999, as it was recognized that the presence of a go-between is not an unquestionable requirement for an MFC [14].
The MFC has been utilized to produce energy at ambient temperatures. A vital prerequisite is the biocatalyst, which can be oxidized into the fuel. The MFC comprises two chambers, the first of which is anaerobic (anode), and the other is high impact (cathode). In the anaerobic chamber, the substrate is oxidized by the type of biocatalyst microorganism, and electrons are moved to the direction of the anode either by the exogenous electron transporter, or the arbiter, (for example, potassium ferric cyanide, thiamine, or unbiased red) [15,16]. Methane-based power devices that employ switched methanogenesis utilizing a microbial consortium have been researched previously [17,18]. Notwithstanding, utilizing an unadulterated culture of the microorganisms to produce power from methane has not been attempted. Methylococcus encapsulates are accessible to be utilized as a biocatalyst. M. chroococcus is a Gram-negative, methane-oxidizing bacterium that has been isolated from marine, freshwater, and earthly natural surroundings [19]. Methylotrophs have received impressive mechanical interest as of late, and a few licenses have been promptly issued due to the business abuse of their proteins [20], since they are highly accessible as a biocatalyst. With this taken into consideration, a M. chroococcus-based microbial energy component has never been illustrated. Here, we propose a methane-burning-through-microbial energy unit, utilizing M. chroococcus as the biocatalyst. Researching such a power device is significant, as the effects of the bacterial environment, the type of proton conductive material, and the framework arrangement of energy component execution are not known for certain [21,22].

2. Materials and Methods

2.1. Acclimation

A medium of sterilized nitrate mineral salts with 13.6 g/L Agar was used to cultivate M. chroococcus (Bath) [23]. For this culture, a Petri dish was taken, with the formulation of 56% oxygen and 44% methane incapacity. These cultures were incubated at a temperature of 35 °C for 7 days. When the colonies were formed, they were separated from each other, and transferred to a nitrate mineral salts medium. This culture was also incubated at a temperature of 37 °C, with a continuous stream of oxygen (56%) and methane (44%) through the sample at a rate of 20 cc/min. UV-Vis Spectrophotometry was employed to measure the absorbance of the culture at regular intervals at 440 µm [24]. Until and unless the stationary phase were achieved, cultures were grown up continuously. When the stationary phase was achieved, 50 µL of the sample was taken out every day, and simultaneously replaced with the medium of nitrate mineral salt, and thus a continuous culture was maintained. The samples were dried at 100 °C, the dry weight was measured, and the samples were dried at 500 °C to measure the ash content. This calculation was done to measure the cell density [25].

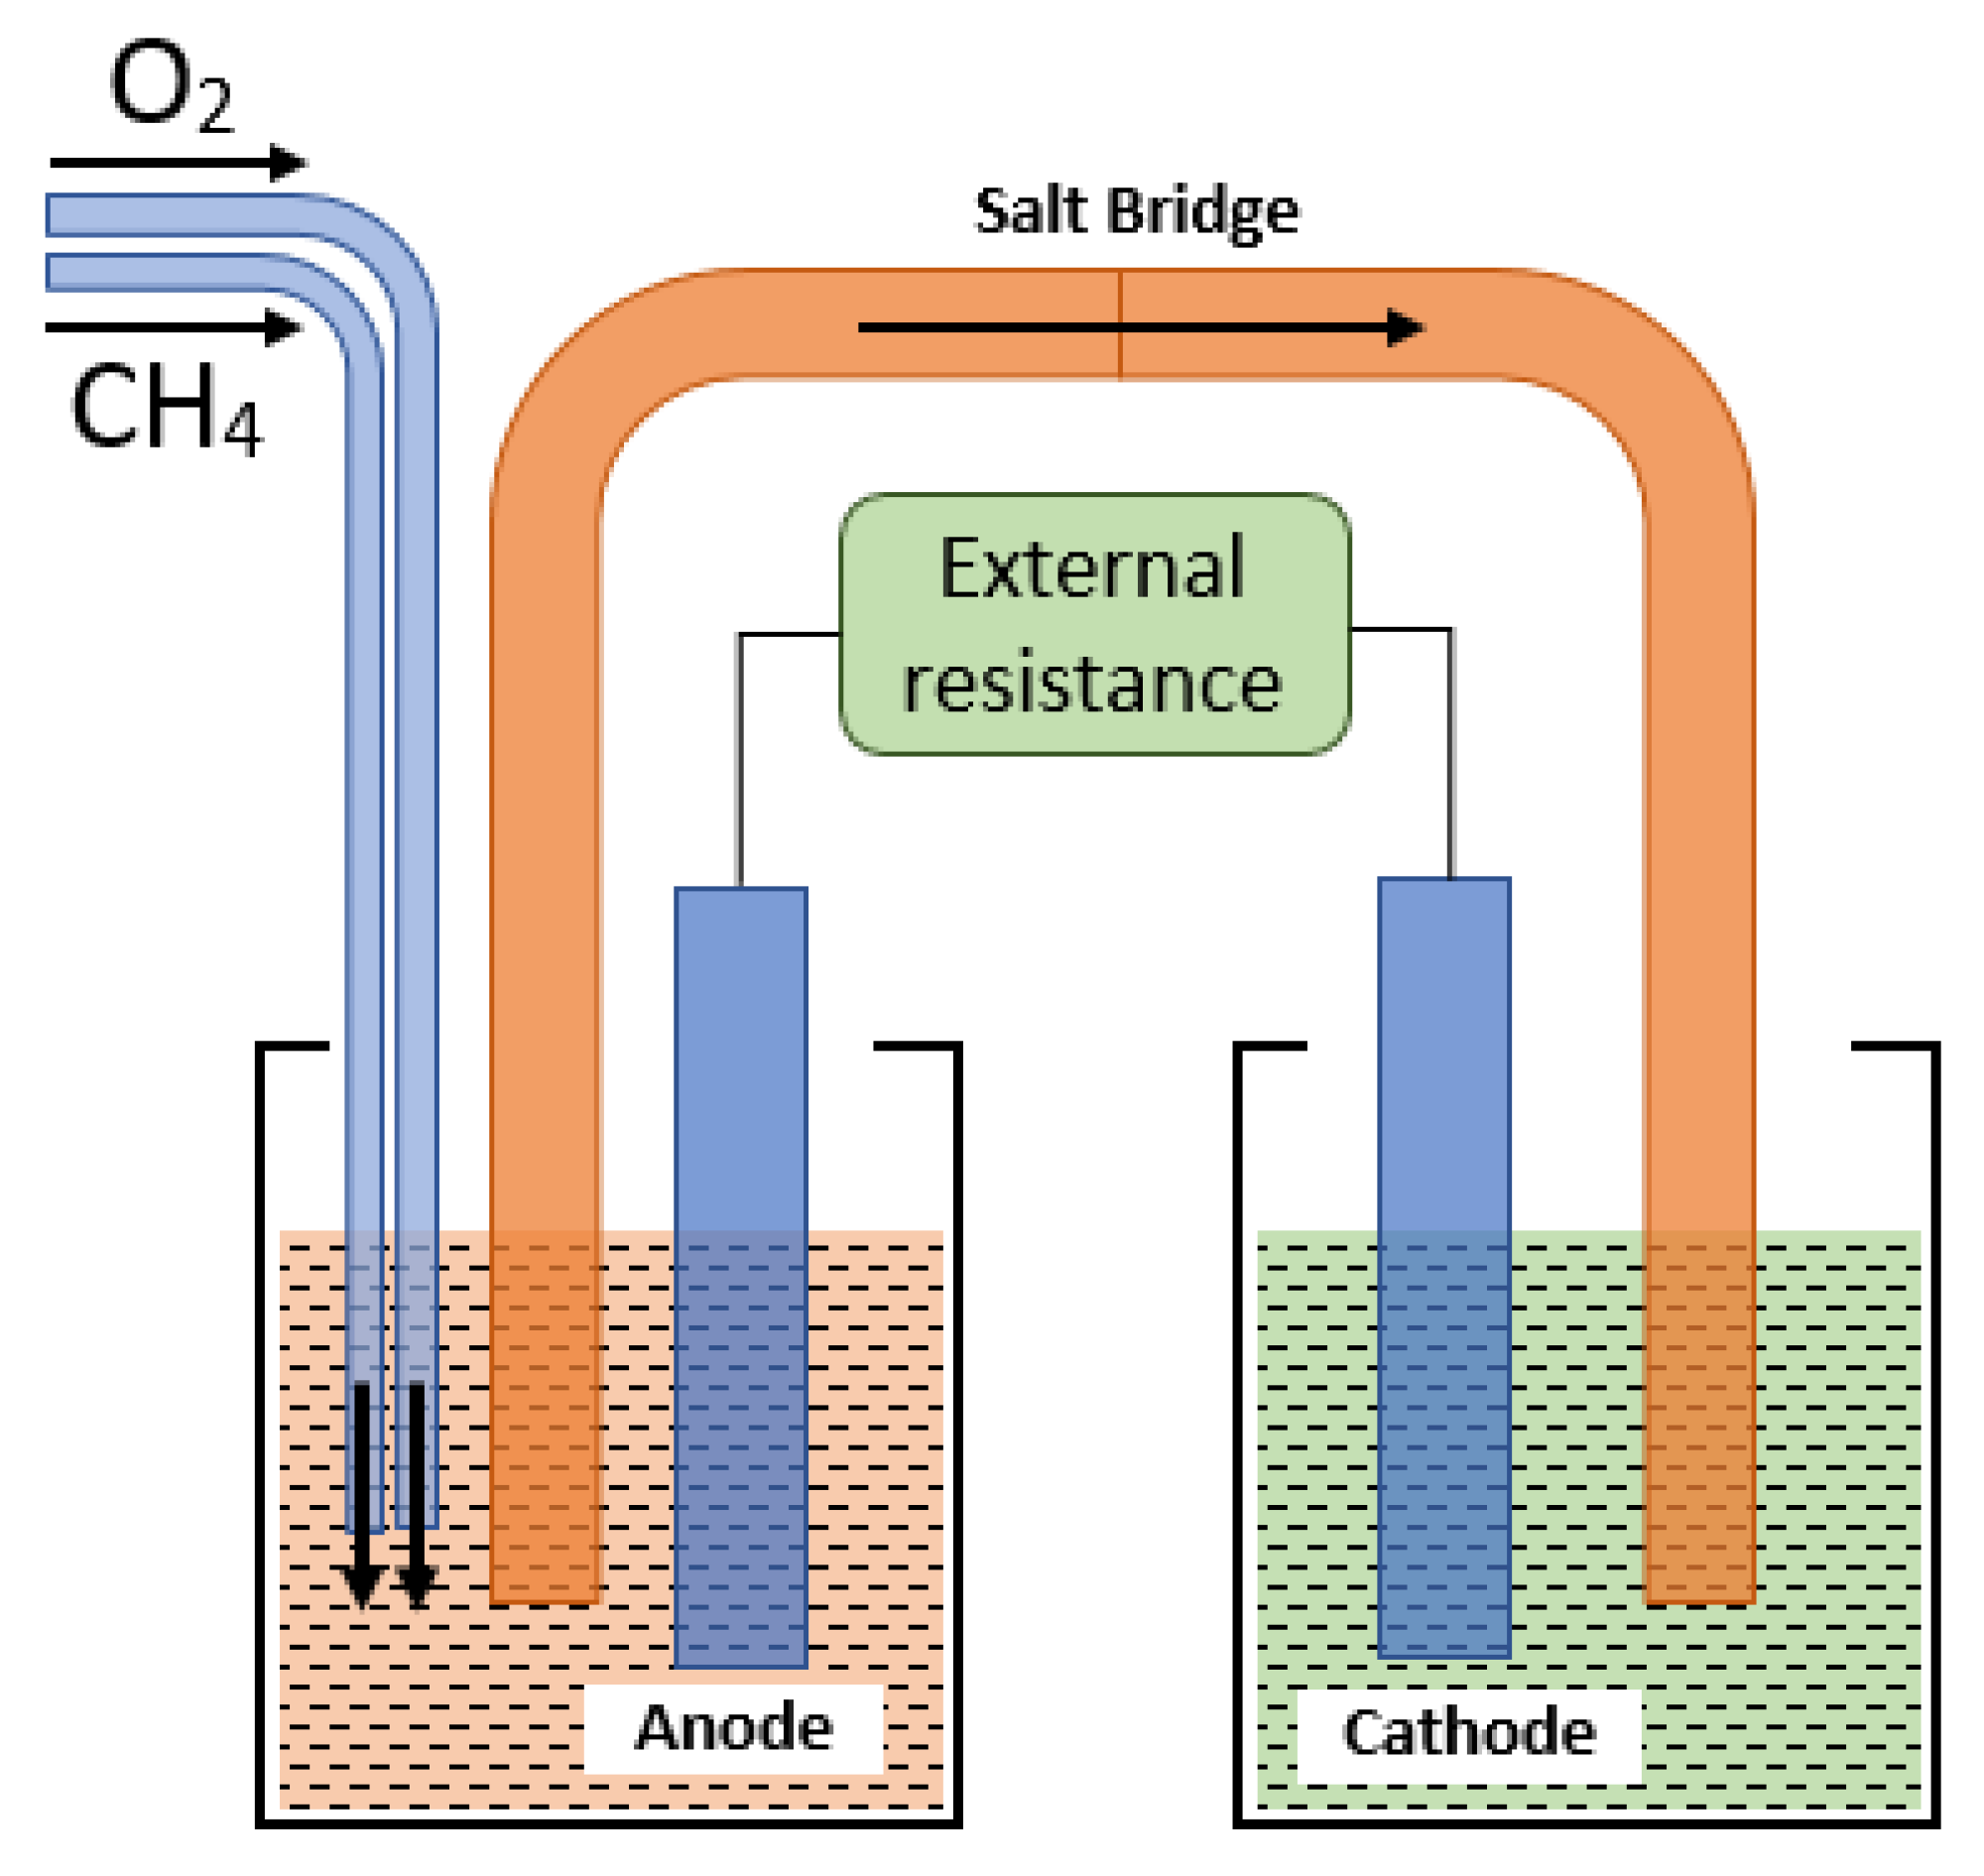
2.2. MFC Construction

A Microbial Fuel Cell (MFC) was constructed with a salt bridge to evaluate its feasibility. A U-shaped acrylic tube was taken, with an internal diameter of 1 cm and a length of 10 cm. Before constructing the salt bridge, the tube was washed and sterilized using 70% alcohol. The salt bridge electrolyte was prepared using saturated KCl solution, with agar dissolved into it. The electrolyte was autoclaved at 125 °C for 1 hour. Finally, this solution was poured into the tube, and kept in a cold-water solution to solidify overnight in a biological cabinet. Subsequently, the prepared salt bridge was kept in a saturated KCl solution to prevent it from drying.
For the construction of the microbial fuel cell set up, 150 mL of BOROSIL glass media bottles were used. The carbon foam electrodes with 1.00 cm2/g were also used to create it [26]. This was used as both the anode and cathode of the MFC. The salt bridge was used as the connector for the anode and cathode chambers (Figure 1). Titanium wires were used for connecting cathode and anode to the external electrical circuit.
The chamber containing the cathode was filled the potassium ferricyanide (0.05 N K3Fe(CN)6 in 0.05 N phosphate buffer solution) as a catholyte. The chamber which contained the anode was filled with a microbial suspension, and a continuous stream of 56% oxygen and 44% methane was bubbled through the sample at 25 cc/min.

2.3. Electrochemical Experiments

After the completion of the setup, a multimeter was connected with the MFC to measure the open-circuit voltage. To study the polarization behavior of the microbial fuel cell, the open-circuit voltage (OCV) of the microbial fuel cell was time recorded.
The power density was calculated using a resistor box. The range of variation of resistance was given from 1000 Ω to 1 Ω. The voltage of the microbial fuel cell was then measured correspondingly with the resistance. The power curve of the MFC was developed to evaluate the maximum power output. Power (P) was calculated using P = IV, and normalized to the surface area of the anode.
Electrochemical impedance spectroscopic (EIS) analysis was conducted using a Gamry potentiostat ((Model PC/750, Louis Drive, Warminster, PA, USA). The frequency range was taken to be between 100 kHz and 1 MHz. Here, the anode was used as the working electrode, while the cathode acted as the counter electrode. During both the potentiodynamic polarization test and EIS analysis, one reference electrode i.e., a saturated calomel electrode, was introduced into the chamber. After fitting the EIS data with the proper circuit, a Nyquist plot was obtained. In the case of EIS testing, a small signal was used, so that the EIS was a non-destructive technique. In fact, in the case of polarization tests, the curve was taken only in the cathodic region: it did not reach the anodic region. Thus, corrosion was not taking place extensively. For both EIS and polarization tests, the data were taken after 1, 3, 5, and 7 days. Each experiment was completed three times to ensure accuracy.

3. Results and Discussions

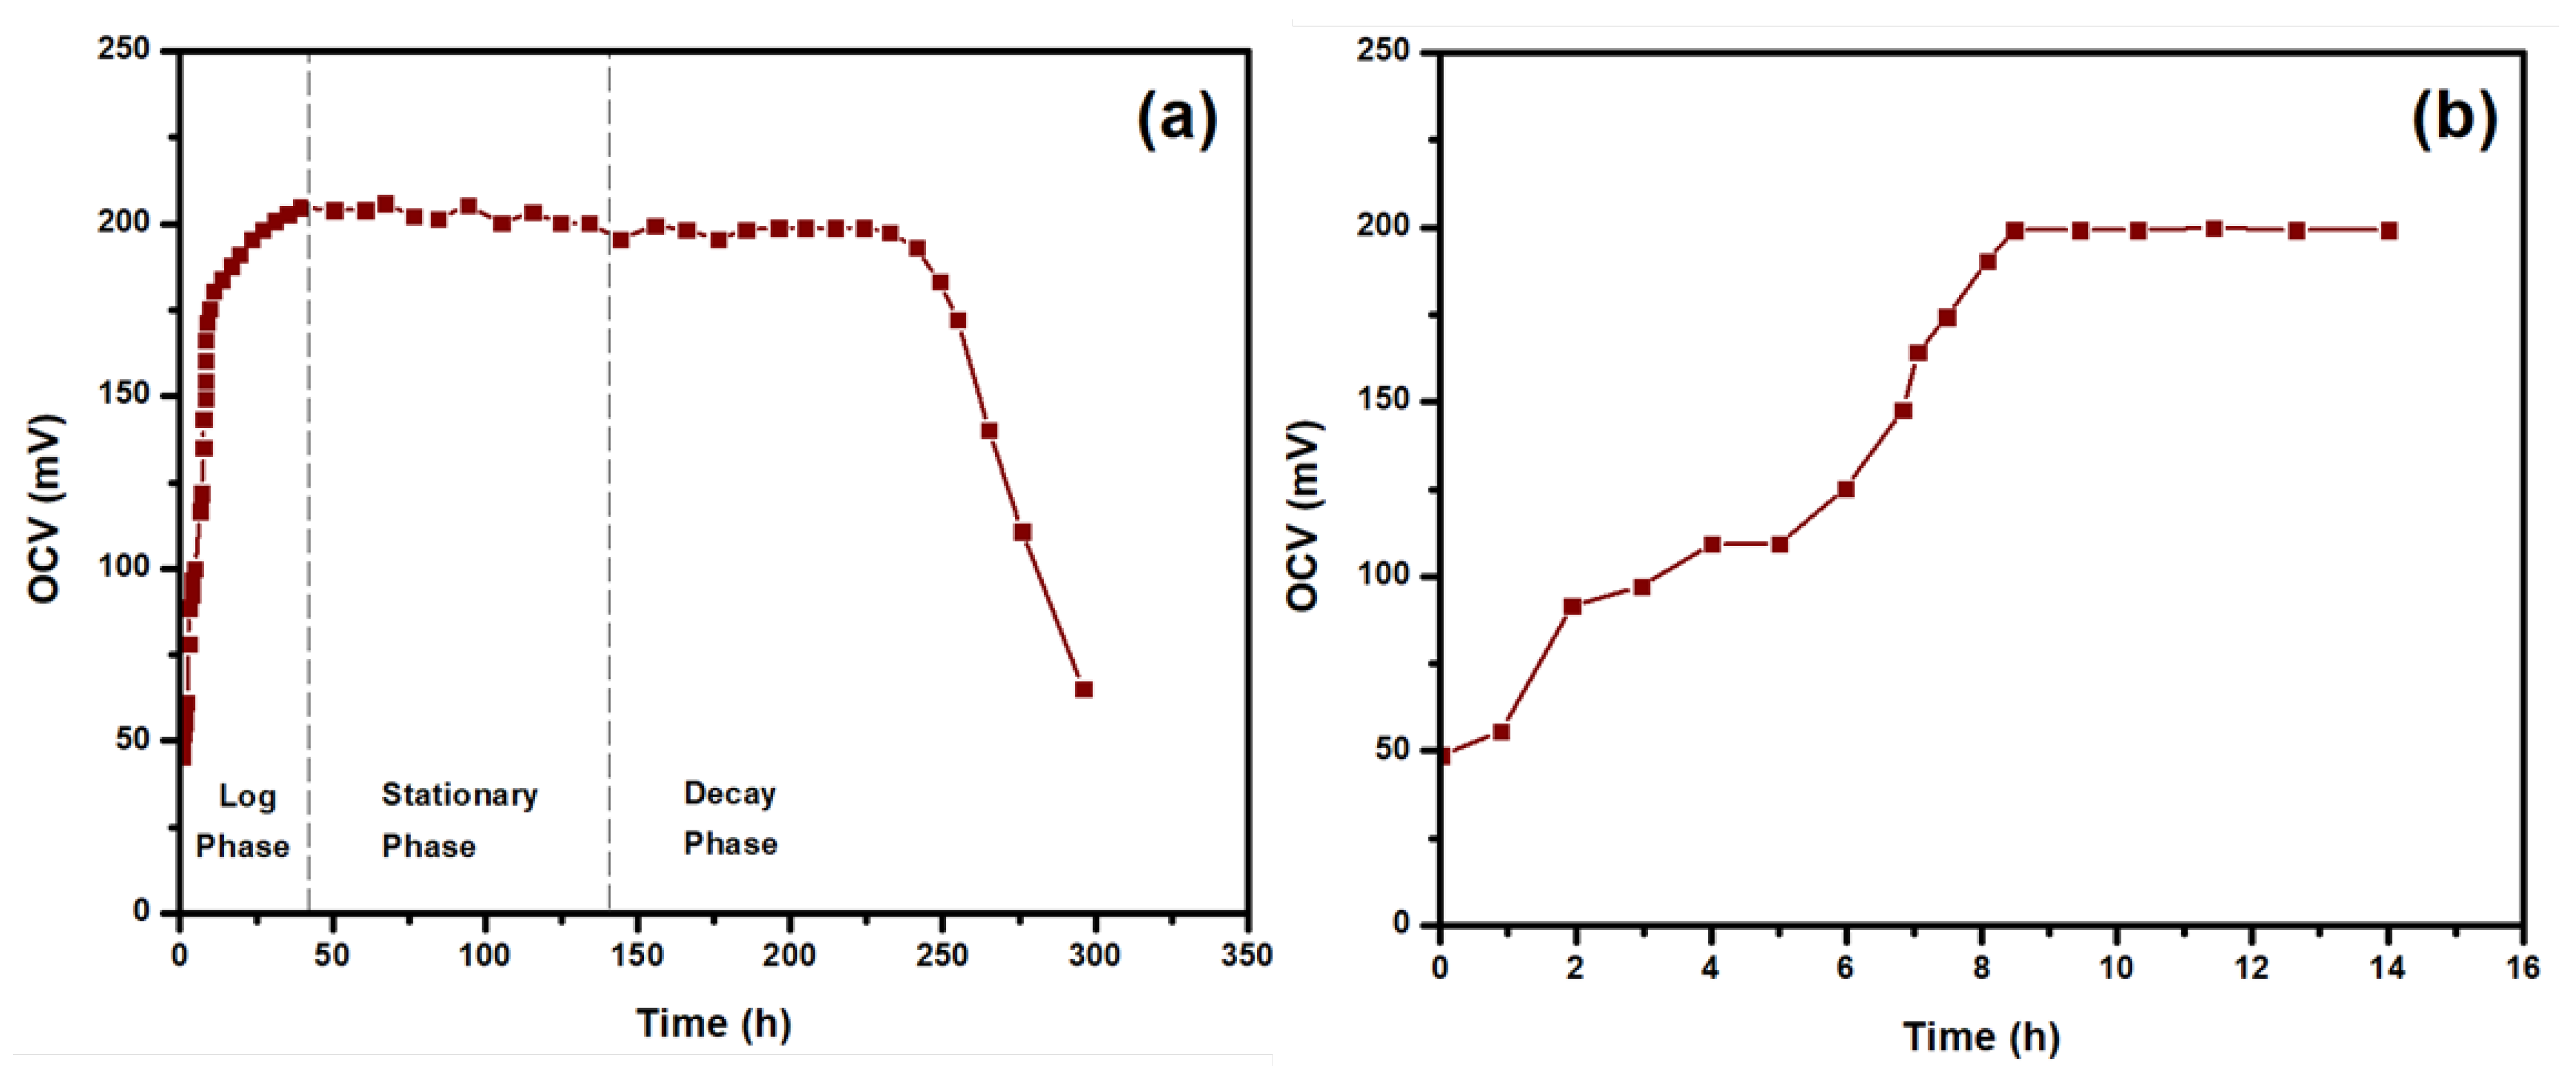
3.1. Open Circuit Voltage

The performance of the MFC can be interpreted through a basic measurement of OCV. Figure 2 a represents the OCV curve of the MFC. From the figure, it is clear that the OCV of the MFC increased rapidly up to 10 h after the initial assembly of the system, and reached a maximum value of 200 mV. In the beginning, the OCV curve of this cell gave 50 mV, and then steadily increased and reached 170 mV within a day. After that, it increased slightly and reached 200 mV. From the curve, it is quite clear that after the sevventh day, the OCV curve started fluctuating, and this phenomenon was attributed to the decay of the salt bridge. As a result, the data were recorded for up to seven days. From the curve, it is also clear that the culture reached a mature phase after 50 h, and after 200 h it had started to decline. The voltage increases are also observed in the log phase. However, throughout the stationary phase, it was maintained at the maximum voltage for a long period of time. Therefore, it can be concluded that to, operate the MFC properly, it must be kept in the stationary phase.
In many reported works, it is shown that the range of the OCV of MFCs is 15 mV [22] to 800 mV [27]. It is also reported that the use of a Proton Exchange Membrane (PEM) instead of a salt bridge in a MFC can increase the fuel cell’s OCV by fifteen-fold [22]. As a result, it is expected that PEM fuel cells will be more effective with this setup.

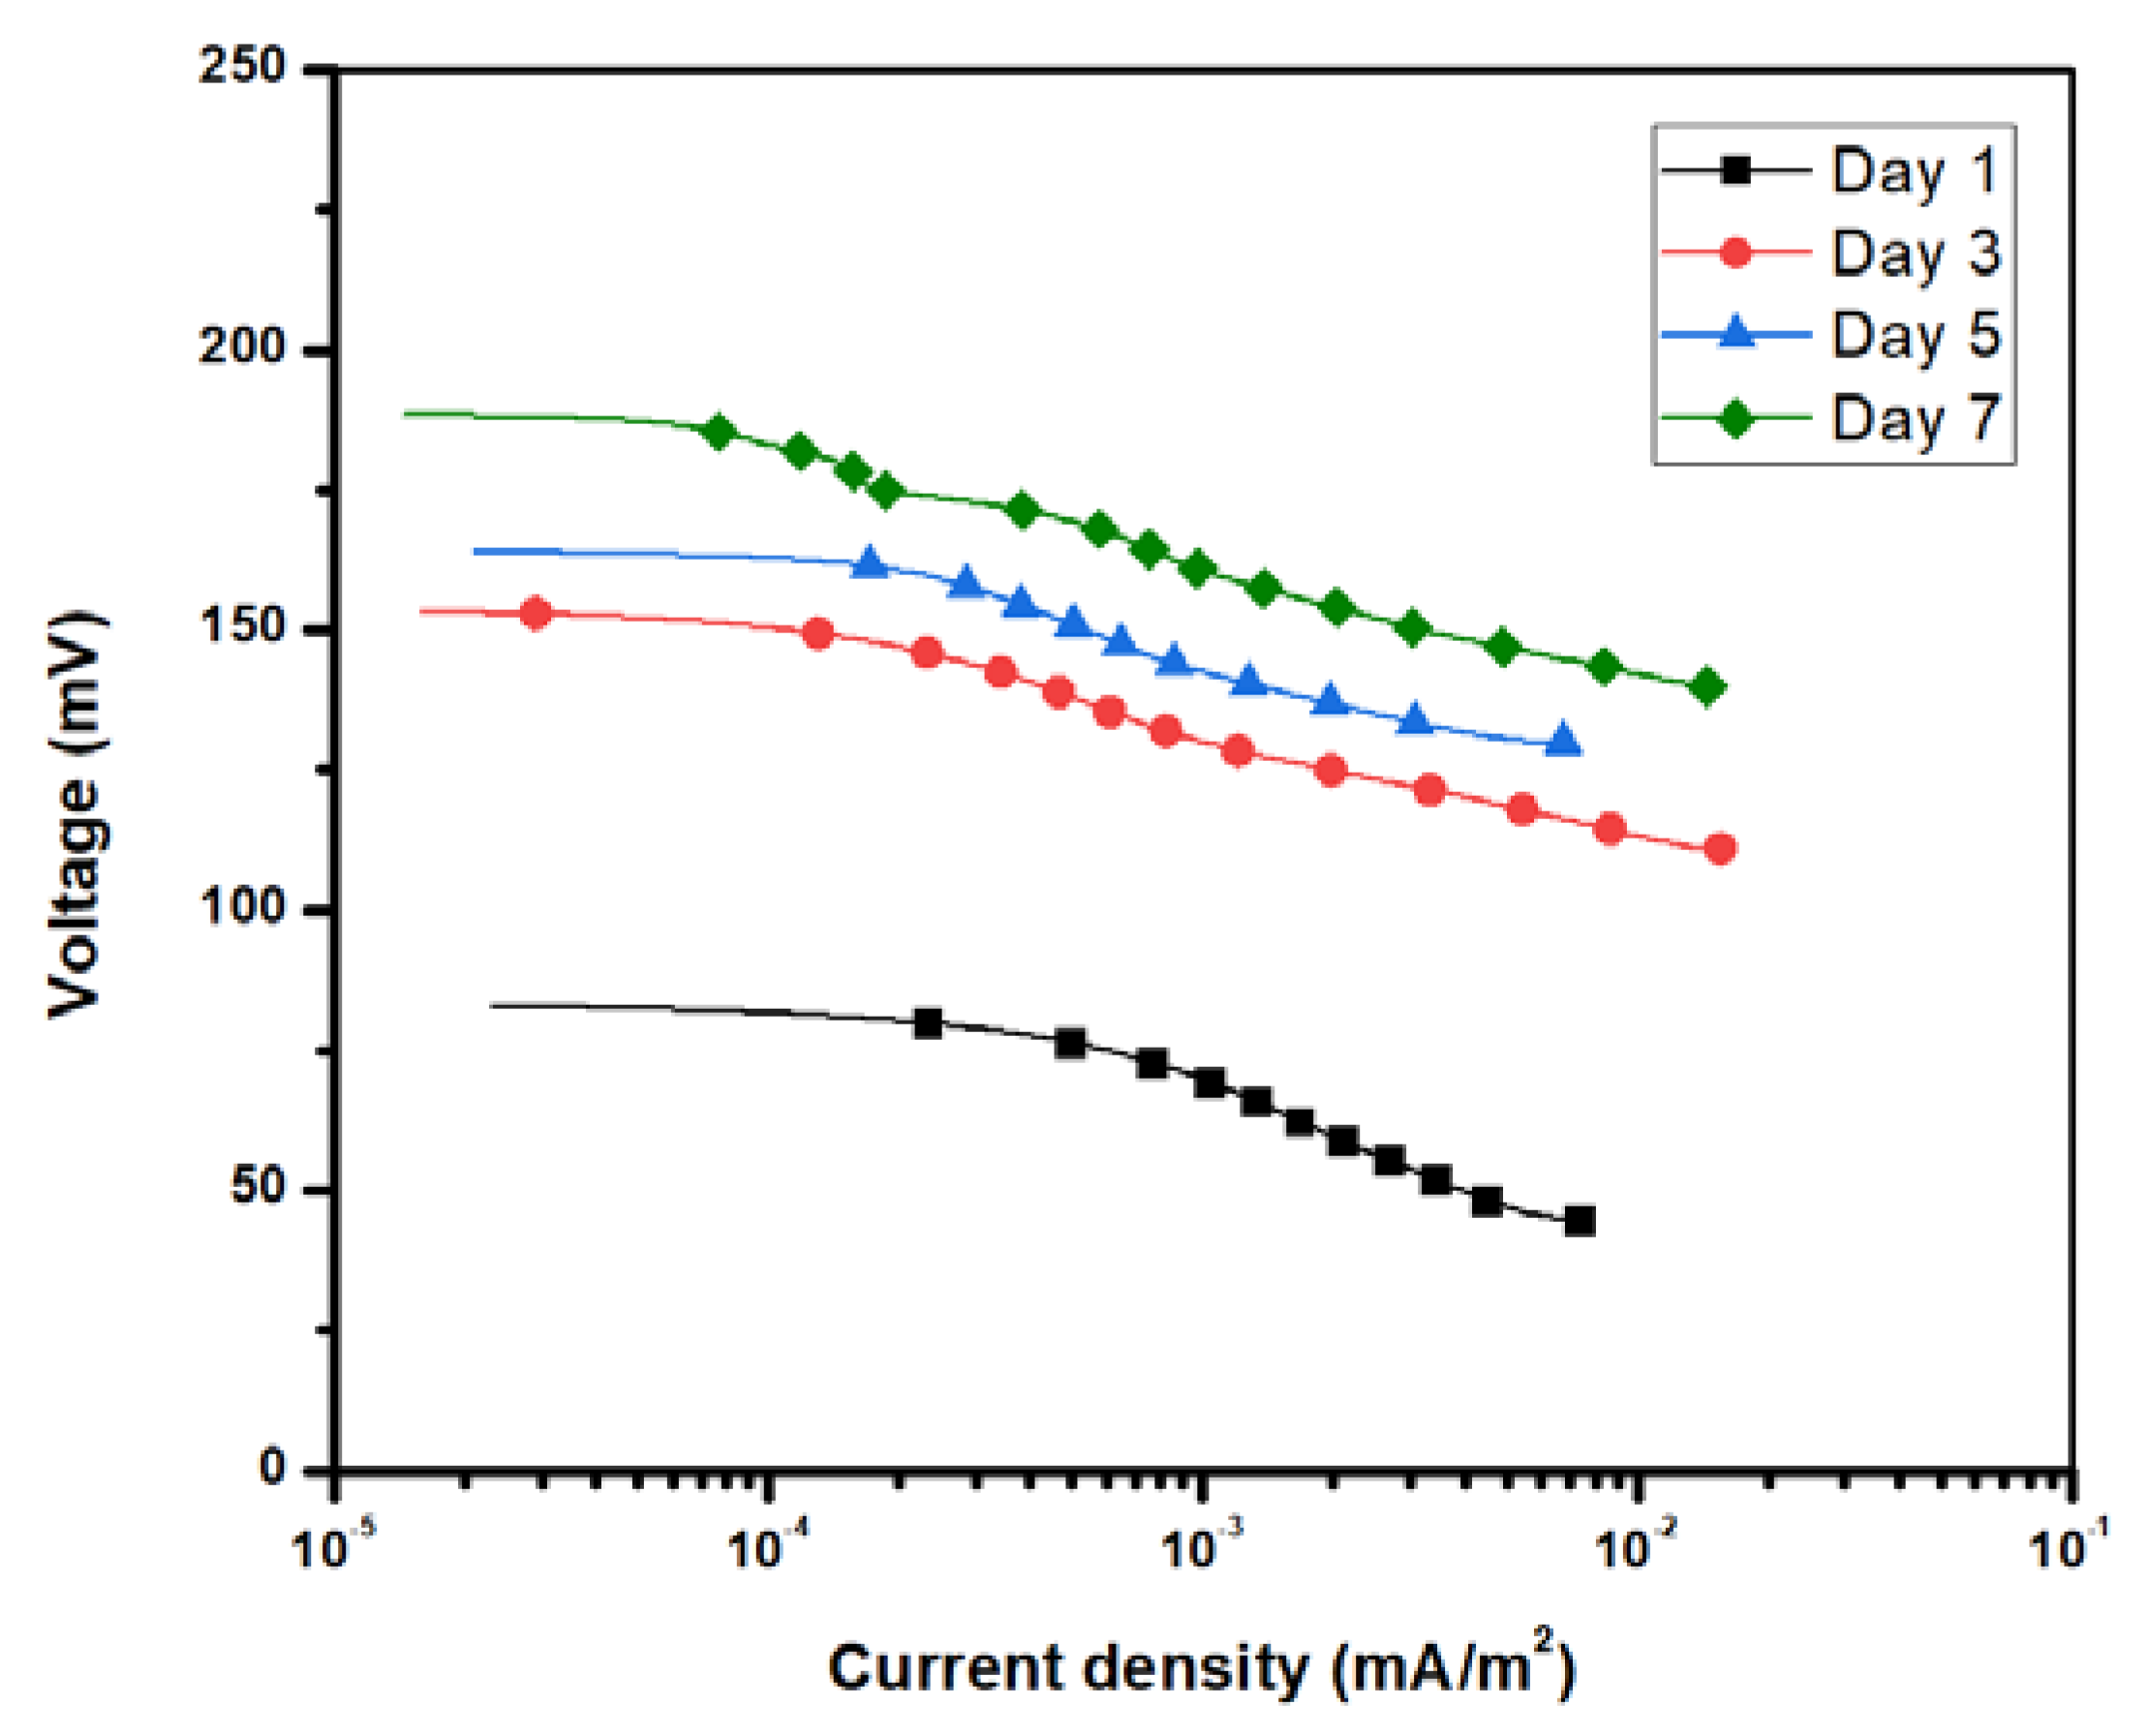
3.2. Potentiodynamic Polarization Analysis

From the polarization plot (Figure 3), there are three different regions, which consist of activation polarization, ohmic polarization, and concentration polarization. From these three regions, the performance of MFC can be evaluated. In the activation polarization region, i.e., at low current density, the drop of cell potential can be seen. This is due to the oxygen reduction reaction (ORR). In the middle current density region, which is also known as the ohmic polarization region, the drop of voltage occurred, but not in the same way as in the activation polarization region. Here, the voltage losses take place due to the ohmic resistance between the cathode and anode. The last region is at a high current density region, known as the concentration polarization region. Here, the voltage value is almost linear with the current density. This is due to the mass transport effects being dominant through the pore structure of the diffusion layers [28]. The volume of the anode was calculated as 24 cm3, thus the current density was obtained. Figure 3 shows the polarization curve of the MFC. The potentials, i.e., the value of the voltage of the MFC, are much lower on the starting day compared to the other days. Three zones are quite clear in this curve: from 0 to 0.1 (mA/cm2) is a zone where the activation losses are dominant [9]. The zone between 0.1 to 1.1 (mA/cm2) is identified as the ohmic region, and after 1.1 (mA/m2) is known as the concentration region. The activation overpotential difference could be attributed to the same flow rate of oxygen diluting in different volumes, contributing to low oxygen concentrations in the MFC [29].

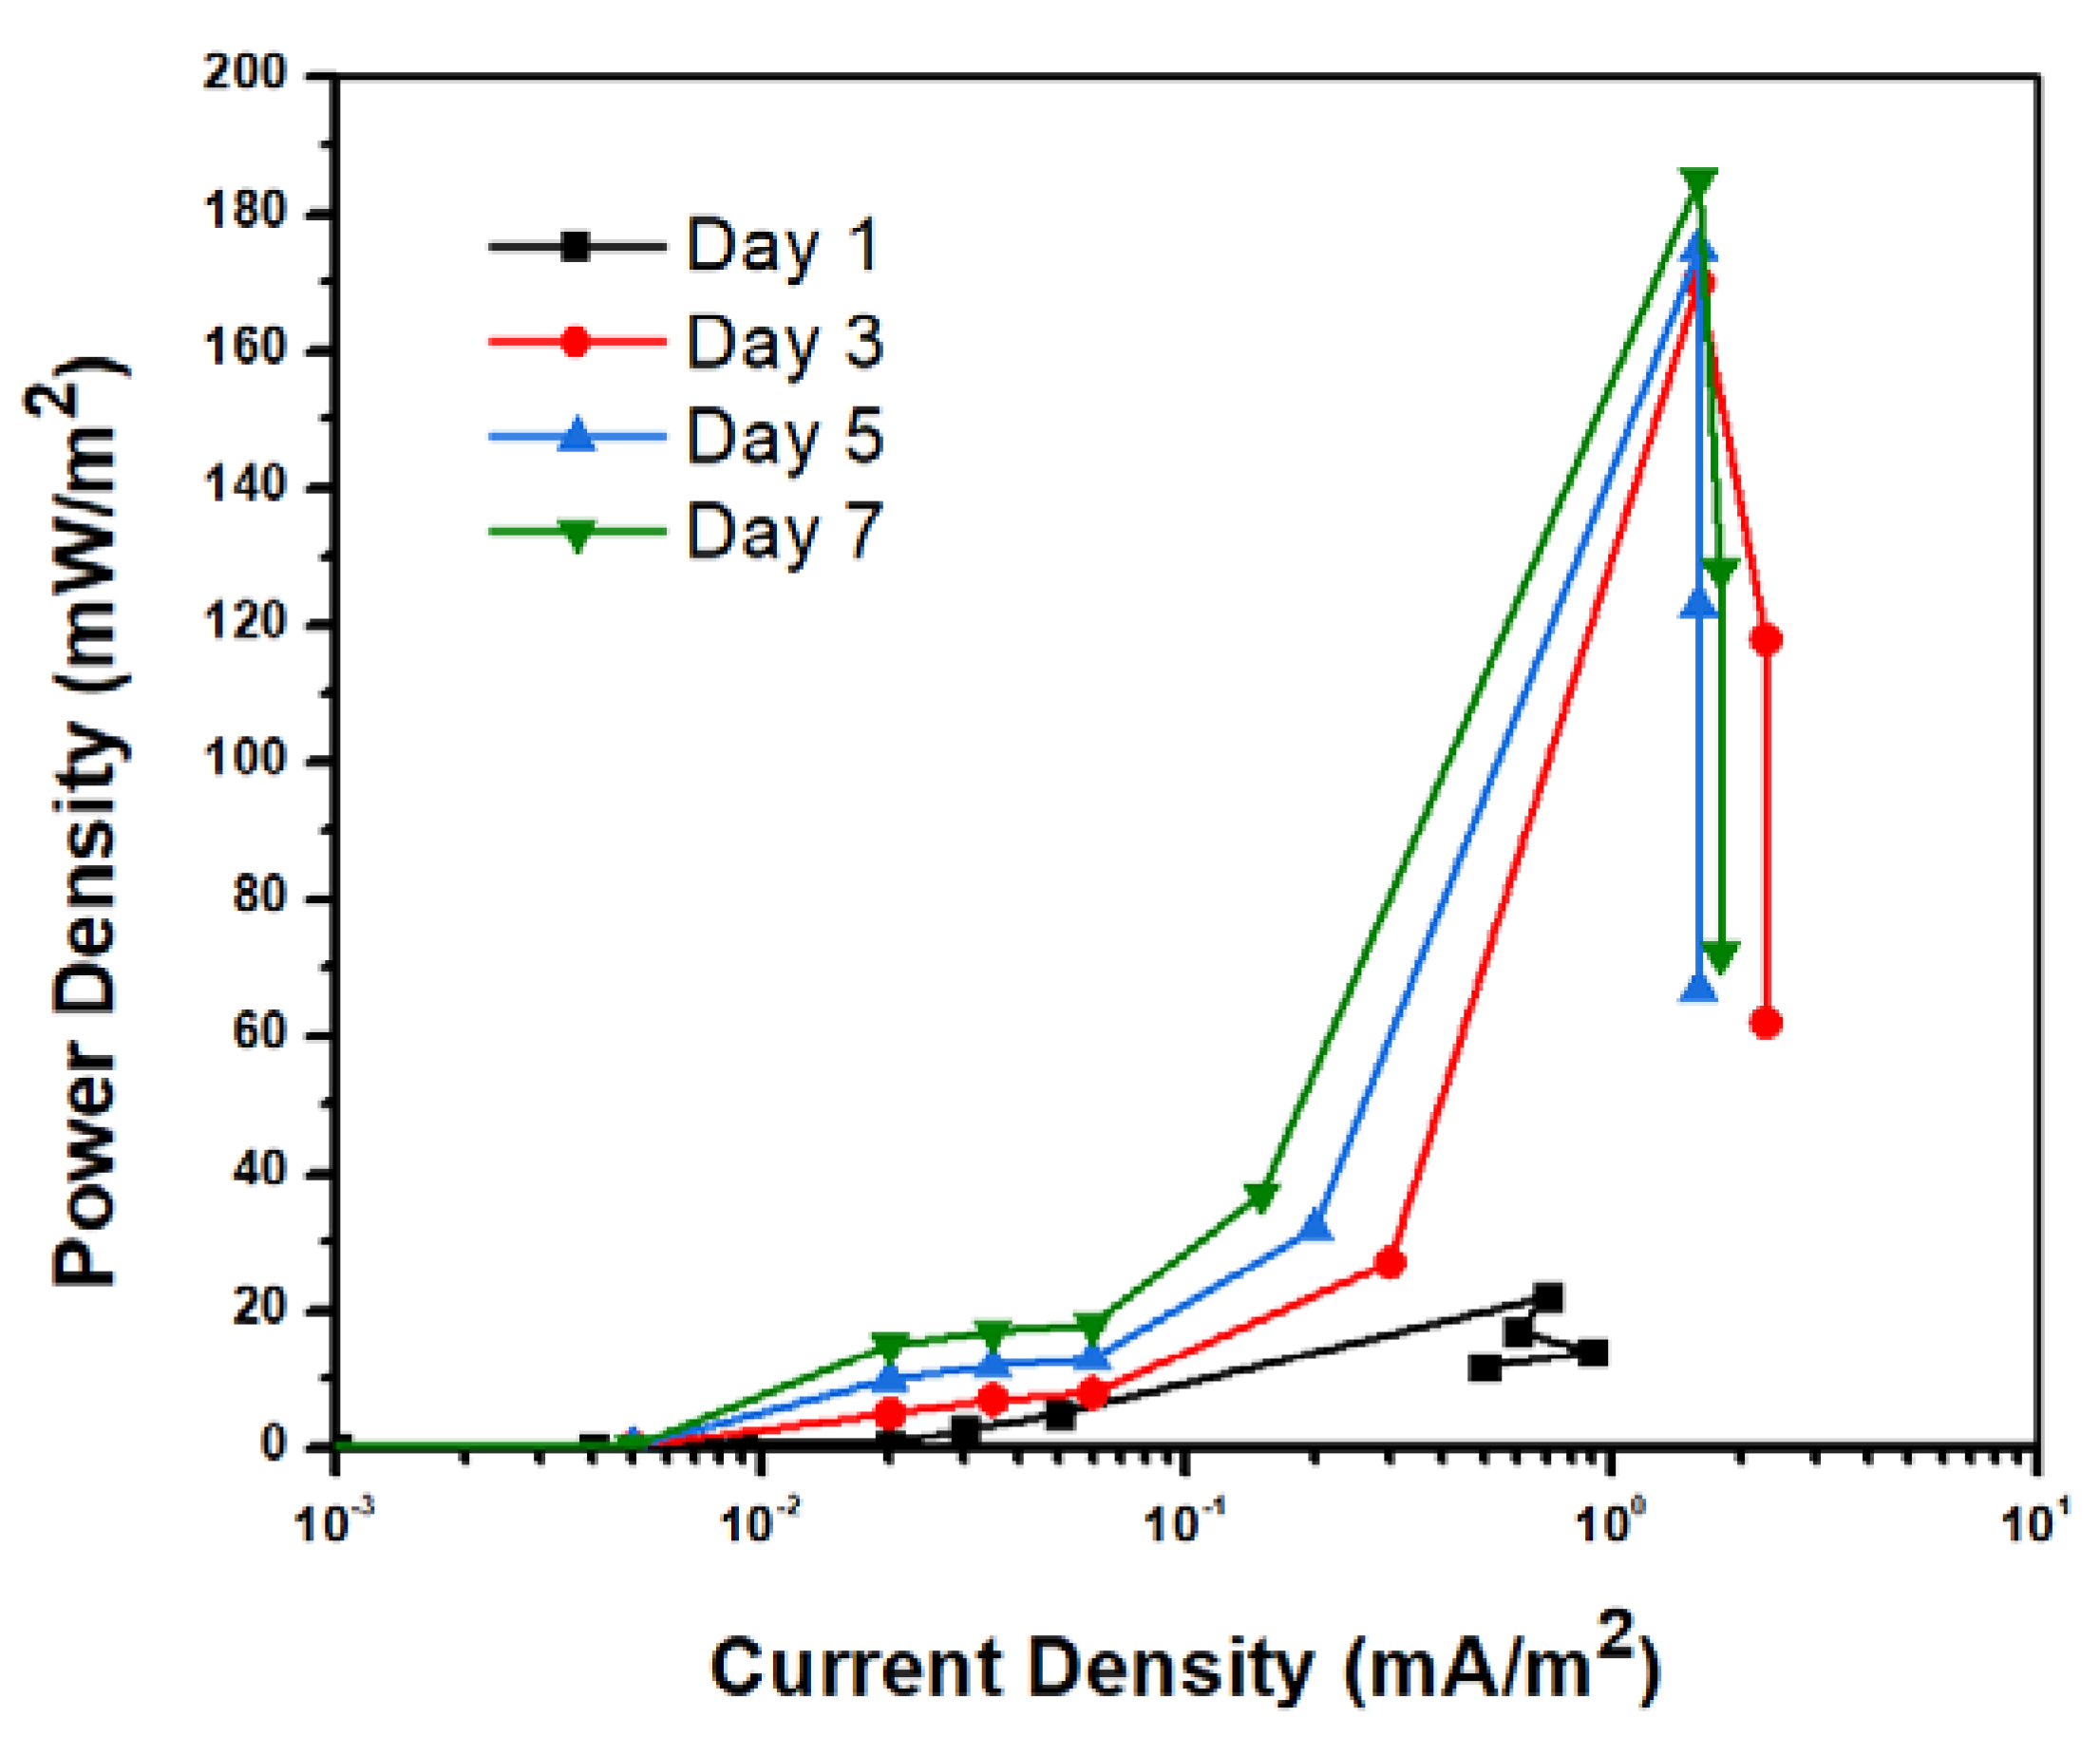
3.3. Power Density Analysis

A power curve of a MFC depicts the MFC’s ability to produce power under different loads. The power curve pattern is almost similar to that of the polarization curve. It shows the lowest power on day one, compared to consecutive days up to day seven. The MFC produced a maximum power of 170 mW/m2 when drawing a current density of 1.05 mA/m2 (Figure 4). In the curve, a sharp decrease of power density was seen at current densities higher than 0.6 mA/m2. This sharp decrease can be attributed to the ohmic loss [30]. This sharp decrease can be reduced by an electrode, catalyst, and mediator optimization, and thus optimization of the MFC is possible [31]. The PEM, carbon source, and microbial system have a wide effect on the power density produced by MFCs [32]. If the PEM is used as an ion conductor instead of a salt bridge, the MFC’s power density will be improved [22].

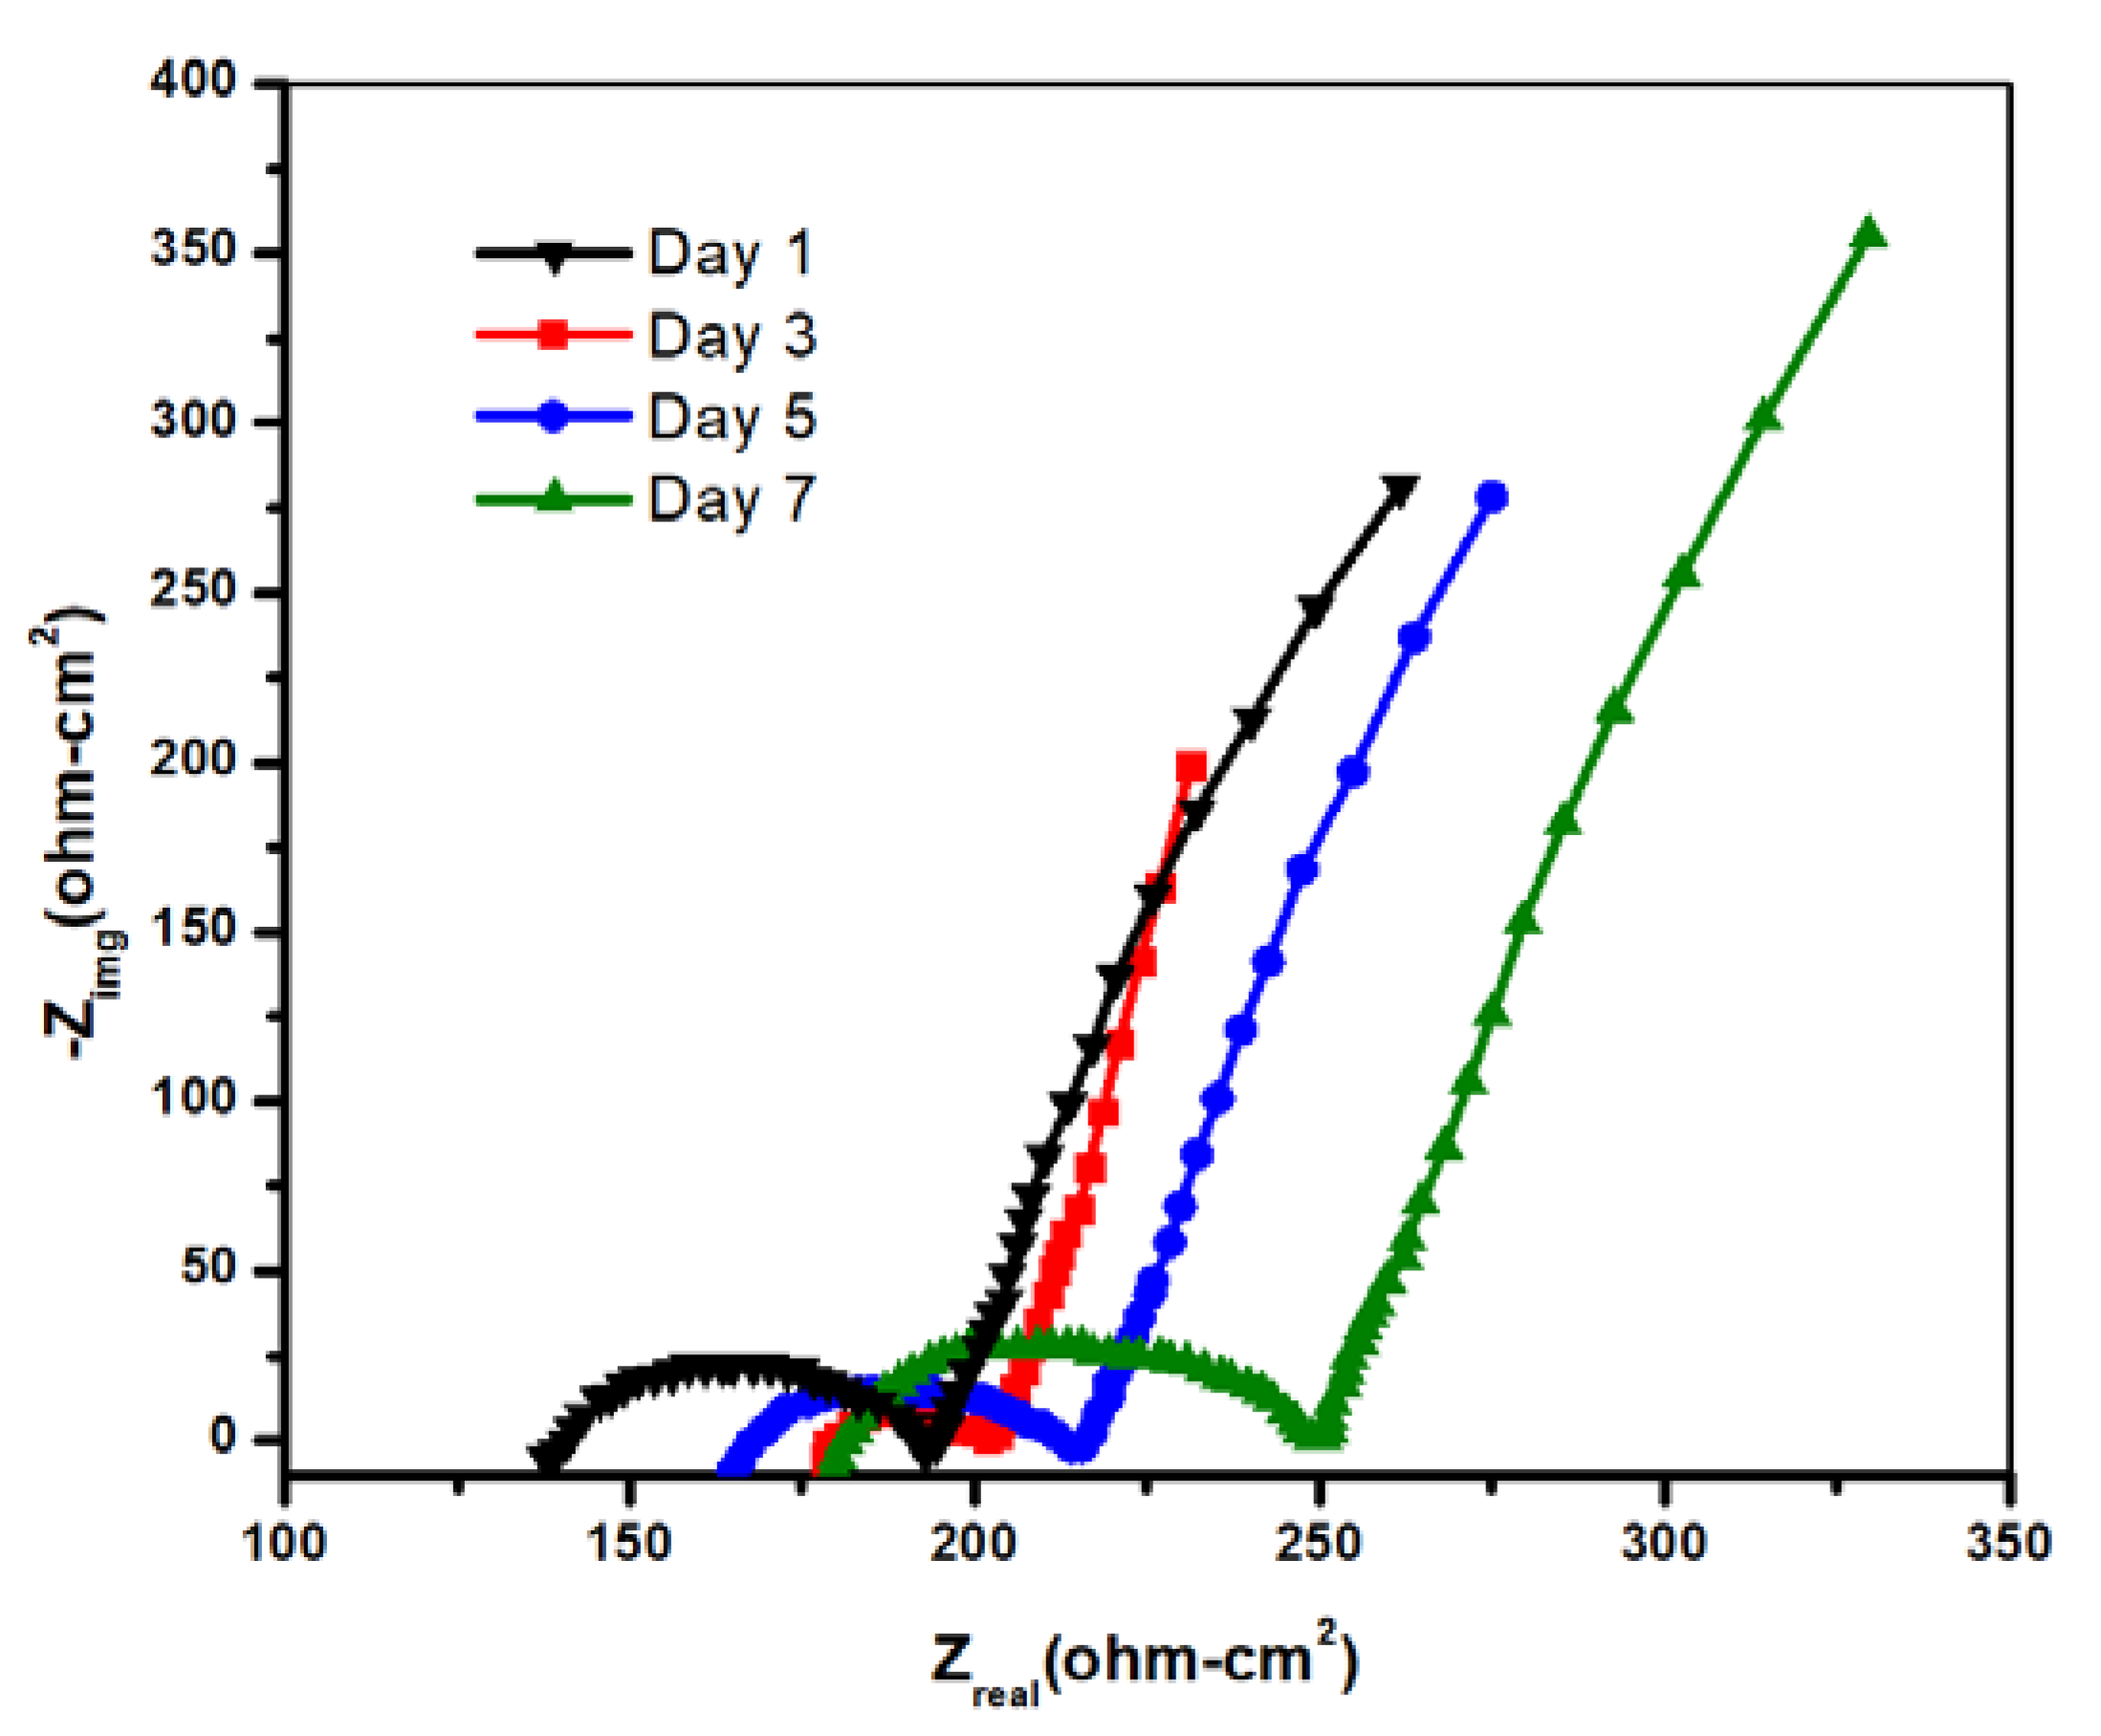
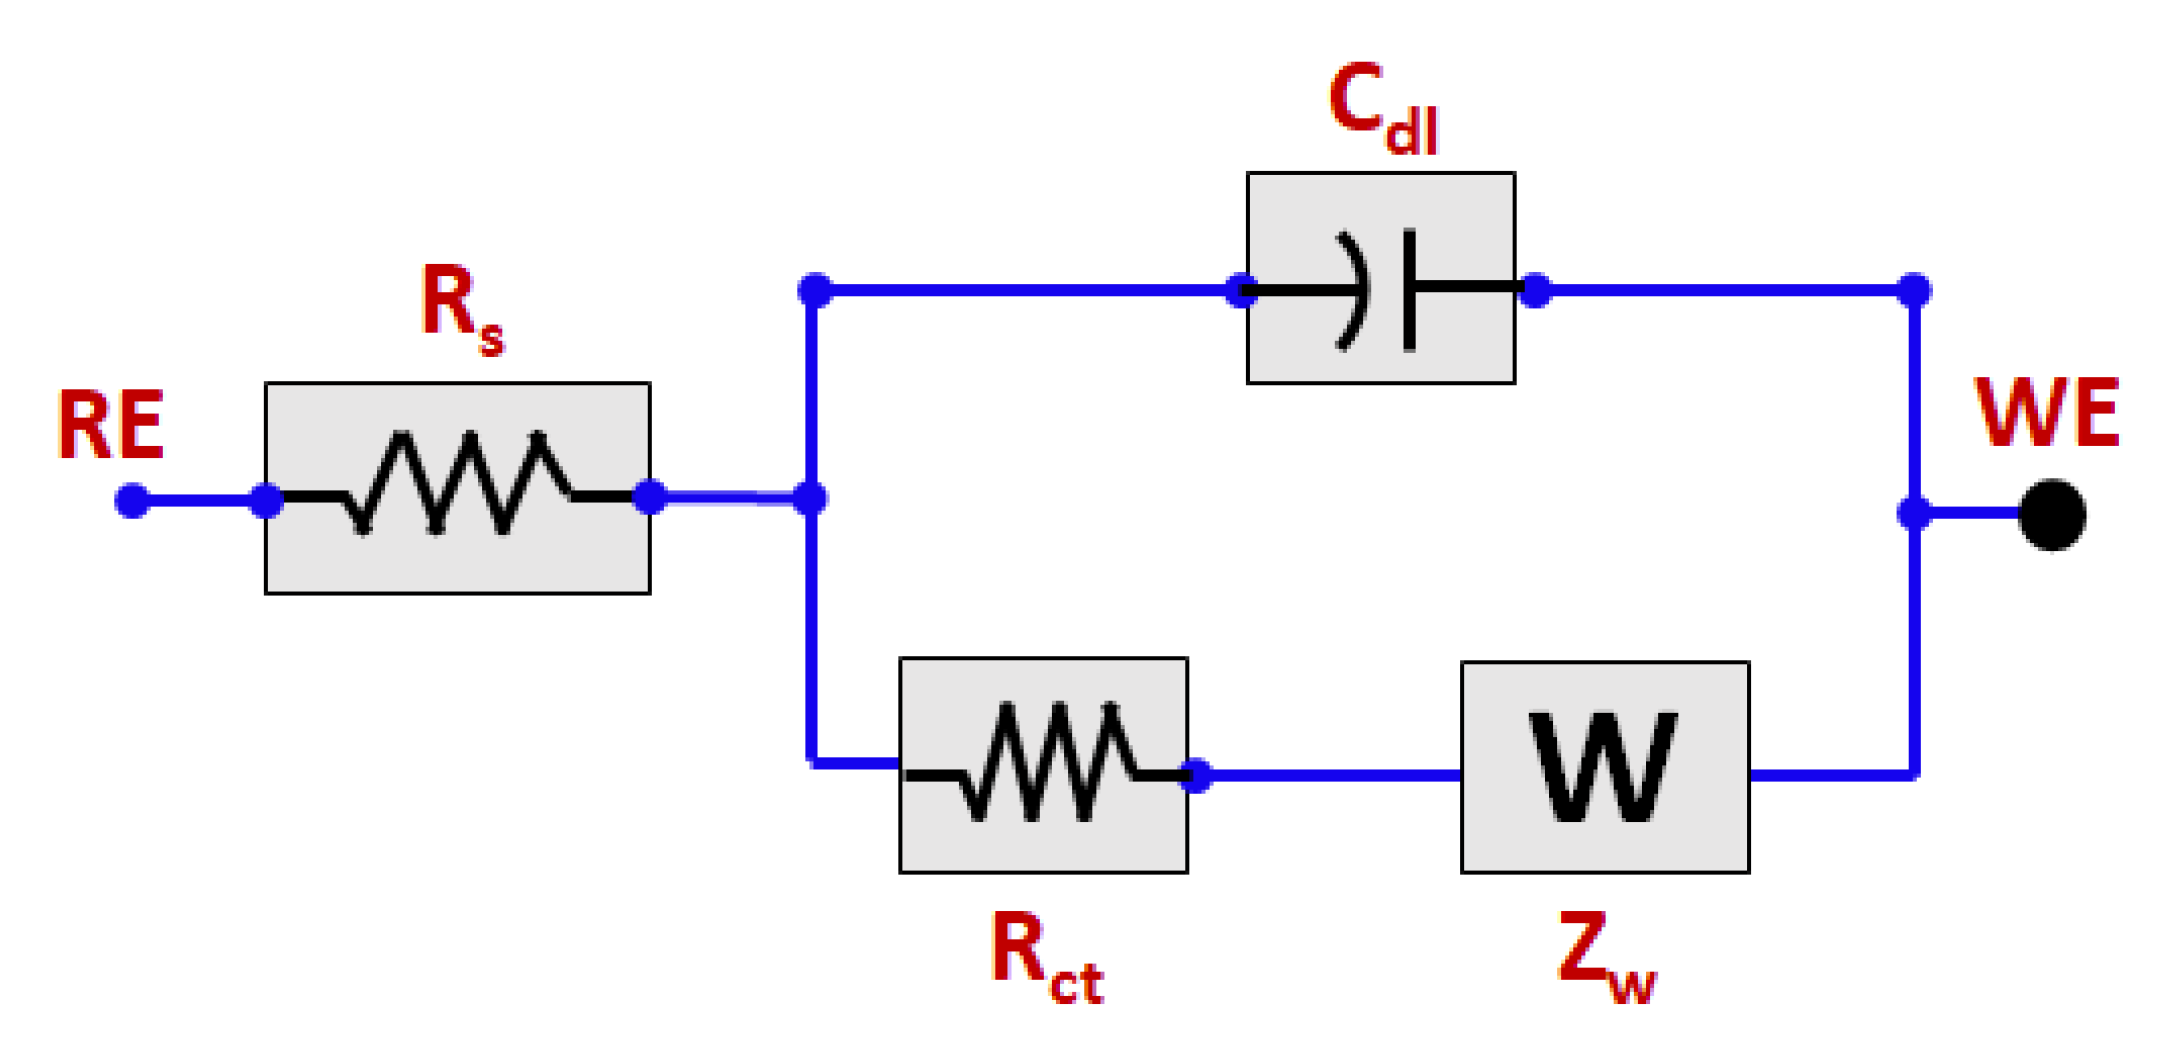
3.4. Electrochemical Impedance Spectroscopy Analysis

The EIS spectra, i.e., the Nyquist plot of the MFC is given in Figure 5. On the Zreal axis, the start of the curve or the plot indicates the Rs, and the Rint represents the curvature of the complex plot. The EIS data were obtained by fitting a proper model [33,34,35,36,37,38], and the equivalent circuit model is given in Figure 6. The equivalent circuit was confirmed with the Randles model. From the circuit, it can be assumed that the total resistance of the system was due to charge transfer and solution resistance, double-layer capacitance, and from the Warburg element. At the starting point, that is, after day one, the internal resistance may be slow, and increase sufficiently as the experiment continues. The buffer of the solution was the same throughout the seven-day process. However, the solution resistance was increased as the microbial biomass and metabolites were added to the solution, increasing ohmic resistance. The pattern of the curve from the starting day to day seven supports the above statement. The increase in Rint values indicates that stable biofilm forms and grows subsequently after day 1. The EIS data also depict the fact that the Rs value increases from day one to day seven from 140 to 180 Ω.
From Figure 5, it is quite clear that the pattern of the curve for all samples is almost the same. However, the starting position of the curves shifted to the right side as the time increased. The results are given in Table 1 also confirm the same. The value of Rs and Rint change as time progresses.

4. Conclusions

In this study, the MFC was developed using the culture of M. chroococcus, and the carbon source was utilized instead of methane. The performance of the MFC was evaluated using different electrochemical processes. Hence, it was found that the MFC delivered a maximum power output of 150 mW/m2, whereas the current density was 1.1 mA/m2. From this investigation, it is quite clear that the activation of methane can be possible at ambient temperatures. In fact, at ambient temperatures, it is possible to generate electricity from M. chroococcus, which acts as the only direct electron-transporting biocatalyst. It is expected that more optimization is possible if the salt bridge is replaced by a proton exchange membrane.

Author Contributions

Conceptualization, H.S.A. and A.H.S.; methodology, U.A.S.; software, M.A.A.; validation, A.A.A., S.A.R. and M.A.A.; formal analysis, A.H.S.; investigation, H.S.A.; resources, H.S.A.; data curation, A.A.A., S.A.R., U.A.S. and M.A.A.; writing—original draft preparation, H.S.A. and A.H.S.; writing—review and editing, H.S.A.; supervision, H.S.A. and A.H.S.; project administration, H.S.A. and A.H.S.; funding acquisition, A.H.S. All authors have read and agreed to the published version of the manuscript.

Funding

This research is funded by Researchers Supporting Project number (RSP-2021/373), King Saud University, Riyadh, Saudi Arabia.

Institutional Review Board Statement

Not applicable.

Informed Consent Statement

Not applicable.

Data Availability Statement

The data presented in this study are available within the manuscript.

Acknowledgments

The authors would like to acknowledge the Researchers Supporting Project number (RSP-2021/373), King Saud University, Riyadh, Saudi Arabia.

Conflicts of Interest

The authors declare no conflict of interest.

References

  1. Kåberger, T. Progress of renewable electricity replacing fossil fuels. Glob. Energy Interconnect. 2018, 1, 48–52. [Google Scholar]
  2. Abdo, H.S.; Seikh, A.H.; Fouly, A.; Hashmi, F.H. Controlling Atmospheric Corrosion of Weathering Steel Using Anodic Polarization Protection Technique. Processes 2021, 9, 1469. [Google Scholar] [CrossRef]
  3. Hanif, I.; Aziz, B.; Chaudhry, I.S. Carbon emissions across the spectrum of renewable and nonrenewable energy use in developing economies of Asia. Renew. Energy 2019, 143, 586–595. [Google Scholar] [CrossRef]
  4. Yaqoob, A.A.; Parveen, T.; Umar, K.; Ibrahim, M.N.M. Role of nanomaterials in the treatment of wastewater: A review. Water 2020, 12, 495. [Google Scholar] [CrossRef] [Green Version]
  5. Shahsavari, A.; Akbari, M. Potential of solar energy in developing countries for reducing energy-related emissions. Renew. Sustain. Energy Rev. 2018, 90, 275–291. [Google Scholar] [CrossRef]
  6. Asim, A.Y.; Mohamad, N.; Khalid, U.; Tabassum, P.; Akil, A.; Lokhat, D.; Siti, H. A glimpse into the microbial fuel cells for wastewater treatment with energy generation. Desalination Water Treat. 2021, 214, 379–389. [Google Scholar]
  7. Kannan, N.; Vakeesan, D. Solar energy for future world: A review. Renew. Sustain. Energy Rev. 2016, 62, 1092–1105. [Google Scholar] [CrossRef]
  8. Peighambardoust, S.J.; Rowshanzamir, S.; Amjadi, M. Review of the proton exchange membranes for fuel cell applications. Int. J. Hydrogen Energy 2010, 35, 9349–9384. [Google Scholar] [CrossRef]
  9. Logan, B.E.; Hamelers, B.; Rozendal, R.; Schröder, U.; Keller, J.; Freguia, S.; Aelterman, P.; Verstraete, W.; Rabaey, K. Microbial fuel cells: Methodology and technology. Environ. Sci. Technol. 2006, 40, 5181–5192. [Google Scholar] [CrossRef]
  10. Fadzli, F.S.; Rashid, M.; Yaqoob, A.A.; Ibrahim, M.N.M. Electricity generation and heavy metal remediation by utilizing yam (Dioscorea alata) waste in benthic microbial fuel cells (BMFCs). Biochem. Eng. J. 2021, 172, 108067. [Google Scholar] [CrossRef]
  11. Potter, M.C. Electrical effects accompanying the decomposition of organic compounds. Proc. R. Soc. London. Ser. B Contain. Pap. A Biol. Character 1911, 84, 260–276. [Google Scholar]
  12. Lewis, K. Symposium on bioelectrochemistry of microorganisms. IV. Biochemical fuel cells. Bacteriol. Rev. 1966, 30, 101–113. [Google Scholar] [CrossRef] [PubMed]
  13. Allen, R.M.; Bennetto, H.P. Microbial fuel-cells. Appl. Biochem. Biotechnol. 1993, 39-40, 27–40. [Google Scholar] [CrossRef]
  14. Kim, H.J.; Moon, S.H.; Byung, H.K. A microbial fuel cell type lactate biosensor using a metal-reducing bacterium, Shewanella putrefaciens. J. Microbiol. Biotechnol. 1999, 9, 365–367. [Google Scholar]
  15. Huang, L.; Regan, J.M.; Quan, X. Electron transfer mechanisms, new applications, and performance of biocathode microbial fuel cells. Bioresour. Technol. 2011, 102, 316–323. [Google Scholar] [CrossRef] [PubMed]
  16. Logan, B.E.; Murano, C.; Scott, K.; Gray, N.D.; Head, I.M. Electricity generation from cysteine in a microbial fuel cell. Water Res. 2005, 39, 942–952. [Google Scholar] [CrossRef]
  17. Chen, S.; Smith, A.L. Methane-driven microbial fuel cells recover energy and mitigate dissolved methane emissions from anaerobic effluents. Environ. Sci. Water Res. Technol. 2018, 4, 67–79. [Google Scholar] [CrossRef]
  18. McAnulty, M.J.; Poosarla, V.G.; Kim, K.-Y.; Jasso-Chavez, R.; Logan, B.E.; Wood, T.K. Electricity from methane by reversing methanogenesis. Nat. Commun. 2017, 8, 1–8. [Google Scholar] [CrossRef] [Green Version]
  19. Zahn, J.A.; DiSpirito, A.A. Membrane-associated methane monooxygenase from Methylococcus capsulatus (Bath). J. Bacteriol. 1996, 178, 1018–1029. [Google Scholar] [CrossRef] [PubMed] [Green Version]
  20. Pieja, A.J.; Morse, M.C.; Cal, A.J. Methane to bioproducts: The future of the bioeconomy? Curr. Opin. Chem. Biol. 2017, 41, 123–131. [Google Scholar] [CrossRef]
  21. Jang, J.K.; Pham, T.H.; Chang, I.S.; Kang, K.H.; Moon, H.; Cho, K.S.; Kim, B.H. Construction and operation of a novel mediator-and membrane-less microbial fuel cell. Process Biochem. 2004, 39, 1007–1012. [Google Scholar] [CrossRef]
  22. Min, B.; Cheng, S.; Logan, B.E. Electricity generation using membrane and salt bridge microbial fuel cells. Water Res. 2005, 39, 1675–1686. [Google Scholar] [CrossRef] [PubMed]
  23. Larsen, J.; Joergensen, L. Reduction of RNA and DNA in Methylococcus capsulatus by endogenous nucleases. Appl. Microbiol. Biotechnol. 1996, 45, 137–140. [Google Scholar] [CrossRef] [PubMed]
  24. Rasouli, Z.; Valverde-Pérez, B.; D’Este, M.; De Francisci, D.; Angelidaki, I. Nutrient recovery from industrial wastewater as single cell protein by a co-culture of green microalgae and methanotrophs. Biochem. Eng. J. 2018, 134, 129–135. [Google Scholar] [CrossRef]
  25. Brown, E.J.; Pignatello, J.J.; Martinson, M.; Crawford, R. Pentachlorophenol degradation: A pure bacterial culture and an epilithic microbial consortium. Appl. Environ. Microbiol. 1986, 52, 92–97. [Google Scholar] [CrossRef] [PubMed] [Green Version]
  26. Malki, M.; De Lacey, A.L.; Rodríguez, N.; Amils, R.; Fernandez, V.M. Preferential use of an anode as an electron acceptor by an acidophilic bacterium in the presence of oxygen. Appl. Environ. Microbiol. 2008, 74, 4472–4476. [Google Scholar] [CrossRef] [PubMed] [Green Version]
  27. Ramasamy, R.P.; Ren, Z.; Mench, M.M.; Regan, J.M. Impact of initial biofilm growth on the anode impedance of microbial fuel cells. Biotechnol. Bioeng. 2008, 101, 101–108. [Google Scholar] [CrossRef]
  28. Wu, J.; Yuan, X.Z.; Wang, H.; Blanco, M.; Martin, J.J.; Zhang, J. Diagnostic tools in PEM fuel cell research: Part I electrochemical techniques. Int. J. Hydrogen Energy 2008, 33, 1735–1746. [Google Scholar] [CrossRef]
  29. Rismani-Yazdi, H.; Carver, S.M.; Christy, A.D.; Tuovinen, O.H. Cathodic limitations in microbial fuel cells: An overview. J. Power Sources 2008, 180, 683–694. [Google Scholar] [CrossRef]
  30. Santoro, C.; Li, B.; Cristiani, P.; Squadrito, G. Power generation of microbial fuel cells (MFCs) with low cathodic platinum loading. Int. J. Hydrogen Energy 2013, 38, 692–700. [Google Scholar] [CrossRef]
  31. Ding, H.; Sun, H.; Sun, S.; Chen, C. Analysis and optimisation of a mixed fluid cascade (MFC) process. Cryogenics 2017, 83, 35–49. [Google Scholar] [CrossRef]
  32. Palanisamy, G.; Jung, H.-Y.; Sadhasivam, T.; Kurkuri, M.D.; Kim, S.C.; Roh, S.-H. A comprehensive review on microbial fuel cell technologies: Processes, utilization, and advanced developments in electrodes and membranes. J. Clean. Prod. 2019, 221, 598–621. [Google Scholar] [CrossRef]
  33. Abdo, H.S.; Seikh, A.H. Role of NaCl, CO2, and H2S on Electrochemical Behavior of 304 Austenitic Stainless Steel in Simulated Oil Industry Environment. Metals 2021, 11, 1347. [Google Scholar] [CrossRef]
  34. Abdo, H.S.; Seikh, A.H. Mechanical Properties and Microstructural Characterization of Laser Welded S32520 Duplex Stainless Steel. Materials 2021, 14, 5532. [Google Scholar] [CrossRef] [PubMed]
  35. Abdo, H.S.; Seikh, A.H.; Mohammed, J.A.; Uzzaman, T. Ameliorative Corrosion Resistance and Microstructure Characterization of 2205 Duplex Stainless Steel by Regulating the Parameters of Pulsed Nd:YAG Laser Beam Welding. Metals 2021, 11, 1206. [Google Scholar] [CrossRef]
  36. Abdo, H.S.; Seikh, A.H.; Mohammed, J.A.; Luqman, M.; Ragab, S.A.; Almotairy, S.M. Influence of Chloride Ions on Electrochemical Corrosion Behavior of Dual-Phase Steel over Conventional Rebar in Pore Solution. Appl. Sci. 2020, 10, 4568. [Google Scholar] [CrossRef]
  37. Abdo, H.S.; Sarkar, A.; Gupta, M.; Sahoo, S.; Mohammed, J.A.; Ragab, S.A.; Seikh, A.H. Low-Cost High-Performance SnO2–Cu Electrodes for Use in Direct Ethanol Fuel Cells. Crystals 2021, 11, 55. [Google Scholar] [CrossRef]
  38. Abdo, H.S.; Seikh, A.H.; Abdus Samad, U.; Fouly, A.; Mohammed, J.A. Electrochemical Corrosion Behavior of Laser Welded 2205 Duplex Stainless-Steel in Artificial Seawater Environment under Different Acidity and Alkalinity Conditions. Crystals 2021, 11, 1025. [Google Scholar] [CrossRef]
Figure 1. Schematic representation of the microbial fuel cell setup.
Crystals 11 01295 g001
Figure 2. (a) Open circuit voltage curve with time for M. chroococcus; (b) larger representation of the log phase.
Crystals 11 01295 g002
Figure 3. Potentiodynamic polarization curve (cathodic portion) of the MFC.
Crystals 11 01295 g003
Figure 4. Variation of power density with a current density of MFC.
Crystals 11 01295 g004
Figure 5. Nyquist plot of MFC anode.
Crystals 11 01295 g005
Figure 6. Equivalent circuit model for EIS fitting.
Crystals 11 01295 g006
Table 1. EIS data of MFC.
Time (Days)1st Day3rd Day5th Day7th Day
ValueErrorValueErrorValueErrorValueError
Cdl (µF)2.60 × 10−540.582.78 × 10−514.283.84 × 10−516.602.79 × 10−517.67
Rs (ohm)140.3024.78159.8012.29172.3530.28180.2914.09
Rint (ohm)12.66116.5446.2830.4458.2811.2860.249.24
Zw (ohm)8.58112.2810.25114.5412.2819.2014.488.96
Publisher’s Note: MDPI stays neutral with regard to jurisdictional claims in published maps and institutional affiliations.

