Article

Phase Relations of Ni2In-Type and CaC2-Type Structures Relative to Fe2P-Type Structure of Titania at High Pressure: A Comparative Study

by
Khaldoun Tarawneh
* and
Yahya Al-Khatatbeh
Department of Basic Sciences, Princess Sumaya University for Technology, Amman 11941, Jordan
*
Author to whom correspondence should be addressed.
Submission received: 27 November 2022 / Revised: 17 December 2022 / Accepted: 18 December 2022 / Published: 21 December 2022
(This article belongs to the Special Issue Pressure-Induced Phase Transformations (Volume II))

Abstract

:
Density functional theory (DFT) based on first-principles calculations was used to study the high-pressure phase stability of various phases of titanium dioxide (TiO2) at extreme pressures. We explored the phase relations among the following phases: the experimentally identified nine-fold hexagonal Fe2P-type phase, the previously predicted ten-fold tetragonal CaC2-type phase of TiO2, and the recently proposed eleven-fold hexagonal Ni2In-type phase of the similar dioxides zirconia (ZrO2) and hafnia (HfO2). Our calculations, using the generalized gradient approximation (GGA), predicted the Fe2P → Ni2In transition to occur at 564 GPa and Fe2P → CaC2 at 664 GPa. These transitions were deeply investigated with reference to the volume reduction, coordination number decrease, and band gap narrowing to better determine the favorable post-Fe2P phase. Furthermore, it was found that both transitions are mostly driven by the volume reduction across transitions in comparison with the small contribution of the electronic energy gain. Additionally, our computed Birch–Murnaghan equation of state for the three phases reveals that CaC2 is the densest phase, while Ni2In is the most compressible phase.

1. Introduction

The nature of bonding in titania (TiO2) has attracted great interest over the last few decades due to its interesting industrial applications such as photocatalysts, energy generation and storage, environmental protection, and many more [1,2]. One of the important and promising research directions in studying this dioxide is investigating the high-pressure behavior of TiO2 polymorphs, both experimentally and theoretically, due to their interesting properties [3,4,5,6,7,8,9,10,11,12,13,14,15,16,17,18,19,20,21,22,23,24,25,26,27,28,29,30,31,32,33,34,35,36,37,38,39]. However, much attention, using measurements and calculations, has been given to exploring the high-pressure phase stability of TiO2 phases and the transition pressures between different phases and their equation of state parameters as well as to searching for new possible phases (e.g., [3,8,11,15,18,19,21,22,29,31,32,33,37]). Over the past decades, density functional theory has become the workhorse theory for the identification of the pressure-driven phase transitions [40,41].
As mentioned above, titania can be found in many structural forms with increasing pressure. In this regard, the well-known transition sequence that is experimentally observed and theoretically predicted is as follows: Orthorhombic OI → orthorhombic cotunnite OII → Fe2P-type [3,15,29,31]. Thus, the hexagonal Fe2P-type structure (Figure 1a) is the highest-pressure phase experimentally observed for TiO2 which has been found to be stable at (210 GPa, 4000 K) using diamond-anvil experiments [31]. Recently, the tetragonal CaC2-type structure (Figure 1c) has been theoretically predicted as a post-Fe2P phase of titanium dioxide at pressures beyond 647–689 GPa [33,36]. Additionally, recent density functional theory (DFT) calculations have predicted the hexagonal Ni2In-type structure (Figure 1b) to be the post-Fe2P phase in the similar dioxides ZrO2 and HfO2 at pressures that exceed 300 GPa [42,43,44].
However, it is important to note that the three dioxides (TiO2, ZrO2, and HfO2) share obvious similarities, especially in their high-pressure behavior (e.g., see Ref. [26] and references therein). In this regard, the overlapping high-pressure phase transition sequence, experimentally observed and theoretically confirmed in the three dioxides is as follows: Monoclinic baddeleyite MI → OI → OII → Fe2P [3,15,26,29,31,46,47,48,49,50].
The obvious and close similarities of the high-pressure behavior of titania, zirconia, and hafnia have motivated us to test the stability of Fe2P-TiO2 with respect to CaC2 and Ni2In phases. In detail, until recently, the theoretical work performed on TiO2 predicted the Fe2P → CaC2 transition [33,36], while the Fe2P → Ni2In transition was predicted in ZrO2 and HfO2 [42,43,44]. Therefore, to better understand the upper part of the phase transition sequence in TiO2, we have performed DFT calculations to investigate the phase relations among Fe2P, CaC2, and Ni2In phases at megabar pressures. Consequently, the long-range target of this study is to draw the similarities and differences between TiO2 and other similar transition-metal dioxides in terms of predicting the ultrahigh-pressure phase transition sequence, which will hopefully lead to a better understanding of the high-pressure behavior of such dioxides.

2. Computational Details

In order to investigate the phase stability and the equations of state (EOSs) of all tested phases of TiO2, we used static first-principles computations performed within the framework of density functional theory (DFT) [51]. The projector-augmented wave (PAW) formalism [52,53] was used to treat the interactions between the titanium (Ti) and oxygen (O) atoms with the valence configuration of 3s23p63d24s2 for Ti and 2s22p4 for O. Following previous theoretical high-pressure studies carried out on TiO2 and similar dioxides [29,43,44,46,47,48], the electronic exchange and correlation effects were treated within the GGA [54]. We performed our calculations using the Quantum ESPRESSO package [55] with an energy cutoff of 80 Ry and Γ-centered k-point meshes [56]. Our calculations yielded sufficient convergence to better than 10−5 Ry in the total energies for both phases, and pressures were converged to better than 0.1 GPa. The Brillouin zone integration was performed using the following k-point meshes for the ZrO2 phases: 8 × 8 × 12 for Fe2P, 12 × 12 × 8 for CaC2, and 20 × 20 × 16 for Ni2In. For a fixed volume, all internal degrees of freedom and unit-cell parameters of the structure were optimized simultaneously during the geometry optimizations. The ground-state energy for each phase was determined for 13–16 volumes, and the EOS parameters for each phase were obtained by fitting the total energy as a function of volume to a second-order Birch–Murnaghan equation of state (BM-EOS) [57] (Table 1). Phonon dispersion calculations have not been performed and will be the scope of future studies.

3. Results and Discussion

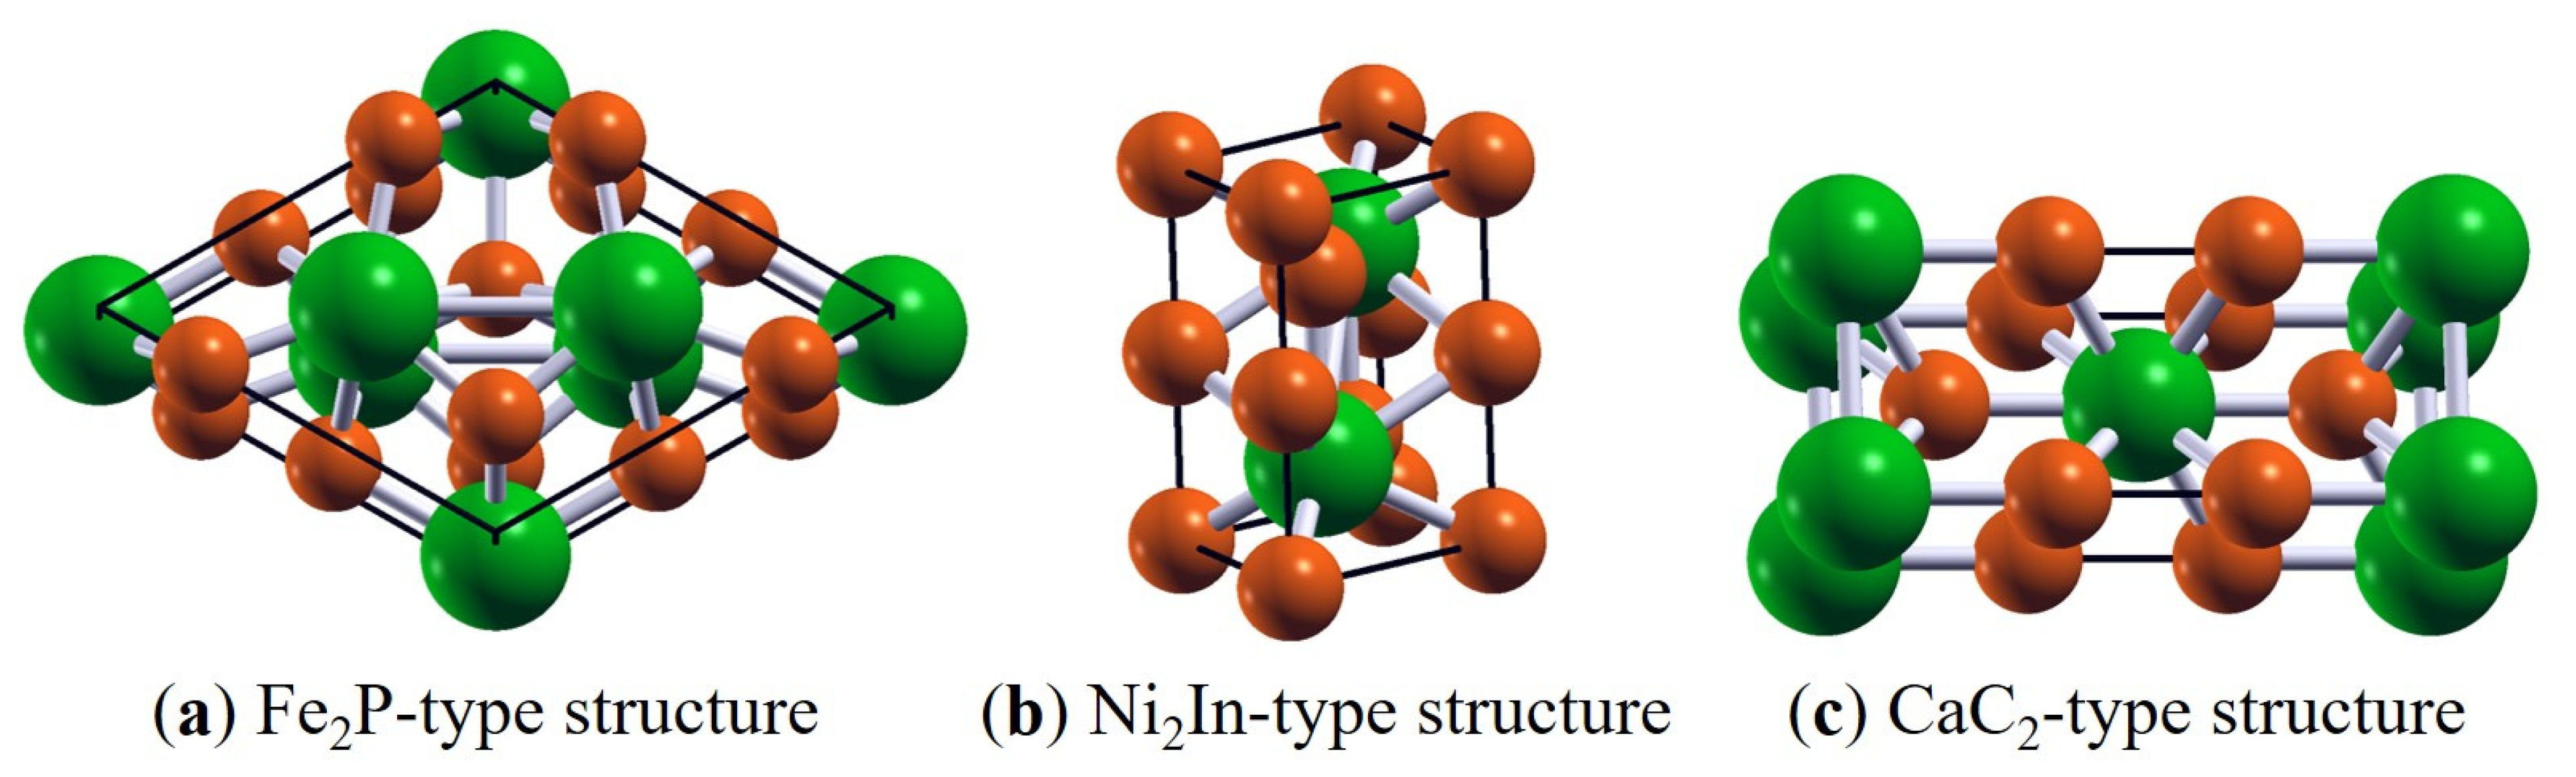
3.1. Phase Stability and Equation of State

We computed our EOS parameters for each phase by fitting the energy-volume (E-V) data to the following second-order BM-EOS [57] for which the first pressure derivative of the bulk modulus at zero pressure (K0’) was fixed to 4 and the zero-pressure volume (V0) and the zero-pressure bulk modulus (K0) were used as fitting parameters. The determination of the EOS for the three phases allowed us to investigate their compressibilities and phase stability at high pressure as well as the volume change across different transitions.
The EOS parameters for all phases are summarized in Table 1 along with results from previous calculations [31,32]. We note that our calculated EOS for the Fe2P phase agrees well with previous studies [31,32]. On the other hand, the EOS of either Ni2In or CaC2 has not been previously obtained. In this regard, we should emphasize that the Ni2In-type structure has not been tested for TiO2, while CaC2 has been proposed for TiO2 [33,36]. Therefore, to our knowledge, we provide the EOS of the Ni2In and CaC2 phases of TiO2 for the first time (Table 1). When comparing the EOS for the three phases, we notice that Fe2P has the highest bulk modulus and thus is the most incompressible phase, followed by CaC2 and finally Ni2In that exhibits the most compressibility among all tested phases. In detail, a small bulk modus decrease (~7%) is predicted across Fe2P → CaC2, while we note an obviously large decrease (~39%) across Fe2P → Ni2In (Table 1). Furthermore, the density of CaC2 at zero pressure is higher than that of Fe2P, as expected, which is not the case for Ni2In where the density is less than that of Fe2P by ~9% (Figure 2). We should note that such predicted large changes in K0 and V0 across Fe2P → Ni2In are likely to be unexpected across transitions to higher-pressure phases, whereas the corresponding changes across Fe2P → CaC2 are much more reasonable.
To obtain the transition pressures, we calculated the enthalpy change relative to the Fe2P phase (Figure 3). First, we note that the transition from Ni2In to CaC2 or vice versa is not possible at ultrahigh pressures as their enthalpy curves are unlikely to intersect. Furthermore, although the enthalpy curves of the two phases seem to cross at lower pressures, this transition is not expected to occur within the stability field of the Fe2P phase. Our enthalpy calculations indicate that the transition pressure across the Fe2P → Ni2In transition is 564 GPa. On the other hand, our calculated transition pressure across the Fe2P → CaC2 transition is 664 GPa, in agreement with previous findings (Table 2) [33,36]. We should note that although the Ni2In phase has a lower enthalpy than the CaC2 phase, this does not necessarily mean that Fe2P → Ni2In is the favorable transition when compared to the Fe2P → CaC2 transition. Consequently, there are two possible scenarios for the transition from the Fe2P phase, and thus one must be eliminated from the transition sequence of TiO2. Therefore, in the next sections, we further explore the two transitions to predict the favored post-Fe2P phase of TiO2.

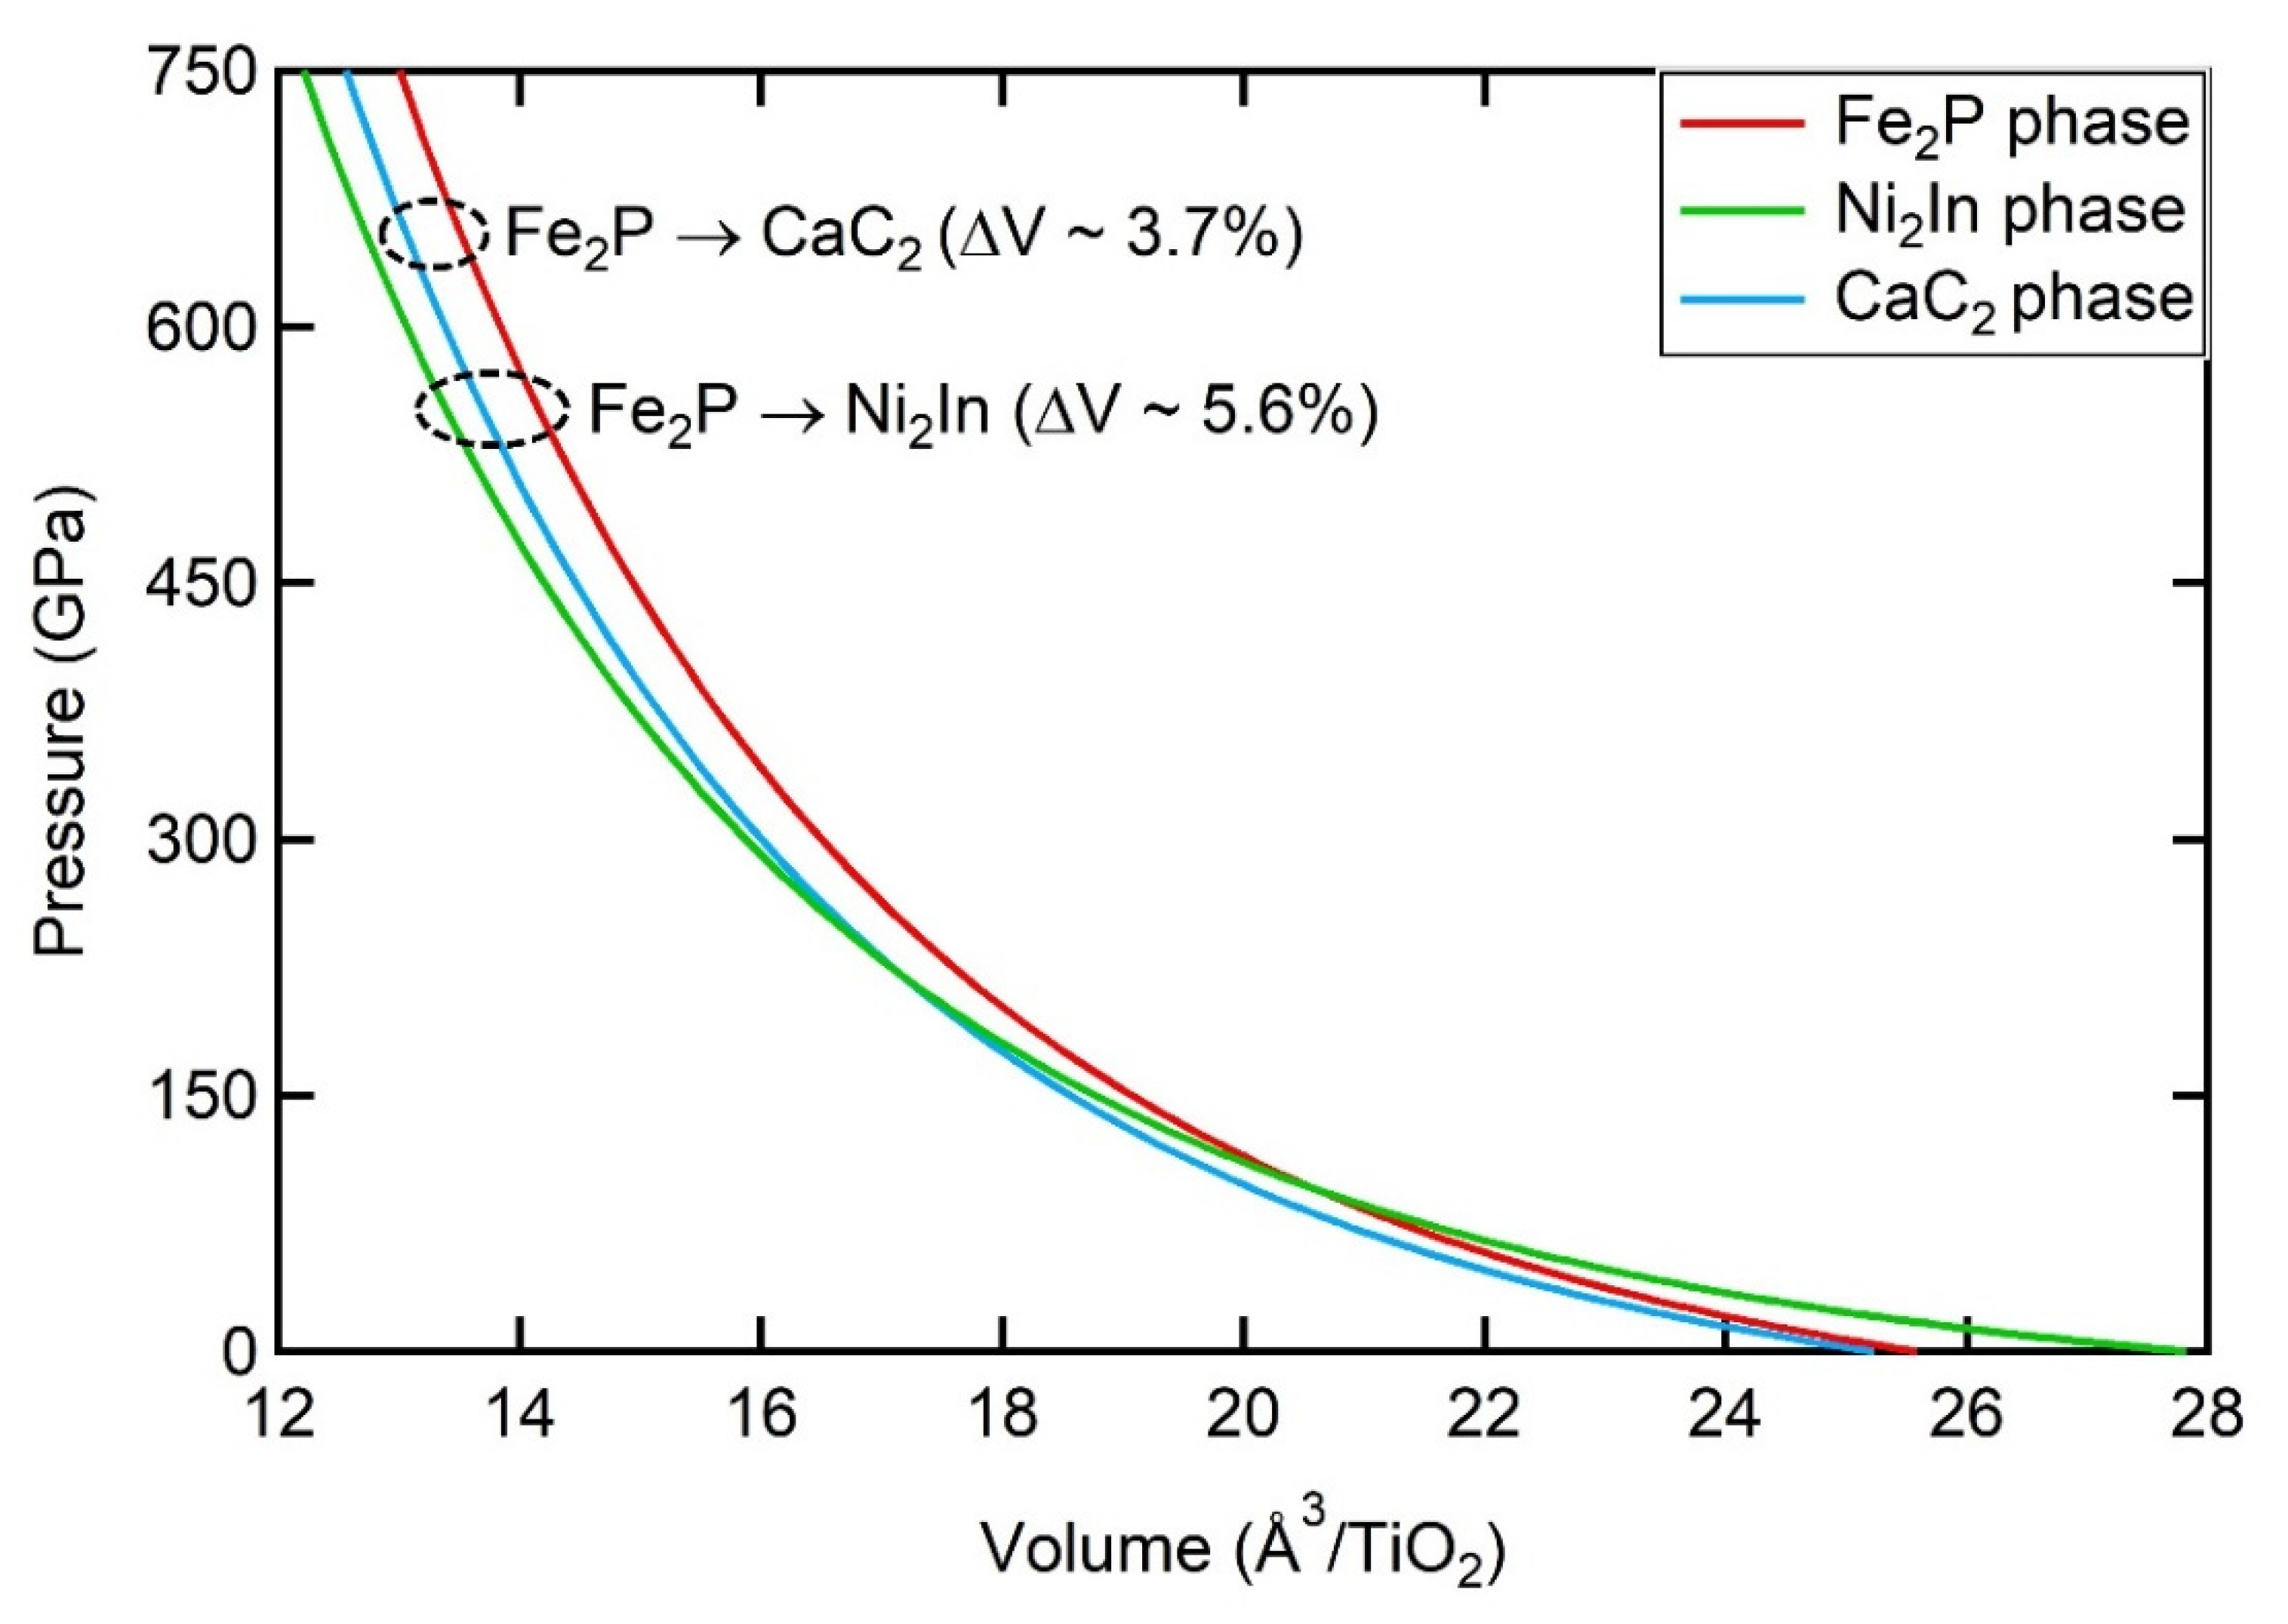
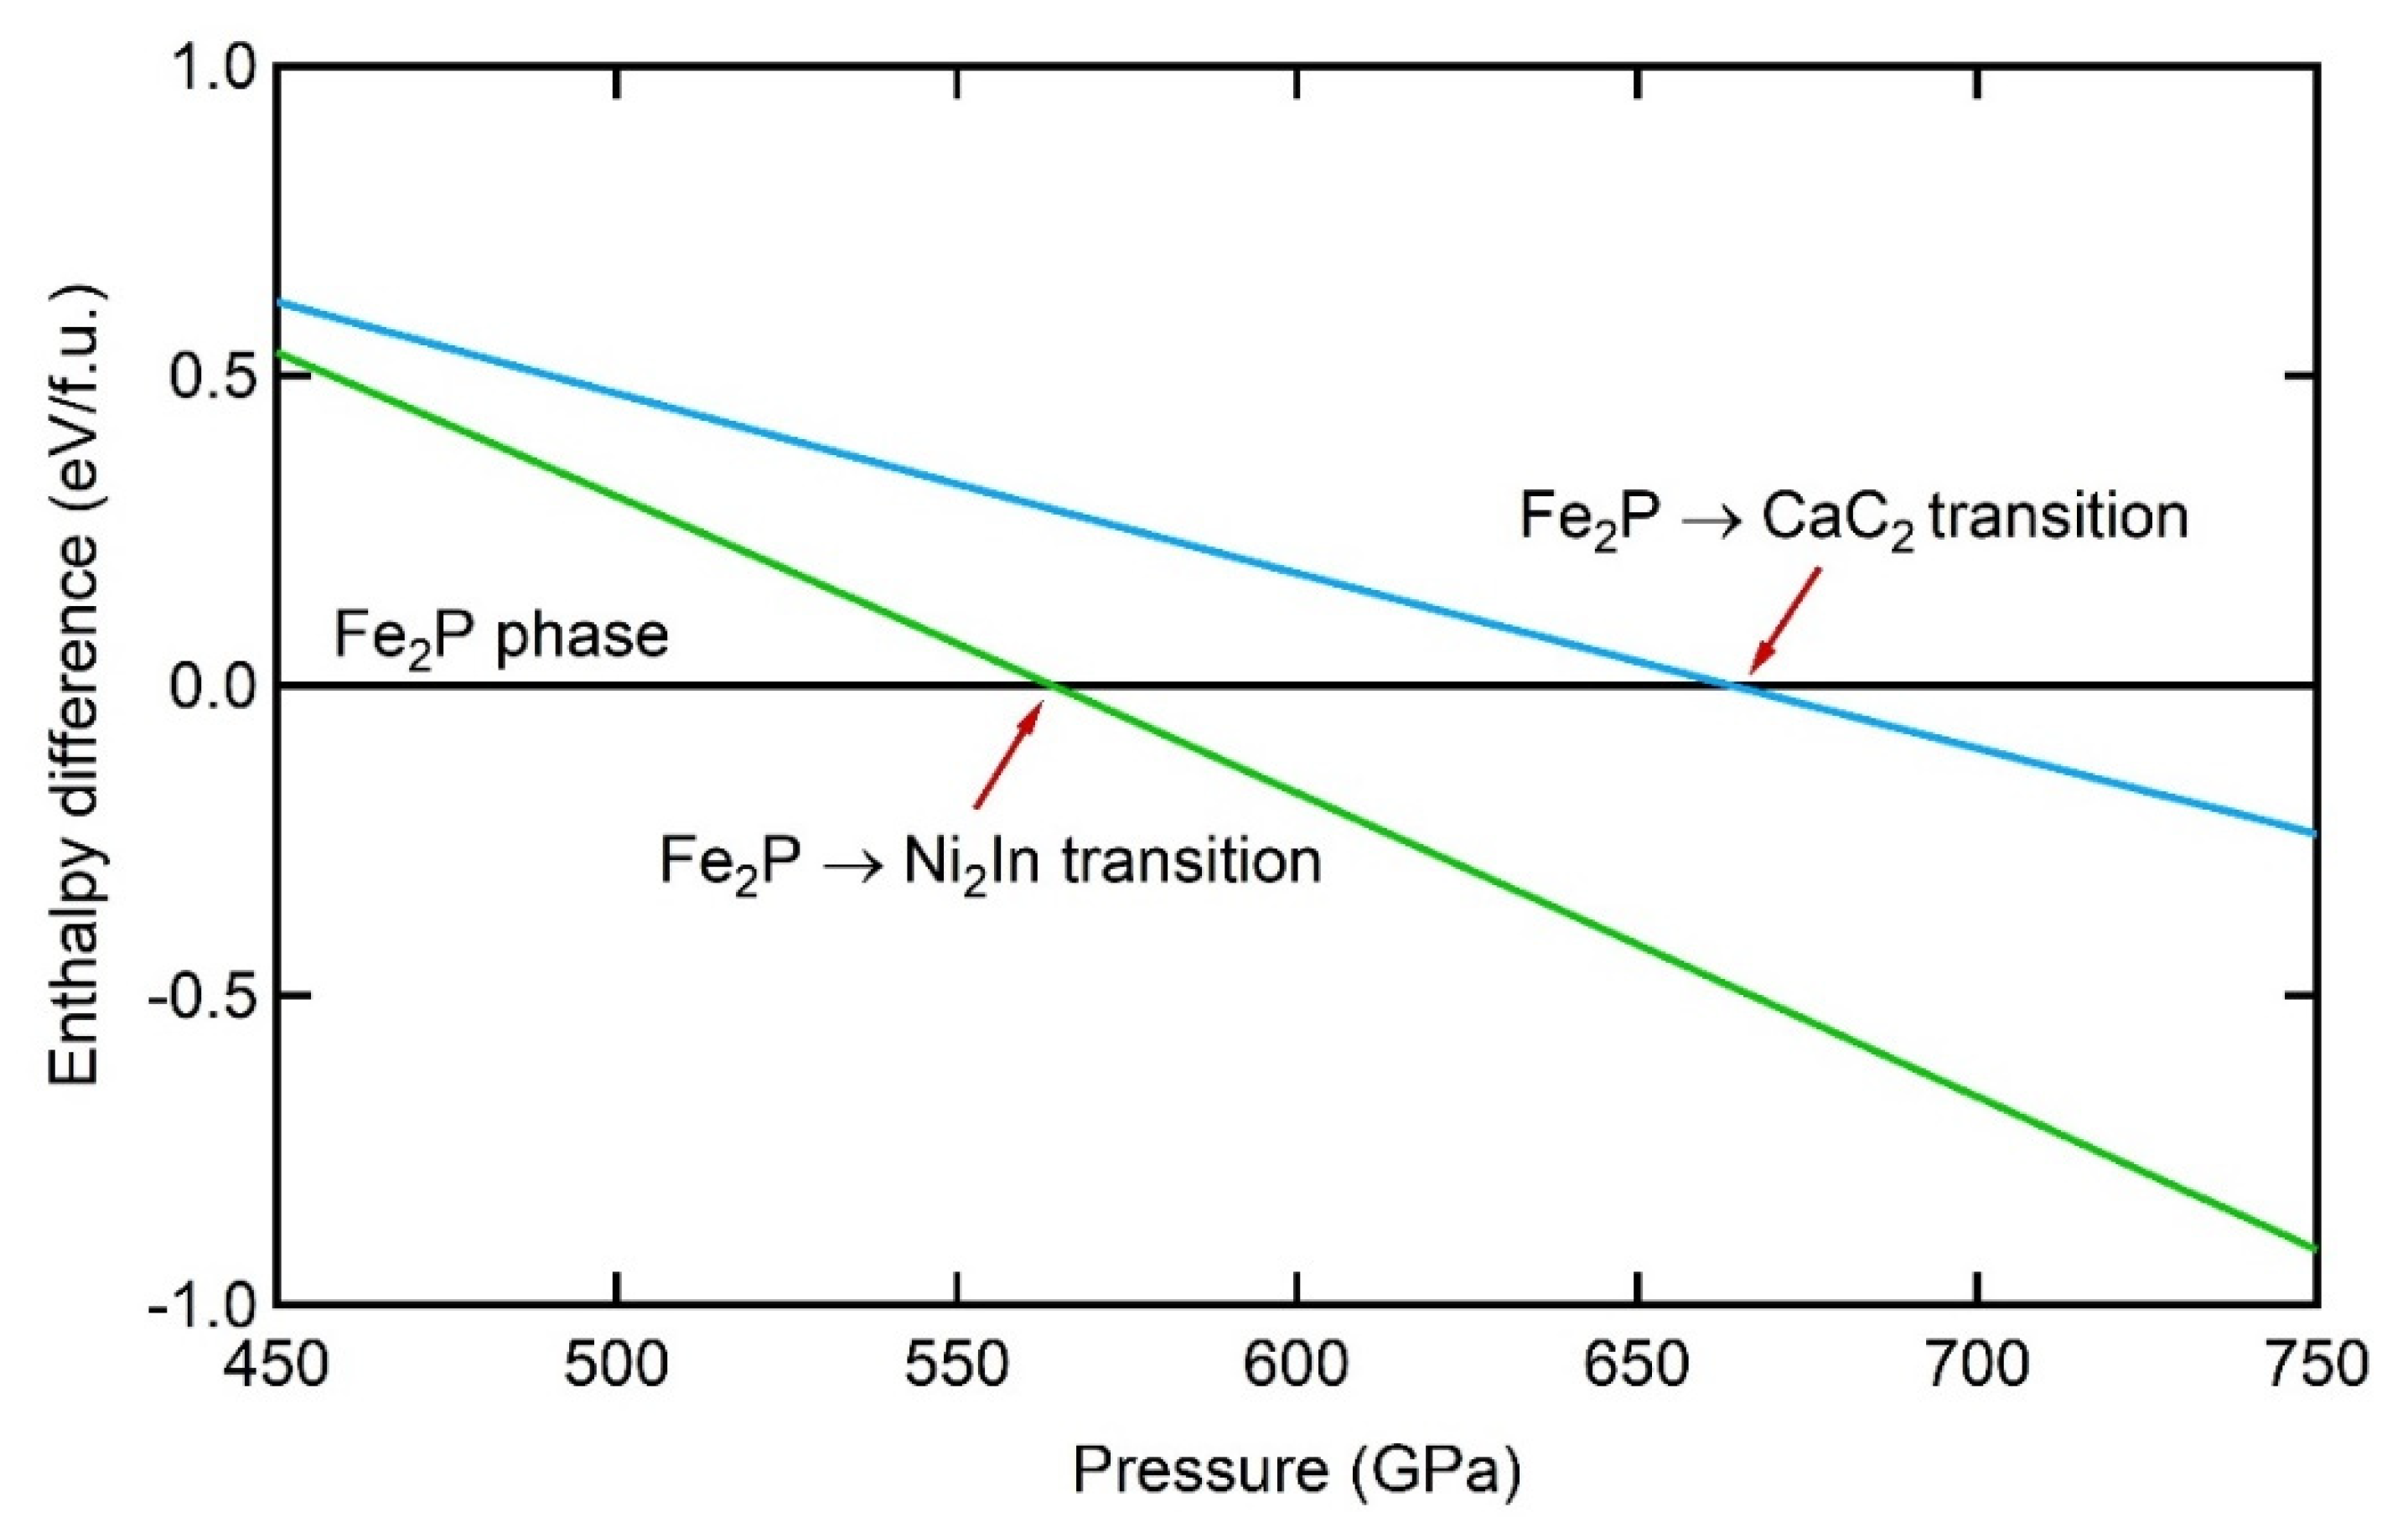
3.2. Enthalpy Difference and Volume Collapse across Phase Transitions

In this section, we discuss the enthalpy difference across the two transitions and the contribution of the volume change in this difference as well as the correlation between the volume decrease and the coordination number increase. We note that the Fe2P → Ni2In and Fe2P → CaC2 transitions are associated with a large enthalpy difference (Figure 3, Table 3) across the phase transition. Our calculations reveal that such noticeable enthalpy difference is mainly due to the obvious volume reduction across both transitions (Figure 2, Table 3), while the contribution of electronic energy gain has a minimal effect.
Although both transitions are driven by a large enthalpy change as discussed above, it has been found that the Fe2P → Ni2In transition requires a larger enthalpy change compared to the Fe2P → CaC2 transition. This result is not unexpected and can be explained in view of the coordination number change across transitions; in this regard, we notice that the Fe2P → Ni2In is related to a 2-coordination-number increase (from 9 to 11) whereas Fe2P → CaC2 is driven by a 1-coordination-number increase (from 9 to 10).
However, regardless of the coordination number increase (either 1 or 2), the calculated volume collapse across both transitions does not show a large difference (3.7% for CaC2 vs. 5.6% for Ni2In), where Fe2P → Ni2In is expected to show a much larger volume reduction due to the large coordination increase across this transition. In detail, it has been previously found that for TiO2, the 2-coordination increase (from 7 to 9 in OI → OII transition) results in an ~ 8% volume reduction [29] compared to a 5.6% reduction for the same coordination increase in Fe2P → Ni2In. On the other hand, the 3.7% volume decrease in Fe2P → CaC2 transition looks more appropriate for a 1-coordination increase and agrees well with previous studies that reported values of 3.3–3.4% [33,36]. Therefore, based on the interplay between the volume reduction and coordination number change, the Fe2P → CaC2 transition is likely favorable in TiO2 when compared to the Fe2P → Ni2In transition.

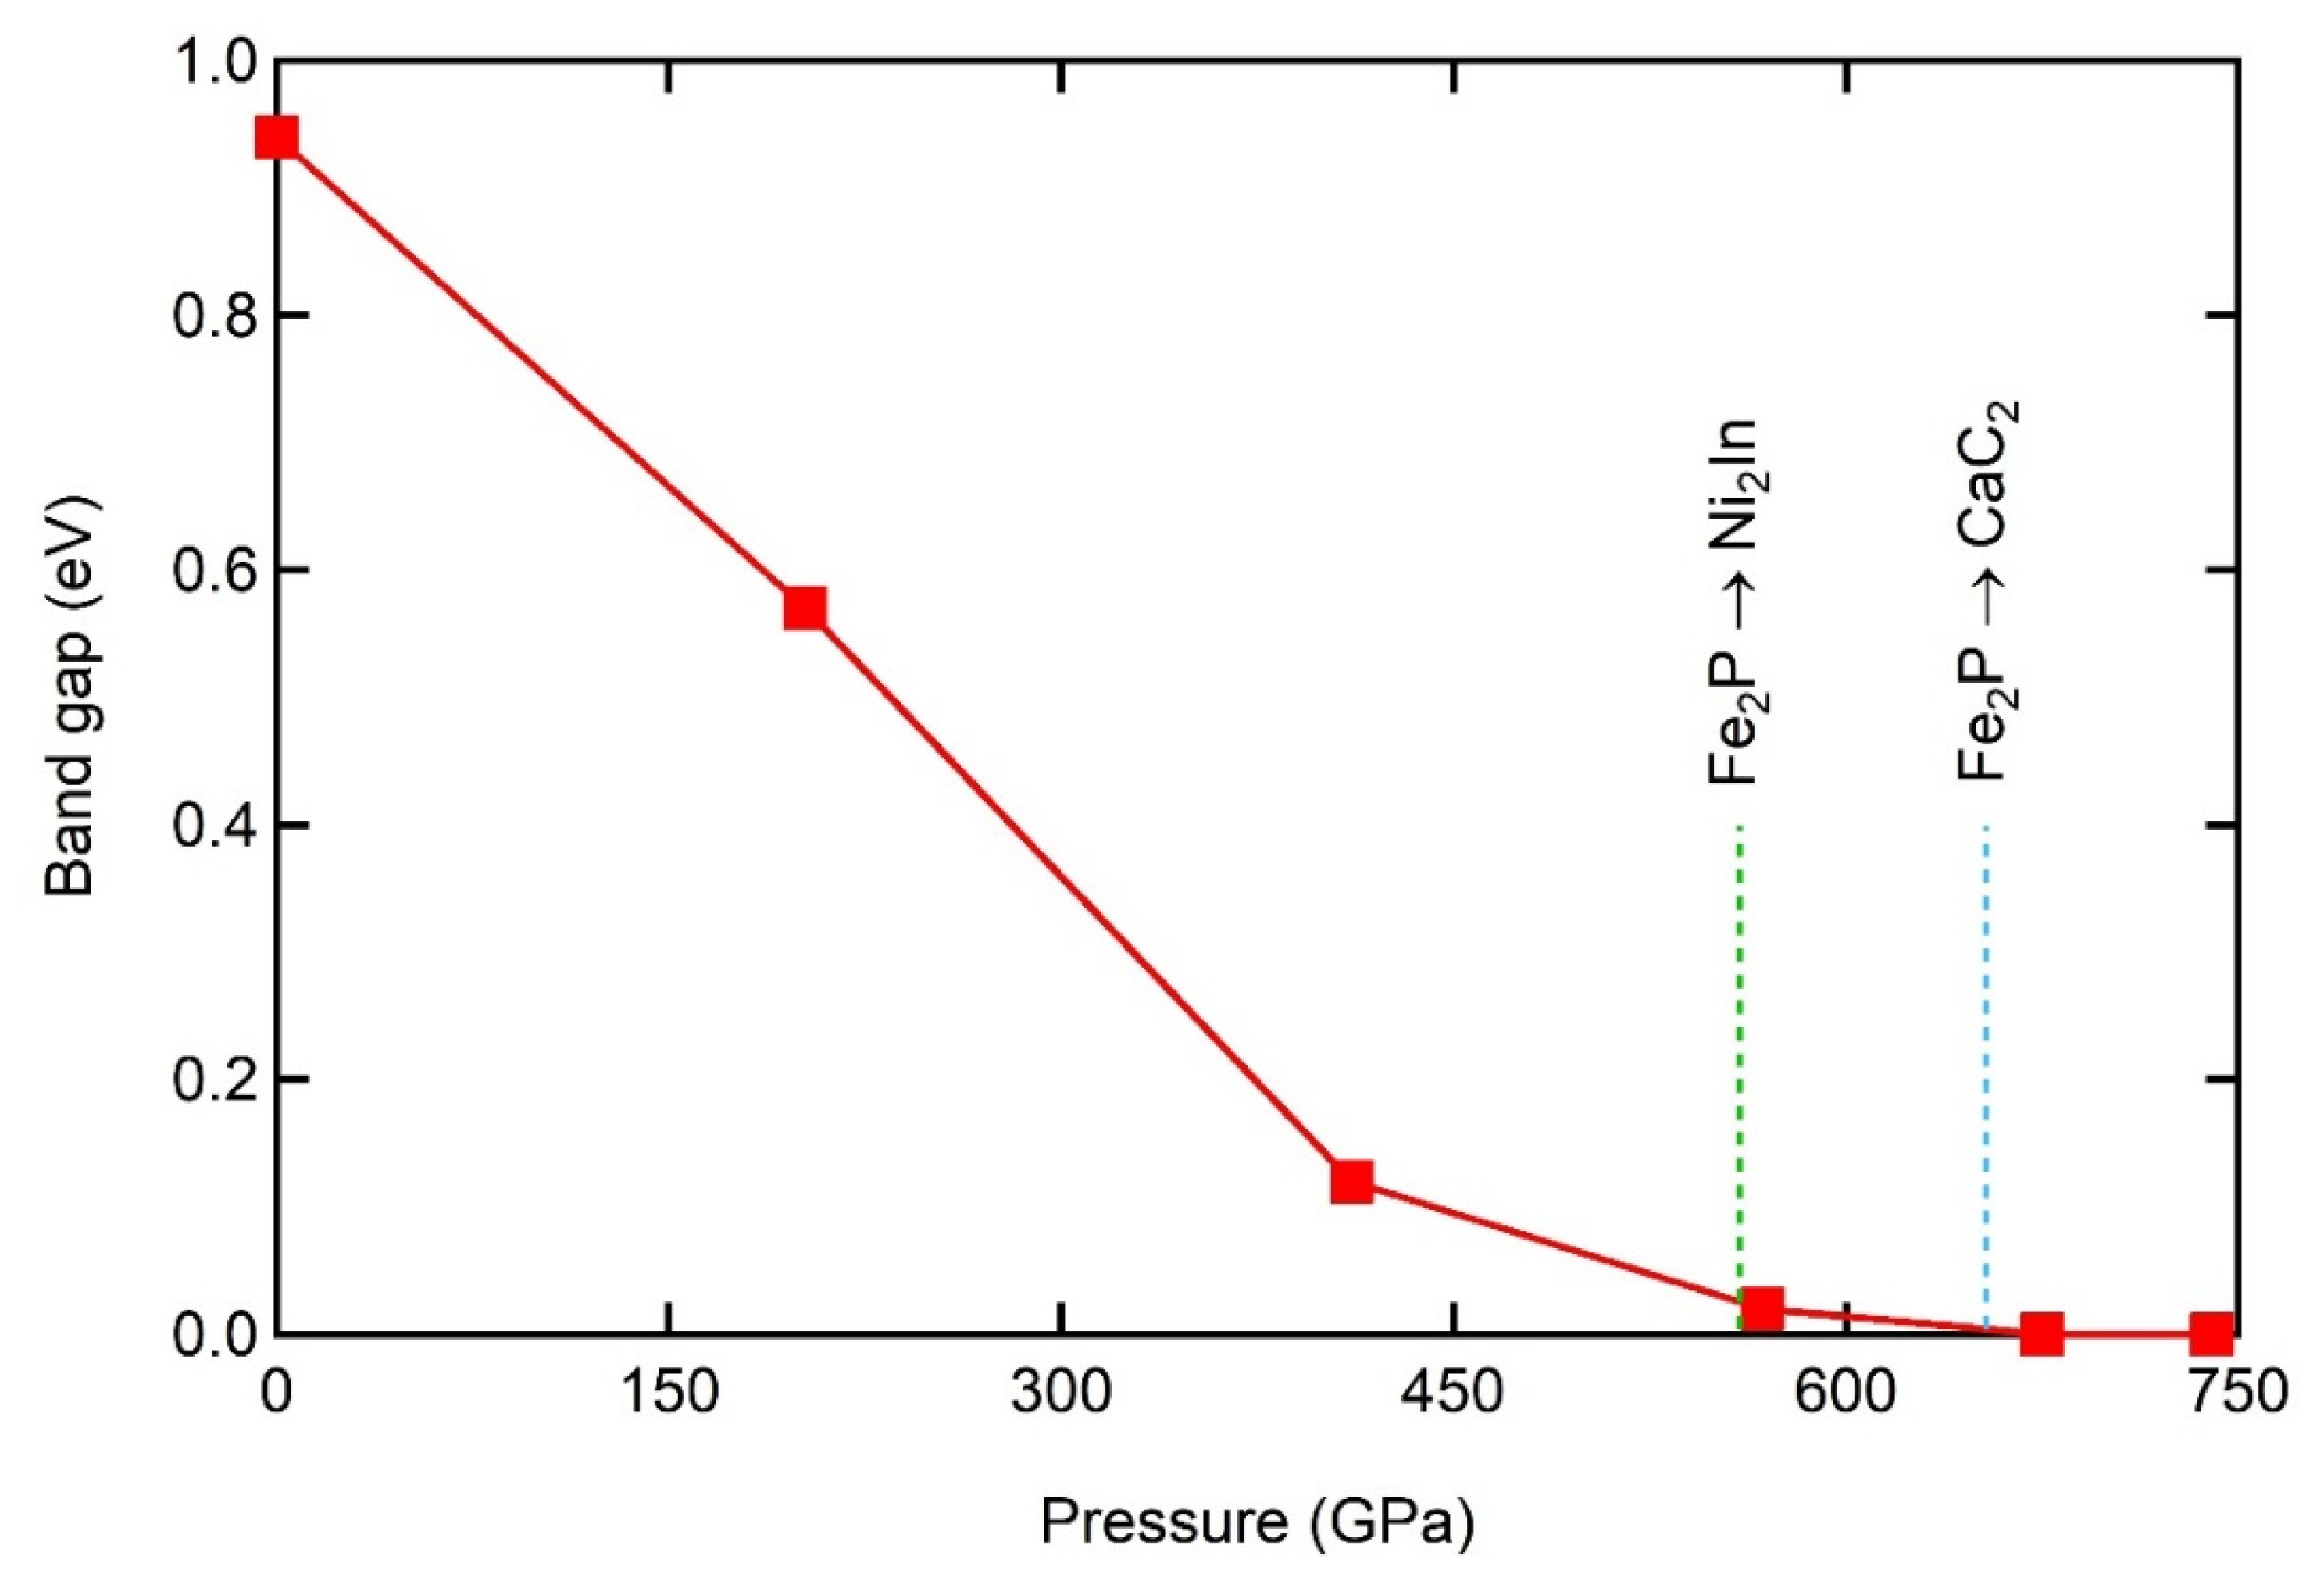
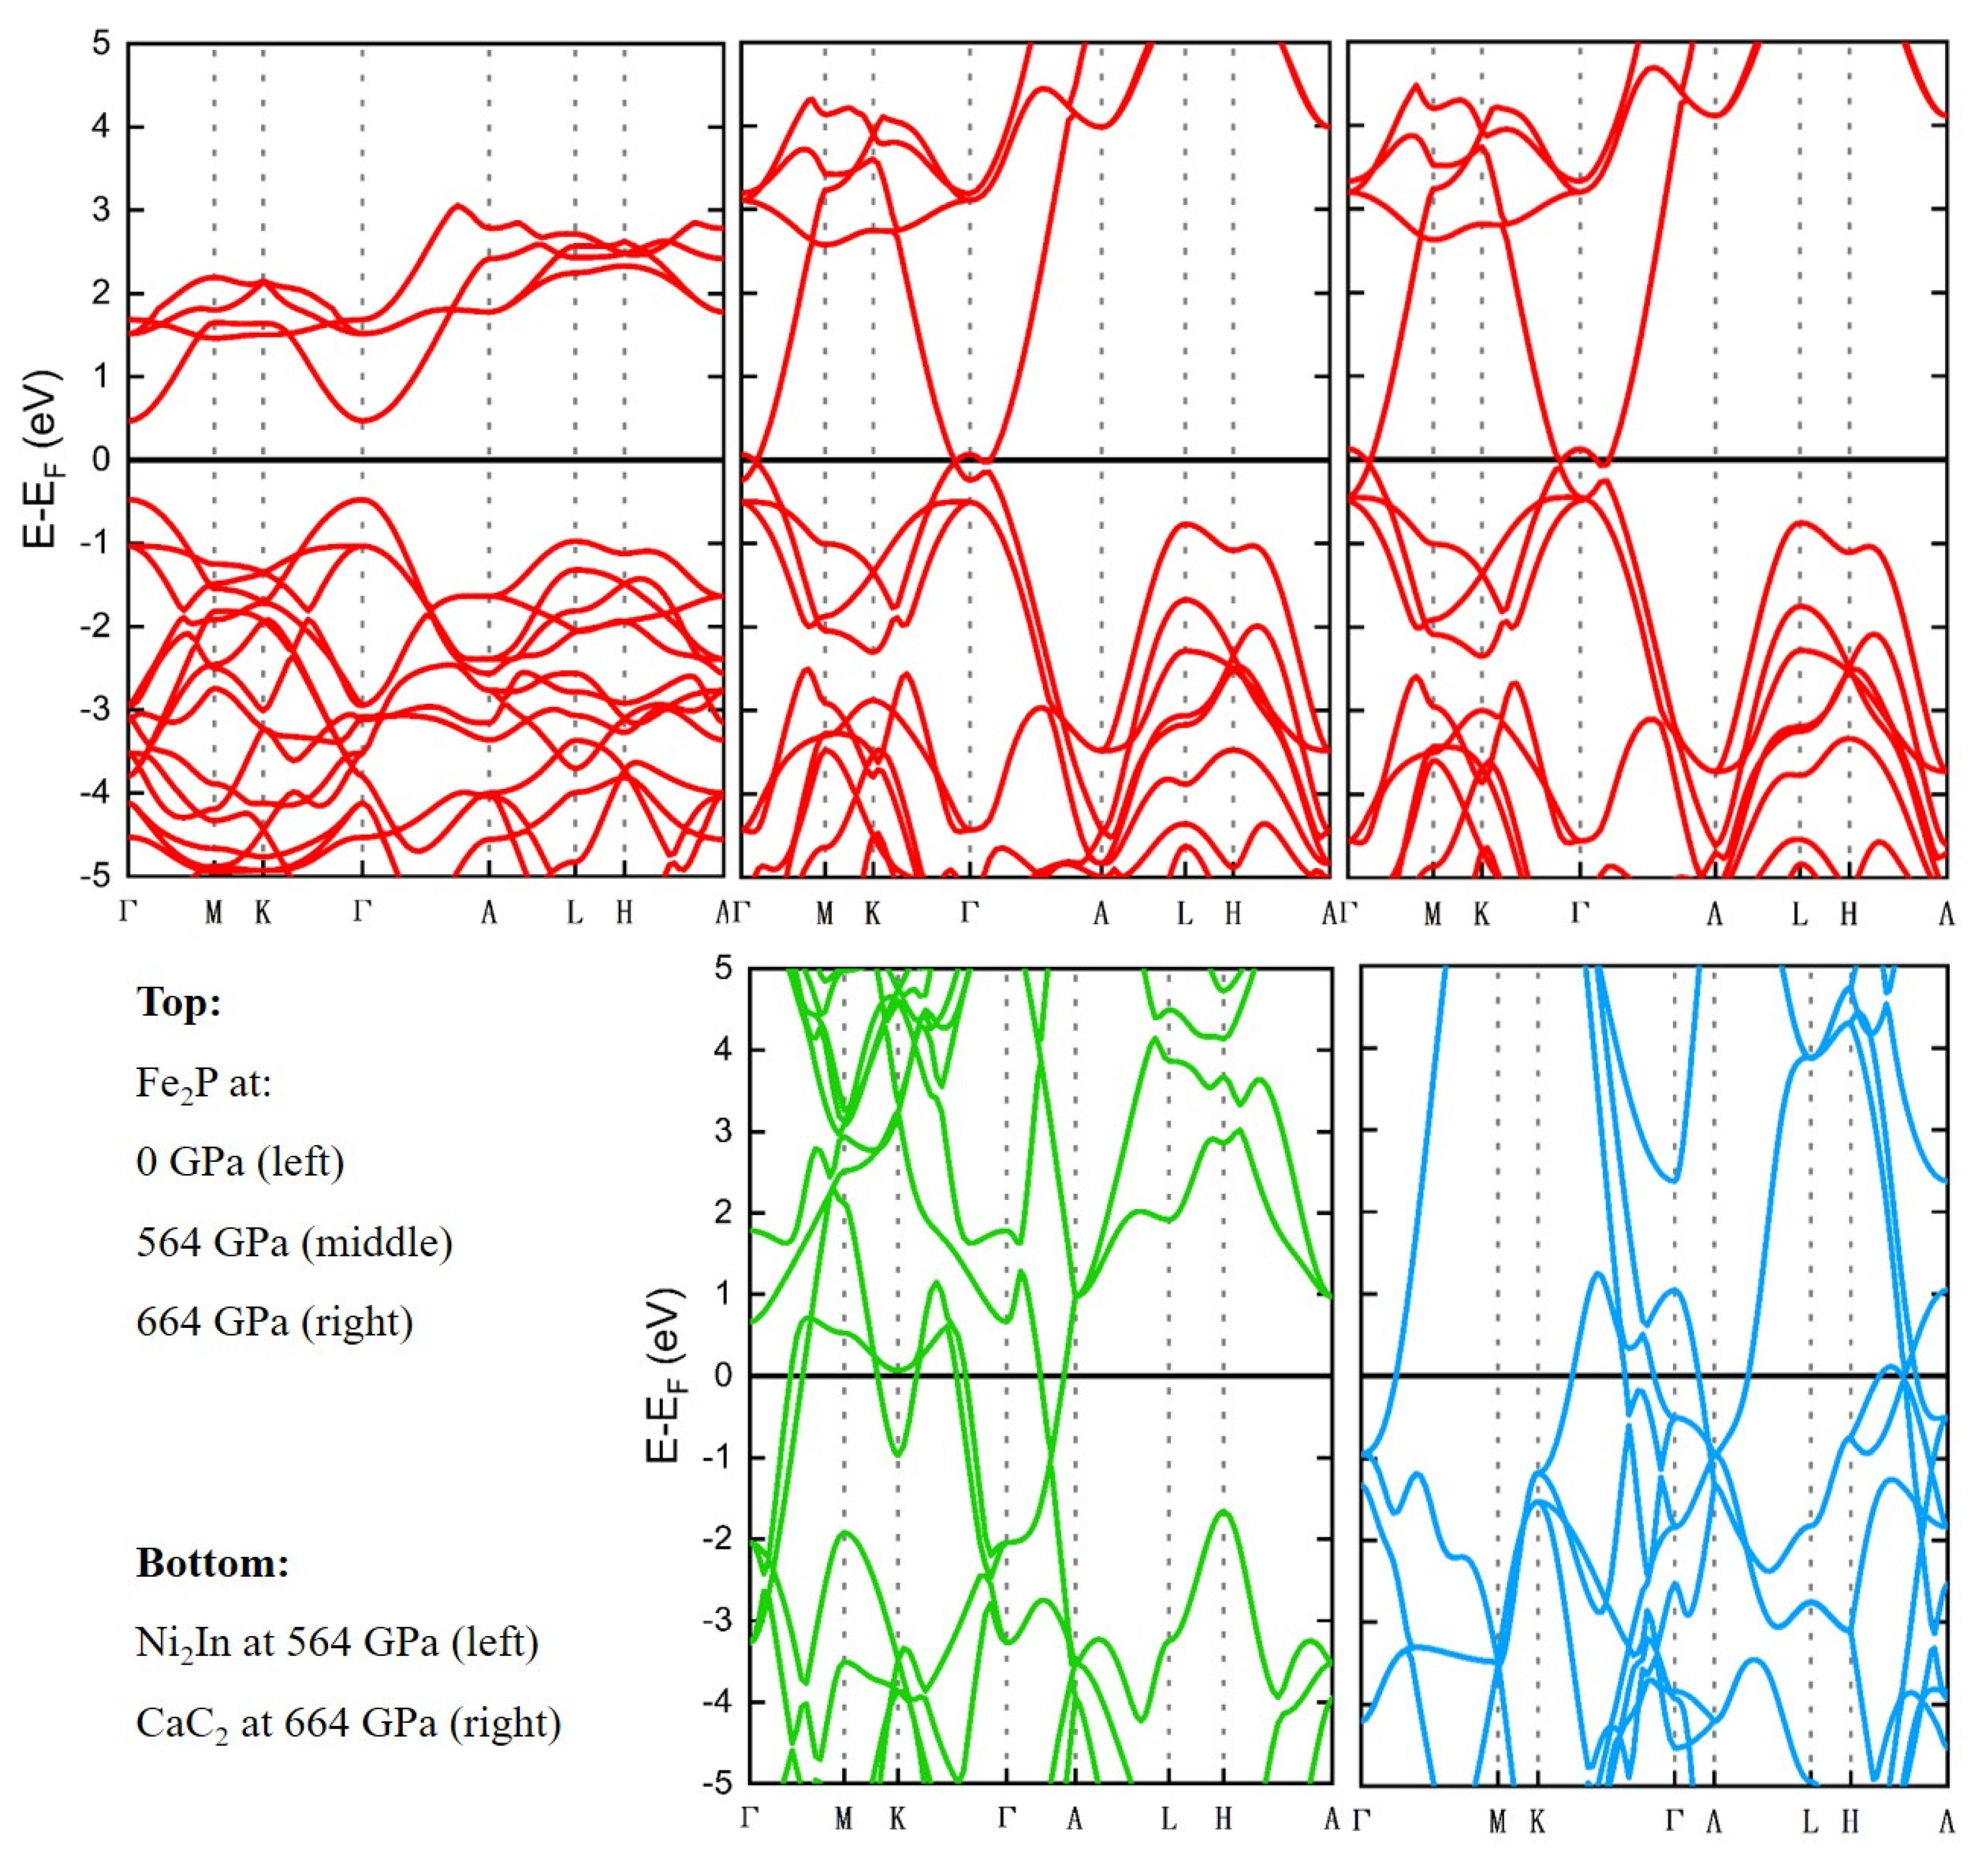
3.3. Band Gap Calculations at the Transition Pressures

To further investigate the proposed ultrahigh-pressure phases of titania, we explored the pressure dependence of the band gap by analyzing the band structure of each phase at different pressures (Figure 4 and Figure 5). Often, DFT calculations systematically underestimate band gaps; however, they accurately describe the pressure dependence [58,59]. We speculate that such analysis might be helpful in gaining a deeper insight into the Fe2P → Ni2In and Fe2P → CaC2 transitions to better determine the favorable phase transition. Our band gap calculations show that the band gap of the Fe2P-type structure at zero pressure is ~0.94 eV and decreases as pressure increases, where the drop in the band gap becomes more obvious at megabar pressures (Figure 4). However, regardless of such band-gap collapse, we should note that the Fe2P phase remains a semiconductor up to multi-megabar pressures before its metallization begins at pressures greater than 650 GPa (Figure 4), in good agreement with previous predictions obtained for Fe2P-TiO2 [33,36].
Additionally, our analysis of the band structures of the Ni2In and CaC2 phases reveals that both structures have metallic characteristics (band gap = 0 eV) at their predicted transition pressures from the Fe2P phase (Figure 4 and Figure 5, Table 2). In this regard, we note that the band gap difference (Table 2, Figure 4) across Fe2P → CaC2 transition is zero (0 eV → 0 eV) compared to a ~0.04 eV difference across Fe2P → Ni2In transition (0.04 eV → 0 eV). Consequently, our band gap calculations likely provide further evidence that supports the Fe2P → CaC2 transition being the favorable transition when compared to the Fe2P → CaC2 transition. Thus, we confirm previous theoretical findings that predict CaC2 to be the post-Fe2P phase for TiO2 [33,36]. Finally, it should be noted that such confirmation is important since the Ni2In phase was a highly possible scenario for TiO2 as it has been predicted to be the post-Fe2P phase in the similar dioxides ZrO2 and HfO2 [42,43,44]. In this regard, we should emphasize that the three dioxides undergo the same transition sequence at high pressures (MI → OI → OII → Fe2P), but the post-Fe2P phase in TiO2 (i.e., CaC2-type) is predicted to be different from that of ZrO2 and HfO2 (i.e., Ni2In-type).

4. Conclusions

In conclusion, we employed DFT computations to investigate the ultrahigh-pressure phase stability of the Ni2In and CaC2 structures with respect to the Fe2P structure of titania. We explored the Fe2P → Ni2In and Fe2P → CaC2 transitions to better predict the favored post-Fe2P of TiO2. These transitions were thoroughly studied in terms of the volume decrease, the coordination number increase, and the band gap reduction. Our analysis favored the Fe2P → CaC2 transition, and thus we predict that the CaC2-type structure is likely the post-Fe2P phase of TiO2, and therefore the most stable phase of titania at pressures that exceed 664 GPa. This result is also evidenced by a similar conclusion we recently obtained for ZrO2, where the Fe2P → CaC2 transition was predicted to be more favorable than the Fe2P → Ni2In transition (unpublished), thus emphasizing the close similarities of the high-pressure behavior of titania and zirconia. Finally, our equation of state determination shows that CaC2 is the densest phase with a high bulk modulus that is comparable to that of the experimentally observed Fe2P phase, while the Ni2In phase reveals a low density and high compressibility.

Author Contributions

Conceptualization, Y.A.-K. and K.T.; methodology, Y.A.-K.; software, K.T.; formal analysis, Y.A.-K. and K.T.; writing—original draft preparation, K.T. and Y.A.-K.; writing—review and editing, Y.A.-K. and K.T. All authors have read and agreed to the published version of the manuscript.

Funding

This research received no external funding.

Data Availability Statement

The data presented in this study are available in the article.

Conflicts of Interest

The authors declare no conflict of interest.

References

  1. Wu, X. Applications of Titanium Dioxide Materials. In Titanium Dioxide—Advances and Applications; IntechOpen: London, UK, 2022. [Google Scholar]
  2. Basheer, C. Application of Titanium Dioxide-Graphene Composite Material for Photocatalytic Degradation of Alkylphenols. J. Chem. 2013, 2013, 456586. [Google Scholar] [CrossRef] [Green Version]
  3. Nishio-Hamane, D.; Shimizu, A.; Nakahira, R.; Niwa, K.; Sano-Furukawa, A.; Okada, T.; Yagi, T.; Kikegawa, T. The Stability and Equation of State for the Cotunnite Phase of TiO2 up to 70 GPa. Phys. Chem. Miner. 2009, 37, 129–136. [Google Scholar] [CrossRef]
  4. Swamy, V.; Kuznetsov, A.Y.; Dubrovinsky, L.S.; Kurnosov, A.; Prakapenka, V.B. Unusual Compression Behavior of Anatase TiO2 Nanocrystals. Phys. Rev. Lett. 2009, 103, 75505. [Google Scholar] [CrossRef] [PubMed]
  5. Shul’ga, Y.M.; Matyushenko, D.V.; Golyshev, A.A.; Shakhrai, D.V.; Molodets, A.M.; Kabachkov, E.N.; Kurkin, E.N.; Domashnev, I.A. Phase Transformations in Nanostructural Anatase TiO2 under Shock Compression Conditions Studied by Raman Spectroscopy. Tech. Phys. Lett. 2010, 36, 841–843. [Google Scholar] [CrossRef]
  6. Ding, Y.; Chen, M.; Wu, W. Mechanical Properties, Hardness and Electronic Structures of New Post-Cotunnite Phase (Fe2P-Type) of TiO2. Phys. B Condens. Matter 2014, 433, 48–54. [Google Scholar] [CrossRef]
  7. Wang, Z.; Saxena, S.K. Raman Spectroscopic Study on Pressure-Induced Amorphization in Nanocrystalline Anatase (TiO2). Solid State Commun. 2001, 118, 75–78. [Google Scholar] [CrossRef]
  8. Gerward, L.; Olsen, J.S. Post-Rutile High-Pressure Phases in TiO2. J. Appl. Crystallogr. 1997, 30, 259–264. [Google Scholar] [CrossRef]
  9. Wang, Z.; Saxena, S.K.; Pischedda, V.; Liermann, H.P.; Zha, C.S. X-Ray Diffraction Study on Pressure-Induced Phase Transformations in Nanocrystalline Anatase/Rutile (TiO2). J. Phys. Condens. Matter 2001, 13, 8317–8323. [Google Scholar] [CrossRef]
  10. Swamy, V.; Dubrovinsky, L.S.; Dubrovinskaia, N.A.; Langenhorst, F.; Simionovici, A.S.; Drakopoulos, M.; Dmitriev, V.; Weber, H.-P. Size Effects on the Structure and Phase Transition Behavior of Baddeleyite TiO2. Solid State Commun. 2005, 134, 541–546. [Google Scholar] [CrossRef]
  11. Dubrovinskaia, N.A.; Dubrovinsky, L.S.; Ahuja, R.; Prokopenko, V.B.; Dmitriev, V.; Weber, H.-P.; Osorio-Guillen, J.M.; Johansson, B. Experimental and Theoritical Identification of a New High-Pressure TiO2 Polymorph. Phys. Rev. Lett. 2001, 87, 275501. [Google Scholar] [CrossRef]
  12. Caravaca, M.A.; Mino, J.C.; Perez, V.J.; Casali, R.A.; Ponce, C.A. Ab Initio Study of the Elastic Properties of Single and Polycrystal TiO2, ZrO2 and HfO2 in the Cotunnite Structure. J. Phys. Condens. Matter 2009, 21, 15501. [Google Scholar] [CrossRef] [PubMed] [Green Version]
  13. Hearne, G.R.; Zhao, J.; Dawe, A.M.; Pischedda, V.; Maaza, M.; Nieuwoudt, M.K.; Kibasomba, P.; Nemraoui, O.; Comins, J.D. Effect of Grain Size on Structural Transitions in Anatase TiO2: A Raman Spectroscopy Study at High Pressure. Phys. Rev. B 2004, 70, 134102. [Google Scholar] [CrossRef]
  14. Swamy, V.; Kuznetsov, A.; Dubrovinsky, L.S.; McMillan, P.F.; Prakapenka, V.B.; Shen, G.; Muddle, B.C. Size-Dependent Pressure-Induced Amorphization in Nanoscale TiO2. Phys. Rev. Lett. 2006, 96, 135702. [Google Scholar] [CrossRef] [PubMed] [Green Version]
  15. Ahuja, R.; Dubrovinsky, L.S. High-Pressure Structural Phase Transitions in TiO2 and Synthesis of the Hardest Known Oxide. J. Phys. Condens. Matter 2002, 14, 10995–10999. [Google Scholar] [CrossRef]
  16. Wang, Y.; Zhao, Y.; Zhang, J.; Xu, H.; Wang, L.; Luo, S.; Daemen, L.L. In Situ Phase Transition Study of Nano- and Coarse-Grained TiO2 under High Pressure/Temperature Conditions. J. Phys. Condens. Matter 2008, 20, 125224. [Google Scholar] [CrossRef]
  17. Flank, A.-M.; Lagarde, P.; Itie, J.-P.; Hearne, G.R. Pressure-Induced Amorphization and a Possible Polyamorphism Transition in Nanosized TiO2: An x-Ray Absorption Spectroscopy Study. Phys. Rev. B 2008, 77, 224112. [Google Scholar] [CrossRef]
  18. Arlt, T.; Bermejo, M.; Blanco, M.A.; Gerward, L.; Jiang, J.Z.; Olsen, J.S.; Recio, J.M. High-Pressure Polymorphs of Anatase TiO2. Phys. Rev. B 2000, 61, 14414. [Google Scholar] [CrossRef] [Green Version]
  19. Mattesini, M.; de Almeida, J.S.; Dubrovinsky, L.; Dubrovinskaia, N.; Johansson, B.; Ahuja, R. High-Pressure and High-Temperature Synthesis of the Cubic TiO2 Polymorph. Phys. Rev. B 2004, 70, 212101. [Google Scholar] [CrossRef]
  20. Swamy, V.; Muddle, B.C. Ultrastiff Cubic TiO2 Identified via First-Principles Calculations. Phys. Rev. Lett. 2007, 98, 35502. [Google Scholar] [CrossRef]
  21. Swamy, V.; Dubrovinskaia, N.A.; Dubrovinsky, L.S. Compressibility of Baddeleyite-Type TiO2 from Static Compression to 40 GPa. J. Alloys Compd. 2002, 340, 46–48. [Google Scholar] [CrossRef]
  22. Muscat, J.; Swamy, V.; Harrison, N.M. First-Principles Calculations of the Phase Stability of TiO2. Phys. Rev. B 2002, 65, 224112. [Google Scholar] [CrossRef]
  23. Lyakhov, A.O.; Oganov, A.R. Evolutionary Search for Superhard Materials: Methodology and Applications to Forms of Carbon and TiO2. Phys. Rev. B 2011, 84, 92103. [Google Scholar] [CrossRef] [Green Version]
  24. Al-Khatatbeh, Y.; Lee, K.K.M.; Kiefer, B. Compressibility of Nanocrystalline TiO2 Anatase. Phys. Chem. C 2012, 116, 21635–21639. [Google Scholar] [CrossRef]
  25. Swamy, V.; Dubrovinsky, L.S.; Dubrovinskaia, N.A.; Simionovici, A.S.; Drakopoulos, M.; Dmitriev, V.; Weber, H.-P. Compression Behavior of Nanocrystalline Anatase TiO2. Solid State Commun. 2003, 125, 111–115. [Google Scholar] [CrossRef]
  26. Al-Khatatbeh, Y.; Lee, K.K.M. From Superhard to Hard: A Review of Transition Metal Dioxides TiO2, ZrO2, and HfO2 Hardness. J. Superhard Mater. 2014, 36, 231–245. [Google Scholar] [CrossRef] [Green Version]
  27. Van Gestel, T.; Sebold, D.; Kruidhof, H.; Bouwmeester, H.J.M. ZrO2 and TiO2 Membranes for Nanofiltration and Pervaporation. Part 2. Development of ZrO2 and TiO2 Toplayers for Pervaporation. J. Memb. Sci. 2008, 318, 413–421. [Google Scholar] [CrossRef]
  28. Swamy, V.; Muddle, B.C. Pressure-Induced Polyamorphic Transition in Nanoscale TiO2. J. Aust. Cer. Soc. 2008, 44, 1–5. [Google Scholar]
  29. Al-Khatatbeh, Y.; Lee, K.K.M.; Kiefer, B. High-Pressure Behavior of TiO2 as Determined by Experiment and Theory. Phys. Rev. B 2009, 79, 134114. [Google Scholar] [CrossRef]
  30. Meng, X.; Wang, L.; Liu, D.; Wen, X.; Zhu, Q.; Goddard, W.A.; An, Q. Discovery of Fe2P-Type Ti(Zr/Hf)2O6 Photocatalysts toward Water Splitting. Chem. Mater. 2016, 28, 1335–1342. [Google Scholar] [CrossRef] [Green Version]
  31. Dekura, H.; Tsuchiya, T.; Kuwayama, Y.; Tsuchiya, J. Theoretical and Experimental Evidence for a New Post-Cotunnite Phase of Titanium Dioxide with Significant Optical Absorption. Phys. Rev. Lett. 2011, 107, 45701. [Google Scholar] [CrossRef]
  32. Fu, Z.; Liang, Y.; Wang, S.; Zhong, Z. Structural Phase Transition and Mechanical Properties of TiO2 under High Pressure. Phys. Status Solidi Basic Res. 2013, 250, 2206–2214. [Google Scholar] [CrossRef]
  33. Zhong, X.; Wang, J.; Zhang, S.; Yang, G.; Wang, Y. Ten-Fold Coordinated Polymorph and Metallization of TiO2 under High Pressure. RSC Adv. 2015, 5, 54253–54257. [Google Scholar] [CrossRef]
  34. Liang, Y.; Zhang, B.; Zhao, J. Mechanical Properties and Structural Identifications of Cubic TiO2. Phys. Rev. B 2008, 77, 94126. [Google Scholar] [CrossRef]
  35. Swamy, V.; Kuznetsov, A.; Dubrovinsky, L.S.; Caruso, R.A.; Shchukin, D.G.; Muddle, B.C. Finite-Size and Pressure Effects on the Raman Spectrum of Nanocrystalline Anatase TiO2. Phys. Rev. B 2005, 71, 184302. [Google Scholar] [CrossRef]
  36. Lyle, M.J.; Pickard, C.J.; Needs, R.J. Prediction of 10-Fold Coordinated TiO2 and SiO2 Structures at Multimegabar Pressures. Proc. Natl. Acad. Sci. USA 2015, 112, 6898–6901. [Google Scholar] [CrossRef] [Green Version]
  37. Luo, W.; Yang, S.F.; Wang, Z.C.; Ahuja, R.; Johansson, B.; Liu, J.; Zou, G.T. Structural Phase Transitions in Brookite-Type TiO2 under High Pressure. Solid State Commun. 2005, 133, 49–53. [Google Scholar] [CrossRef]
  38. Machon, D.; Daniel, M.; Pischedda, V.; Daniele, S.; Bouvier, P.; LeFloch, S. Pressure-Induced Polyamorphism in TiO2 Nanoparticles. Phys. Rev. B 2010, 82, 140102. [Google Scholar] [CrossRef] [Green Version]
  39. Wang, Y.; Zhang, J.; Zhao, Y. Strength Weakening by Nanocrystals in Ceramic Materials. Nano Lett. 2007, 7, 3196–3199. [Google Scholar] [CrossRef]
  40. Baty, S.R.; Burakovsky, L.; Errandonea, D. Ab Initio Phase Diagram of Copper. Crystals 2021, 11, 537. [Google Scholar] [CrossRef]
  41. Diaz-Anichtchenko, D.; Errandonea, D. Comparative Study of the Compressibility of M3V2O8 (M = Cd, Zn, Mg, Ni) Orthovanadates. Crystals 2022, 12, 1544. [Google Scholar] [CrossRef]
  42. Durandurdu, M. Novel High-Pressure Phase of ZrO2: An Ab Initio Prediction. J. Solid State Chem. 2015, 230, 233–236. [Google Scholar] [CrossRef]
  43. Al-Khatatbeh, Y.; Tarawneh, K.; Hamad, B. The Prediction of a New High-Pressure Phase of Hafnia Using First-Principles Computations. IOP Conf. Ser. Mater. Sci. Eng. 2018, 305, 012006. [Google Scholar] [CrossRef]
  44. Al-Taani, H.; Tarawneh, K.; Al-Khatatbeh, Y.; Hamad, B. The High-Pressure Stability of Ni2In-Type Structure of ZrO2 with Respect to OII and Fe2P-Type Phases: A First-Principles Study. IOP Conf. Ser. Mater. Sci. Eng. 2018, 305, 012016. [Google Scholar] [CrossRef]
  45. Kokalj, A. Computer Graphics and Graphical User Interfaces as Tools in Simulations of Matter at the Atomic Scale. Comput. Mater. Sci. 2003, 28, 155–168. [Google Scholar] [CrossRef]
  46. Al-Khatatbeh, Y.; Lee, K.K.M.; Kiefer, B. Phase Diagram up to 105 GPa and Mechanical Strength of HfO2. Phys. Rev. B 2010, 82, 144106. [Google Scholar] [CrossRef] [Green Version]
  47. Al-Khatatbeh, Y.; Lee, K.K.M.; Kiefer, B. Phase Relations and Hardness Trends of ZrO2 Phases at High Pressure. Phys. Rev. B 2010, 81, 214102. [Google Scholar] [CrossRef]
  48. Al-Khatatbeh, Y.; Tarawneh, K.; Al-Taani, H.; Lee, K.K.M. Theoretical and Experimental Evidence for a Post-Cotunnite Phase Transition in Hafnia at High Pressures. J. Superhard Mater. 2018, 40, 374–383. [Google Scholar] [CrossRef]
  49. Nishio-Hamane, D.; Dekura, H.; Seto, Y.; Yagi, T. Theoretical and Experimental Evidence for the Post-Cotunnite Phase Transition in Zirconia at High Pressure. Phys. Chem. Miner. 2015, 42, 385–392. [Google Scholar] [CrossRef]
  50. Dutta, R.; Kiefer, B.; Greenberg, E.; Prakapenka, V.B.; Duffy, T.S. Ultrahigh-Pressure Behavior of AO2 (A = Sn, Pb, Hf) Compounds. J. Phys. Chem. C 2019, 123, 27735–27741. [Google Scholar] [CrossRef]
  51. Hohenberg, P.; Kohn, W. Inhomogeneous Electron Gas. Phys. Rev. 1964, 136, B864–B871. [Google Scholar] [CrossRef] [Green Version]
  52. Kresse, G.; Joubert, D. From Ultrasoft Pseudopotentials to the Projector Augmented-Wave Method. Phys. Rev. B 1999, 59, 1758–1775. [Google Scholar] [CrossRef]
  53. Blochl, P.E. Projector Augmented-Wave Method. Phys. Rev. B 1994, 50, 17953. [Google Scholar] [CrossRef] [PubMed] [Green Version]
  54. Perdew, J.P.; Burke, K.; Ernzerhof, M. Generalized Gradient Approximation Made Simple. Phys. Rev. Lett. 1996, 77, 3865–3868. [Google Scholar] [CrossRef] [Green Version]
  55. Giannozzi, P.; Baroni, S.; Bonini, N.; Calandra, M.; Car, R.; Cavazzoni, C.; Ceresoli, D.; Chiarotti, G.L.; Cococcioni, M.; Dabo, I.; et al. QUANTUM ESPRESSO: A Modular and Open-Source Software Project for Quantum Simulations of Materials. J. Phys. Condens. Matter 2009, 21, 395502. [Google Scholar] [CrossRef] [PubMed]
  56. Monkhorst, H.J.; Pack, J.D. Special Points for Brillouin-Zone Integrations. Phys. Rev. B 1976, 13, 5188–5192. [Google Scholar] [CrossRef]
  57. Birch, F. Elasticity and Constitution of the Earth’s Interior. J. Geophys. Res. 1952, 57, 227–234. [Google Scholar] [CrossRef]
  58. Bandiello, E.; Errandonea, D.; Martinez-Garcia, D.; Santamaria-Perez, D.; Manjón, F.J. Effects of High Pressure on the Structural, Vibrational, and Electronic Properties of Monazite-Type PbCrO 4. Phys. Rev. B 2012, 85, 024108. [Google Scholar] [CrossRef] [Green Version]
  59. Borlido, P.; Schmidt, J.; Huran, A.W.; Tran, F.; Marques, M.A.L.; Botti, S. Exchange-Correlation Functionals for Band Gaps of Solids: Benchmark, Reparametrization and Machine Learning. npj Comput. Mater. 2020, 6, 96. [Google Scholar] [CrossRef]
Figure 1. Crystal structures of TiO2 phases (generated using XCrySDen software [45]). The green spheres represent the titanium atom, while the alloy orange spheres represent the oxygen atom. (a) Fe2P-type: crystal structure: hexagonal, space group: P 6 ¯ 2 m , coordination number: 9, lattice parameters: a = b = 5.3274 Å and c = 3.1234 Å, atomic coordinates: Ti1 (1/3, 2/3, 1/2), Ti2 (0, 0, 0), O1 (0.262, 0, 1/2), O2 (0.601, 0, 0). (b) Ni2In-type: crystal structure: hexagonal, space group: P63/mmc, coordination number: 11, lattice parameters: a = b = 3.2632 Å and c = 6.0335 Å, atomic coordinates: Ti (1/3, 2/3, 1/4), O1 (0, 0, 0), O2 (1/3, 2/3, 3/4). (c) CaC2-type: crystal structure: tetragonal, space group: I4/mmm, coordination number: 10, lattice parameters: a = b = 2.7407 Å and c = 6.7179 Å, atomic coordinates: Ti (1/2, −1/2, 0), O (1, −1, 0.152).
Crystals 13 00009 g001
Figure 2. Pressure versus volume of TiO2 phases as determined by GGA calculations using BM-EOS [57]. The dashed circles show the large volume reduction across the Fe2P → Ni2In and Fe2P → CaC2 transitions.
Crystals 13 00009 g002
Figure 3. Change in enthalpy with respect to Fe2P phase versus pressure of one formula unit as determined by GGA calculations for TiO2. The transition pressures across transitions from Fe2P to Ni2In and CaC2 phases are shown.
Crystals 13 00009 g003
Figure 4. Calculated band gap of the Fe2P phase as a function of pressure. The vertical dashed lines indicate the transition pressures of the Fe2P → Ni2In and Fe2P → CaC2 transitions.
Crystals 13 00009 g004
Figure 5. Electronic band structure for: (Top) the Fe2P phase at 0 GPa, 564 GPa, and 664 GPa; (Bottom) the Ni2In and CaC2 phases at 564 GPa and 664 GPa, respectively.
Crystals 13 00009 g005
Table 1. Calculated equations of state for the Fe2P, Ni2In, and CaC2 phases of TiO2. Our EOS is determined from GGA calculations using the second-order BM-EOS [57]. For comparison, we list other calculated EOSs for TiO2 and the similar dioxides ZrO2 and HfO2. 1σ uncertainties are given in parentheses.
PhaseEquation of StateReference
V03)K0 (GPa)K0
Fe2P-TiO225.7272.14[31]
25.532874.1[32]
25.59 (0.03)284 (2)4 (fixed)This work
Fe2P-ZrO230.172483.76[42]
30.94 (0.03)272 (2)4 (fixed)[44]
30.342724 (fixed)[48]
Fe2P-HfO229.73 (0.02)282 (2)4 (fixed)[43]
29.69 (0.03)288 (2)4 (fixed)[48]
29.82844.2[50]
Ni2In-TiO227.82 (0.19)173 (6)4 (fixed)This work
Ni2In-ZrO229.212393.86[42]
31.81 (0.13)200 (5)4 (fixed)[44]
Ni2In-HfO230.49 (0.14)213 (6)4 (fixed)[43]
CaC2-TiO225.23 (0.04)264 (3)4 (fixed)This work
Table 2. Calculated transition pressures across the Fe2P → Ni2In and Fe2P → CaC2 phase transitions for TiO2. For comparison, we list other calculated results.
Phase TransitionTransition Pressure (GPa)Reference
Fe2P → Ni2In564 GPaThis work
Fe2P → CaC2647 GPa
689 GPa
664 GPa
[36]
[33]
This work
Table 3. Enthalpy difference, band gap difference, volume change, and coordination number change across the Fe2P → Ni2In and Fe2P → CaC2 phase transitions for TiO2.
Phase TransitionΔHPBand Gap
Difference
(eV)
Volume Change
(%)
Coordination Number Change
eV·GPa−1 (×10−4)kJ·mol−1·GPa−1
Fe2P → Ni2In−48.102−0.464110.045.62
Fe2P → CaC2−28.135−0.2741603.71
Disclaimer/Publisher’s Note: The statements, opinions and data contained in all publications are solely those of the individual author(s) and contributor(s) and not of MDPI and/or the editor(s). MDPI and/or the editor(s) disclaim responsibility for any injury to people or property resulting from any ideas, methods, instructions or products referred to in the content.

