Article

Highly Sensitive Detection of Melamine Based on the Fluorescence Resonance Energy Transfer between Conjugated Polymer Nanoparticles and Gold Nanoparticles

1
School of Materials Science and Engineering, Qilu University of Technology (Shandong Academy of Sciences), Jinan 250353, China
2
Shandong Provincial Key Laboratory of Processing and Testing Technology of Glass and Functional Ceramics, Key Laboratory of Amorphous and Polycrystalline Materials, Qilu University of Technology, Jinan 250353, China
*
Author to whom correspondence should be addressed.
Submission received: 16 July 2018 / Revised: 31 July 2018 / Accepted: 2 August 2018 / Published: 6 August 2018
(This article belongs to the Special Issue Nanoparticle-Reinforced Polymers)

Abstract

:
Adding melamine as additives in food products will lead to many diseases and even death. However, the present techniques of melamine detection require time-consuming steps, complicated procedures and expensive analytical apparatus. The fluorescent assay method was facile and highly sensitive. In this work, a fluorescence resonance energy transfer (FRET) system for melamine detection was constructed based on conjugated polymer nanoparticles (CPNs) and gold nanoparticles (AuNPs). The energy transfer efficiency is up to 82.1%, and the system is highly selective and sensitive to melamine detection with a lower detection limit of 1.7 nmol/L. Moreover, the interaction mechanism was explored. The results showed that the fluorescence of CPNs were firstly quenched by AuNPs, and then restored after adding melamine because of reducing FRET between CPNs and AuNPs. Lastly, the proposed method was carried out for melamine detection in powdered infant formula with satisfactory results.

1. Introduction

As we all know, melamine (C3H6N6), an odorless and white heterocycle compound, is widely used in the manufacturing of plastics, laminates, dyes, fabrics, and fertilizers [1,2]. Moreover, it is often added as an additive in food products to increase the amount of protein detection due to its high nitrogen concentration (66% by mass) [3]. However, this will result in kidney stones, urinary system damage and even death [4]. Melamine is ingested beyond the safety limit of 8 μmol/L for infant formula in China and 20 μmol/L in the USA and EU [5]. Therefore, it is quite necessary to develop a cheap, sensitive and reliable method for melamine detection.
Nowadays, many analytical approaches of melamine detection, such as mass spectroscopy (MS) [6], potentiometric [7], gas chromatography mass spectrometry (GC-MS) [8] and electrochemical [9] have been applied. But these methods require expensive and complicated analytical instruments, are time-consuming and require experienced operators, which limit their wide applications in routine analysis.
Fluorescence assays based on FRET have attracted much interest due to significant merits including high sensitivity, simple instruments, operational simplicity and test rapidity, which can be observed when the space distance between the acceptor and the donor is very close (7~10 nm). Many quantum dots (QDs) and organic dyes were recognized as efficient FRET-based melamine donors such as CdTe [10,11], fluorescein [12], rhodamine B [3,13] and so on. However, these materials suffer from high toxicity, poor stability and photobleaching, which lead to irreproducible fluorescence signals for further analysis. Recently, several methods have been reported based on gold nanoparticles (AuNPs) by color changes of the solution to detect melamine [14,15]. Melamine can reduce the stability of AuNPs and result in their aggregation. Meanwhile, the color of AuNPs solution turned to deep blue from wine red. This variation can be lightly observed by the naked eye and UV-Vis absorption measurement [16,17]. Therefore, AuNPs-based colorimetric detection melamine method is rapid and simple [18]. However, interference substances in milk, which compete with melamine during AuNPs binding, often result in a false positive response. To solve this problem, AuNPs have been successfully utilized as the acceptor for the FRET system owing to high extinction coefficients, conductivity, excellent biocompatibility and size-dependent optical properties [19,20]. In addition, CPNs have been developed as fluorescence probes for tumor imaging [21,22], neuroinflammation [23,24] and cell tracking [25]. Compared to organic dyes and traditional QDs, the superiorities of CPNs include easy preparation, extraordinary fluorescence brightness, low toxicity and good biocompatibility [26,27]. For all we know, the melamine detection based on FRET of CPNs and AuNPs has not been reported.
Herein, an efficient “turn-on” fluorescence sensor for melamine detection was designed based on melamine-induced reduction of FRET efficiency between AuNPs and CPNs. The key diagram of our method is displayed in Scheme 1. The fluorescence of CPNs was well quenched when the CPNs nanoparticles were apt to close the surface of AuNPs. However, the aggregation of AuNPs via N-Au interaction after adding melamine would reduce the FRET of CPNs-AuNPs and promote the fluorescence recovery of CPNs. This is because the spectral overlap between the absorption spectrum of AuNPs and the fluorescence emission spectrum of CPNs will alter after adding melamine, and decrease the energy transfer efficiency of CPNs-AuNPs. Furthermore, the above technique has been well used for melamine detection in real milk powder samples.

2. Experimental

2.1. Chemicals and Apparatus

HAuCl4·4H2O and sodium citrate were gained from Shanghai Chemical Reagent Co. (Shanghai, China). Melamine was obtained from Aladdin Reagent Company (Shanghai, China). l-cysteine, l-histidine, Vitamin C, Glucose, NaOH, Ca(NO3)2·4H2O, FeCl3·6H2O, KNO3, Na2SO4, MgCl2, NaCl were purchased from Tianjin Chemical Works (Tianjin, China). All chemical reagents were used without further purification. The milk powder was obtained from the local supermarket.
Absorption spectra were measured on UV-2500 spectrophotometer (Shimadzu, Shuzhou, China). Fluorescence measurements were finished with F-7000 FL spectrometer (Hitachi, Tokyo, Japan). Transmission electron microscopy (TEM) were given on a JEM–2100 transmission electron microscope (JEOL Ltd., Musashino, Japan). The zeta potentials and size distribution were estimated by dynamic light scattering (DLS) on a Zetasizer Nano ZS90 (Malvern, Worcestershire, UK).

2.2. Preparation of AuNPs

AuNPs were synthetized via the citrate reduction method described in previous reports [28,29]. Typically, 1 mL aqueous solution of HAuCl4 (1%) and 100 mL ultrapure water were firstly heated to boiling, and sodium citrate solution (1%, 4 mL) was added quickly. The reaction was further refluxed for 20 min, and then stored at 4 °C. The sizes of AuNPs were measured to be about 24 nm by DLS (Figure S1a) and TEM (Figure 4A). The molar concentration of AuNPs was calculated to be approximately 2.96 × 10⁻⁹ mol L−1 by Lambert-Beer law using the molar extinction coefficient of reported AuNPs in the literature (2.7 × 10⁸ mol−1 L cm−1 at 520 nm) [16].

2.3. Preparation of CPNs

The Conjugated polymer TEB (Scheme 1) was synthesized according to our previous method [30]. The Mw and Mw/Mn of TEB was 7032 and 1.174, respectively. The nanoparticles of TEB were carried out using the procedure described in the literature [31,32]. As shown in Scheme 1a, TEB were fully dissolved in 10 mL THF to prepare a 20 μg/mL stock solution, and then the solution was rapidly injected into 20 mL of ultrapure water in a sonication bath. After 15 min, THF was removed by rotary evaporation and the solution was concentrated to 10 mL, and then filtered through a 0.22 μm micro-filter. The sizes of CPNs were measured to be about 50.7 nm by DLS (Figure S1c).

2.4. Fluorescence Analysis

Typically, at room temperature, 100 μL CPNs (20 μg/mL) was mixed with as-prepared original AuNPs with different concentrations and incubated for 10 min. Then the emission spectra of solutions were measured.
The AuNPs solution was diluted with ultrapure water to 2.37 × 10⁻⁹ mol L−1 for further use. The as-prepared AuNPs solution was mixed with different concentrations (0–2 μmol/L) of melamine solution, and the mixture liquid was incubated for 15 min at room temperature. Then, 100 μL CPNs was injected into the above liquid and diluted to 4 μg/mL with PBS (pH = 7). Finally, the above mixture was in a still state for 10 min before the spectral measurement.

2.5. Pretreatment of Real Samples

Milk powder was firstly processed according to the previous reports [11,33]. Briefly, 2 g of milk powder was fully dissolved in 5 mL of acetonitrile and 15 mL of 1% (w/v) trichloroacetic acid. Then the mixed liquid was ultrasonically treated and centrifuged at 10,000 rpm for 15 min. Lastly, the liquid was filtered by a 0.22 μm filter, and further diluted 25-fold to acquire the testing samples.

3. Results and Discussion

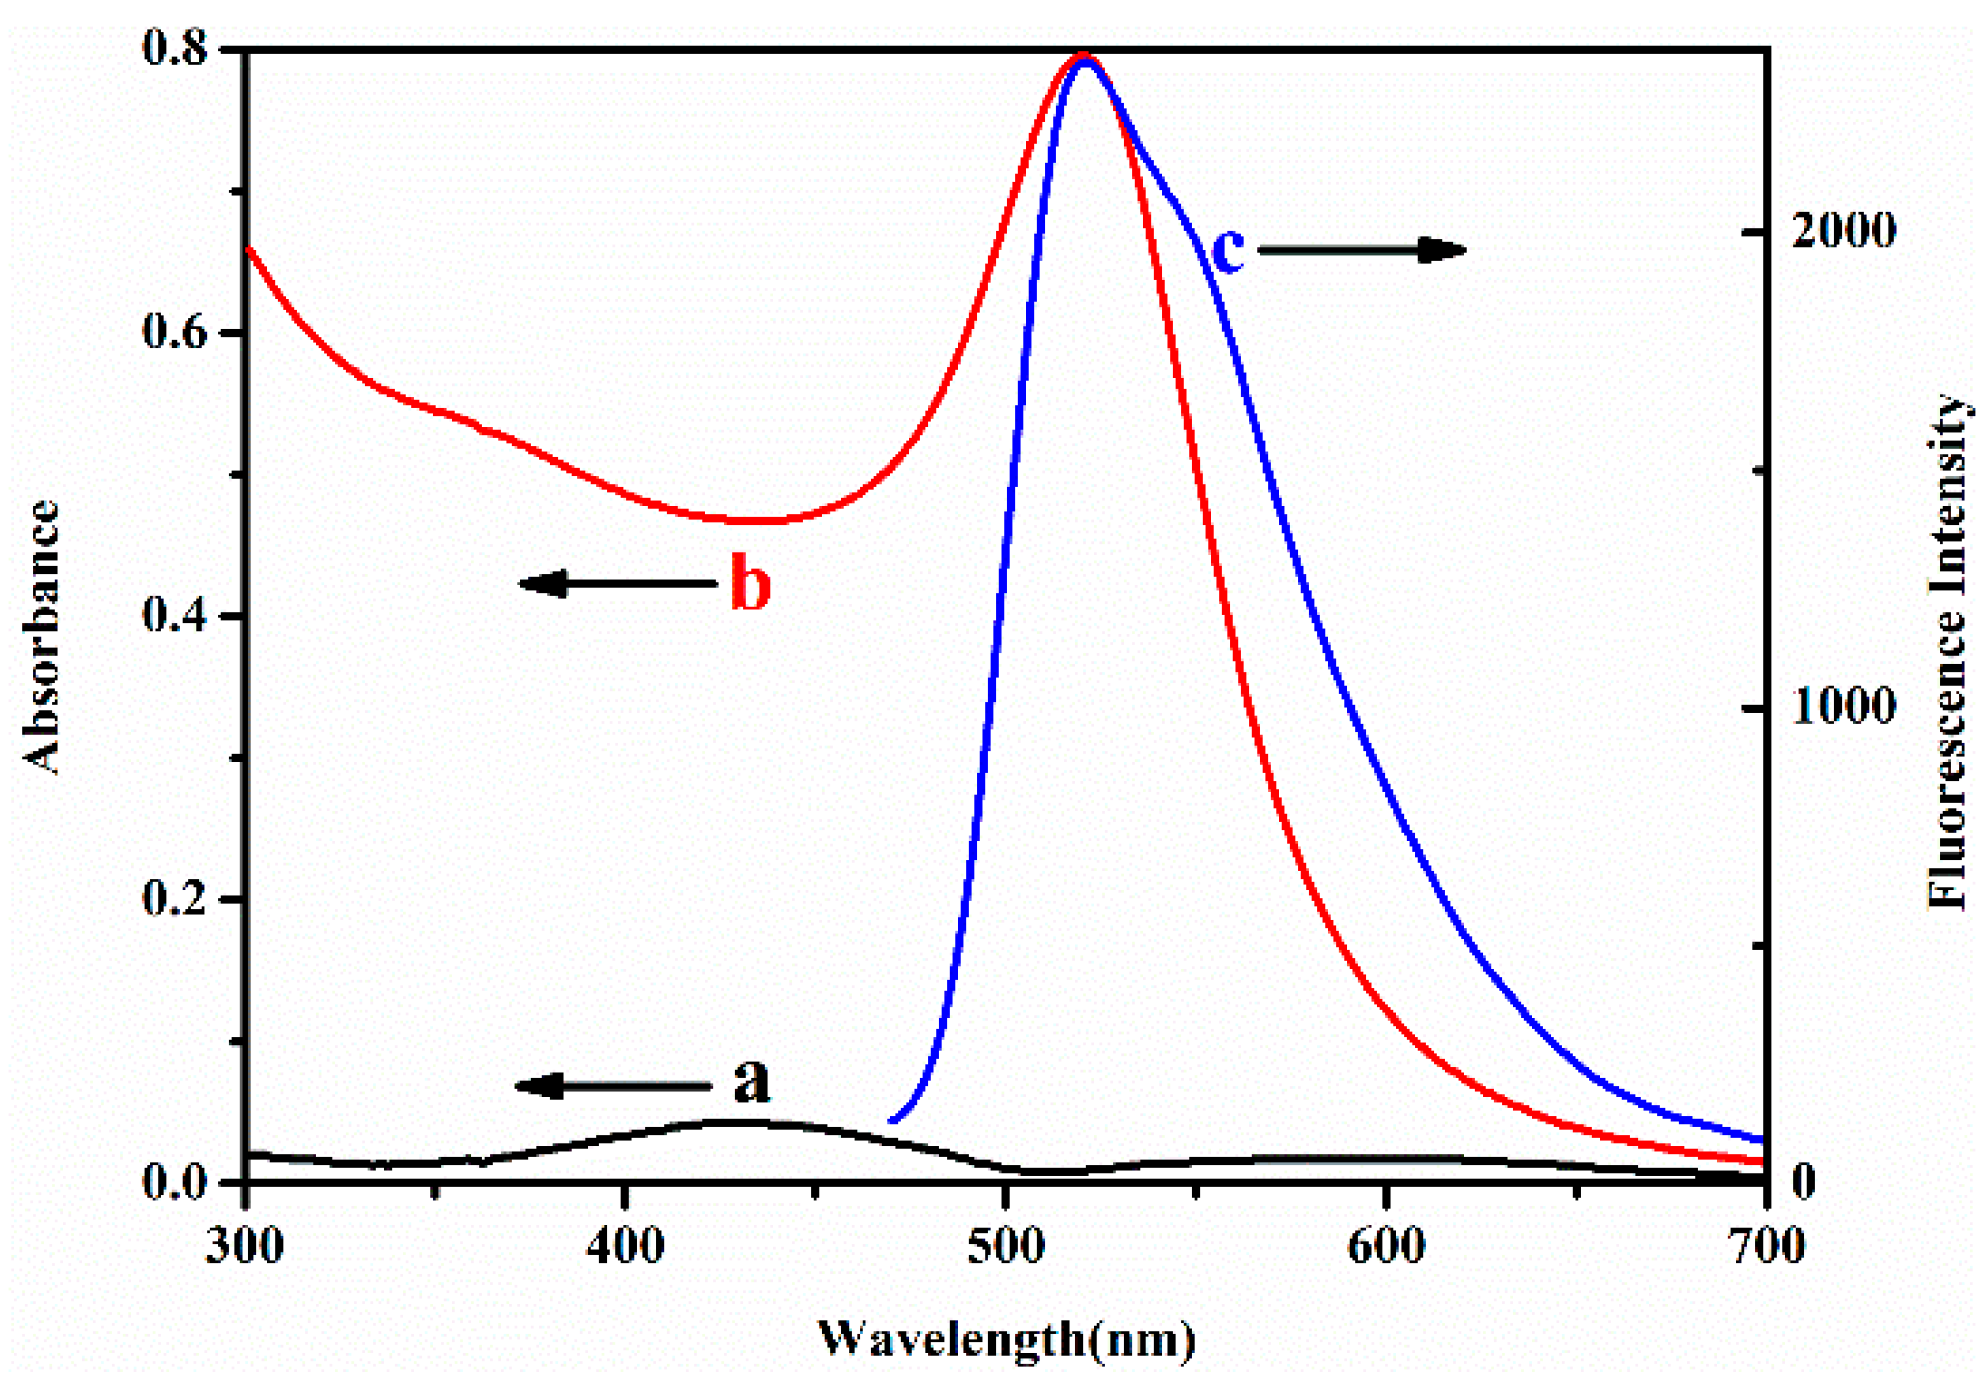
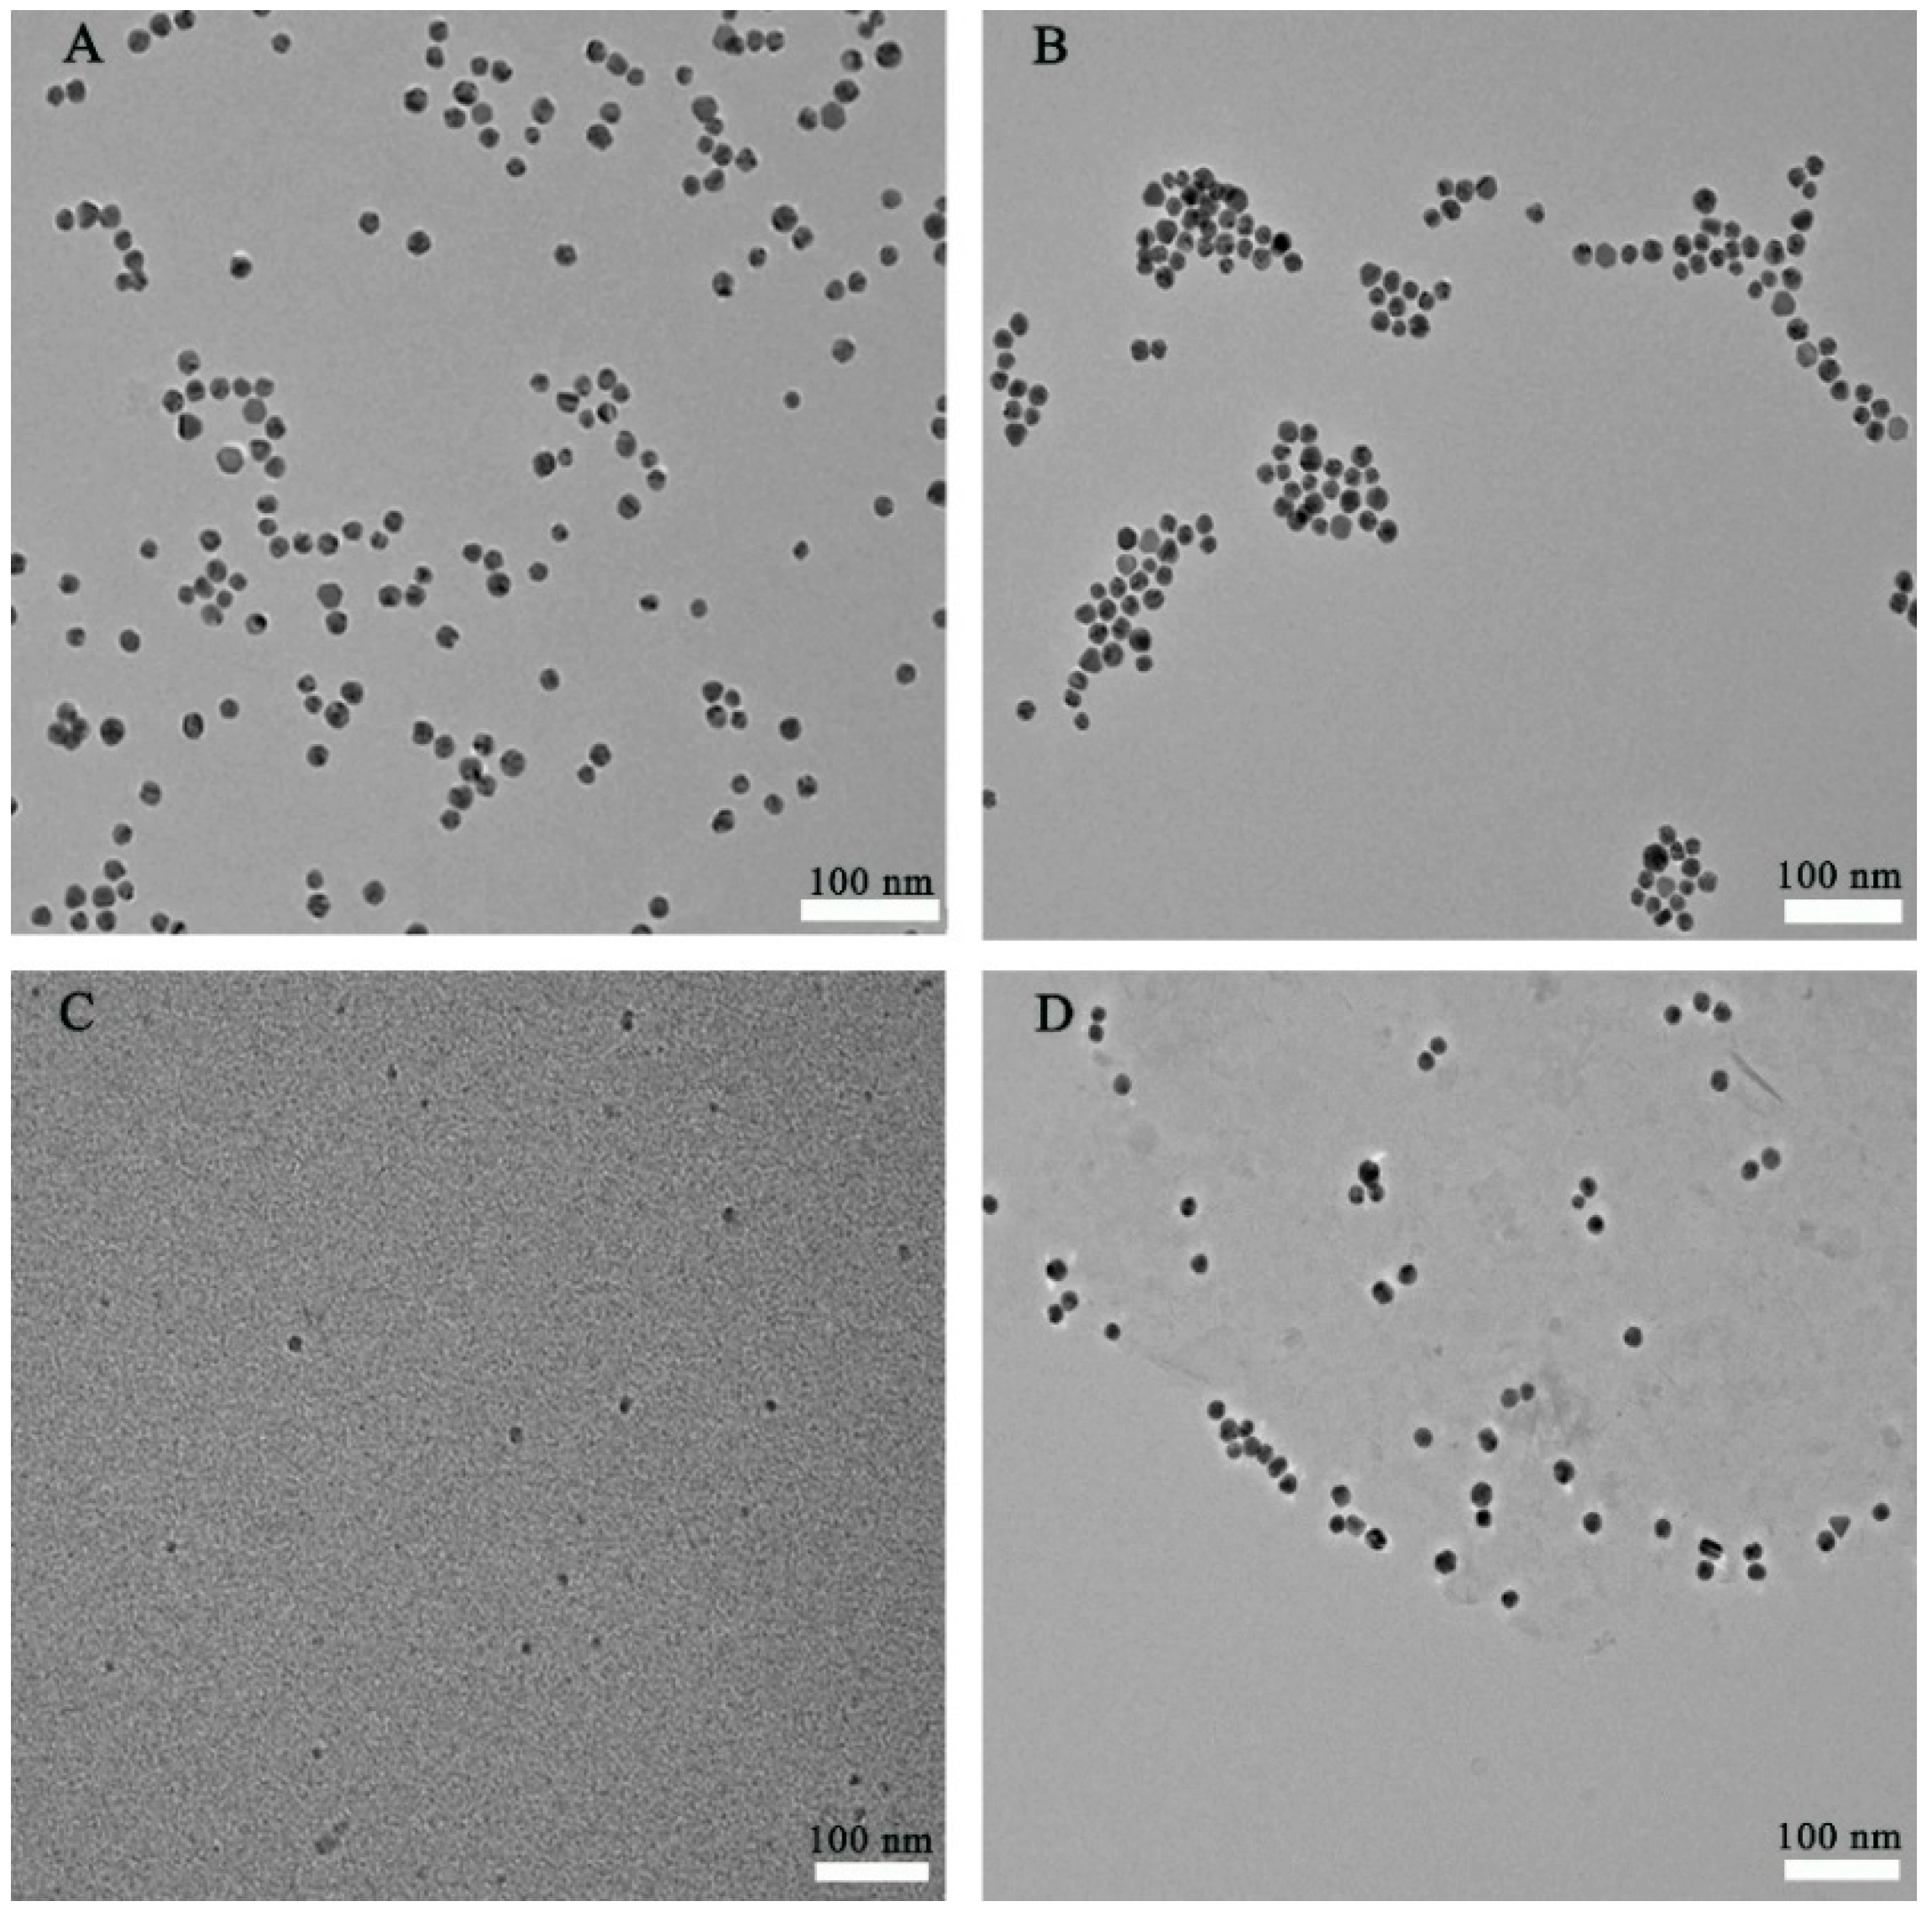
3.1. Optical Characteristics of AuNPs and CPNs

The AuNPs were prepared by the reported method [34]. The as-prepared AuNPs was negatively charged with a zeta potential of 8.43 mV (Figure S2a). The absorption and fluorescence emission spectra of AuNPs and CPNs were measured and shown in Figure 1. A broad overlap from 480 to 600 nm between them was found, which implied that the FRET may occur between CPNs (donor) and AuNPs (acceptor). Consequently, the fluorescence intensity of CPNs may be evidently quenched or reduced if CPNs and AuNPs coexist.
To identify the above hypothesis, the fluorescence intensities of CPNs were investigated with the increased concentrations of AuNPs (Figure 2). The energy transfer efficiency (E) was measured and gained by the following equation [34]:
  E = 1 I / I 0  
where I and I0 are the fluorescence intensity of the donor (CPNs) after and before the addition of acceptor (AuNPs), respectively. E obtained the value of 82.1% according to Equation (1). The fluorescence intensities of CPNs were contravariant to the concentrations of AuNPs. The fluorescence quenching efficiency of CPNs by AuNPs was measured by the Stern–Volmer equation [35]:
  F 0 F = K S V × C Q + 1  
where F0 and F denoted the fluorescence intensity of CPNs before and after the addition of AuNPs, respectively. CQ is the concentration of AuNPs. The curve of F0/F to CQ was linearly fitted and shown in Figure 2b, and the Stern–Volmer equation is described below:
F 0 F = 1.635   C Q + 1     ( R 2   =   0.9916 )  
KSV was the quenching constant and gained to be 1.635 × 10⁹ (mol−1 L)−1. This analytical parameter is better than those in previous reports [36,37].

3.2. Interaction of AuNPs-CPNs with Melamine

The color variation and absorption spectra of AuNPs solutions with the increased concentrations of melamine are shown in Figure 3a,b. The obvious color variations from red to deep blue were found in the concentrations of melamine from 0.4 to 1.6 μM. The characteristic absorption of AuNPs gradually decreased at 522 nm and showed slightly red-shifted. Meanwhile, a longer wavelength absorption band (700 nm) appeared gradually. The possible reason may be that melamine could strongly coordinate to AuNPs by the amine groups, and finally lead to the aggregation and destabilization of dispersed AuNPs [38,39,40]. Meanwhile, the red-shifted absorption of Au NPs declined the spectral overlap between the emission spectrum from CPNs and the absorption spectrum of AuNPs and reduced E.
A good linear relationship between the decreased absorbance at 522 nm and the concentrations of melamine was gained from 0.1–1.5 μmol/L (R2 = 0.9949, Figure 3c). The relative standard deviation was 0.8% for seven repeated measurements, which illustrated the reliability of the proposed method. The limit of detection (LOD = 3δ/K, where K represents the slope and δ is the standard deviation) was measured to be 6.8 nmol/L. This analytical parameter is better than those in previous reports (Table 1).
TEM observations could further confirm the aggregation of dispersed AuNPs owing to the addition of melamine. From Figure 4A, the original AuNPs were uniform in size and spherical in shape. After mixing with CPNs, AuNPs were still in a scattered state, indicating that the addition of CPNs did not affect the dispersity of AuNPs (Figure 4D). However, obvious aggregation of AuNPs could be found after adding melamine (Figure 4B). The DLS data also indicated the same conclusion because the average sizes of AuNPs were 24 and 58.8 nm in the absence and presence of melamine (Figure S1a,b), respectively. The results were fully consistent with the spectral variation in Figure 3. Hence, the fluorescence intensity of CPNs could be monitored in the AuNPs-CPNs system by FRET, which afforded a feasible and new strategy for melamine detection. Actually, the addition of melamine led to the aggregation of AuNPs accompanying color change, which have been used for the visual sensing for melamine detection in infants and liquid milk [18]. However, these colorimetric techniques usually displayed lower sensitivity to melamine in comparison with fluorescence analytical methods. It is greatly hopeful to develop a simple way based on the FRET method with the higher sensitivity and the lower detection limit, and fluorescence signals can replace the variation of absorption.

3.3. FRET-Based AuNPs-CPNs Emission Response to Melamine

The FRET system of CPNs-AuNPs would be modulated by the concentrations of melamine, and the fluorescence intensity of CPNs would change accordingly because melamine congregated the AuNPs (Scheme 1). The relationship between melamine and the FRET system was further investigated to validate the competition effect between CPNs and melamine. As displayed in Figure 5, it was proved that CPNs and melamine did not directly interact because the absorption and fluorescence intensity of CPNs (curves a and a’ in Figure 5) were identical to the mixture of CPNs and melamine (curves b and b’ in Figure 5). The characteristic absorption of AuNPs displayed no distinct variation before and after adding CPNs (curve c and d in Figure 5a), indicating that CPNs and AuNPs were not directly interacting. In addition, the characteristic absorption of AuNPs-melamine were identical in the absence or presence of CPNs (curves e and f in Figure 5a), which indicated that the aggregation of AuNPs was the result of the addition of melamine. The same conclusion could be got by no change for the average size of AuNPs-melamine before and after adding CPNs (Figure S1b,d). The fluorescence intensity of CPNs-AuNPs was evidently quenched owing to the FRET (curve c’ in Figure 5b) when CPNs and AuNPs were mixed together. Nevertheless, the addition of melamine could distinctly recover the fluorescence of CPNs curve d’ in Figure 5b. In addition, the fluorescence quantum yields (Фs) of CPNs in the absence and presence of AuNPs and melamine have been calculated using a solution containing coumarin 307 (Ф = 0.56, in methanol) standard as the reference according to the equation reported [42]. The values of Фs were listed in Table 2. The change of Фs was similar to that of fluorescence. With the addition of AuNPs, Фs of CPNs reduced from 0.22 to 0.0050. However, further adding melamine, Фs of CPNs were restored. But no obvious variation was found for Фs of CPN in the presence of melamine.
The present technique for melamine detection was further researched under the optimal conditions. From Figure 6a, the fluorescence emission intensities of AuNPs-CPNs were recovered gradually with the increased concentrations of melamine. The increased fluorescence intensity and melamine concentrations had a fine linear relationship from 5 nmol/L to 1.9 μmol/L (R2 = 0.9915, Figure 6b). The detection limit was calculated to be 1.7 nmol/L. This analytical parameter is very low in comparison with the reported literatures (Table 1). The relative standard deviation by operating 10 repeated measurements of melamine (1.9 μmol/L) was 1.2%, which illustrated that the fluorescence response of AuNPs-CPNs toward melamine was highly reproducible.

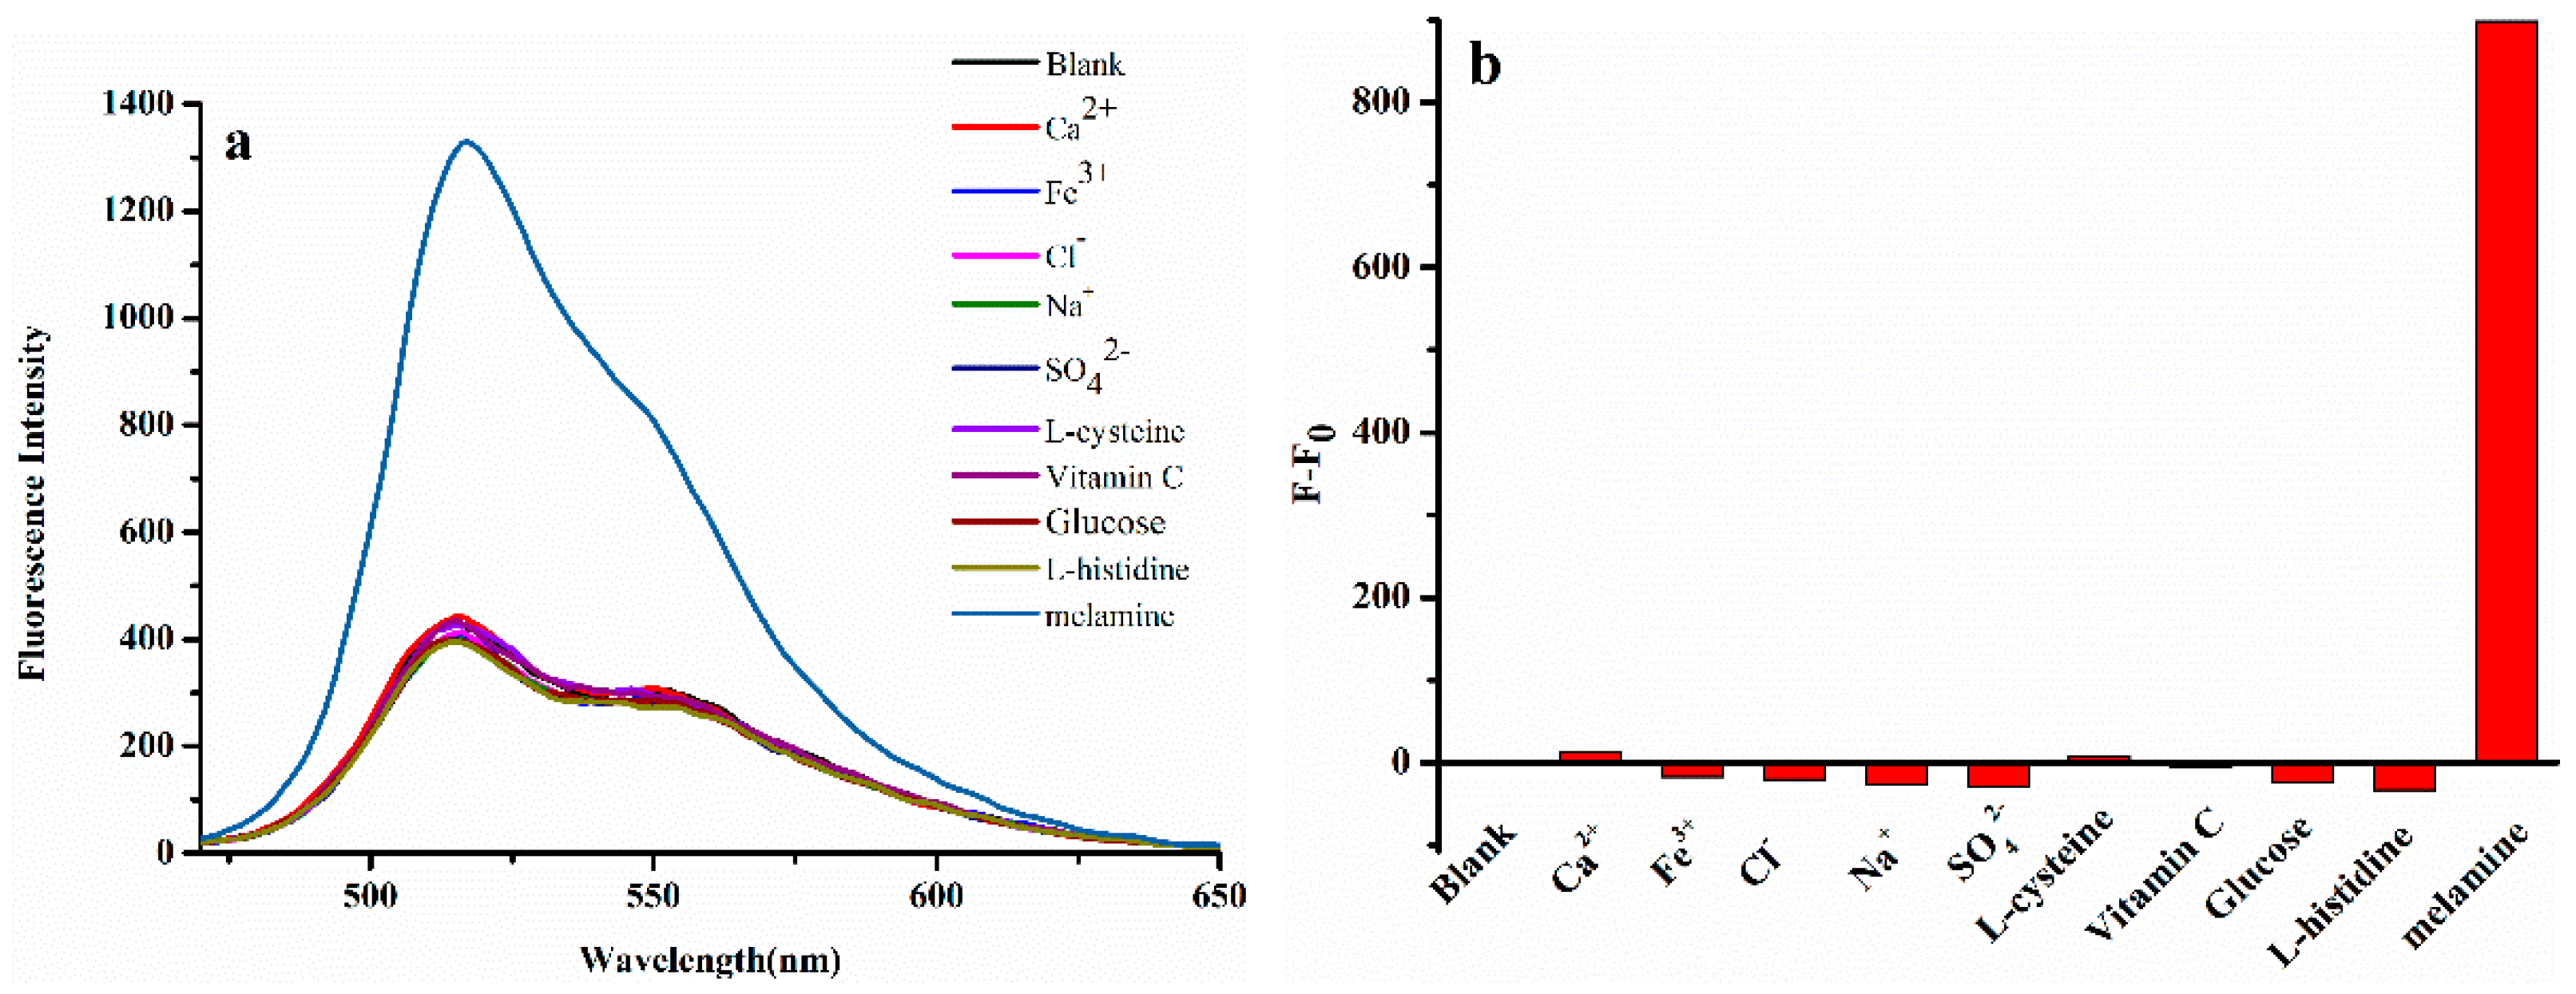
3.4. Selective Studies and the Application to Real Samples

To evaluate the method used in the specific detection of melamine, the potential interfering substances in real sample and melamine (2 μmol/L), such as Ca2+, Fe3+, Na+, SO42−, Cl, vitamin C, cysteine, histidine and glucose, were examined, respectively. From Figure 7a,b, no obvious interferences were found, which indicated that the AuNPs-CPNs towards melamine detection is highly selective.
To further prove the present method, the amount of melamine was directly spiked into milk powder after sample pretreatment, and the melamine-doped milk samples were further handled by the procedure described in Section 2.4. The analytical results are given in Table 3. The recovered values of the three milk powder samples varied from 95.93% to 100.8%. These analytical parameters are better than those in previous reports (Table 1), which indicated that the proposed method was suitable for melamine detection in real samples.

4. Conclusions

A new and effective FRET based on the system of CPNs-AuNPs was developed for melamine detection. In the presence of melamine, the FRET between AuNPs and CPNs was gradually inhibited, resulting in the fluorescence recovery of CPNs. Melamine could be detected with a lower detection limit of 1.7 nmol/L under the optimum experimental conditions. Moreover, the proposed technique was used for the detection of melamine in real samples with the satisfactory experimental results.

Supplementary Materials

Author Contributions

X.Z., J.Y., and C.Q. conceived and planned the experiments. C.Z., Z.G. and Q.W. carried out the experiments and contributed to sample preparation. X.Z., J.Y., C.Q., Q.L. and C.Z. contributed to the interpretation of the results. C.Z. took the lead in writing Original Draft Preparation. All authors provided critical feedback and helped shape the research, analysis and manuscript. X.Z. and Q.L. are the project administration and funding acquisition.

Funding

This research was funded by the National Natural Science Foundation of China grant number (51403111, 11774188).

Acknowledgments

This project was supported by the National Natural Science Foundation of China (NSFC 51403111, 11774188). We are particularly grateful to the funding supporting from Qilu University of Technology for talents.

Conflicts of Interest

There is no conflict of interest regarding the publication of this manuscript.

References

  1. Du, J.; Wang, Y.; Zhang, W. Gold nanoparticles-based chemiluminescence resonance energy transfer for ultrasensitive detection of melamine. Spectrochim. Acta A Mol. Biomol. Spectrosc. 2015, 149, 698–702. [Google Scholar] [CrossRef] [PubMed]
  2. Zhao, J.; Wu, H.; Jiang, J.; Zhao, S. Label-free fluorescence turn-on sensing for melamine based on fluorescence resonance energy transfer between CdTe/CdS quantum dots and gold nanoparticles. RSC Adv. 2014, 4, 61667–61672. [Google Scholar] [CrossRef]
  3. Cao, X.; Shen, F.; Zhang, M.; Guo, J.; Luo, Y.; Xu, J.; Li, Y.; Sun, C. Highly sensitive detection of melamine based on fluorescence resonance energy transfer between rhodamine B and gold nanoparticles. Dyes Pigm. 2014, 111, 99–107. [Google Scholar] [CrossRef]
  4. Wu, Q.; Long, Q.; Li, H.; Zhang, Y.; Yao, S. An upconversion fluorescence resonance energy transfer nanosensor for one step detection of melamine in raw milk. Talanta 2015, 136, 47–53. [Google Scholar] [CrossRef] [PubMed]
  5. Dai, H.; Shi, Y.; Wang, Y.; Sun, Y.; Hu, J.; Ni, P.; Li, Z. A carbon dot based biosensor for melamine detection by fluorescence resonance energy transfer. Sens. Actuators B Chem. 2014, 202, 201–208. [Google Scholar] [CrossRef]
  6. Vaclavik, L.; Rosmus, J.; Popping, B.; Hajslova, J. Rapid determination of melamine and cyanuric acid in milk powder using direct analysis in real time-time-of-flight mass spectrometry. J. Chromatogr. A 2010, 1217, 4204–4211. [Google Scholar] [CrossRef] [PubMed]
  7. Liang, R.; Zhang, R.; Qin, W. Potentiometric sensor based on molecularly imprinted polymer for determination of melamine in milk. Sens. Actuators B Chem. 2009, 141, 544–550. [Google Scholar] [CrossRef] [Green Version]
  8. Gao, F.; Ye, Q.; Cui, P.; Zhang, L. Efficient fluorescence energy transfer system between CdTe-doped silica nanoparticles and gold nanoparticles for turn-on fluorescence detection of melamine. J. Agric. Food Chem. 2012, 60, 4550–4558. [Google Scholar] [CrossRef] [PubMed]
  9. Tsai, T.-H.; Thiagarajan, S.; Chen, S.-M. Detection of melamine in milk powder and human urine. J. Agric. Food Chem. 2010, 58, 4537–4544. [Google Scholar] [CrossRef] [PubMed]
  10. Xue, M.; Wang, X.; Duan, L.; Gao, W.; Ji, L.; Tang, B. A new nanoprobe based on FRET between functional quantum dots and gold nanoparticles for fluoride anion and its applications for biological imaging. Biosens. Bioelectron. 2012, 36, 168–173. [Google Scholar] [CrossRef] [PubMed]
  11. Zhang, M.; Cao, X.; Li, H.; Guan, F.; Guo, J.; Shen, F.; Luo, Y.; Sun, C.; Zhang, L. Sensitive fluorescent detection of melamine in raw milk based on the inner filter effect of Au nanoparticles on the fluorescence of CdTe quantum dots. Food Chem. 2012, 135, 1894–1900. [Google Scholar] [CrossRef] [PubMed]
  12. Chatterjee, S.; Nandi, S.; Bhattacharya, S.C. Fluorescence resonance energy transfer from Fluorescein to Safranine T in solutions and in micellar medium. J. Photochem. Photobiol. A 2005, 173, 221–227. [Google Scholar] [CrossRef]
  13. Chen, J.; Zheng, A.; Chen, A.; Gao, Y.; He, C.; Kai, X.; Wu, G.; Chen, Y. A functionalized gold nanoparticles and Rhodamine 6G based fluorescent sensor for high sensitive and selective detection of mercury (II) in environmental water samples. Anal. Chim. Acta 2007, 599, 134–142. [Google Scholar] [CrossRef] [PubMed]
  14. Giovannozzi, A.M.; Rolle, F.; Sega, M.; Abete, M.C.; Marchis, D.; Rossi, A.M. Rapid and sensitive detection of melamine in milk with gold nanoparticles by Surface Enhanced Raman Scattering. Food Chem. 2014, 159, 250–256. [Google Scholar] [CrossRef] [PubMed]
  15. Chi, H.; Liu, B.; Guan, G.; Zhang, Z.; Han, M.-Y. A simple, reliable and sensitive colorimetric visualization of melamine in milk by unmodified gold nanoparticles. Analyst 2010, 135, 1070–1075. [Google Scholar] [CrossRef] [PubMed]
  16. Zhao, W.; Brook, M.A.; Li, Y. Design of gold nanoparticle-based colorimetric biosensing assays. Chembiochem 2008, 9, 2363–2371. [Google Scholar] [CrossRef] [PubMed]
  17. Kumar, N.; Seth, R.; Kumar, H. Colorimetric detection of melamine in milk by citrate-stabilized gold nanoparticles. Anal. Biochem. 2014, 456, 43–49. [Google Scholar] [CrossRef] [PubMed]
  18. Li, L.; Li, B.; Cheng, D.; Mao, L. Visual detection of melamine in raw milk using gold nanoparticles as colorimetric probe. Food Chem. 2010, 122, 895–900. [Google Scholar] [CrossRef]
  19. Jana, N.R.; Gearheart, L.; Murphy, C.J. Seeding Growth for Size Control of 5−40 nm Diameter Gold Nanoparticles. Langmuir 2001, 17, 6782–6786. [Google Scholar] [CrossRef]
  20. Liu, J.; Lu, Y. Fast colorimetric sensing of adenosine and cocaine based on a general sensor design involving aptamers and nanoparticles. Angew. Chem. Int. Ed. 2005, 45, 90–94. [Google Scholar] [CrossRef] [PubMed]
  21. Lyu, Y.; Fang, Y.; Miao, Q.; Zhen, X.; Ding, D.; Pu, K. Intraparticle Molecular orbital engineering of semiconducting polymer nanoparticles as amplified theranostics for in vivo photoacoustic imaging and photothermal therapy. ACS Nano 2016, 10, 4472–4481. [Google Scholar] [CrossRef] [PubMed]
  22. Wu, C.; Hansen, S.J.; Hou, Q.; Yu, J.; Zeigler, M.; Jin, Y.; Burnham, D.R.; McNeill, J.D.; Olson, J.M.; Chiu, D.T. Design of highly emissive polymer dot bioconjugates for in vivo tumor targeting. Angew. Chem. Int. Ed. 2011, 123, 3492–3496. [Google Scholar] [CrossRef]
  23. Zhen, X.; Zhang, C.; Xie, C.; Miao, Q.; Lim, K.L.; Pu, K. Intraparticle energy level alignment of semiconducting polymer nanoparticles to amplify chemiluminescence for ultrasensitive in vivo imaging of reactive oxygen species. ACS Nano 2016, 10, 6400–6409. [Google Scholar] [CrossRef] [PubMed]
  24. Xie, C.; Uppuyuri, P.K.; Zhen, X.; Pramanik, M.; Pu, K. Self-quenched semiconducting polymer nanoparticles for amplified in vivo photoacoustic imaging. Biomaterials 2017, 119, 1–8. [Google Scholar] [CrossRef] [PubMed]
  25. Pu, K.; Shuhendler, A.J.; Valta, M.P.; Cui, L.; Saar, M.; Peehl, D.M.; Rao, J. Phosphorylcholine-coated semiconducting polymer nanoparticles as rapid and efficient labeling agents for in vivo cell tracking. Adv. Healthcare Mater. 2014, 3, 1292–1298. [Google Scholar] [CrossRef] [PubMed]
  26. Geng, J.; Sun, C.; Liu, J.; Liao, L.-D.; Yuan, Y.; Thakor, N.; Wang, J.; Liu, B. Biocompatible conjugated polymer nanoparticles for efficient photothermal tumor therapy. Small 2015, 11, 1603–1610. [Google Scholar] [CrossRef] [PubMed]
  27. Macneill, C.M.; Coffin, R.C.; Carroll, D.L.; Levi-Polyachenko, N.H. Low band gap donor-acceptor conjugated polymer nanoparticles and their NIR-mediated thermal ablation of cancer cells. Macromol. Biosci. 2013, 13, 28–34. [Google Scholar] [CrossRef] [PubMed]
  28. Gao, F.; Ye, Q.; Cui, P.; Chen, X.; Li, M.; Wang, L. Selective “turn-on” fluorescent sensing for biothiols based on fluorescence resonance energy transfer between acridine orange and gold nanoparticles. Anal. Methods 2011, 3, 1180–1185. [Google Scholar] [CrossRef]
  29. Fu, X.; Liu, Y.; Wu, Z.; Zhang, H. Highly Sensitive and Naked Eye Dual-readout Method for ʟ-Cysteine Detection Based on the NSET of Fluorophore Functionalized Gold Nanoparticles. Bull. Korean Chem. Soc. 2014, 35, 1159–1164. [Google Scholar] [CrossRef] [Green Version]
  30. Zhu, Y.; Zhang, X.; Qin, Y.N.; Liu, Z.E. The Preparation and Fluorescence of Conjugated Polymer Nanoparticles with Triphenylamin Derivatives. Int. Conf. Mater. Sci. Appl. 2015, 3, 181–185. [Google Scholar] [CrossRef]
  31. Wang, C.; Sun, J.; Mei, H.; Gao, F. Organic semiconductor polymer nanodots as a new kind of off-on fluorescent probe for sulfide. Microchim. Acta 2016, 184, 445–451. [Google Scholar] [CrossRef]
  32. Wu, C.; Jin, Y.; Schneider, T.; Burnham, D.R.; Smith, P.B.; Chiu, D.T. Ultrabright and Bioorthogonal Labeling of Cellular Targets Using Semiconducting Polymer Dots and Click Chemistry. Angew. Chem. Int. Ed. 2010, 122, 9626–9630. [Google Scholar] [CrossRef] [Green Version]
  33. Cao, X.; Shen, F.; Zhang, M.; Guo, J.; Luo, Y.; Li, X.; Liu, H.; Sun, C.; Liu, J. Efficient inner filter effect of gold nanoparticles on the fluorescence of CdS quantum dots for sensitive detection of melamine in raw milk. Food Control 2013, 34, 221–229. [Google Scholar] [CrossRef]
  34. Frens, G. Controlled Nucleation for the Regulation of the Particle Size in Monodisperse Gold Suspensions. Nat. Phys. Sci. 1973, 241, 20–22. [Google Scholar] [CrossRef]
  35. Tang, G.; Du, L.; Su, X. Detection of melamine based on the fluorescence resonance energy transfer between CdTe QDs and Rhodamine B. Food Chem. 2013, 141, 4060–4065. [Google Scholar] [CrossRef] [PubMed]
  36. Huang, S.; Wang, L.; Huang, C.; Hu, B.; Su, W.; Xiao, Q. Graphene quantum dot coupled with gold nanoparticle based “off-on” fluorescent probe for sensitive and selective detection of l-cysteine. Microchim. Acta 2016, 183, 1855–1864. [Google Scholar] [CrossRef]
  37. Guo, L.; Zhong, J.; Wu, J.; Fu, F.; Chen, G.; Chen, Y.; Zheng, X.; Lin, S. Sensitive turn-on fluorescent detection of melamine based on fluorescence resonance energy transfer. Analyst 2011, 136, 1659–1663. [Google Scholar] [CrossRef] [PubMed]
  38. Wang, H.; Zheng, C.; Dong, T.; Liu, K.; Han, H.; Liang, J. Wavelength Dependence of Fluorescence Quenching of CdTe Quantum Dots by Gold Nanoclusters. J. Phys. Chem. C 2013, 117, 3011–3018. [Google Scholar] [CrossRef]
  39. Kumar, A.; Mandal, S.; Selvakannan, P.R.; Pasricha, R.; Mandale, A.B.; Sastry, M. Investigation into the Interaction between Surface-Bound Alkylamines and Gold Nanoparticles. Langmuir 2003, 19, 6277–6282. [Google Scholar] [CrossRef] [PubMed]
  40. Ai, K.; Liu, Y.; Lu, L. Hydrogen-bonding recognition-induced color change of gold nanoparticles for visual detection of melamine in raw milk and infant formula. J. Am. Chem. Soc. 2009, 131, 9496–9497. [Google Scholar] [CrossRef] [PubMed]
  41. Venkatasami, G.; Sowa, J.R., Jr. A rapid, acetonitrile-free, HPLC method for determination of melamine in infant formula. Anal. Chim. Acta 2010, 665, 227–230. [Google Scholar] [CrossRef] [PubMed]
  42. Zhang, X.; Li, L.; Liu, Y. Fluorescent detection and imaging of Hg2+ using a novel phenanthroline derivative based single- and two-photon excitation. Mater. Sci. Eng. Carbon 2016, 59, 916–923. [Google Scholar] [CrossRef] [PubMed]
Scheme 1. The mechanism diagram of melamine detection by FRET based on CPNs-AuNPs; (a) the preparation process of CPNs; (b) the fluorescence of CPNs was quenched by the FRET of CPNs-AuNPs; (c) the fluorescence of CPNs was restored after adding melamine.
Polymers 10 00873 sch001
Figure 1. The absorption spectra of the CPNs (a) and AuNPs (b) and fluorescence emission spectrum of CPNs (c).
Polymers 10 00873 g001
Figure 2. (a) Fluorescence emission spectra of CPNs with the increased concentrations of AuNPs; (b) the linear fitting plot of F0/F values at 520 nm versus AuNPs concentrations from 0 to 2.370 nM, CPNs: 0.187 μM.
Polymers 10 00873 g002
Figure 3. (a) The visual color change of the AuNPs with different concentrations of melamine; they were marked on the tubes; (b) absorption spectra of CPNs-AuNPs with different concentrations of melamine. AuNPs: 2.37 nM; (c) a linear relationship (at 522 nm) between A0–A and melamine concentrations; A0 and A are the absorbance in the absence and presence of melamine, respectively.
Polymers 10 00873 g003
Figure 4. (A) TEM images of the original AuNPs; (B) TEM images of the AuNPs in the presence of melamine; (C) TEM images of the CPNs; (D) TEM images of the AuNPs in the presence of CPNs.
Polymers 10 00873 g004
Figure 5. (a) Absorption spectra; a: CPNs; b: CPNs and melamine; c: AuNPs; d: AuNPs and CPNs; e: AuNPs and melamine; f: mixture of CPNs, AuNPs and melamine; (b) fluorescence spectra; a’: CPNs; b’: CPNs and melamine; c’: AuNPs and CPNs; d’: mixture of CPNs, AuNPs and melamine; CPNs: 0.187 μM; AuNPs: 2.37 nM; melamine: 0.8 μM.
Polymers 10 00873 g005
Figure 6. (a) Fluorescence emission spectra of CPNs-AuNPs nanosensor with different concentrations of melamine from 0.05 to 19 × 10−7 mol/L. CPNs: 0.187 μM. AuNPs: 2.37 nM; (b) a linear relationship with respect to the enhanced fluorescence intensities and melamine concentrations.
Polymers 10 00873 g006
Figure 7. (a) Selectivity of the CPNs-AuNPs toward melamine; (b) the Bar graph of CPNs-AuNPs selectivity. The concentrations of interferences and melamine were both 2 μM.
Polymers 10 00873 g007
Table 1. Comparison of different methods for the determination of melamine.
MethodLOD (μM)Ref.Recovery (%)
HPLC0.79[41]97.2–101.2
Turn-off fluorescence CdTe quantum dots0.31[11]103–104
CdTe QDs and Rhodamine B0.01[35]99.2–104
FRET/carbon dots and Au nanoparticles0.036[5]90.5–111.4
FRET between CdTe/CdS QDs and AuNPs0.03[2]90.0–101
Au nanoparticles and Melamine0.0068This work (1)-
FRET/CPNs and Au nanoparticles0.0017This work (2)95.93–100.8
Table 2. The fluorescence quantum yields of CPNs under difference conditions.
ComponentsConcentration (nΜ)
(CPNs/AuNPs: /Melamine)
Ф
CPNs187/0/00.22
CPNs +Au NPs (1)187/1.184/00.022
CPNs +Au NPs (2)187/2.370/00.0050
CPNs + AuNPs + melamine (1)187/2.370/3000.0086
CPNs + AuNPs + melamine (2)187/2370/12000.016
CPNs + melamine187/0/12000.22
Ф: Fluorescence quantum yield.
Table 3. The application of the proposed method for melamine detection in milk samples spiked with different concentrations of melamine (n = 3, average value of three determinations).
SampleAmount Added (10−7 M)Amount Founded (10−7 M)Recovery (%)R.S.D. (%)
15.25.08097.745.0
21413.43095.934.1
31818.144100.82.7
R.S.D.: relative standard deviation.

