Highly-Loaded Thermoplastic Polyurethane/Lead Zirconate Titanate Composite Foams with Low Permittivity Fabricated using Expandable Microspheres


Abstract
:
1. Introduction
2. Materials and Methods
2.1. Materials
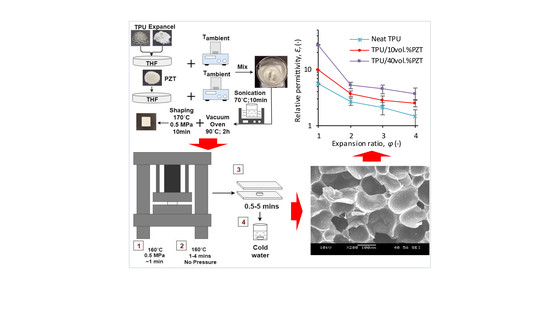
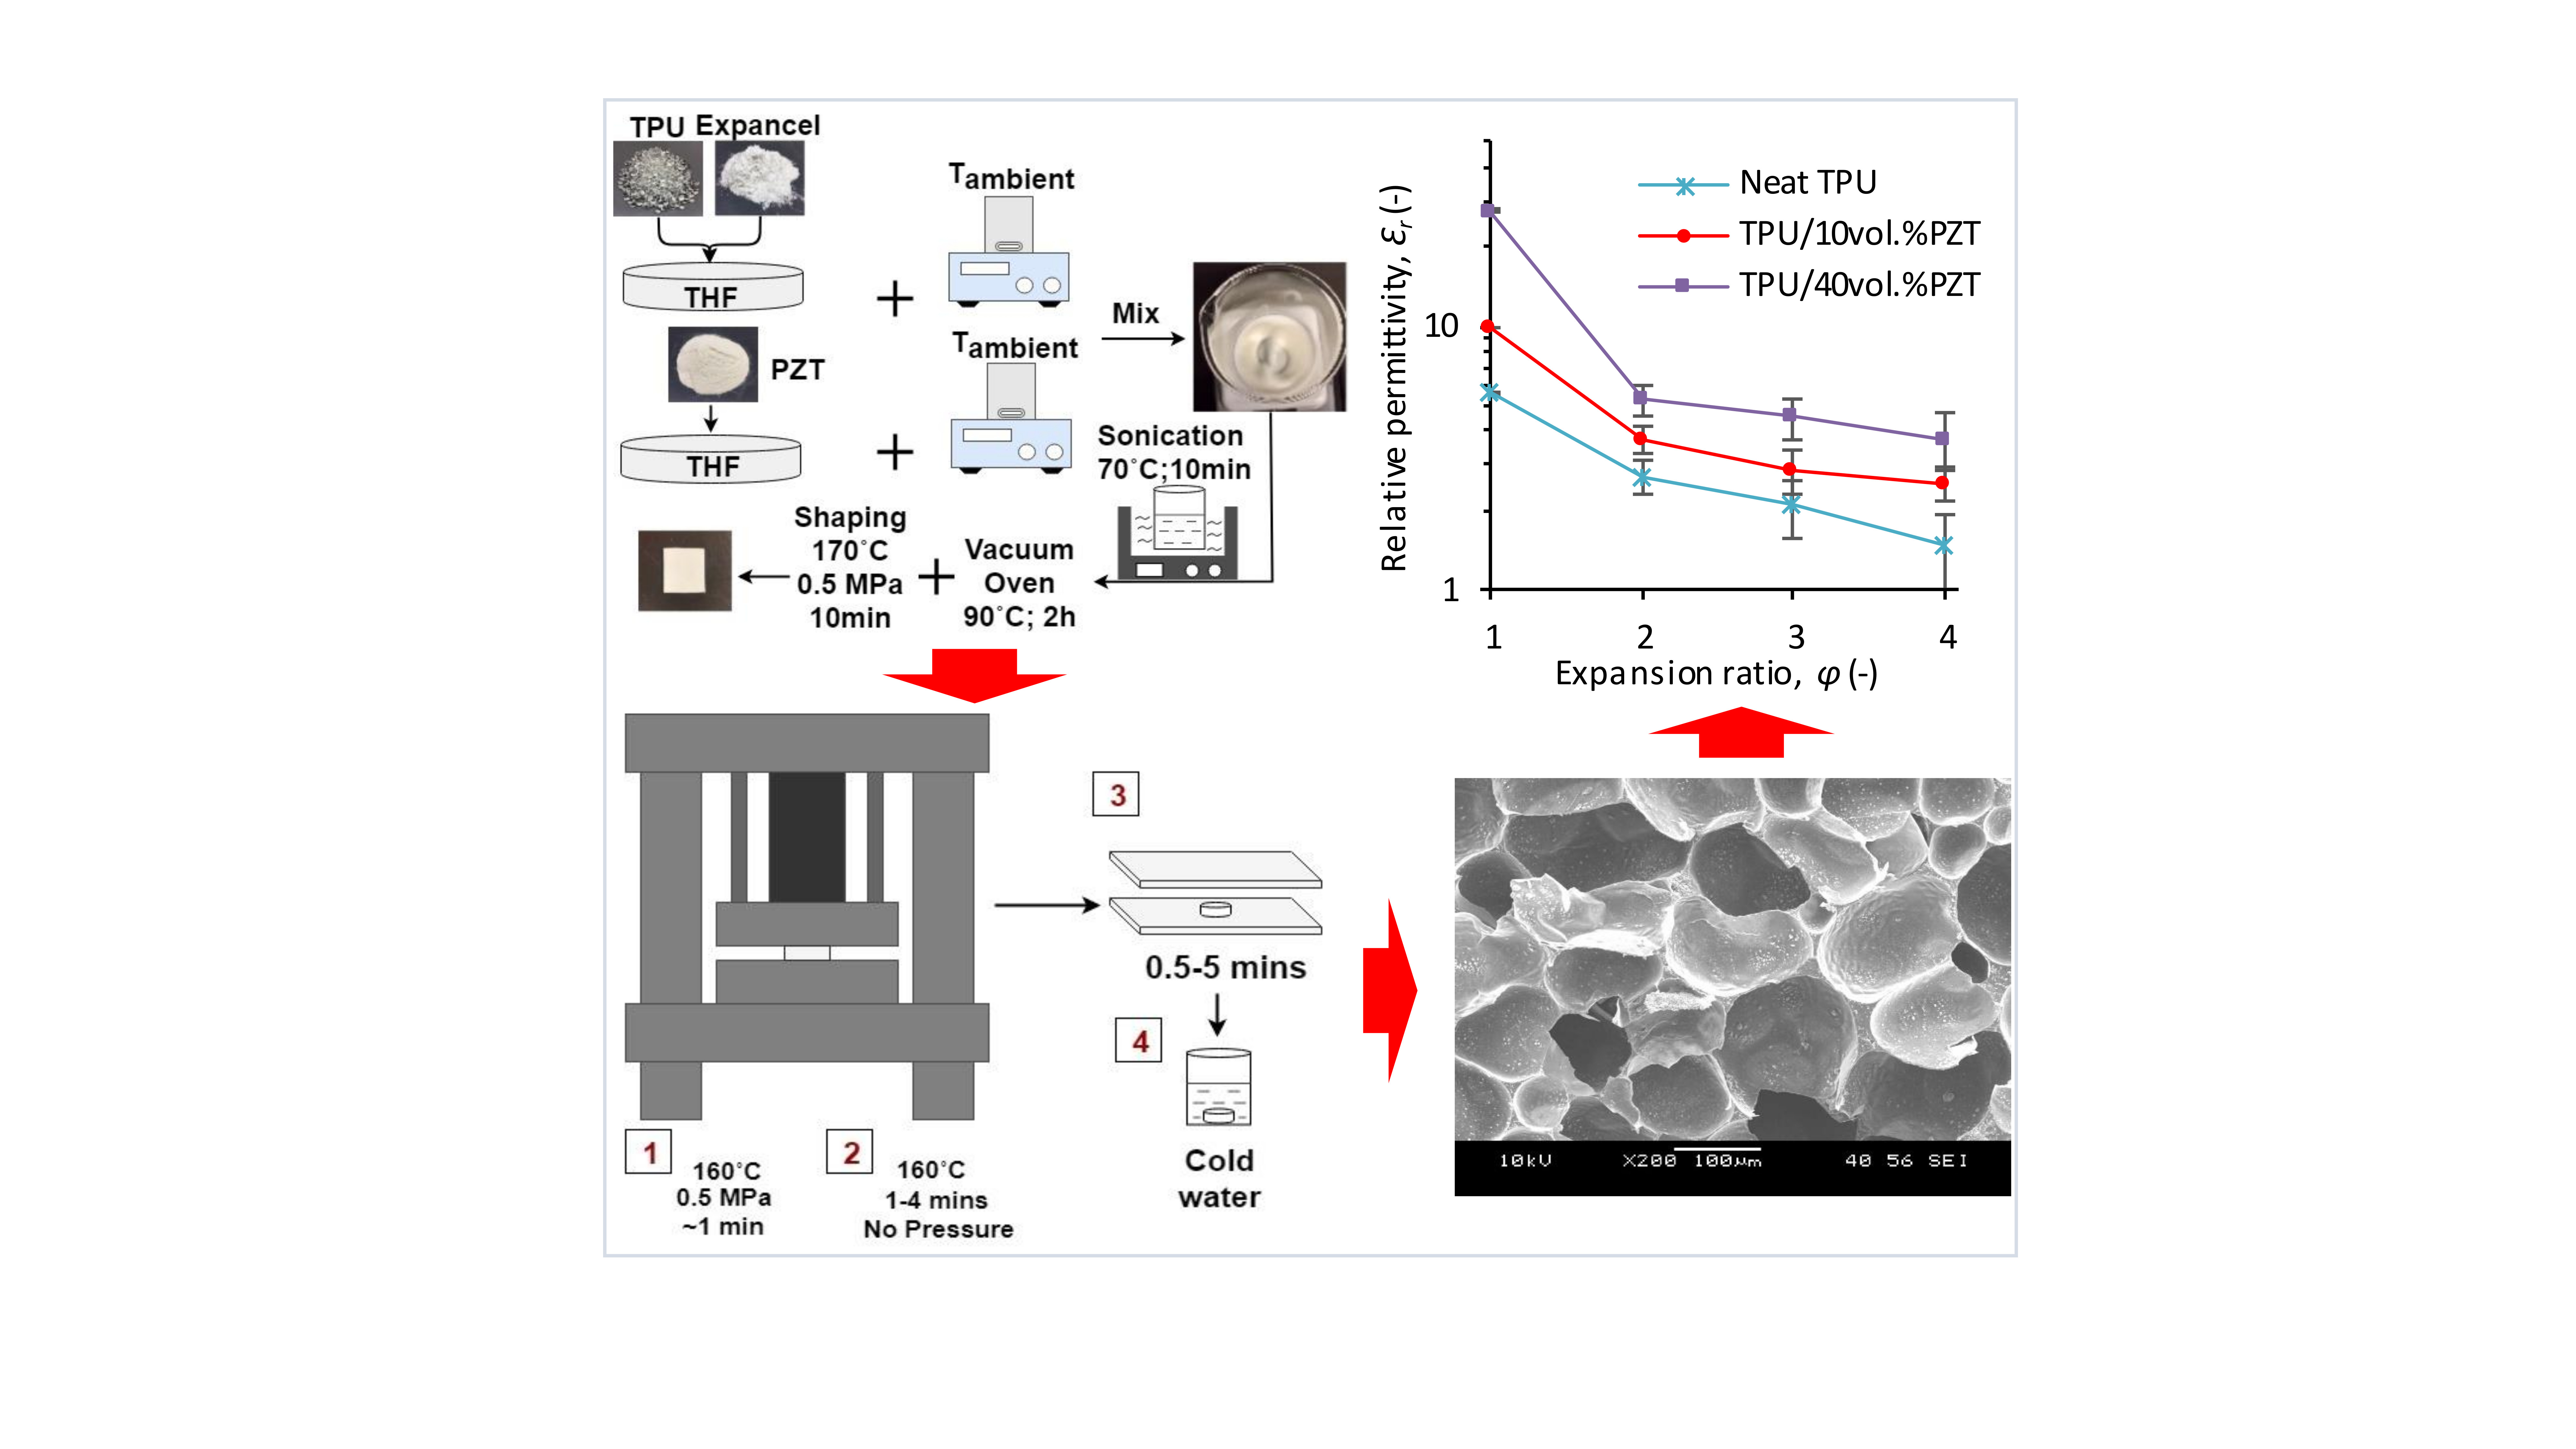
2.2. Preparation of TPU/PZT Composites
2.3. Fabrication of TPU/PZT Foams
2.4. Characterization
2.5. Permittivity Model for Ternary System
3. Results
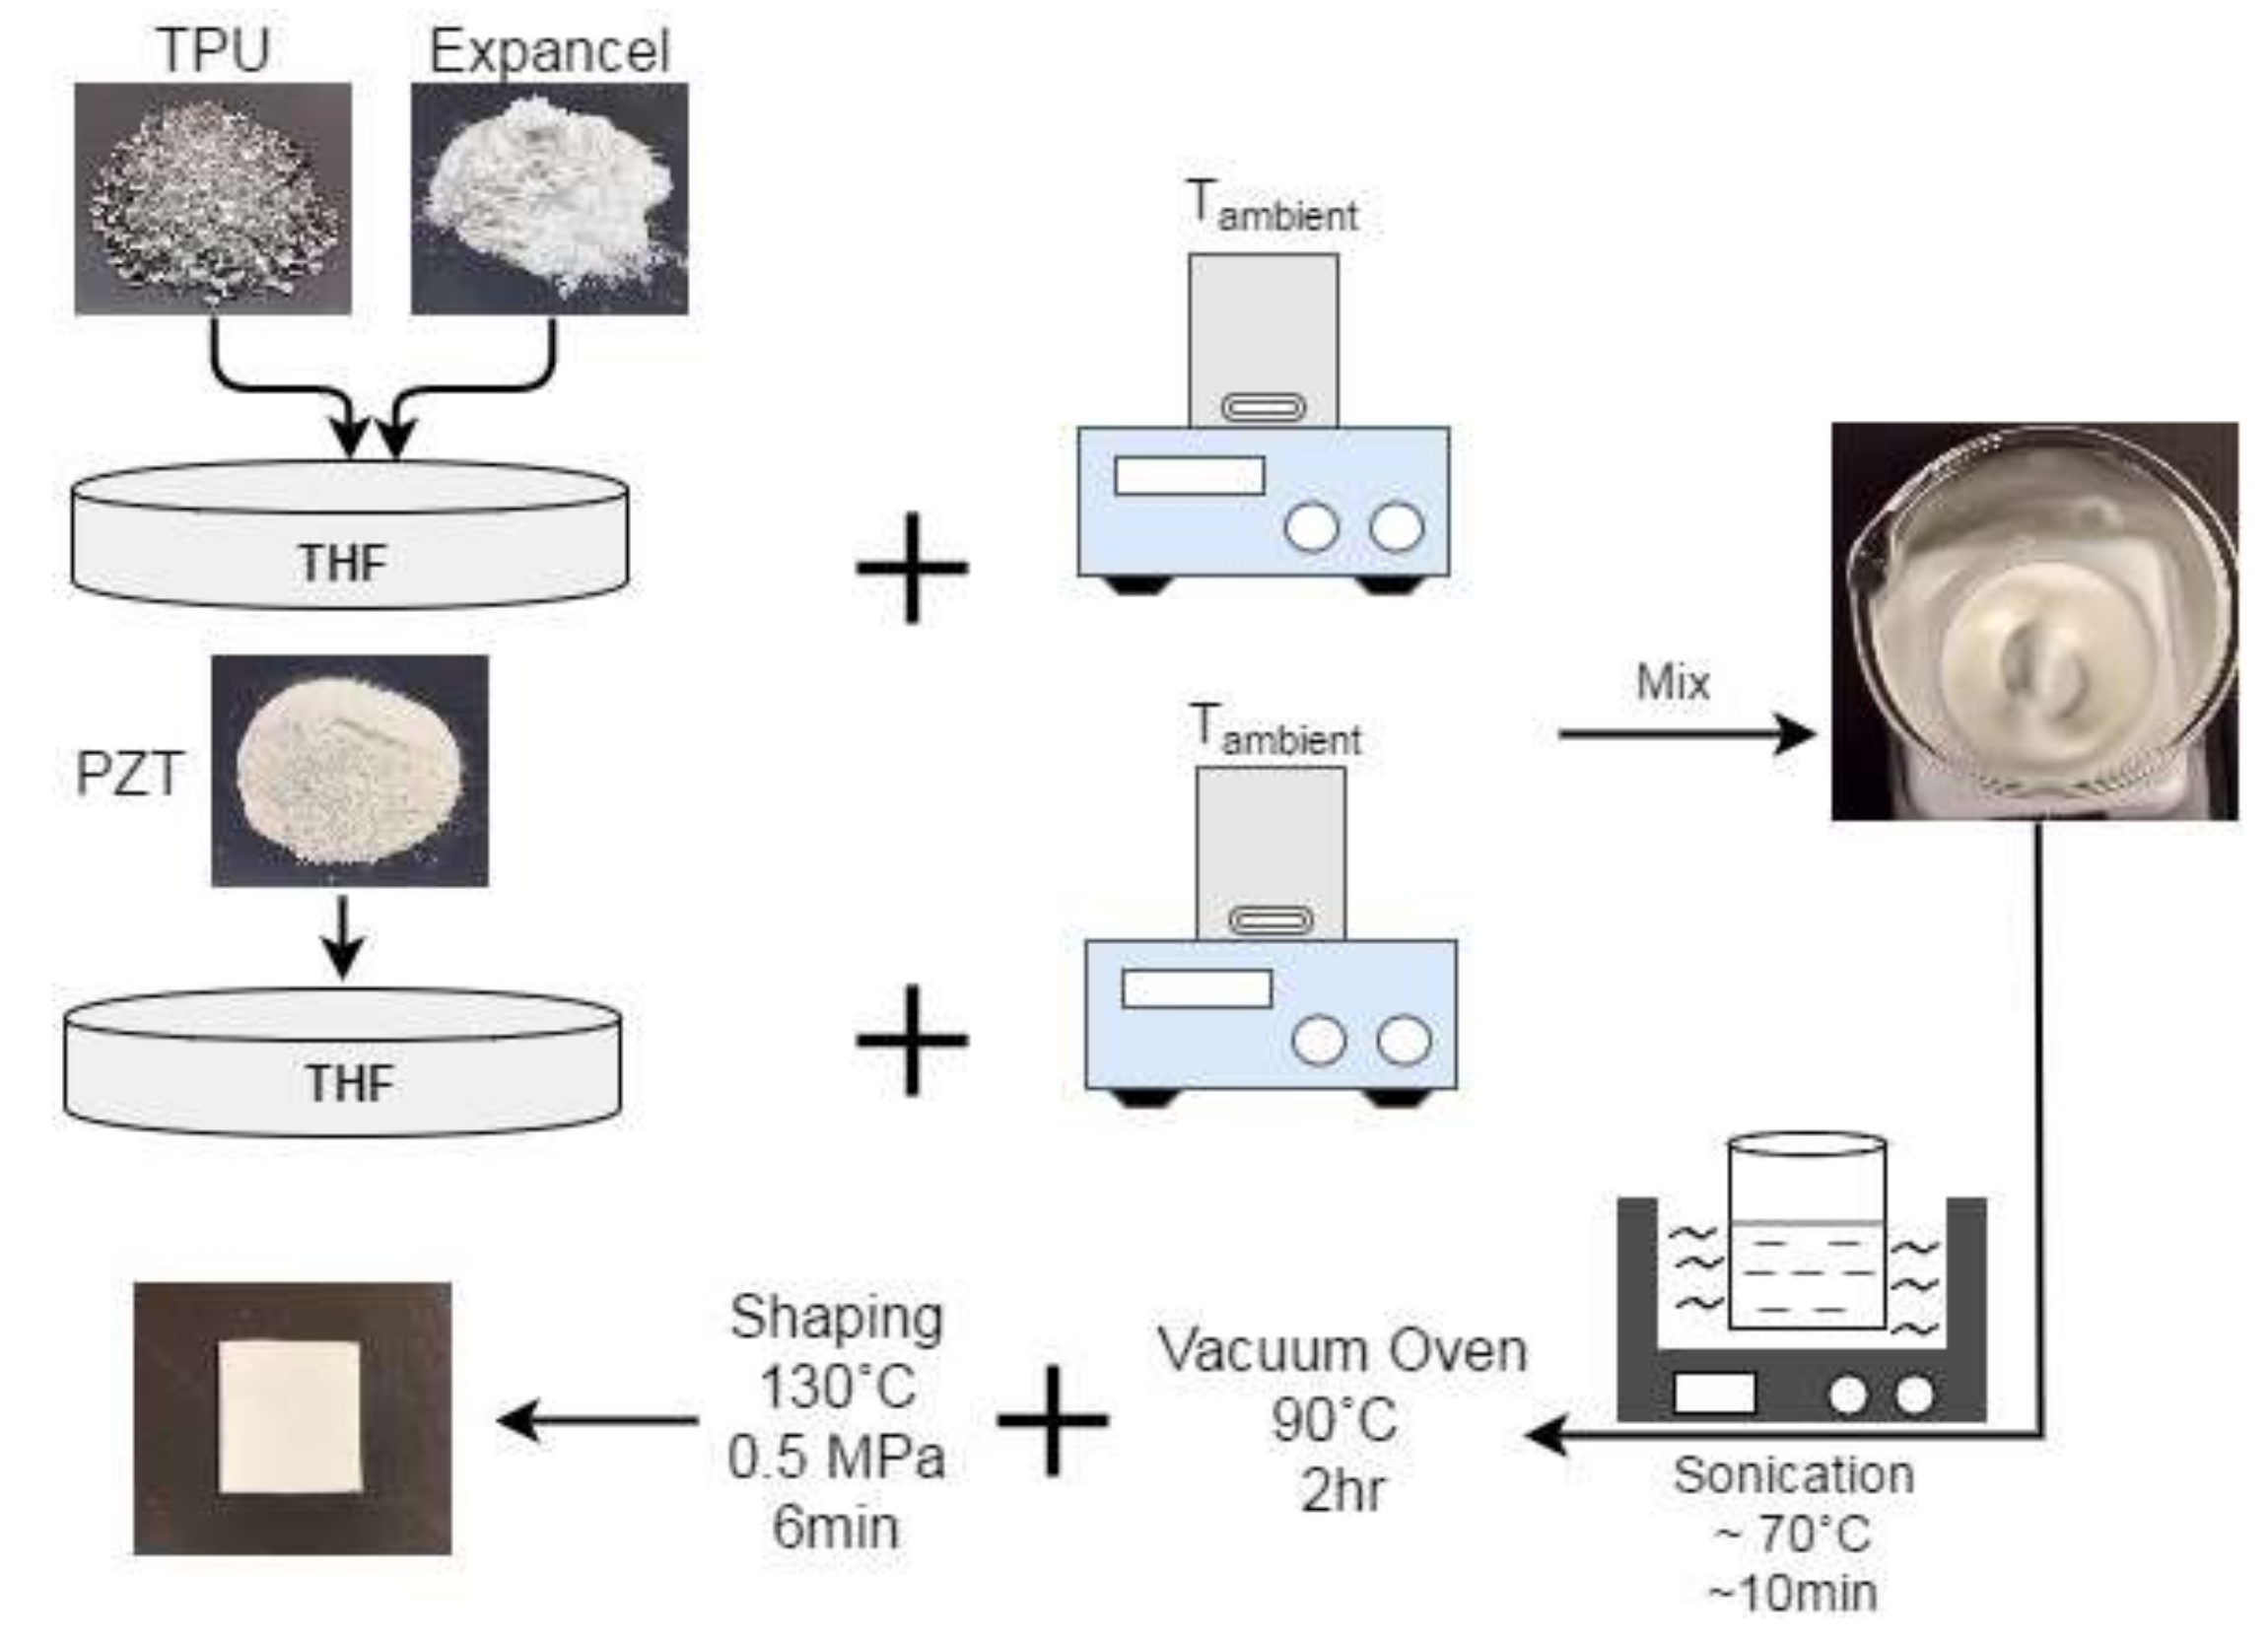
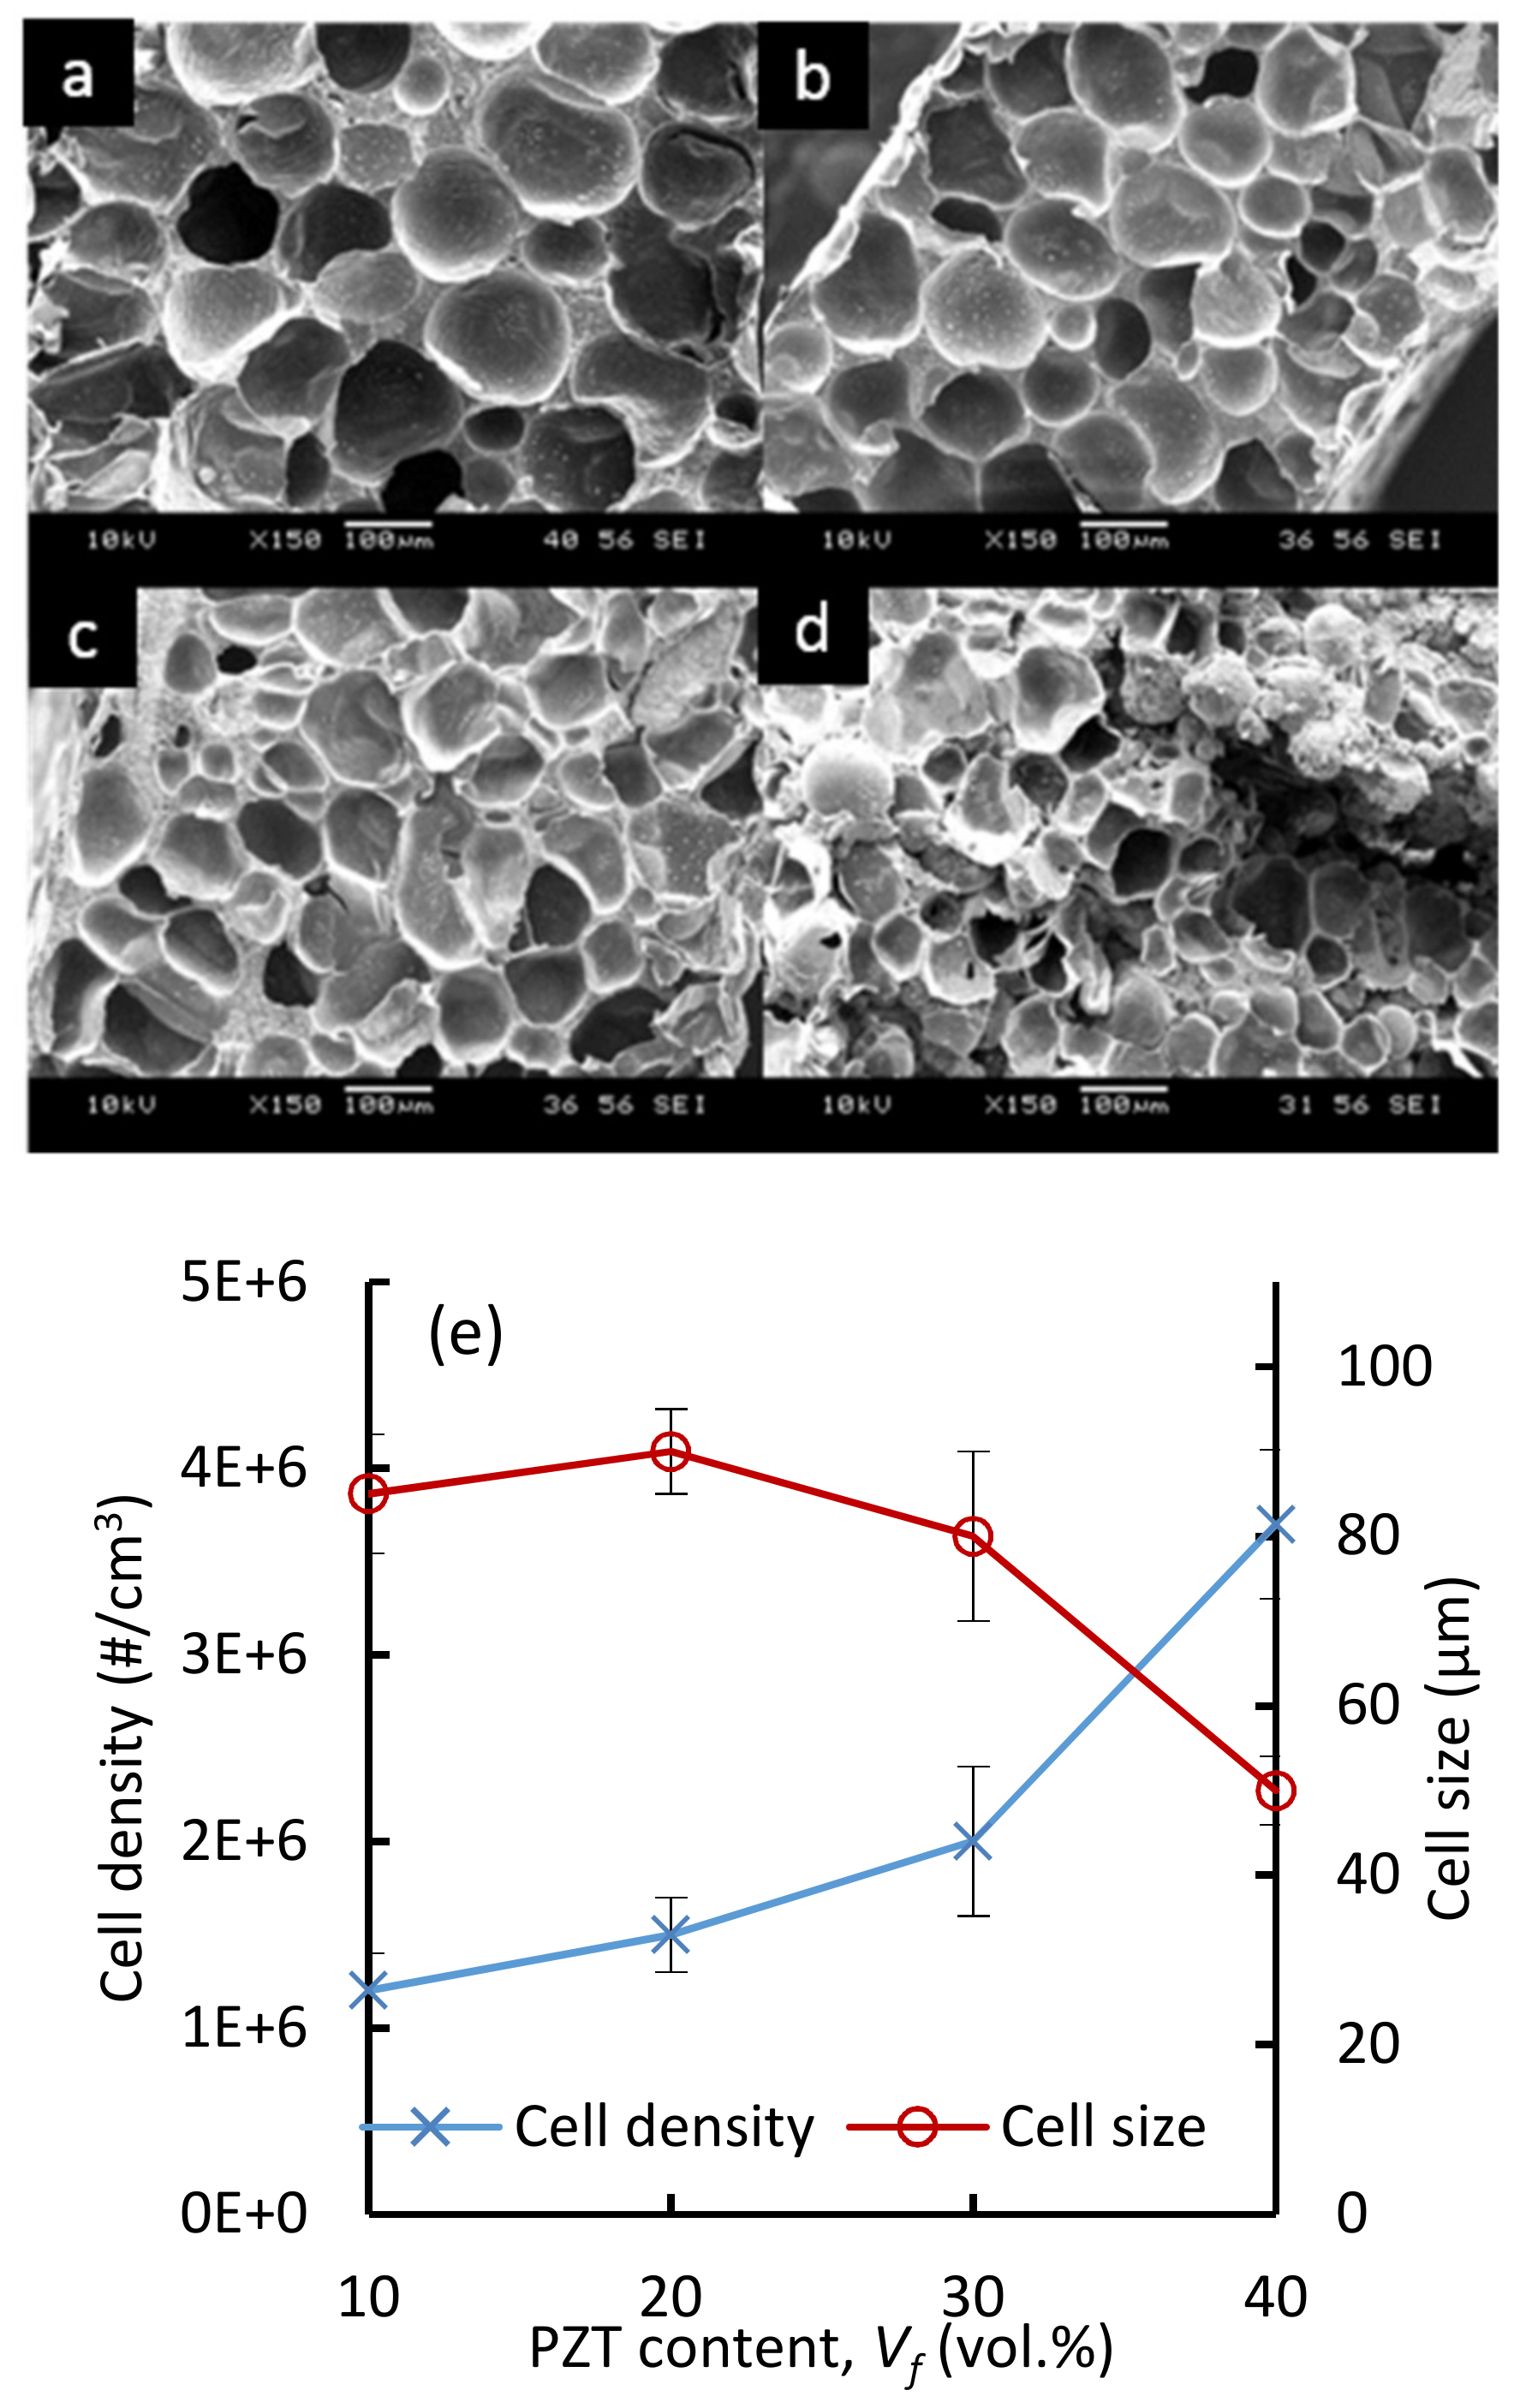
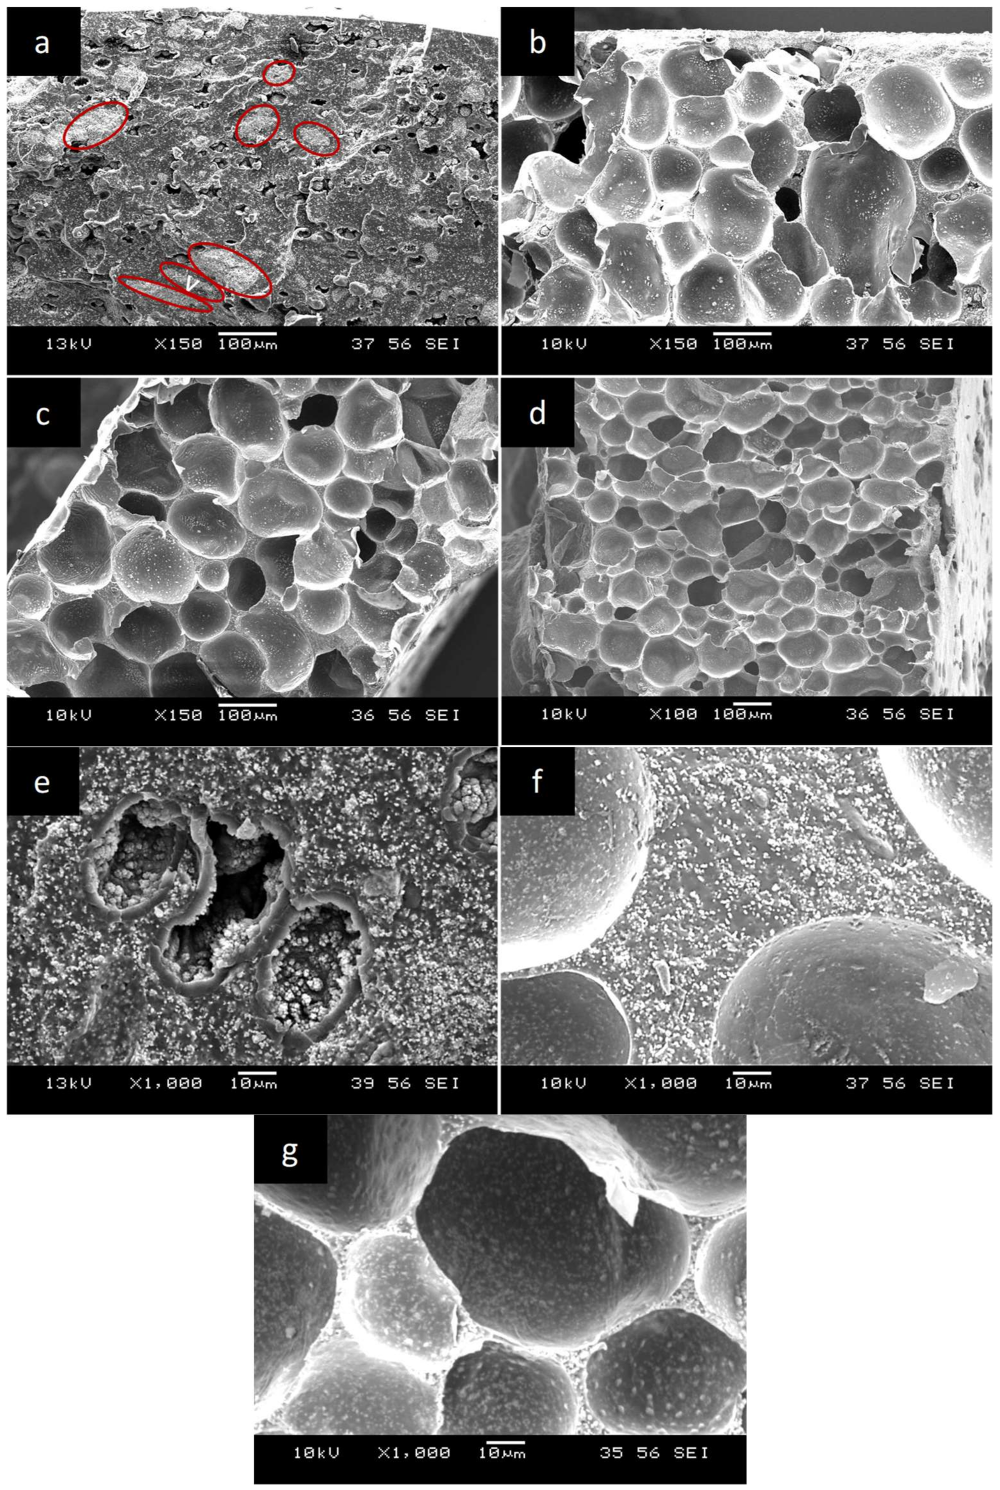
3.1. Microstructure
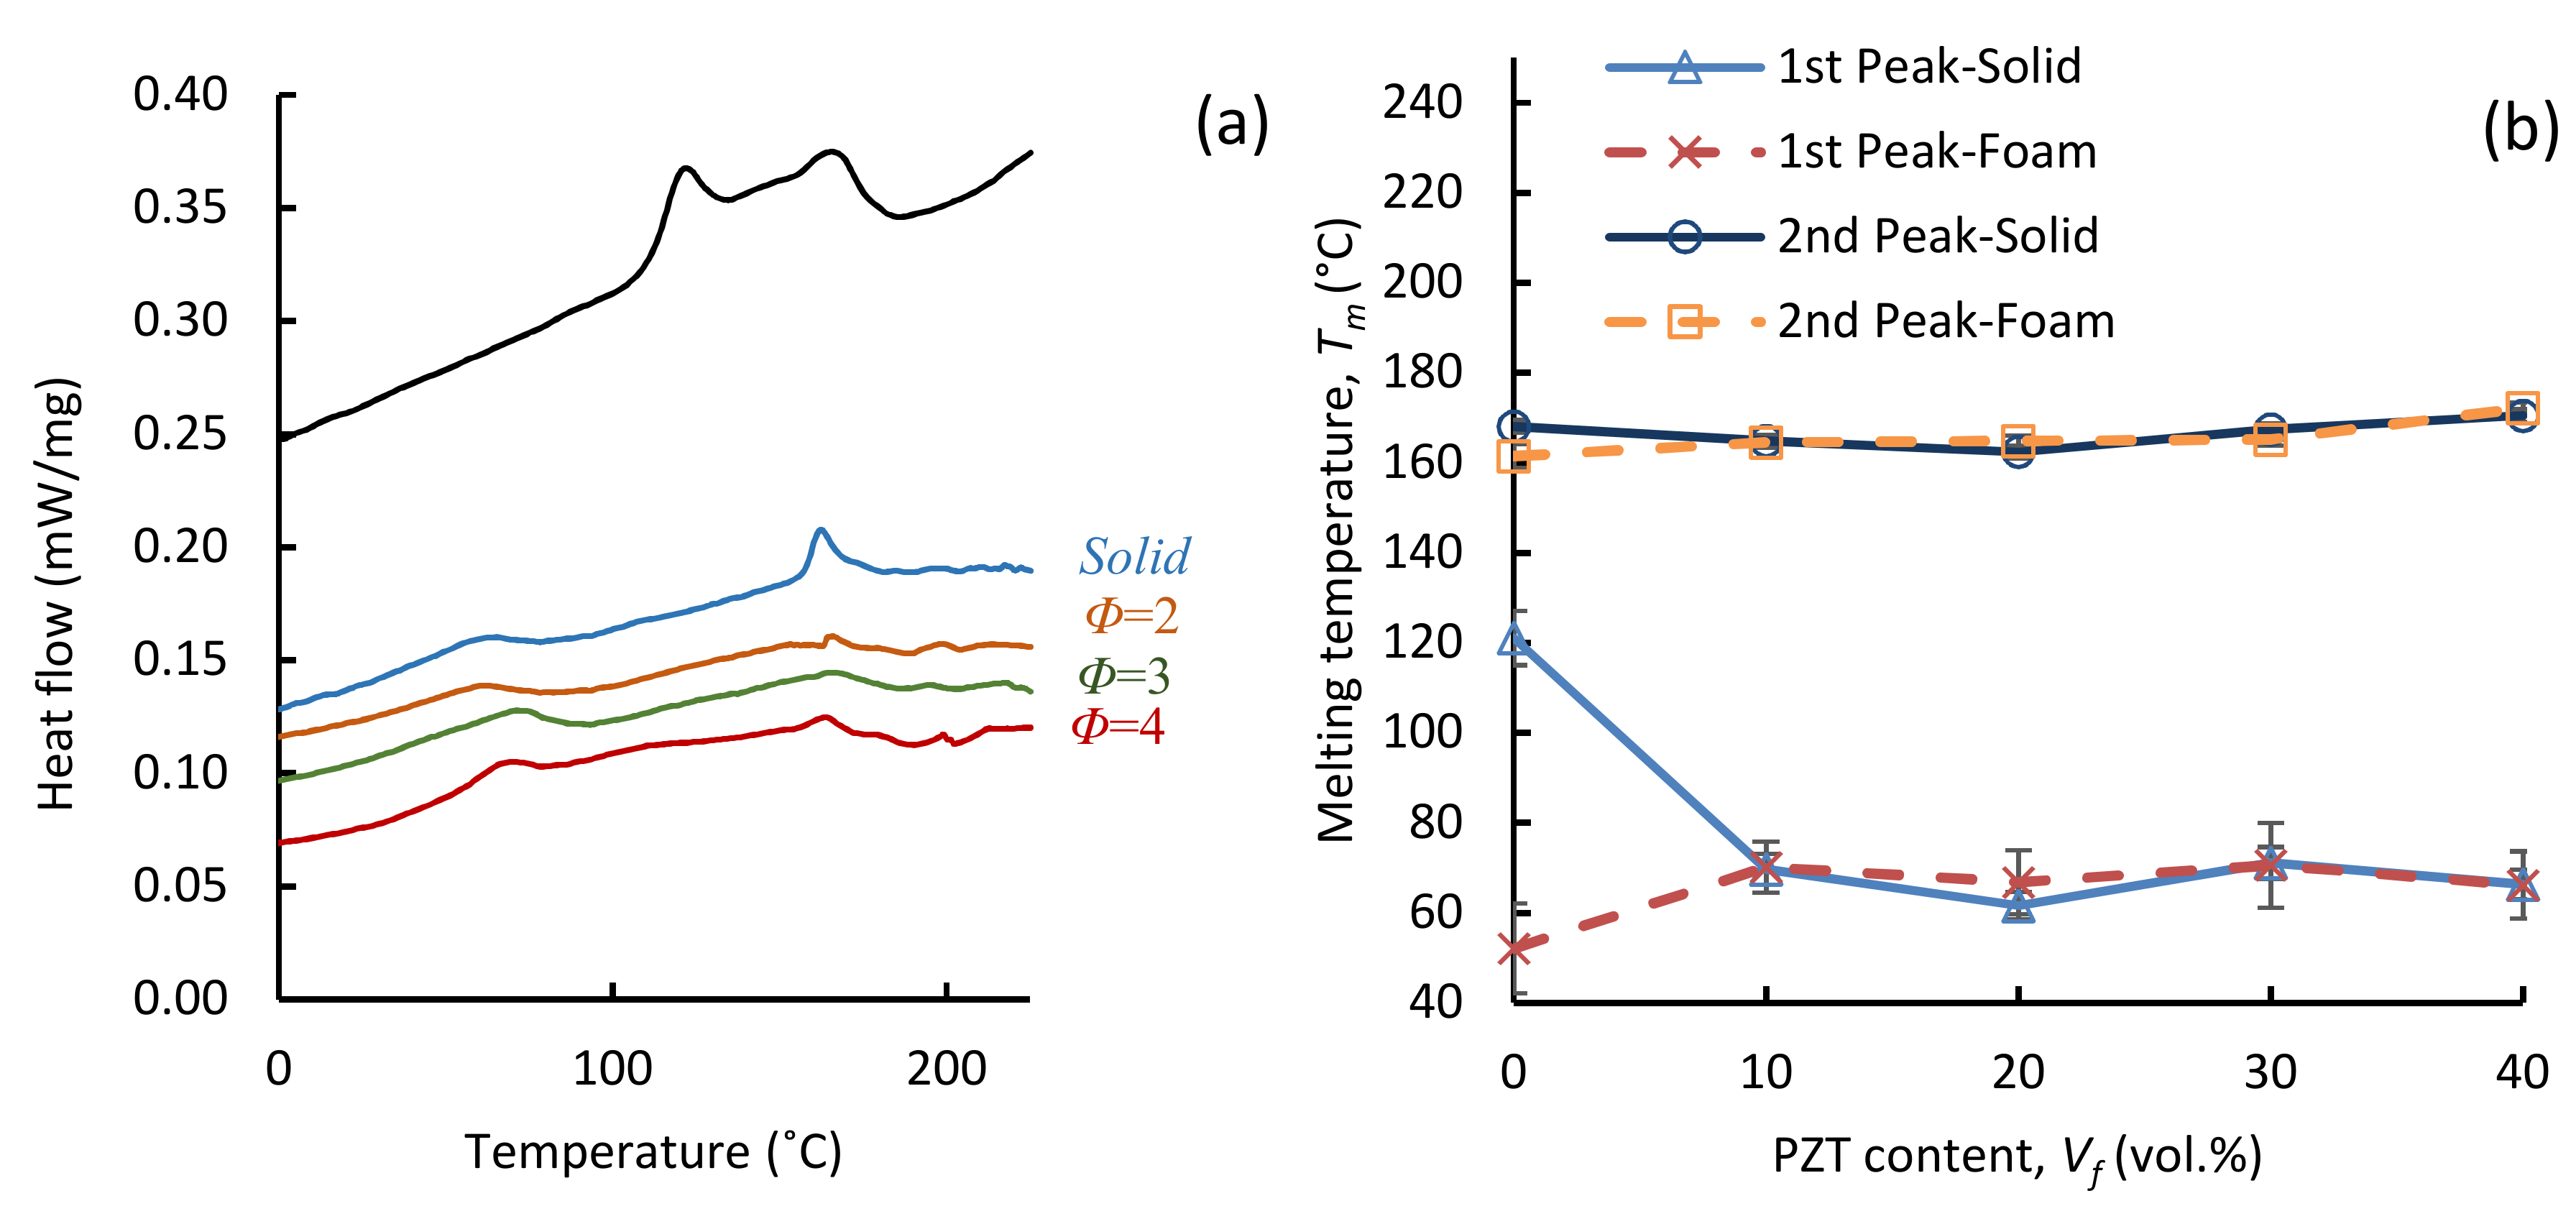
3.2. Thermal Properties
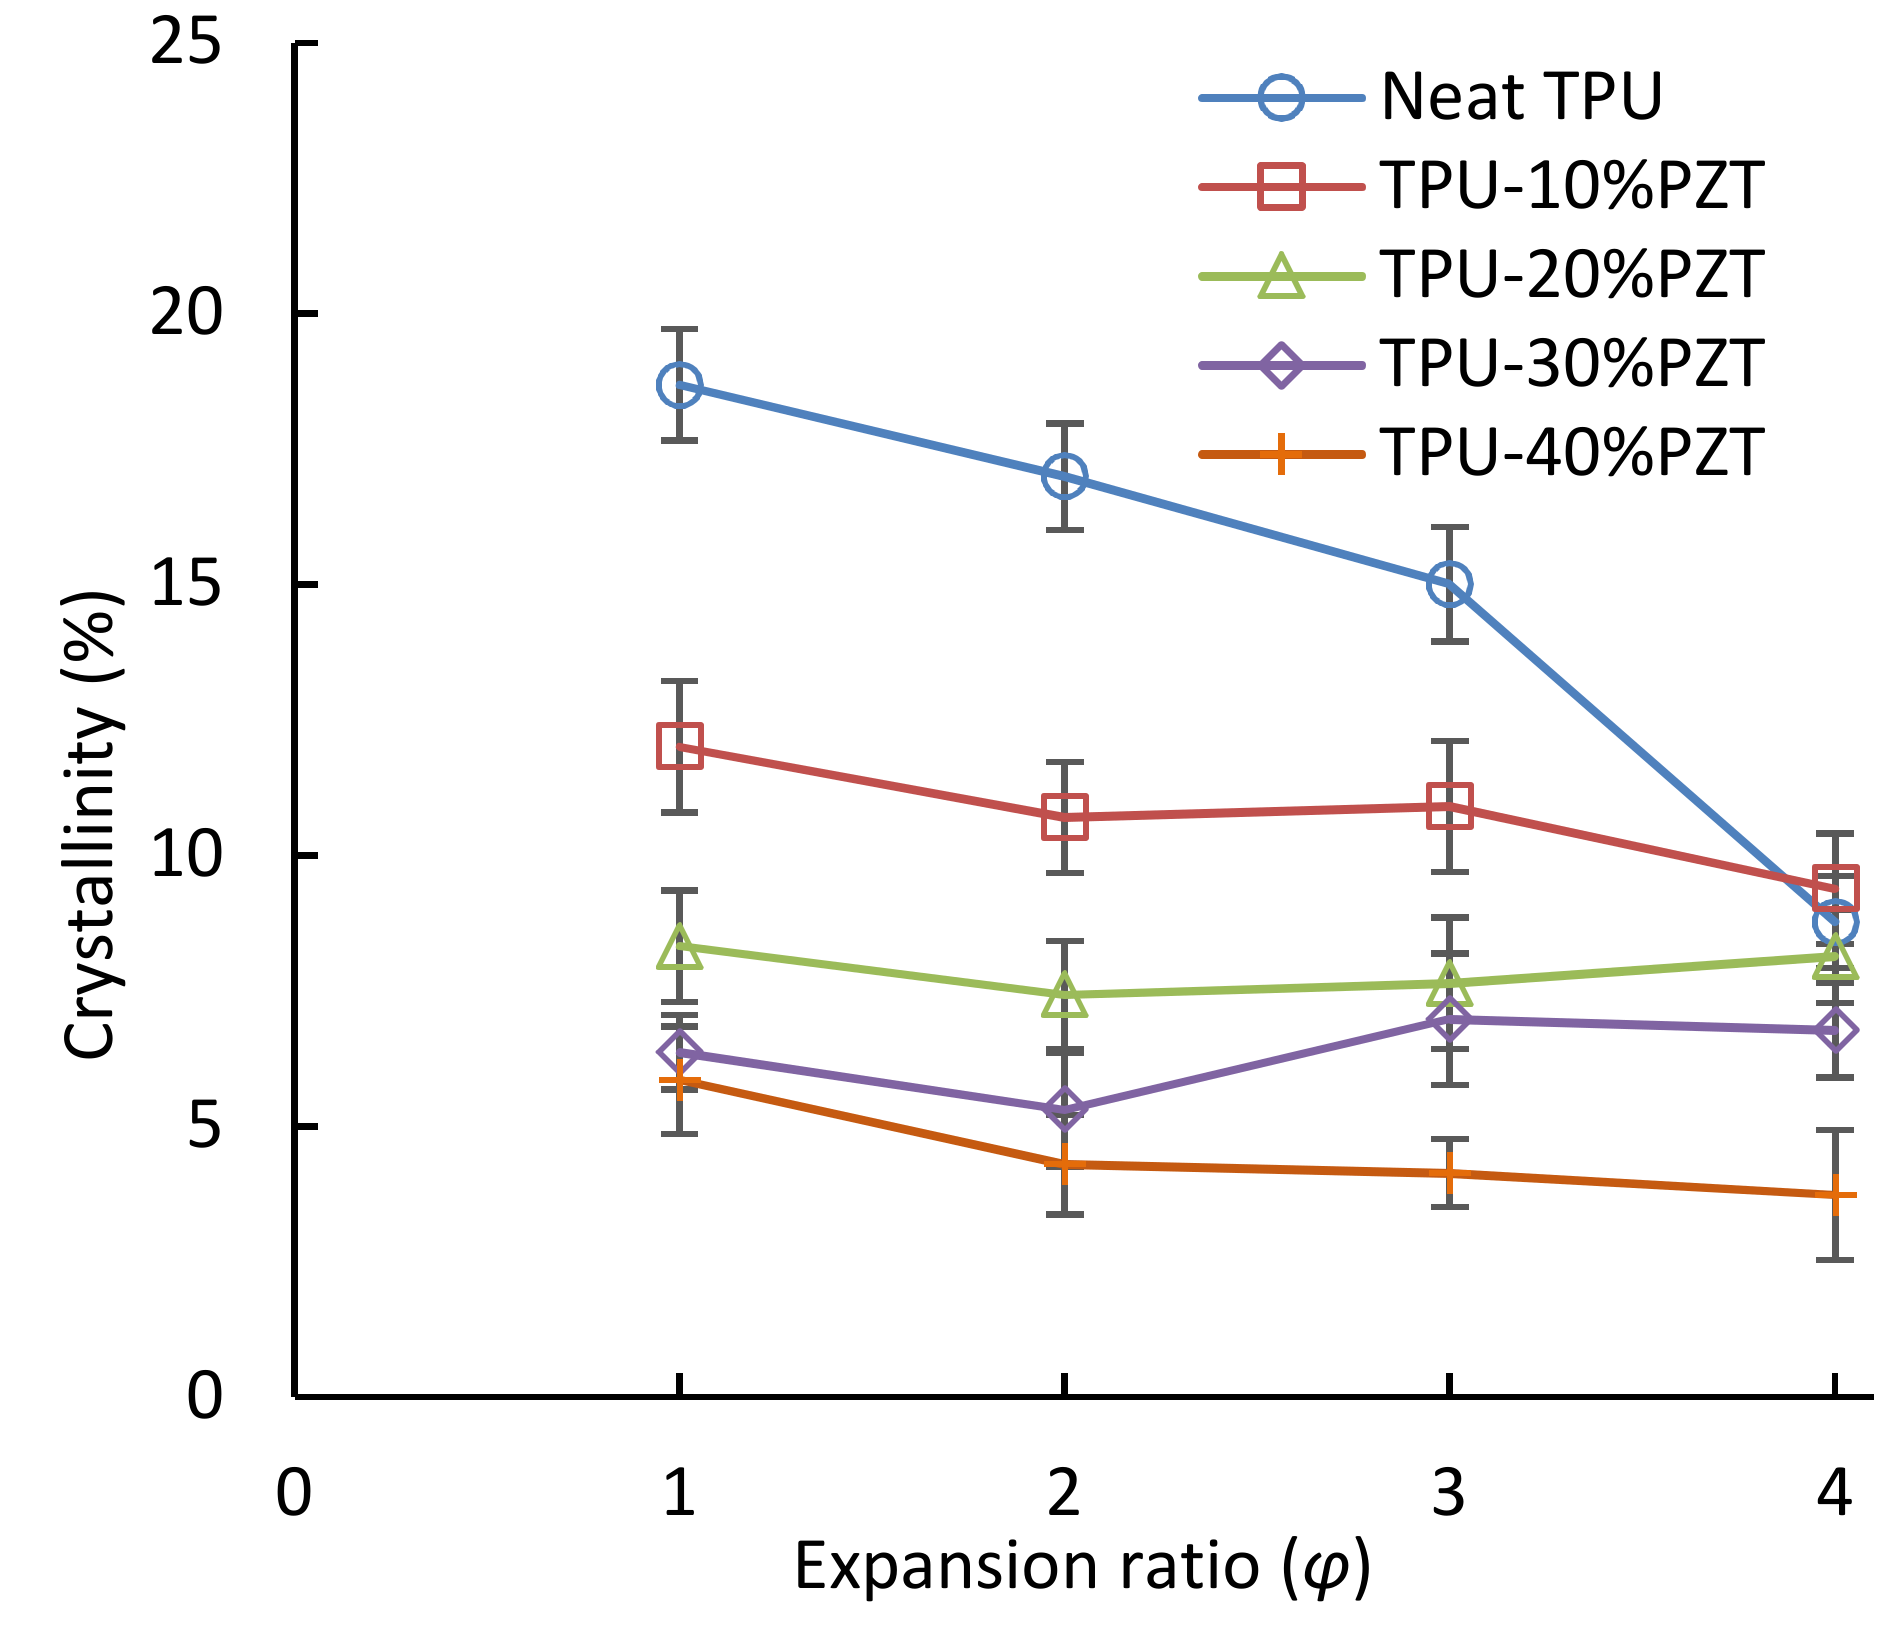
3.2.1. Crystallization
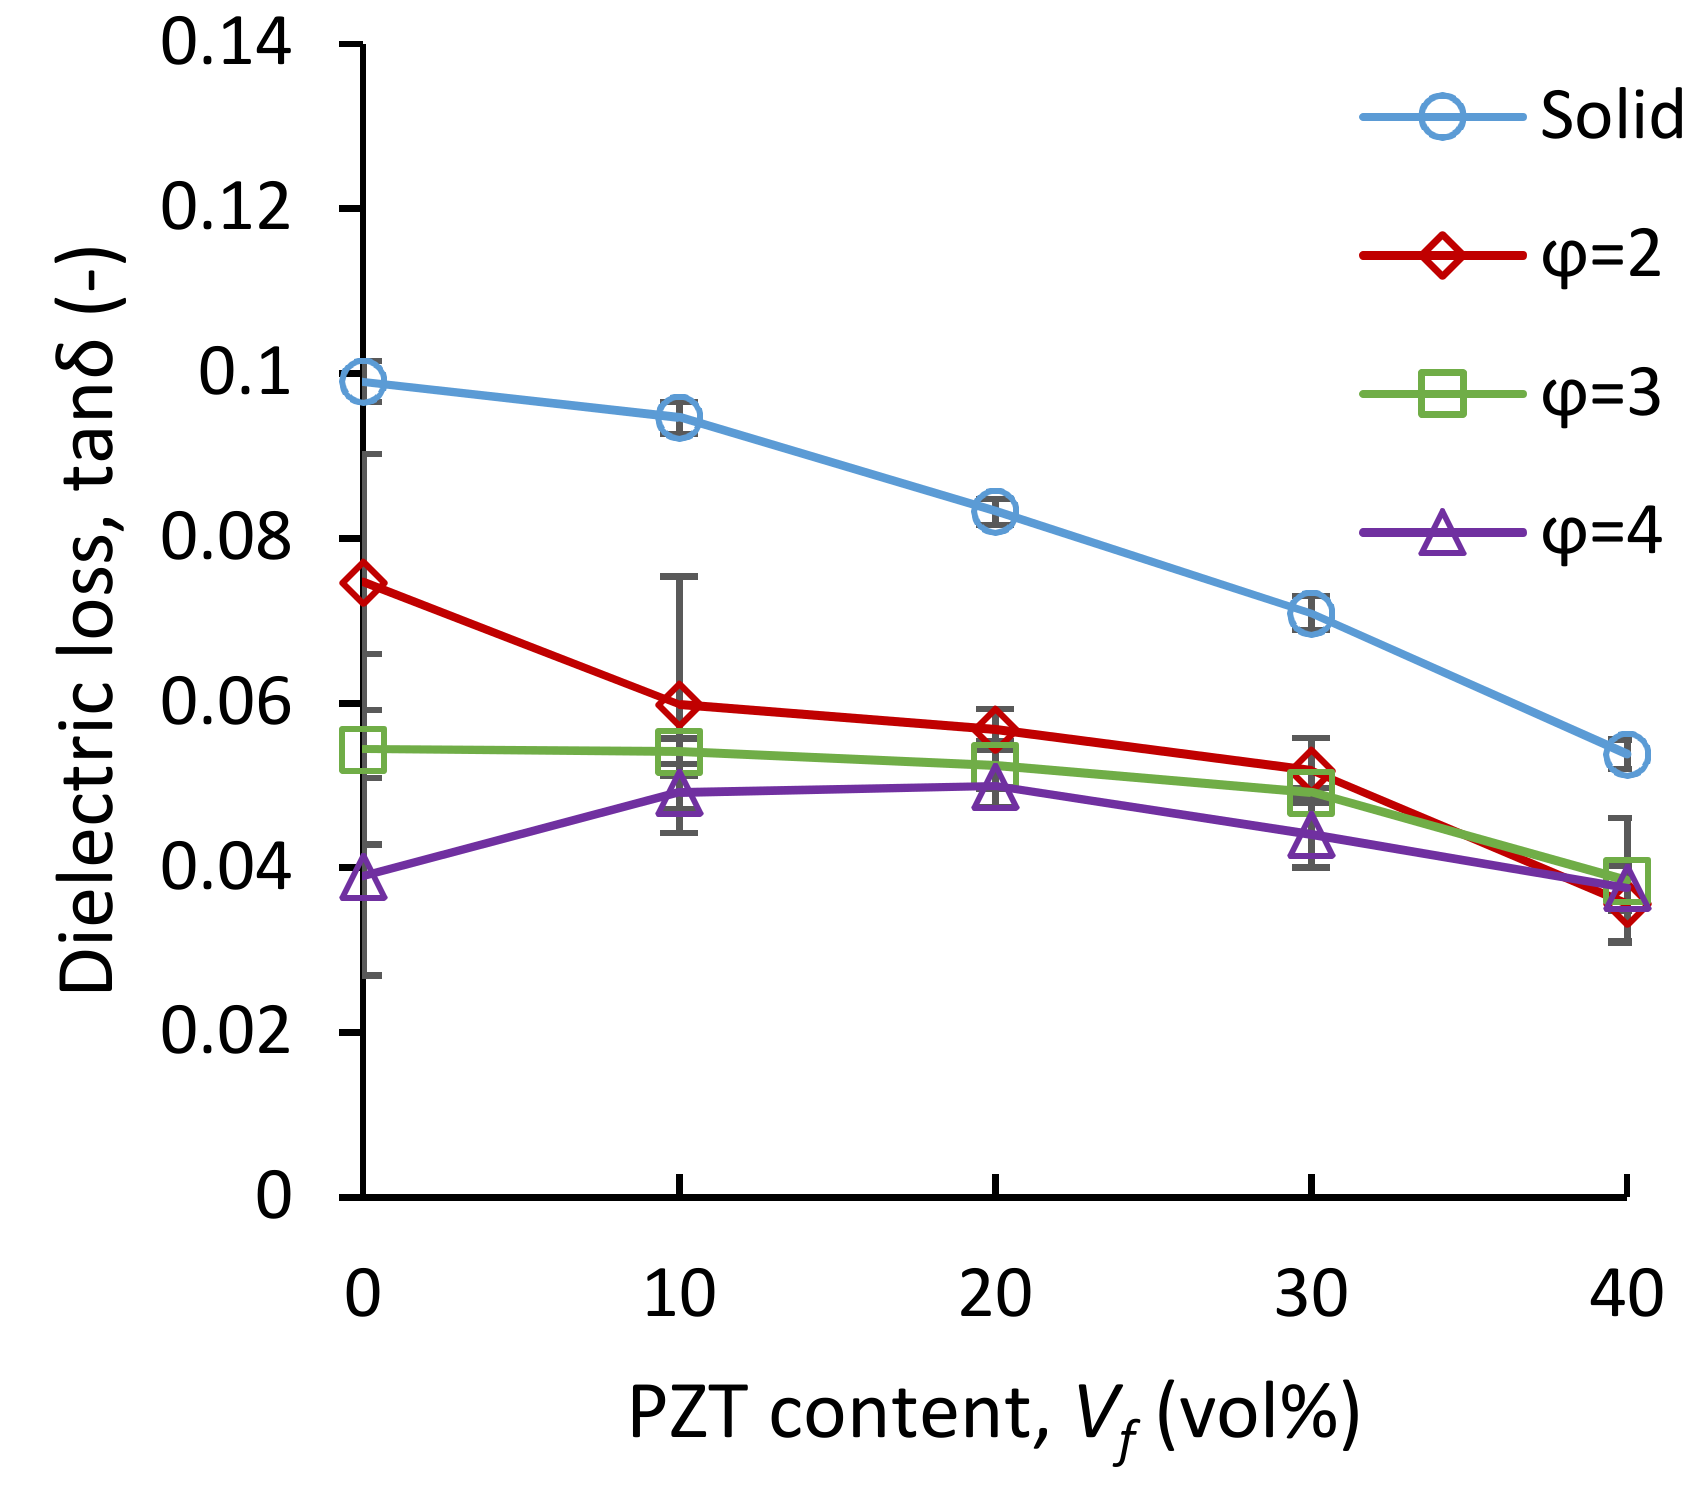
3.3. Dielectric Properties
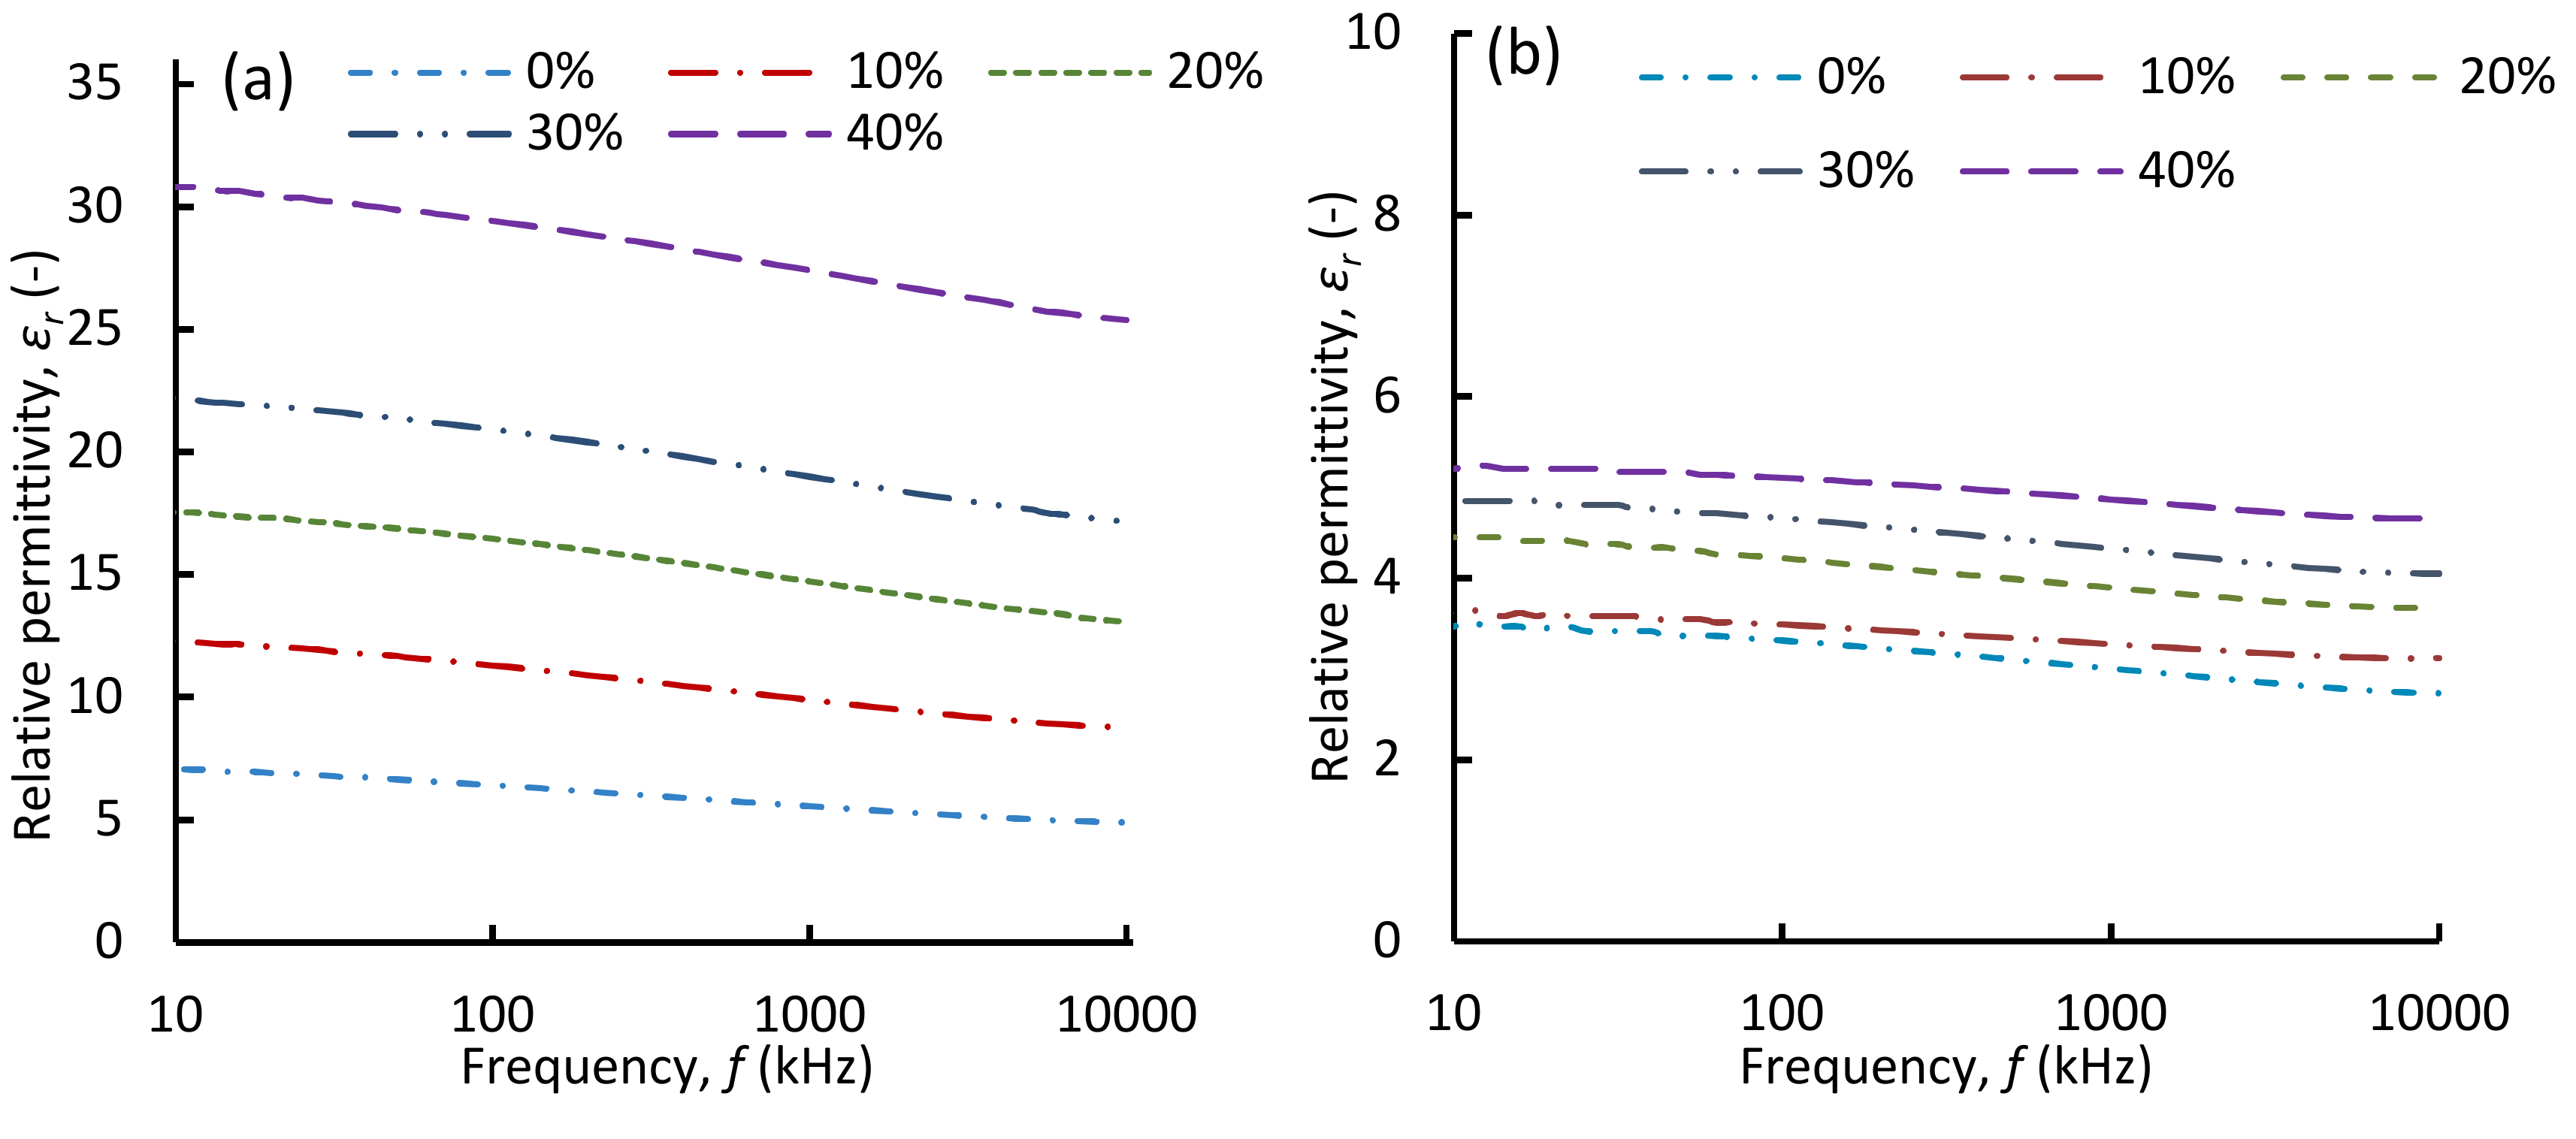
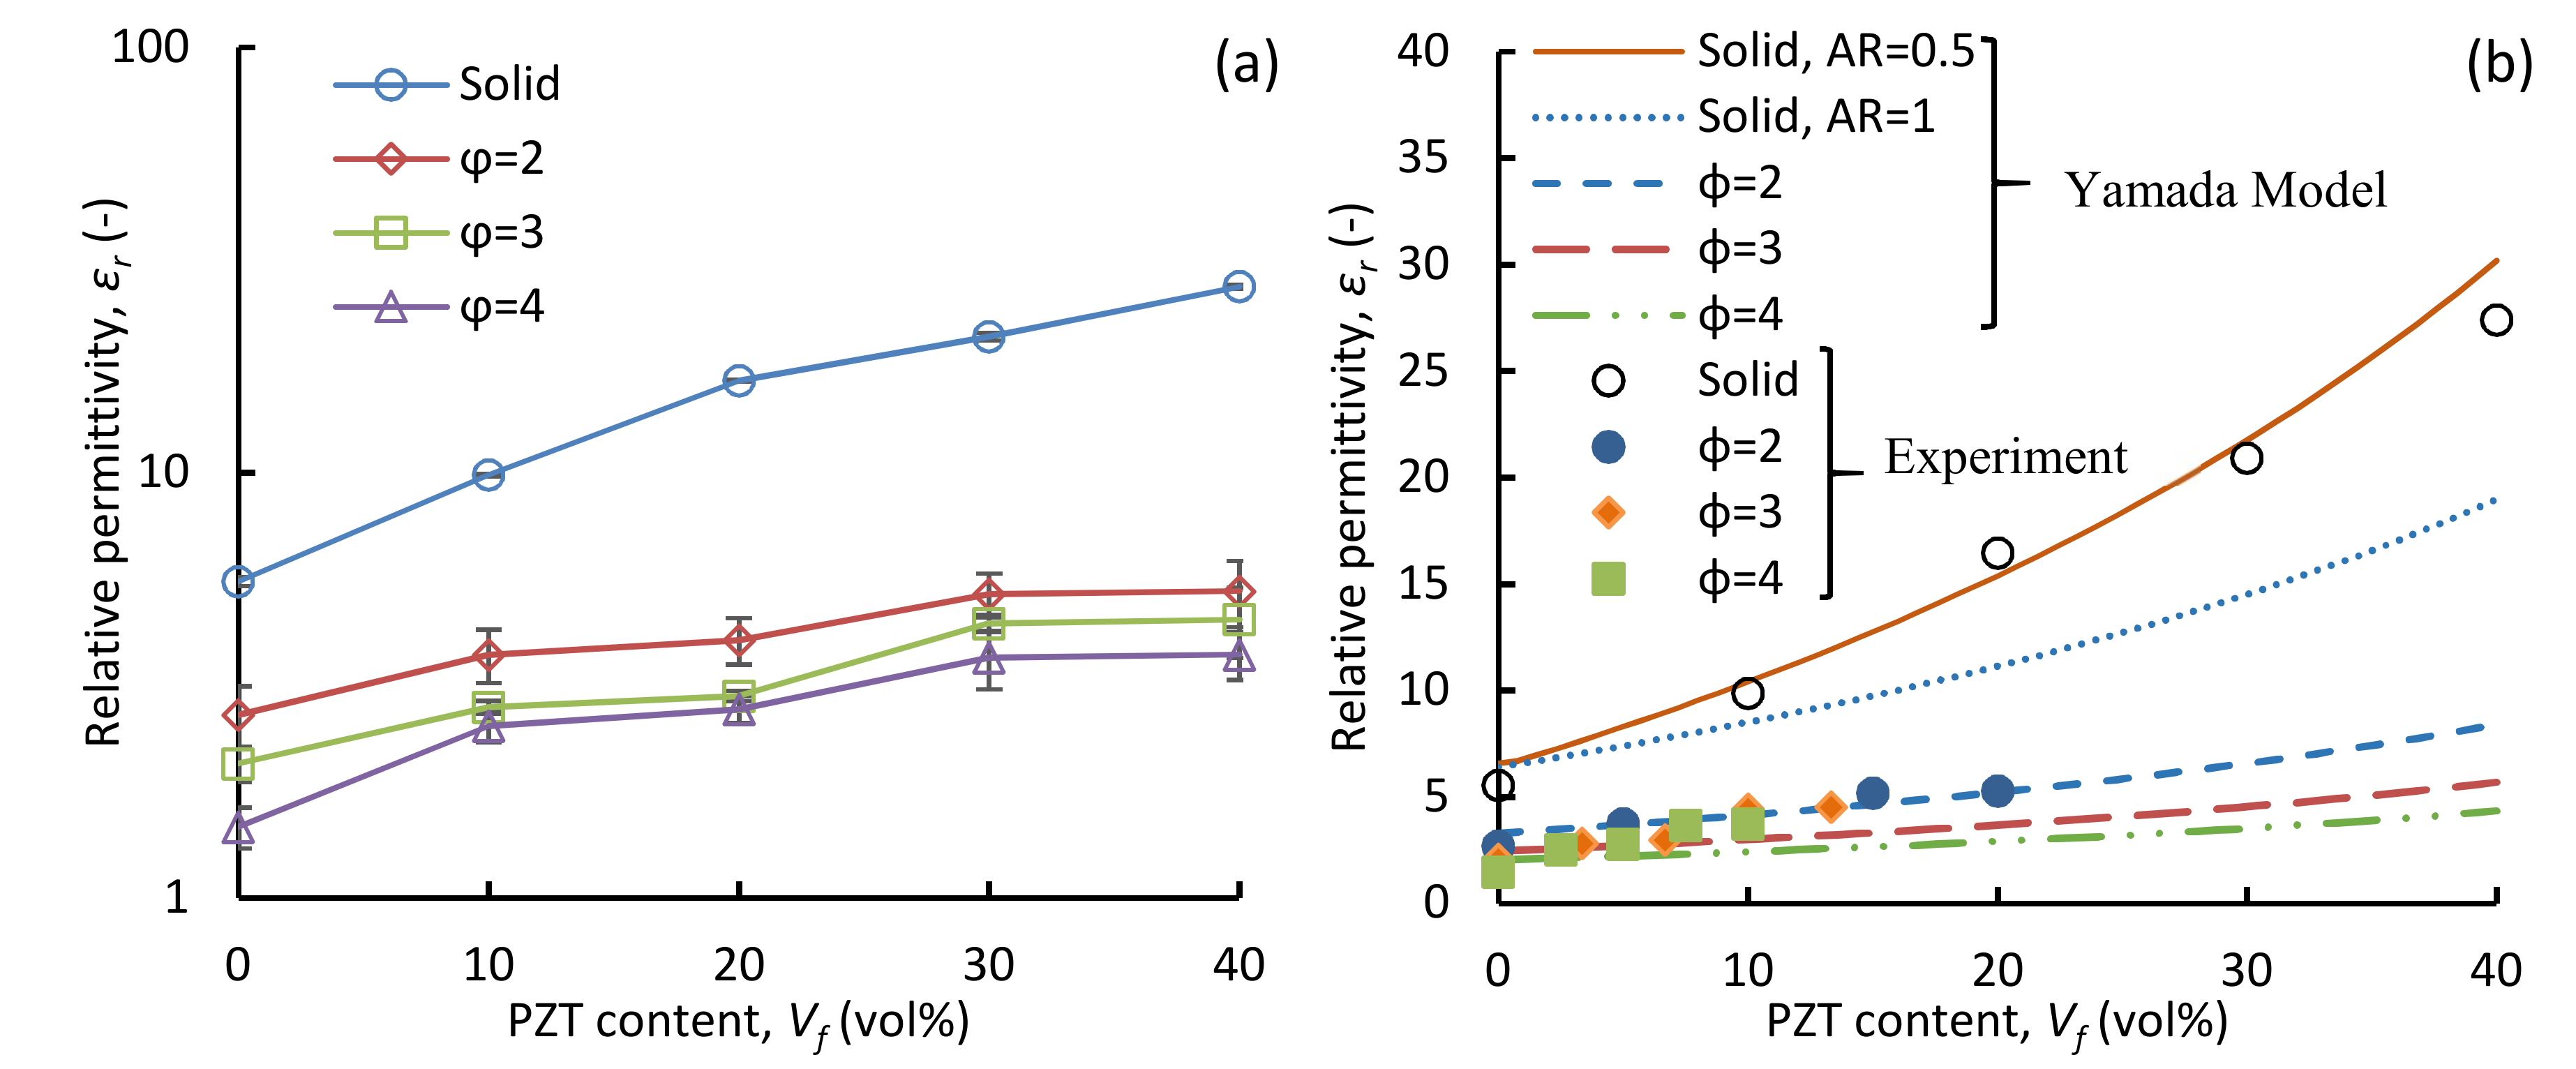
3.3.1. Broadband Relative Permittivity
3.3.2. Impact of PZT Content and Foaming on Relative Permittivity
4. Conclusions
Author Contributions
Funding
Acknowledgments
Conflicts of Interest
References
- Ameli, A.; Jung, P.U.; Park, C.B. Through-plane electrical conductivity of injection-molded polypropylene/carbon-fiber composite foams. Compos. Sci. Technol. 2013, 76, 37–44. [Google Scholar] [CrossRef]
- Ameli, A.; Jung, P.U.; Park, CB. Electrical properties and electromagnetic interference shielding effectiveness of polypropylene/carbon fiber composite foams. Carbon 2013, 60, 379–391. [Google Scholar] [CrossRef]
- Christ, J.F.; Aliheidari, N.; Ameli, A.; Potschke, P. 3D printed highly elastic strain sensors of multiwalled carbon nanotube/thermoplastic polyurethane nanocomposites. Mater. Des. 2017, 131, 394–401. [Google Scholar] [CrossRef]
- Ploss, B.; Ploss, B.; Shin, F.G.; Chan, H.L.W. Pyroelectric or piezoelectric compensated ferroelectric composites. Appl. Phys. Lett. 2000, 76, 2776–2778. [Google Scholar] [CrossRef]
- Sebastian, M.T.; Jantunen, H. Polymer–ceramic composites of 0–3 connectivity for circuits in electronics: A. review. Int. J. Appl. Ceram. Technol. 2000, 7, 415–434. [Google Scholar] [CrossRef]
- Erturk, A.; Inman, D.J. Piezoelectric Energy Harvesting, 1st ed.; John Wiley & Sons: West Sussex, UK, 2011; ISBN 978-0470682548. [Google Scholar]
- Takahashi, H.; Numamoto, Y.; Tani, J.; Matsuta, K.; Qiu, J.; Tsurekawa, S. Lead-free barium titanate ceramics with large piezoelectric constant fabricated by microwave sintering. Jpn. J. Appl. Phys. 2006, 45, L30–L32. [Google Scholar] [CrossRef]
- Kawai, H. The piezoelectricity of poly (vinylidene fluoride). Jpn. J. Appl. Phys. 1969, 8, 975–976. [Google Scholar] [CrossRef]
- Foster, F.S.; Harasiewicz, K.A.; Sherar, M.D. A history of medical and biological imaging with polyvinylidene fluoride (PVDF) transducers. IEEE Trans. Ultrason. Ferroelectr. Freq. Control 2000, 47, 1363–1371. [Google Scholar] [CrossRef] [PubMed]
- Wang, F.; Tanaka, M.; Chonan, S. Development of a PVDF piezopolymer sensor for unconstrained in-sleep cardiorespiratory monitoring. J. Intell. Mater. Syst. Struct. 2003, 14, 185–190. [Google Scholar] [CrossRef]
- Cha, S.; Kim, S.M.; Kim, H.; Ku, J.; Sohn, J.I.; Park, Y.J.; Song, B.J. Porous PVDF as effective sonic wave driven nanogenerators. Nano Lett. 2011, 11, 5142–5147. [Google Scholar] [CrossRef]
- Qiu, X. Patterned piezo-, pyro-, and ferroelectricity of poled polymer electrets. J. Appl. Phys. 2010, 108, 011101. [Google Scholar] [CrossRef] [Green Version]
- Holterman, J.; Groen, P. An Introduction to Piezoelectric Materials and Applications, 1st ed.; Stichting Applied Piezo: Apeldoorn, The Netherlands, 2013; ISBN 9789081936118. [Google Scholar]
- Arlt, K.; Wegener, M. Piezoelectric PZT/PVDF-copolymer 0-3 Composites: Aspects on Film Preparation and Electrical Poling. IEEE Trans. Dielectr. Electr. Insul. 2010, 17. [Google Scholar] [CrossRef]
- Khanbareh, H.; van der Zwaag, S.; Groen, W.A. In-situ poling and structurization of piezoelectric particulate composites. J. Intell. Mater. Syst. Struct. 2017, 28, 2467–2472. [Google Scholar] [CrossRef] [PubMed] [Green Version]
- Khanbareh, H.; van der Zwaag, S.; Groen, W. Effect of dielectrophoretic structuring on piezoelectric and pyroelectric properties of PT-epoxy composites. Smart Mater. Struct. 2014, 23, 105030. [Google Scholar] [CrossRef]
- Wilson, S.A.; Maistros, G.M.; Whatmore, R.W. Structure modification of 0–3 piezoelectric ceramic/polymer composites through dielectrophoresis. J. Phys. D Appl. Phys. 2005, 38, 175. [Google Scholar] [CrossRef]
- Tressler, J.F.; Alkoy, S.; Dogan, A.; Newnham, R.E. Functional composites for sensors, actuators and transducers. Compos. Part A Appl. Sci. Manuf. 1999, 30. [Google Scholar] [CrossRef]
- Schollenberger, C.S.; Dinbergs, K. Thermoplastic polyurethane elastomer molecular weight-property relations. Further studies. J. Elastomers Plast. 1979, 11, 58–91. [Google Scholar] [CrossRef]
- Okolieocha, C.; Raps, D.; Subramaniam, K.; Altstäd, V. Microcellular to nanocellular polymer foams: Progress (2004–2015) and future directions—A review. Eur. Polym. J. 2015, 73, 500–519. [Google Scholar] [CrossRef]
- Chen, Z.; Xu, C.; Ma, C.; Ren, W.; Cheng, H.M. Lightweight and flexible graphene foam composites for high-performance electromagnetic interference shielding. Adv. Mater. 2013, 25, 1296–1300. [Google Scholar] [CrossRef]
- Ameli, A.; Nofar, M.; Park, C.B.; Pötschke, P.; Rizvi, G. Polypropylene/carbon nanotube nano/microcellular structures with high dielectric permittivity, low dielectric loss, and low percolation threshold. Carbon 2014, 71, 206–217. [Google Scholar] [CrossRef]
- Buchberger, G.; Schwödiauer, R.; Bauer, S. Flexible large area ferroelectret sensors for location sensitive touchpads. Appl. Phys. Lett. 2008, 92, 123511. [Google Scholar] [CrossRef]
- Mellinger, A.; Wegener, M.; Wirges, W.; Mallepally, R.R.; Gerhard-Multhaupt, R. Thermal and temporal stability of ferroelectret films made from cellular polypropylene/air composites. Ferroelectrics 2006, 331, 189–199. [Google Scholar] [CrossRef]
- Lindner, M.; Hoislbauer, H.; Schwödiauer, R.; Bauer-Gogonea, S.; Bauer, S. Charged cellular polymers with “ferroelectretic” behavior. IEEE Trans. Dielectr. Electr. Insul. 2004, 11, 255–263. [Google Scholar] [CrossRef]
- Graz, I.; Kaltenbrunner, M.; Keplinger, C.; Schwödiauer, R.; Bauer, S.; Lacour, S.P.; Wagner, S. Flexible ferroelectret field-effect transistor for large-area sensor skins and microphones. Appl. Phys. Lett. 2006, 89, 073501. [Google Scholar] [CrossRef]
- De Boom, K. Particulate Polymer Foam Composites: For Piezoelectric Sensing Applications. Masters’s Thesis, Aerospace Structures & Materials Department, Delft University of Technology, Delft, The Netherlands, 2016. [Google Scholar]
- Khanbareh, H.; de Boom, K.; Schelen, B.; Scharff, R.B.N.; Wang, C.C.L.; van der Zwaag, S.; Groen, P. Large area and flexible micro-porous piezoelectric materials for soft robotic skin. Sens. Actuator A-Phys. 2017, 263, 554–562. [Google Scholar] [CrossRef]
- Khanbareh, H.; de Boom, K.; van der Zwaag, S.; Groen, W.A. Highly sensitive piezo particulate-polymer foam composites for robotic skin application. Ferroelectrics 2017, 515, 25–33. [Google Scholar] [CrossRef]
- McCall, W.R.; Kim, K.; Heath, C.; La Pierre, G.; Sirbuly, D.J. Piezoelectric nanoparticle–polymer composite foams. ACS Appl. Mater. Interfaces 2014, 6, 19504–19509. [Google Scholar] [CrossRef]
- Kim, H.G. Influence of Microstructure on the Dielectric and Piezoelectric Properties of Lead Zirconate-Polymer Composites. J. Am. Ceram. Soc. 1989, 72, 938–942. [Google Scholar] [CrossRef]
- Matuana, L.M.; Faruk, O. Effect of gas saturation conditions on the expansion ratio of microcellular poly (lactic acid)/wood-flour composites. Express Polym. Lett. 2010, 4, 621–631. [Google Scholar] [CrossRef]
- Chan, E.; Leung, S.N.; Khan, M.O.; Naguib, H.E.; Dawson, F.; Adinkrah, V. Novel thermally conductive thermoplastic/ceramic composite foams. Macromol. Mater. Eng. 2012, 297, 1014–1020. [Google Scholar] [CrossRef]
- Yamada, T.; Ueda, T.; Kitayama, T. Piezoelectricity of a high-content lead zirconate titanate/polymer composite. J. Appl. Phys. 1982, 53, 4328–4332. [Google Scholar] [CrossRef]
- Okamoto, M.; Nam, P.H.; Maiti, P.; Kotaka, T.; Nakayama, T.; Takada, M.; Ohshima, M.; Usuki, A.; Hasegawa, N.; Okamoto, H. Biaxial flow-induced alignment of silicate layers in polypropylene/clay nanocomposite foam. Nano Lett. 2001, 1, 503–505. [Google Scholar] [CrossRef]
- Shaayegan, V.; Ameli, A.; Wang, S.; Park, C.B. Experimental observation and modeling of fiber rotation and translation during foam injection molding of polymer composites. Compos. Part A Appl. Sci. Manuf. 2016, 88, 67–74. [Google Scholar] [CrossRef]
- Hossieny, N.; Ameli, A.; Saniei, M.; Jahani, D.; Park, C.B. Feasibility od Double Melting Peak Generation For Expanded Thermoplastic Polyurethane Bead Foams. In Proceedings of the SPE ANTEC Annual Conference, Las Vegas, NV, USA, 28–30 April 2014. [Google Scholar]
- Pramoda, K.P.; Mohamed, A.; Yee Phang, I.; Liu, T. Crystal transformation and thermomechanical properties of poly (vinylidene fluoride)/clay nanocomposites. Polym. Int. 2005, 54, 226–232. [Google Scholar] [CrossRef]
- Mucha, M.; Królikowski, Z. Application of DSC to study crystallization kinetics of polypropylene containing fillers. J. Therm. Anal. Calorim. 2003, 74, 549–557. [Google Scholar] [CrossRef]
- Ameli, A.; Arjmand, M.; Pötschke, P.; Krause, B.; Sundararaj, U. Effects of synthesis catalyst and temperature on broadband dielectric properties of nitrogen-doped carbon nanotube/polyvinylidene fluoride nanocomposites. Carbon 2016, 106, 260–278. [Google Scholar] [CrossRef]
- Arjmand, M.; Ameli, A.; Sundararaj, U. Employing nitrogen doping as innovative technique to improve broadband dielectric properties of carbon nanotube/polymer nanocomposites. Macromol. Mater. Eng. 2016, 301, 555–565. [Google Scholar] [CrossRef]
- Tang, H.; Lin, Y.; Andrews, C.; Sodano, H.A. Nanocomposites with increased energy density through high aspect ratio PZT nanowires. Nanotechnology 2010, 22, 015702. [Google Scholar] [CrossRef]
- Dong, L.; Xiong, C.; Quan, H.; Zhao, G. Polyvinyl-butyral/lead zirconate titanates composites with high dielectric constant and low dielectric loss. Scripta Mater. 2006, 55, 835–837. [Google Scholar] [CrossRef]
- Babu, I.; Van den Ende, D.A. Processing and characterization of piezoelectric 0-3 PZT/LCT/PA composites. J. Phys. D Appl. Phys. 2010, 43, 425402. [Google Scholar] [CrossRef] [Green Version]
- Dias, C.J.; Das-Gupta, K. Inorganic ceramic/polymer ferroelectric composite electrets. IEEE Trans. Dielectr. Electr. Insul. 1996, 3, 706–734. [Google Scholar] [CrossRef]


© 2019 by the authors. Licensee MDPI, Basel, Switzerland. This article is an open access article distributed under the terms and conditions of the Creative Commons Attribution (CC BY) license (http://creativecommons.org/licenses/by/4.0/).
Share and Cite
Petrossian, G.; Hohimer, C.J.; Ameli, A. Highly-Loaded Thermoplastic Polyurethane/Lead Zirconate Titanate Composite Foams with Low Permittivity Fabricated using Expandable Microspheres. Polymers 2019, 11, 280. https://0-doi-org.brum.beds.ac.uk/10.3390/polym11020280
Petrossian G, Hohimer CJ, Ameli A. Highly-Loaded Thermoplastic Polyurethane/Lead Zirconate Titanate Composite Foams with Low Permittivity Fabricated using Expandable Microspheres. Polymers. 2019; 11(2):280. https://0-doi-org.brum.beds.ac.uk/10.3390/polym11020280
Chicago/Turabian StylePetrossian, Gayaneh, Cameron J. Hohimer, and Amir Ameli. 2019. "Highly-Loaded Thermoplastic Polyurethane/Lead Zirconate Titanate Composite Foams with Low Permittivity Fabricated using Expandable Microspheres" Polymers 11, no. 2: 280. https://0-doi-org.brum.beds.ac.uk/10.3390/polym11020280