
Analysis of AM Parameters on Surface Roughness Obtained in PLA Parts Printed with FFF Technology


1
Department of Mechanical Engineering, Barcelona School of Industrial Engineering (ETSEIB), Universitat Politècnica de Catalunya-Barcelona Tech (UPC), 08028 Barcelona, Spain
2
Engineering Department, Public University of Navarre (UPNA), Arrosadia Campus, 31006 Pamplona, Spain
*
Author to whom correspondence should be addressed.
Polymers 2021, 13(14), 2384; https://0-doi-org.brum.beds.ac.uk/10.3390/polym13142384
Submission received: 22 June 2021
/
Revised: 16 July 2021
/
Accepted: 17 July 2021
/
Published: 20 July 2021
(This article belongs to the Special Issue Applications of 3D Printing for Polymers)
Abstract
:Fused filament fabrication (FFF) 3D printing technology allows very complex parts to be obtained at a relatively low cost and in reduced manufacturing times. In the present work, the effect of main 3D printing parameters on roughness obtained in curved surfaces is addressed. Polylactic acid (PLA) hemispherical cups were printed with a shape similar to that of the acetabular part of the hip prostheses. Different experiments were performed according to a factorial design of experiments, with nozzle diameter, temperature, layer height, print speed and extrusion multiplier as variables. Different roughness parameters were measured—Ra, Rz, Rku, Rsk—both on the outer surface and on the inner surface of the parts. Arithmetical mean roughness value Ra and greatest height of the roughness profile Rz are usually employed to compare the surface finish among different manufacturing processes. However, they do not provide information about the shape of the roughness profile. For this purpose, in the present work kurtosis Rku and skewness Rsk were used. If the height distribution in a roughness profile follows a normal law, the Rku parameter will take a value of 3. If the profile distribution is symmetrical, the Rsk parameter will take a value of 0. Adaptive neural fuzzy inference system (ANFIS) models were obtained for each response. Such models are often employed to model different manufacturing processes, but their use has not yet been extended to 3D printing processes. All roughness parameters studied depended mainly on layer height, followed by nozzle diameter. In the present work, as a general trend, Rsk was close to but lower than 0, while Rku was slightly lower than 3. This corresponds to slightly higher valleys than peaks, with a rounded height distribution to some degree.
1. Introduction
Over the last two decades there has been a huge increase in the demand for orthopedic implants due to an aging population and increasing life expectancy [1]. In the specific case of hip arthroplasty, this has increased by 30% worldwide compared with the year 2000 [2]. At the State level, there has also been an increase in this type of surgery, from 72 interventions per 100,000 inhabitants in 2000 to 102 per 100,000 inhabitants in 2011, which represents a total of 47,006 implants that year [1]. Across Europe, 650,000 hip prostheses were implanted in 2017, and growth is estimated at 2% per year until 2024, when it is expected to exceed 730,000 implants [3]. This increase in demand has prompted the improvement of biomaterials, manufacturing methods and design processes of these medical devices.
Materials used for medical applications must be biocompatible, which means that not only must they not be toxic, but the interaction of the material with the cells must have a positive effect. In this way, most of the prostheses used today are either made of metal or by a combination of metal with plastic parts. In addition, its design must mimic the morphological structure of bones and promote osteogenesis, that is, the formation of bone tissue. Historically, the fixation of these implants has been achieved using polymethylmethacrylate (PMMA), an acrylic polymer commonly known as “bone cement”. However, this fixation method carries the risk of the bone cement degrading over time, and it may come off or cause inflammation in adjacent tissues [4]. From the 1980s onwards, non-cemented prostheses appeared on the market, which, unlike cemented ones, are biologically fixed to the host bone. This fixation is achieved by making prostheses with a porous coating so that bone tissue can regenerate by infiltrating the porosity of the implant, a phenomenon called osseointegration.
In recent years, different additive manufacturing (AM) processes have been used to manufacture orthopedic implants. Specifically, extrusion 3D printing processes provide parts with complex shapes and, specifically, with porous structures, to be obtained [5]. In addition, extrusion 3D printing processes do not require the use of molds or dies, thus allowing the manufacture of customized prostheses at relatively low cost [6]. Polylactic acid (PLA) is a biocompatible material used in orthopedic applications [7]. Unlike other plastic materials such as polyglycolide (PGA), PLA has a low degradation rate and, for this reason, inflammatory response occurs as late as 2 or 3 years after the operation [8]. Nonetheless, in a study on implanted pins, rods, bolts and screws, PLA showed a low incidence of adverse tissue reaction of 0.2% [9].
Several authors have studied the influence of 3D printing parameters on average surface roughness Ra of the lateral walls obtained in fused deposition modeling (FDM) processes, also known as fused filament fabrication (FFF). For instance, Rahman et al. [10] found that low bed temperature, high 3D printing speed, medium infill, low layer thickness and a low number of shells are recommended in order to reduce Ra (arithmetical mean roughness value) when 3D printing acrylonitrile-butadiene-styrene (ABS) components. Peng and Yan [11] studied PLA parts and found that lowest Ra and Rz (greatest height of the roughness profile) values were obtained with low layer height and high speed. In addition, roughness is greatly influenced by the measurement direction. The higher the inclination of a wall is, the higher the theoretical value of the Ra parameter becomes [12,13]. Regarding other roughness parameters, in a previous study with PLA cylindrical parts, it was found that, as a general trend, slightly negative Rsk (skewness) values are obtained in lateral walls of printed parts, corresponding to slightly sharp valleys and rounded peaks. The Rku (kurtosis) values ranged between 1.7 and 2.3 for different 3D printing angles [13]. Alsoufi and Elsayed also reported negative values for Rsk, with higher Rku between 2.7 and 3.4 for PLA [14]. For reinforced PLA, Rku values increased up to almost 6. All measurements correspond to flat vertical walls. However, few studies are known about kurtosis and skewness on curved surfaces of 3D printed parts.
On the other hand, over the last few years fuzzy inference systems (FIS) and adaptive neural fuzzy inference systems (ANFIS) have been widely employed for modelling output variables in manufacturing processes, where Takagi–Sugeno [15] and Mamdani [16,17] are the most commonly FISs employed. Several studies can be found in the literature dealing with the application of design of experiments (DOE) along with conventional statistical regression and soft computing techniques in order to analyze the influence of process parameters over some response variables in manufacturing engineering. In this way, hybrid learning procedures that combine artificial neural networks (ANNs) and fuzzy inference systems (FISs), which are named as adaptive-neural fuzzy inference systems (ANFIS), are one of the most interesting techniques for this purpose. From the research study of Jang [18], several studies have been developed that employ ANFISs, as can be observed in the review of the state of the art by Shihabudheen and Pillai [19]. Some other examples found in the literature are that of Aamir et al. [20], which used a Mamdani FIS in order to predict the surface roughness and hole size as a function of feed rate and cutting speed in multi-hole drilling; that of Pandiyan et al. [21], where the authors employed a Sugeno FIS and a Taguchi experimental design as the inputs for the ANFIS model in order to predict the material depth of cut [21]; and that of Mensah et al. [22], which employed an adaptive neuro-fuzzy inference system to predict both the heat release capacity and the total heat release of the extruded polystyrene measured from microscale combustion calorimetry experiments using a Sugeno FIS—where these authors found that the ANFIS can be used accurately and reliably in flammability studies, among the many other research studies that could be mentioned.
With regard to additive manufacturing, in recent years, the application of machine learning and soft computing techniques are gaining a growing interest [23], as can also be observed in studies such as that of Saleh et al. [24], which analyzed the effect of water-silica slurry impacts on polylactic acid (PLA), processed by fused deposition modelling (FDM), by using an ANFIS in which building orientation, layer thickness, and slurry impact angle were the inputs and weight gain resulting from water, net weight gain, and total weight gain were the outputs. In their study, a Taguchi orthogonal array was used for planning the experiments. Moreover, generalized bell membership functions and a Sugeno FIS were also considered in their study. Among their conclusions, the authors found that the ANFIS could adequately predict the effect of slurry impacts on PLA material processed by FDM [24]. Likewise, Kumar et al. [25] employed a fuzzy inference system combined with the Taguchi philosophy for optimization of the FDM process parameters. These authors employed a Mamdani FIS and triangular membership functions. Moreover, they used the centroid in order to de-fuzzify the aggregated output. Some other studies, such as that of Sai et al. [26], employed a central composite design and an ANFIS to analyze the influence of process parameters in FDM of PLA implants. Moreover, hybrid optimization techniques based on genetic algorithm-adaptive neuro fuzzy interface system (GA-ANFIS) have also been used in order to optimize the FDM process parameters, as can be observed in Deshwal et al. [27]. Another study developed by Rajpurohit et al. [28] employed an ANFIS for prediction of tensile strength in FDM parts. Some other research studies worth mentioning are that of Mahesh et al. [29], in which an FIS is employed for decision and benchmarking in order to select appropriate rapid prototyping and manufacturing processes, such as SLA, SLS and FDM, among other processes; that of Yadav et al. [30], in which the influence of layer height, material density and extrusion temperature on the mechanical properties of FDM parts is analyzed by using an ANFIS; and the research study of Huynh et al. [31], in which a Taguchi design of experiments along with a Mamdani FIS using triangular membership functions is employed to determine the accuracy of manufactured PLA parts using FDM. Regression models are usually employed to analyze the effect of printing parameters on roughness in FDM processes [32,33].
In the present work, hemispherical cups were printed in PLA material with the FFF extrusion technology. Different roughness parameters such as Ra, Rz, Rsk and Rku were measured, by means of a contact roughness meter. The first two parameters are usually employed for comparison of manufactured surfaces. The last two mentioned parameters give information about the shape of the roughness profile. Roughness was determined on both the external and the internal surfaces of the specimens in order to assess if there are differences in the surface finish of both surfaces. Those differences could be attributed to the solidification process of the material, mainly in contact with air and with the printing supports, respectively. ANFIS models were obtained for each response as a function of the process parameters, and the main variables influencing roughness were determined. The ANFIS models have the advantages of modeling nonlinear systems, high adaptation capability and a fast learning process [34]. The present work will help to select appropriate printing processes when curved surfaces are to be 3D printed in PLA. Moreover, the results could be applied to other extrusion 3D printing processes such as direct ink writing (DIW) for inert ceramics, which can also be employed to manufacture prostheses.
2. Materials and Methods
2.1. D printing Process
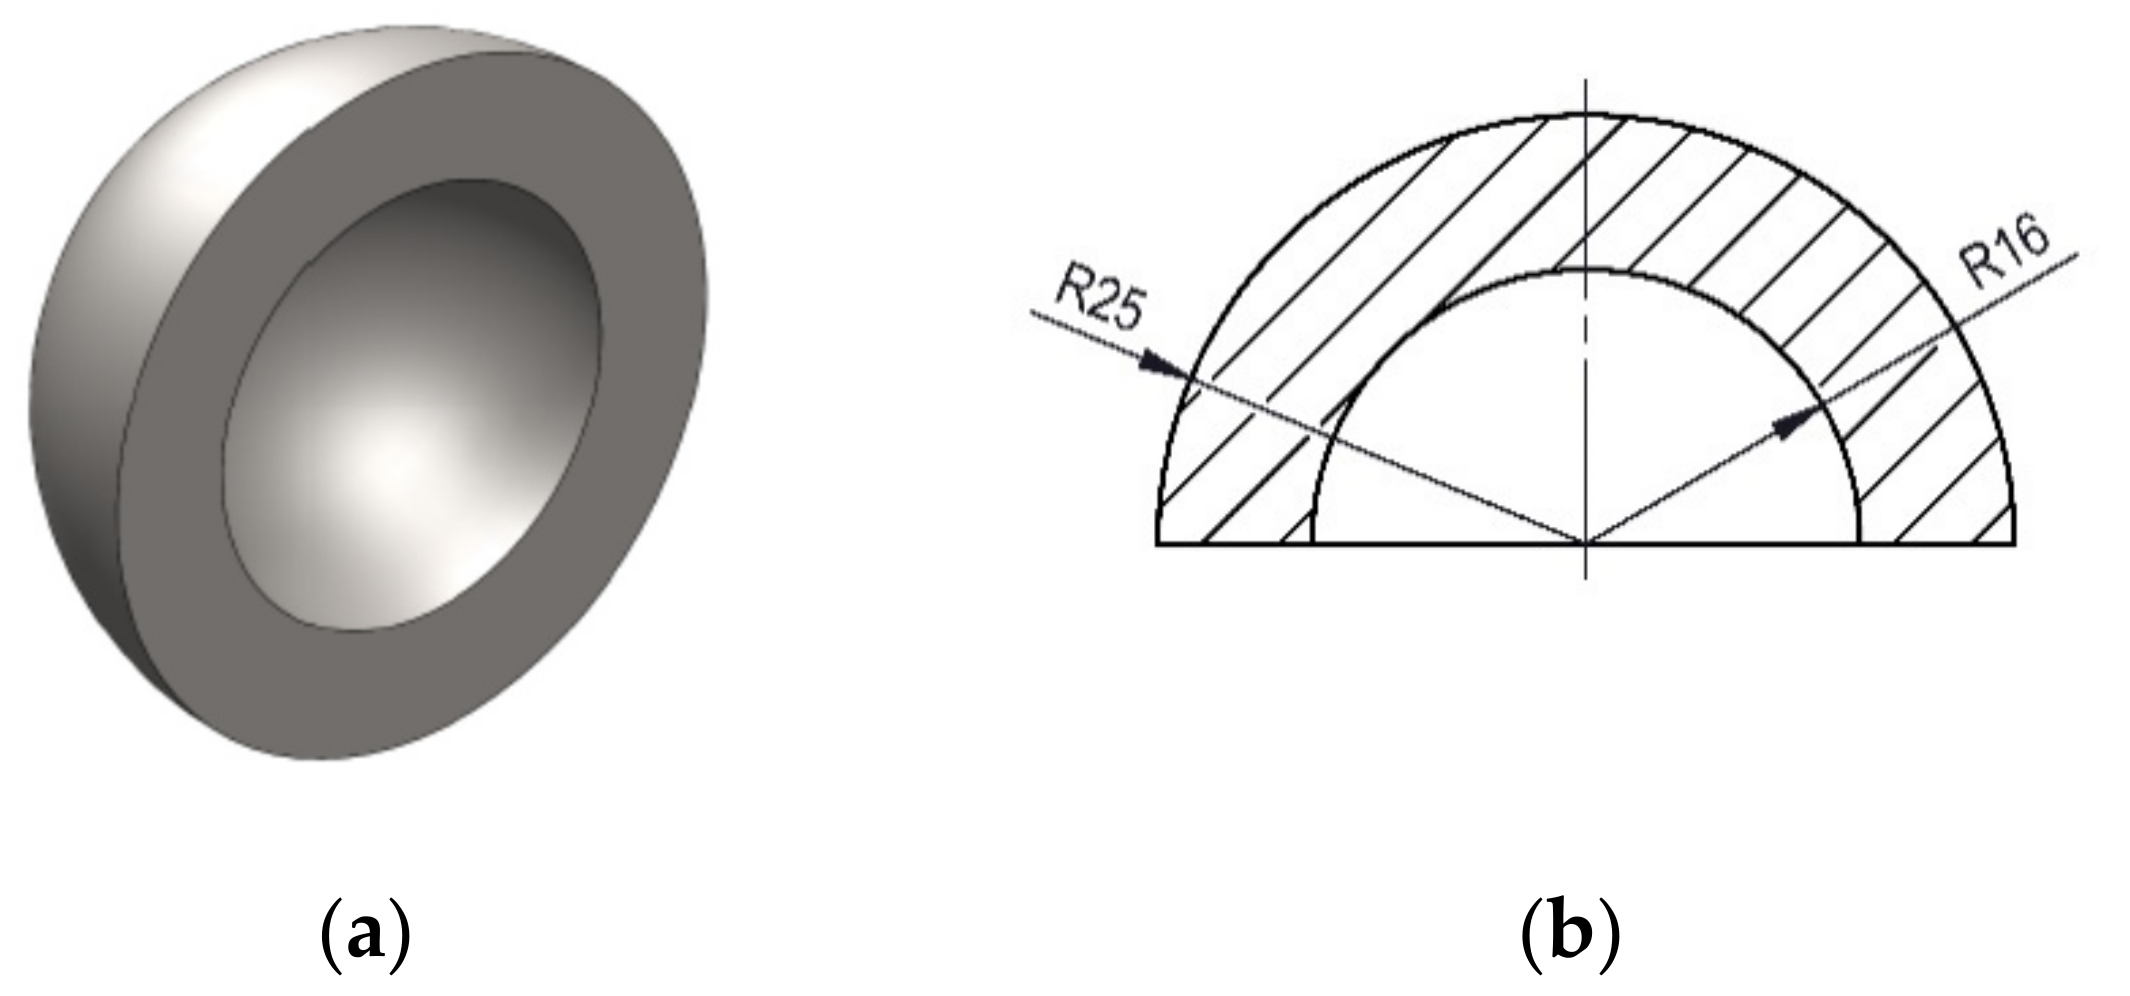
Hemispherical cups were printed of internal dimeter 32 mm and external diameter 50 mm, according to Meftah et al. [35] (Figure 1).
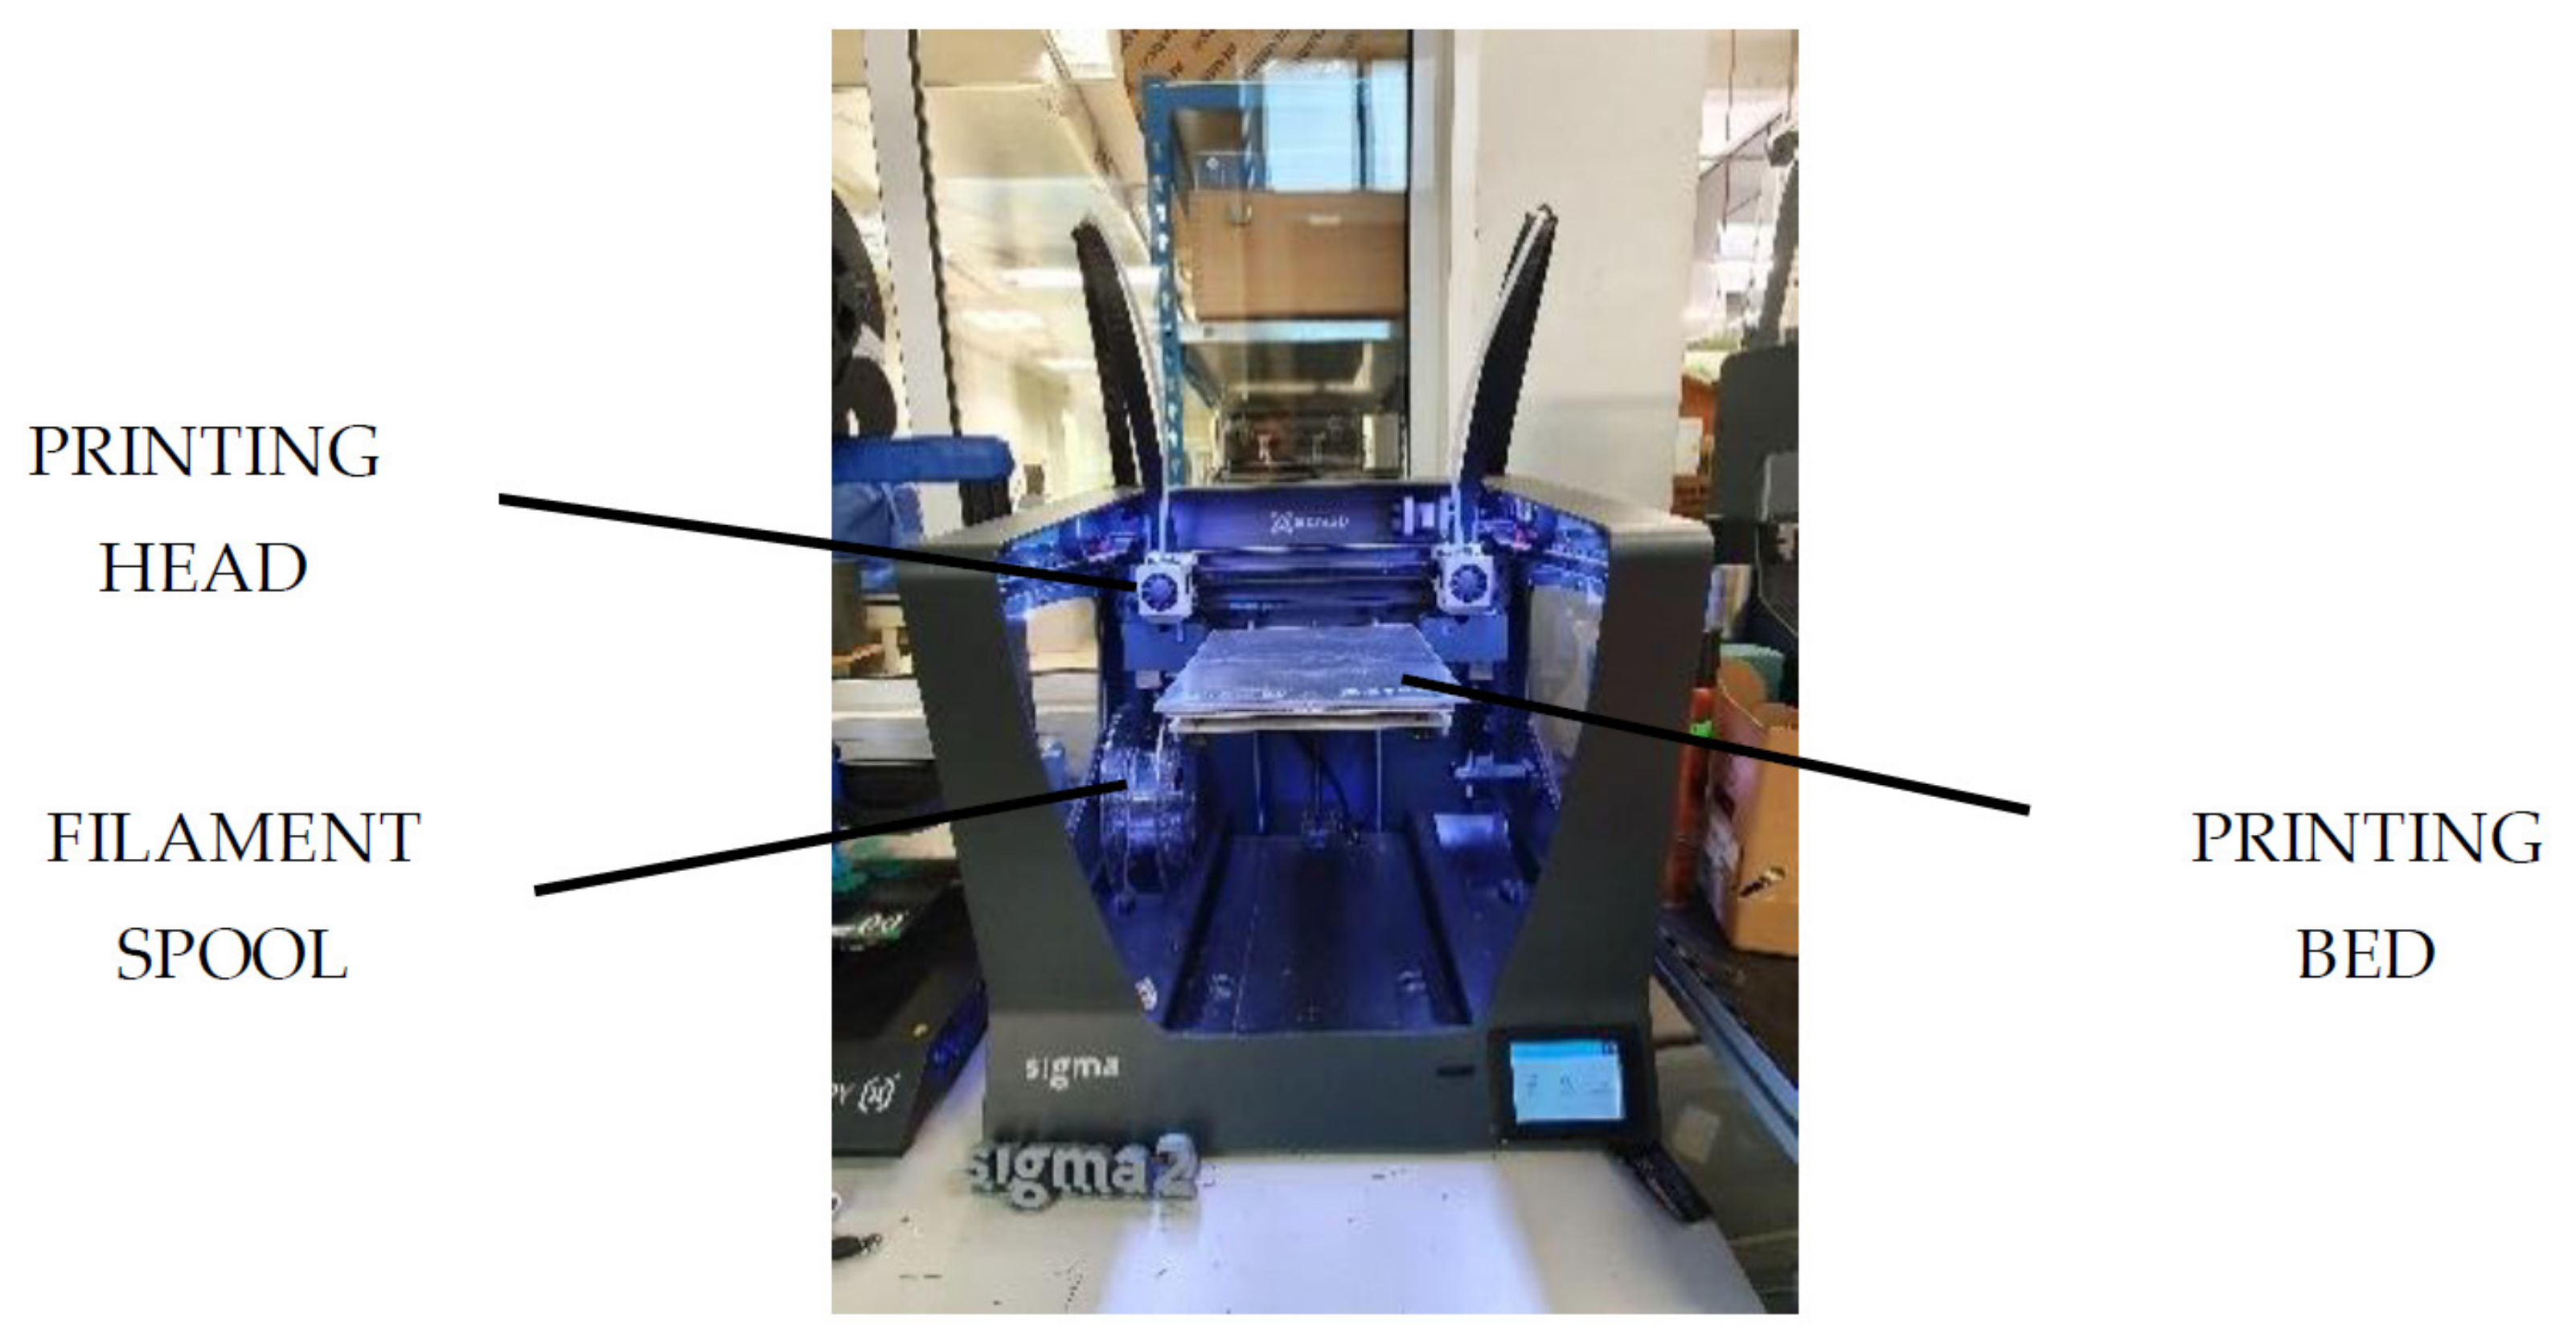
White polylactic acid (PLA) filament of 2.85 mm diameter from BCN3D was used to print the samples in a SigmaR19 printer from BCN3D Technologies, Castelldefels, Barcelona, Spain (Figure 2).
Fixed 3D printing parameters were infill 20%, shell thickness of 1.2 mm, shell pattern concentric, infill pattern grid, printing bed temperature 65 °C. Printing supports were required. They were printed in PLA and removed by hand. Infill of the support was 50%, the grid pattern was used, z offset = 0, and xy offset = 0. The maximum angle without supports was fixed as 30°. The experiments were defined according to a fractional factorial design 25−1, with 5 variables and 2 levels. The five selected variables presented in Table 1 have been shown to influence roughness. Their values were selected according to the machine manufacturer’s recommendations for PLA, as well as from the results of previous studies [13]. The infill value was set to 20% so that the printing time was low.
The selected output values are different roughness parameters as shown in Table 2.
Ra and Rz parameters are widely used to characterize the surface finish of manufactured parts. However, those parameters do not provide information about the shape of the roughness profile. For example, they cannot discriminate between surfaces with high or low interference shear strength. For this purpose, other parameters such as kurtosis Rku and skewness Rsk are recommended [36]. Kurtosis corresponds to the peakedness of the profile, while skewness is related to its symmetry. Ideally, Rku should be close to 3, corresponding to a normal distribution of heights in the profile, and Rsk should be 0 in order to obtain a symmetrical profile. However, in extrusion 3D printing processes Rku values below 2 and slightly negative Rsk values have been reported [37], corresponding to highest valleys than peaks and a slightly rounded profile.
2.2. Roughness Measurement
Roughness was measured with a Talysurf 2 contact roughness meter from Taylor Hobson Ltd, Leicester, UK. A diamond tip was used with tip angle of 90° and tip radius of 2 µm. Measuring force is 0.8 mN and speed is 0.5 mm/s. A Gaussian filter was employed. A cut-off value of 0.8 mm was used according to ISO 4288 [38]. Total sampling length was 4.8 mm (6 × 0.8 mm).
Roughness was measured along generatrices of both the external and the internal surfaces of the hemispherical cups, in order to assess if there were differences regarding their surface finish. The internal surface of the cup is concave, and it solidifies on a printing support (the printing position is shown in Figure 1b). This is expected to produce heat transfer by means of conduction with the support and between adjacent filaments, radiation between adjacent filaments, and convection with entrapped air, with low refrigeration. On the contrary, the external surface of the cup is convex, and it is expected to solidify in contact with air, mainly because of convection and radiation with the environment [39]. For this reason, the external surface of the cups is likely to solidify more quickly than the internal one.
2.3. ANFIS Modelling
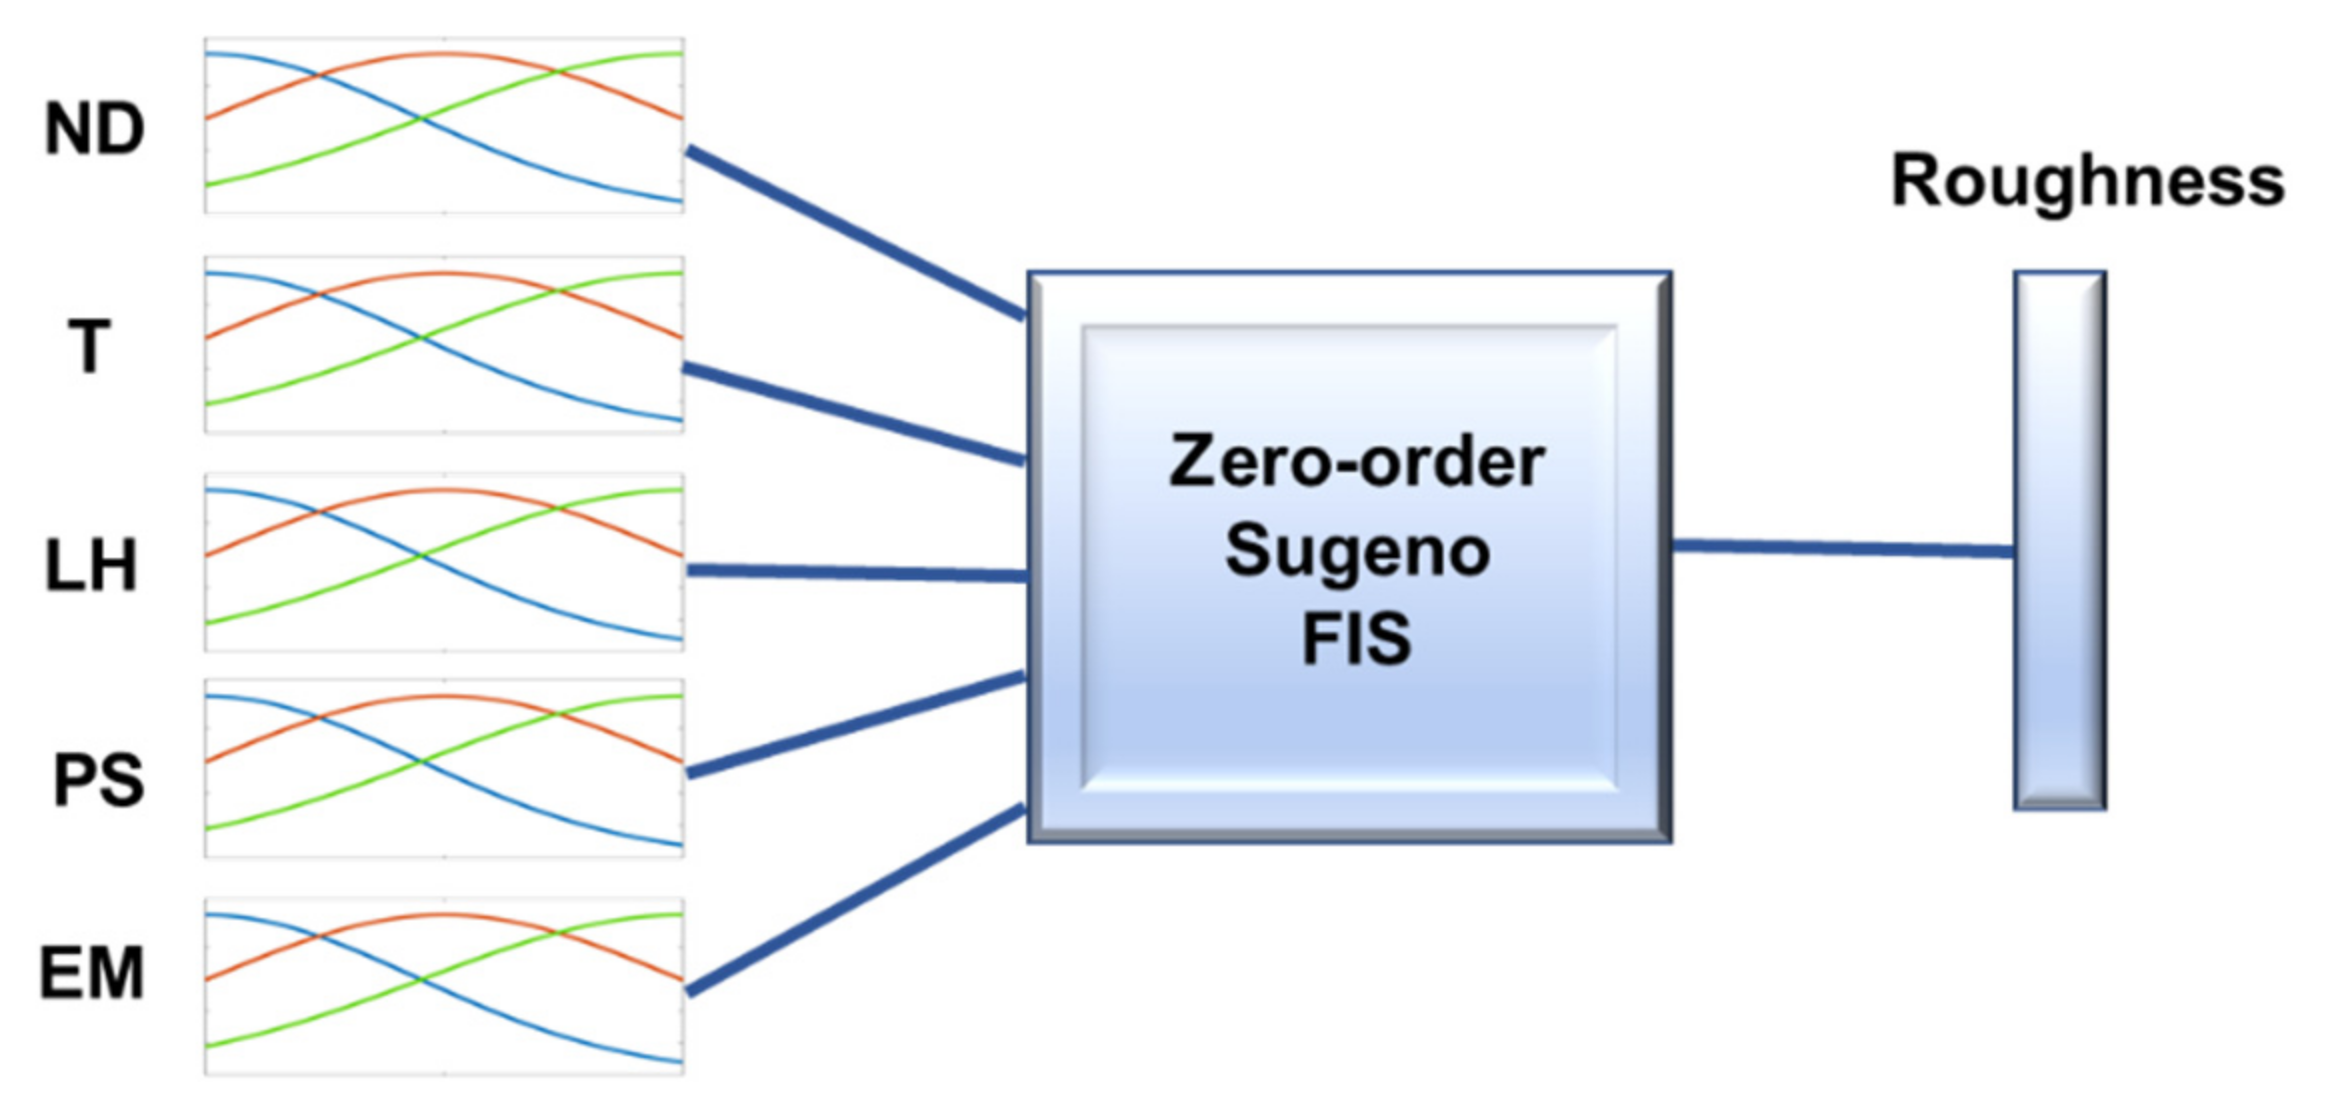
A zero-order Sugeno FIS was employed by using the Fuzzy Logic Toolbox™ of MatlabTM2020a [40], from Mathworks, Natick, MA, USA, because the de-fuzzification process for a Sugeno system is computationally more efficient compared with that of a Mamdani system [40,41,42,43]. An FIS with “if then” rules was built from the DOE, where the membership functions for fuzzification of the independent variables were Gaussian and are shown in Equation (1).
The aggregation method is the sum of fuzzy sets, and the aggregated output is obtained from the weighted average of all output rules. Equation (2) shows the implication method and Equation (3) shows the output of the Sugeno system [40,41,42,43].
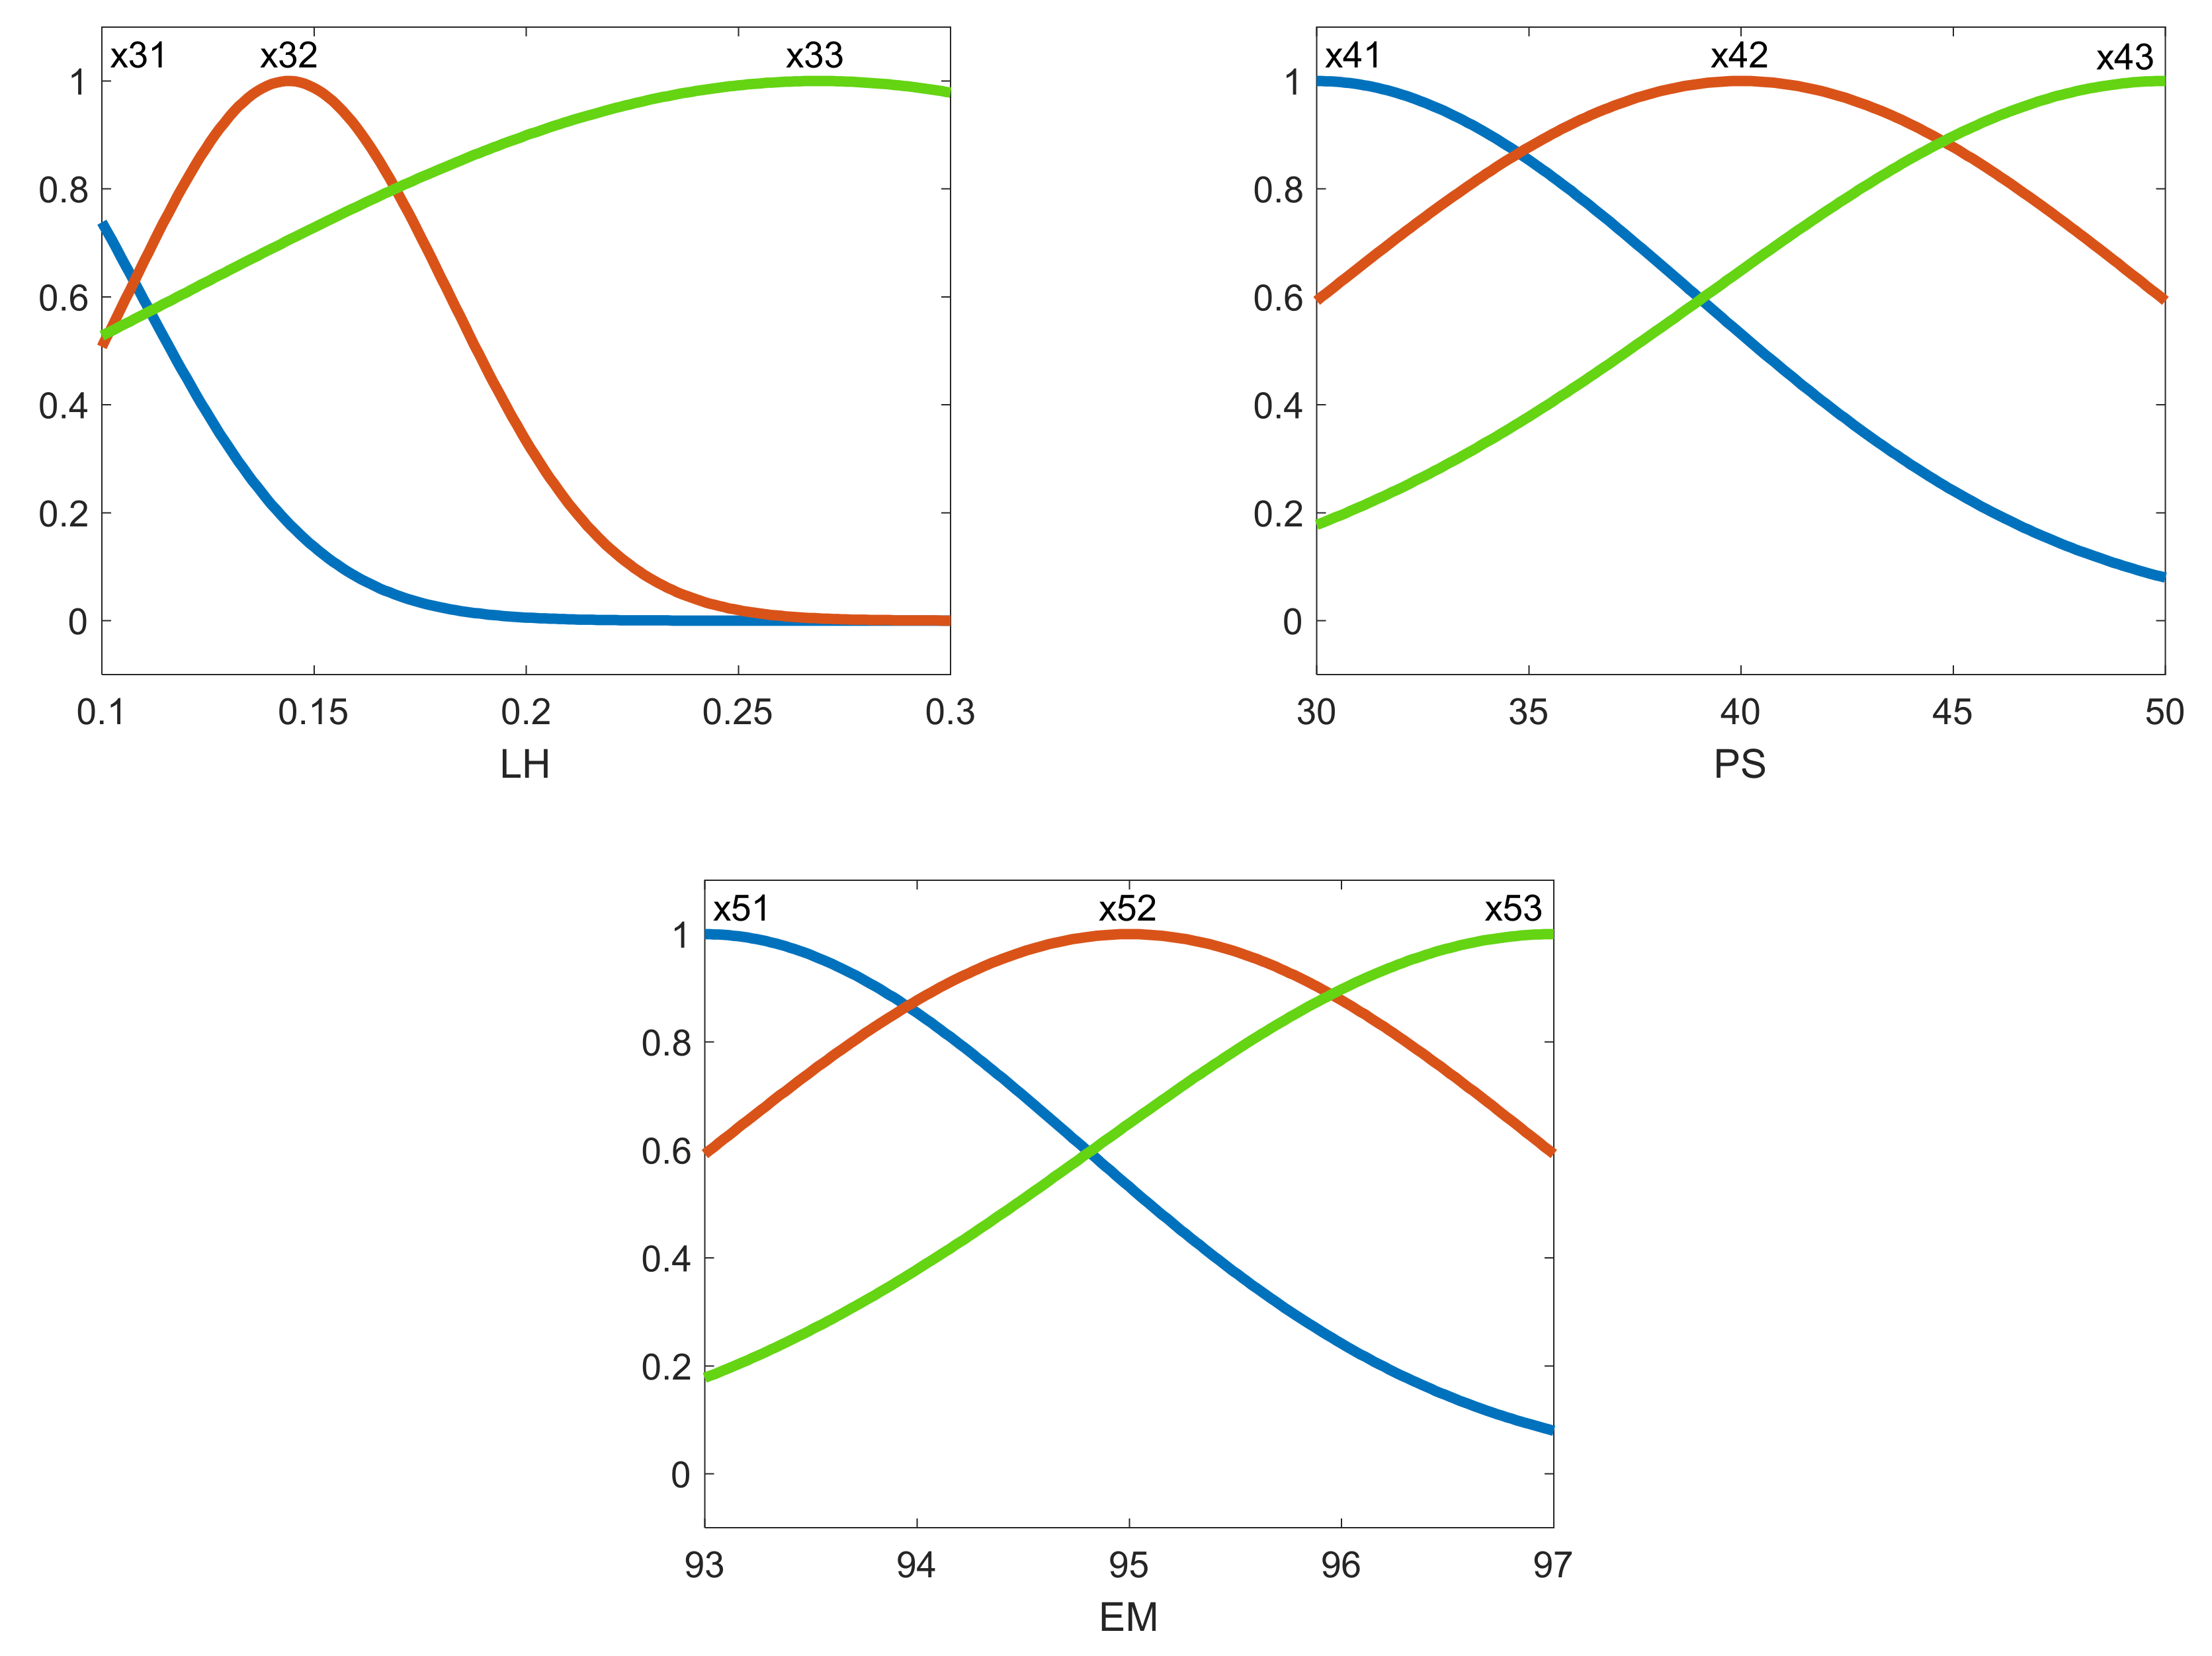
From the above, a zero-order Sugeno FIS [40,41,42] was selected with Gaussian membership functions. Figure 3 shows the Gaussian membership functions for modelling the roughness parameters before using the ANFIS. In order to tune the so-generated fuzzy system, an ANFIS employing the Fuzzy Logic Toolbox of MatlabTM along with a back-propagation algorithm was used [40].
The roughness parameters analyzed in this present study were the arithmetical mean roughness value or arithmetical mean of the absolute values of the profile deviations from the mean line of the roughness profile , which is one of the most commonly employed parameters in industry; the mean roughness depth or average maximum peak to valley of five consecutive sampling lengths of the profile within a sampling length ; the kurtosis which is a measure of the sharpness of the profile; and the skewness which measures the symmetry of the profile. These parameters are defined in the UNE-EN-ISO 4287:1999 standard [44]. Figure 3 depicts the Gaussian membership functions used to obtain the fuzzy interference system for modelling roughness.
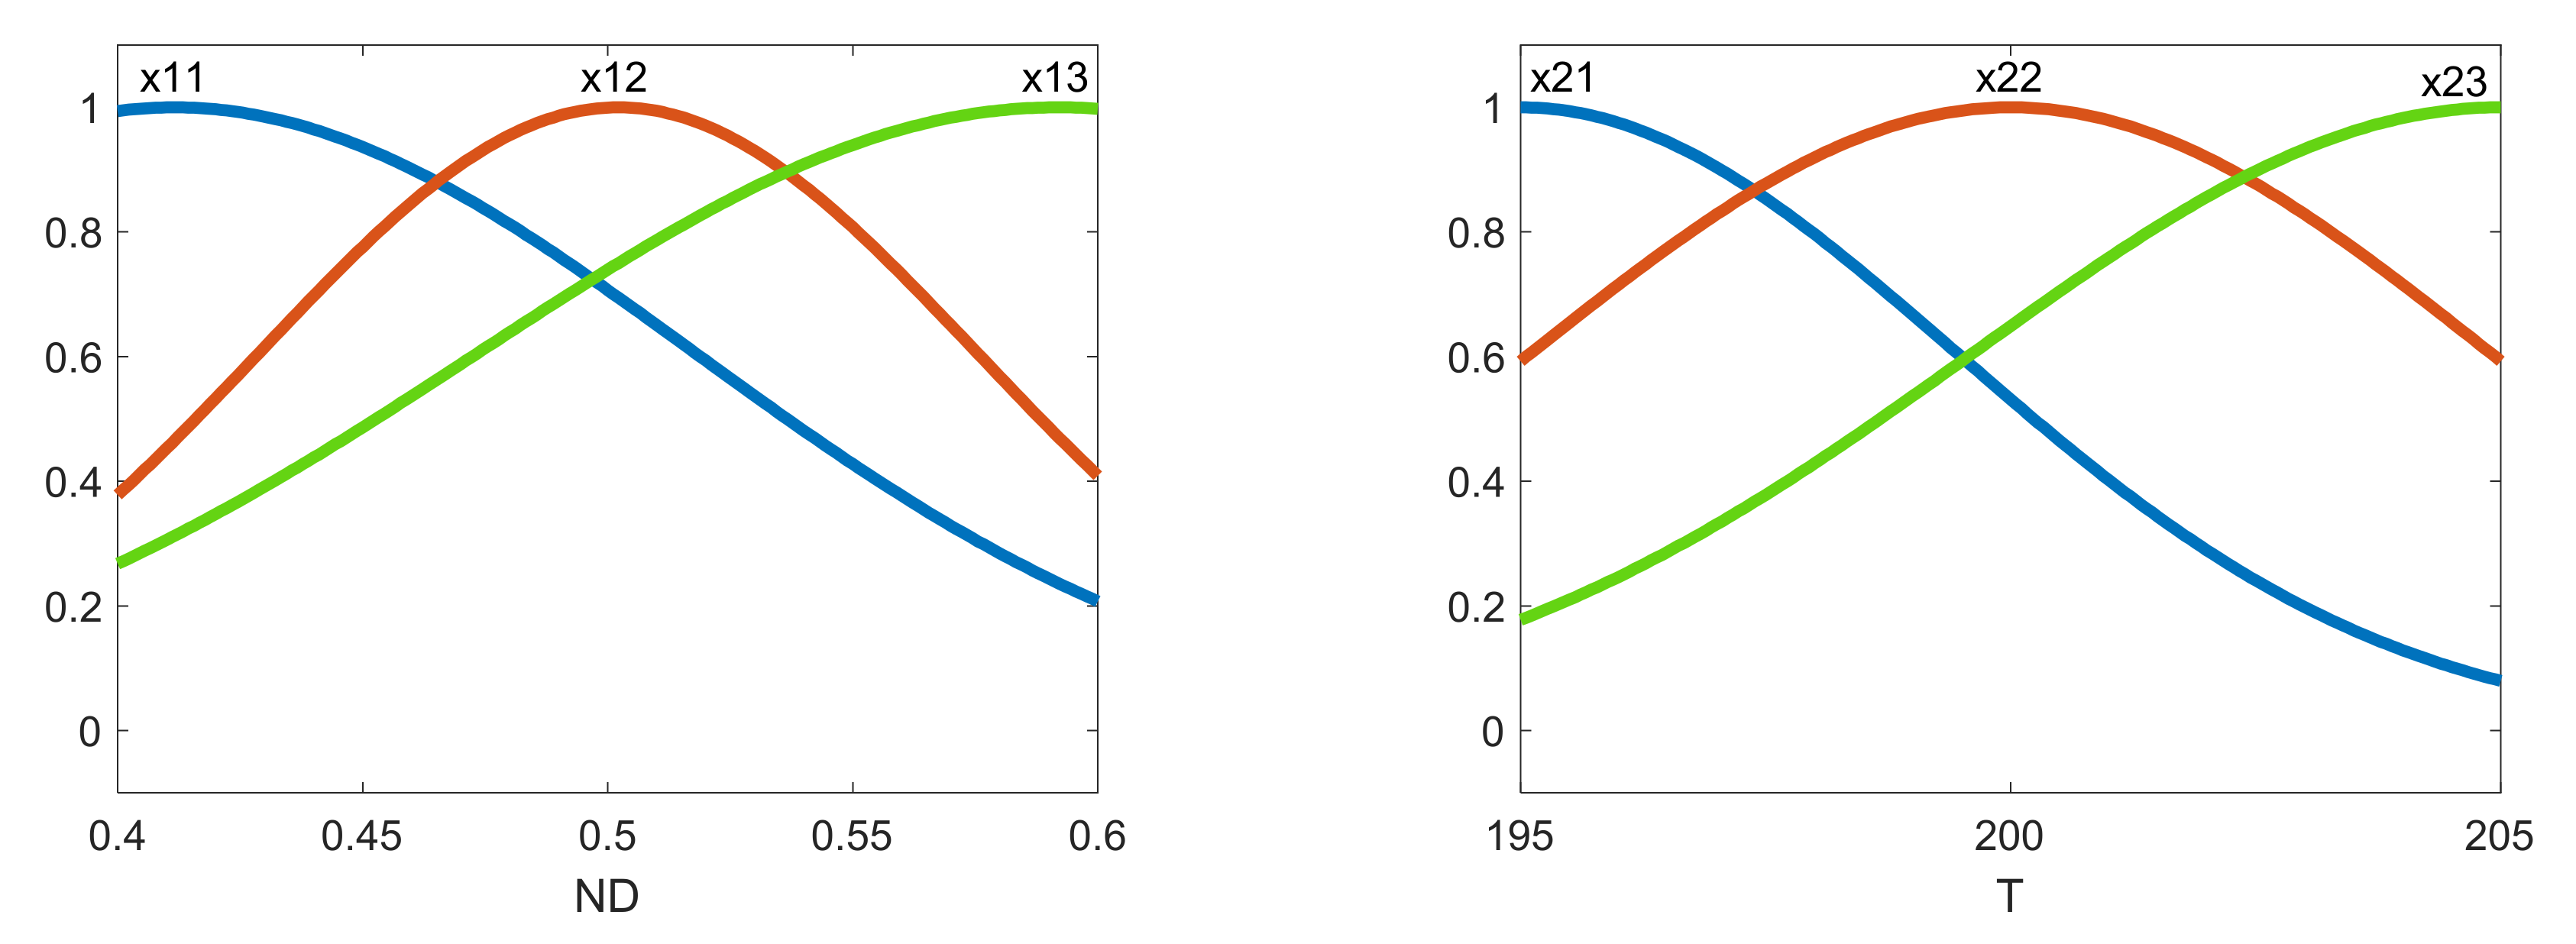
Once the FIS was obtained, then the ANFIS tuned the membership parameters. Figure 4 shows the membership functions after the FIS for the case of the arithmetic average roughness of the roughness profile on the outer layer of the manufactured prototypes.
3. Results and Discussion
3.1. Roughness
Table 3 presents the roughness results for both the internal and the external surfaces of the hemispherical cups. One measurement was performed on each surface.
For external roughness, lowest Ra and Rz values below 8 µm and 38 µm respectively corresponded to low layer height, low nozzle diameter and low temperature. Rku values ranged between 2.1 and 2.8, while Rsk values ranged between −0.773 and 0.123. Similar results were obtained for the internal and the external surfaces. Highest difference of 21% was observed for experiment 9. In another work with hollow prismatic specimens, similar difference values were reported [12].
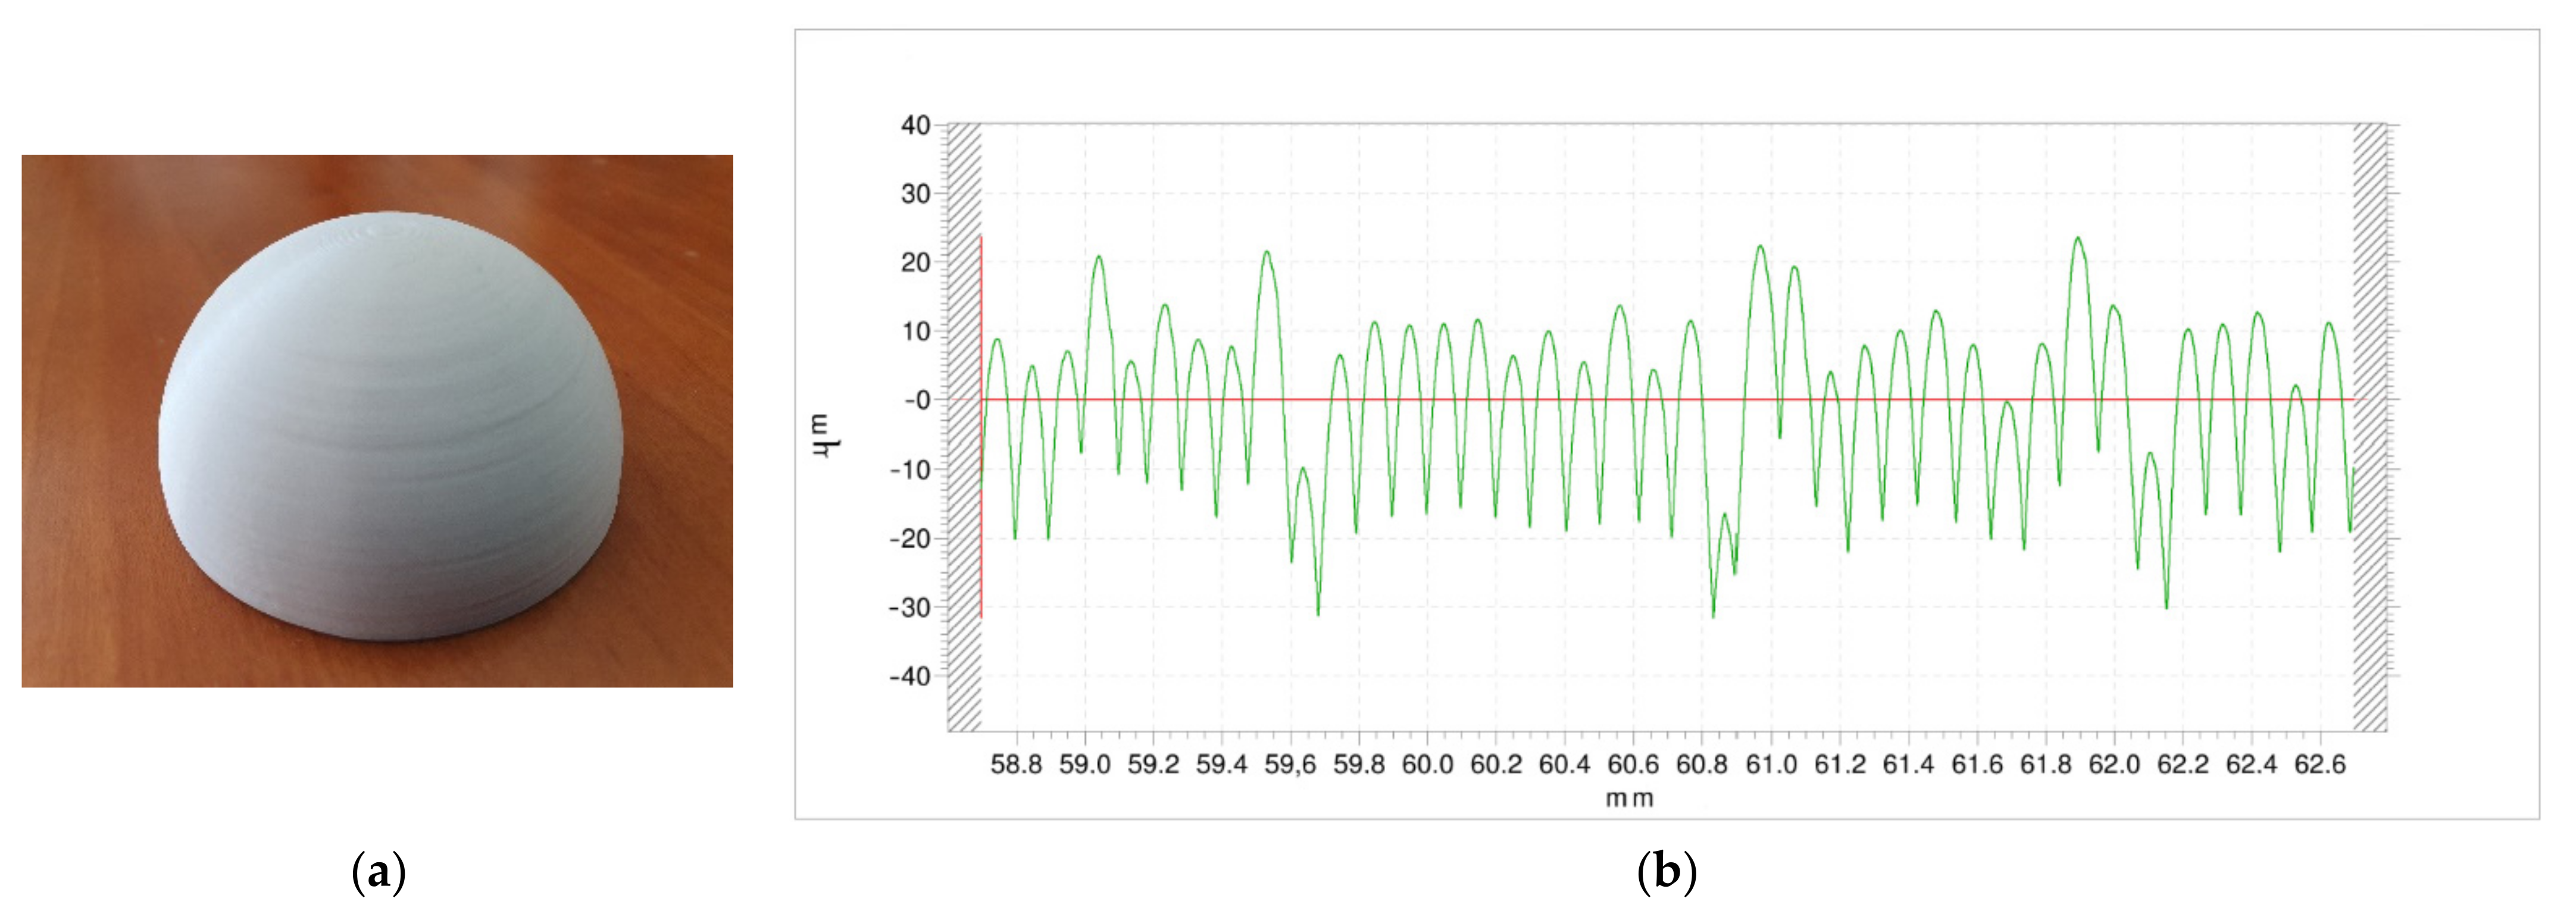
Figure 5 shows the external surface of experiment 12, obtained with high nozzle diameter, high temperature, low layer height and high print speed. The characteristic stair-stepping effect of the FDM-3D printed parts is observed (Figure 5a). Ra value is 8.90 µm. In the profile (Figure 5b), peak height ranges between 5 µm and 22 µm, suggesting some displacement between layers.
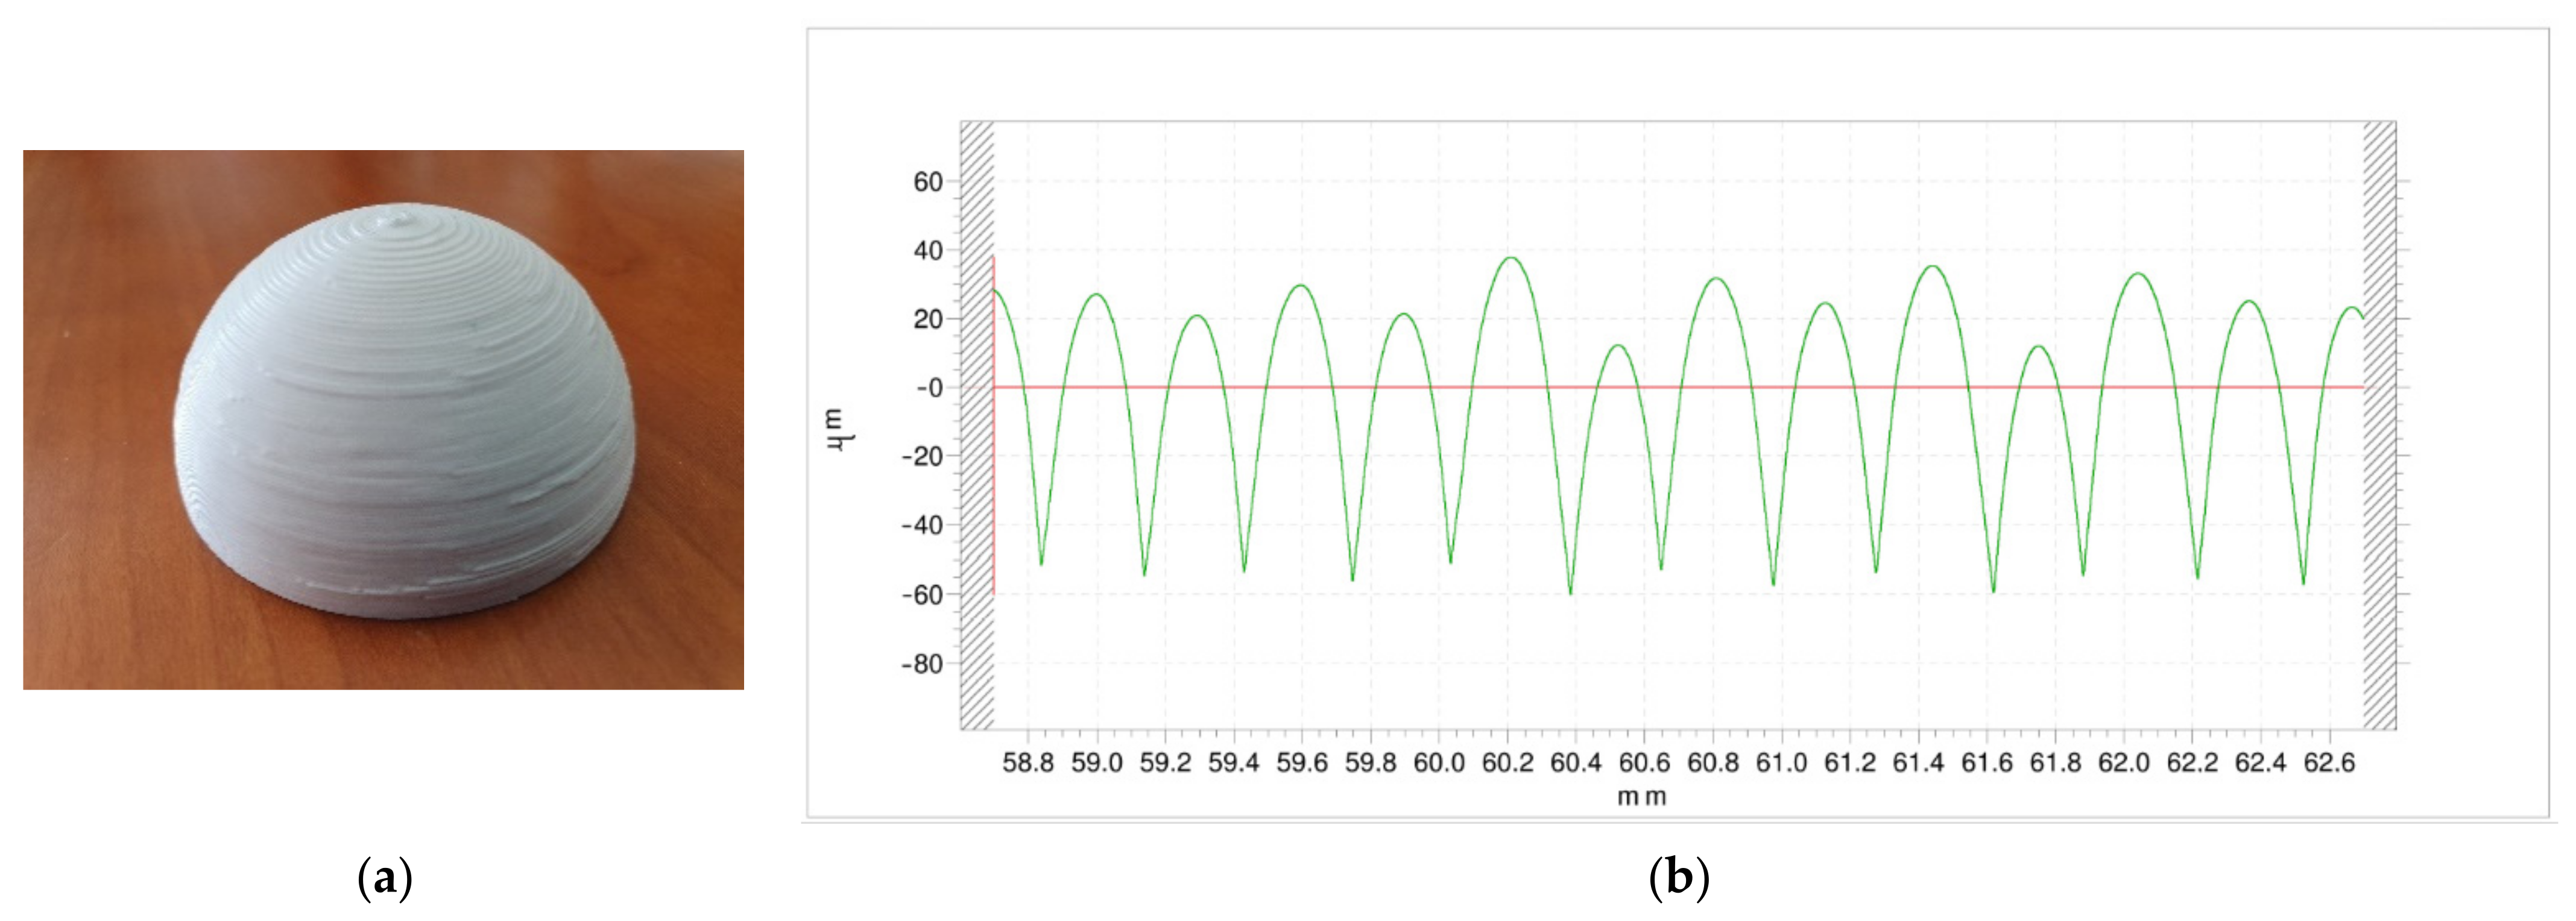
Figure 6 corresponds to the external surface of experiment 16, obtained with high nozzle diameter, high temperature, high layer height and high print speed. As a general trend, the combination of high nozzle diameter and high layer height is not recommended, not only because it provides high roughness values but also because an excess of material is observed in some areas of the surface (Figure 6a). However, roughness was measured in an area without protuberances. For this reason, a relatively steady profile was obtained (Figure 6b). Ra value was 21.77 µm. Peak height ranged between 10 µm and 40 µm, corresponding to the lateral misalignment of the layers.
3.2. Roughness Modelling
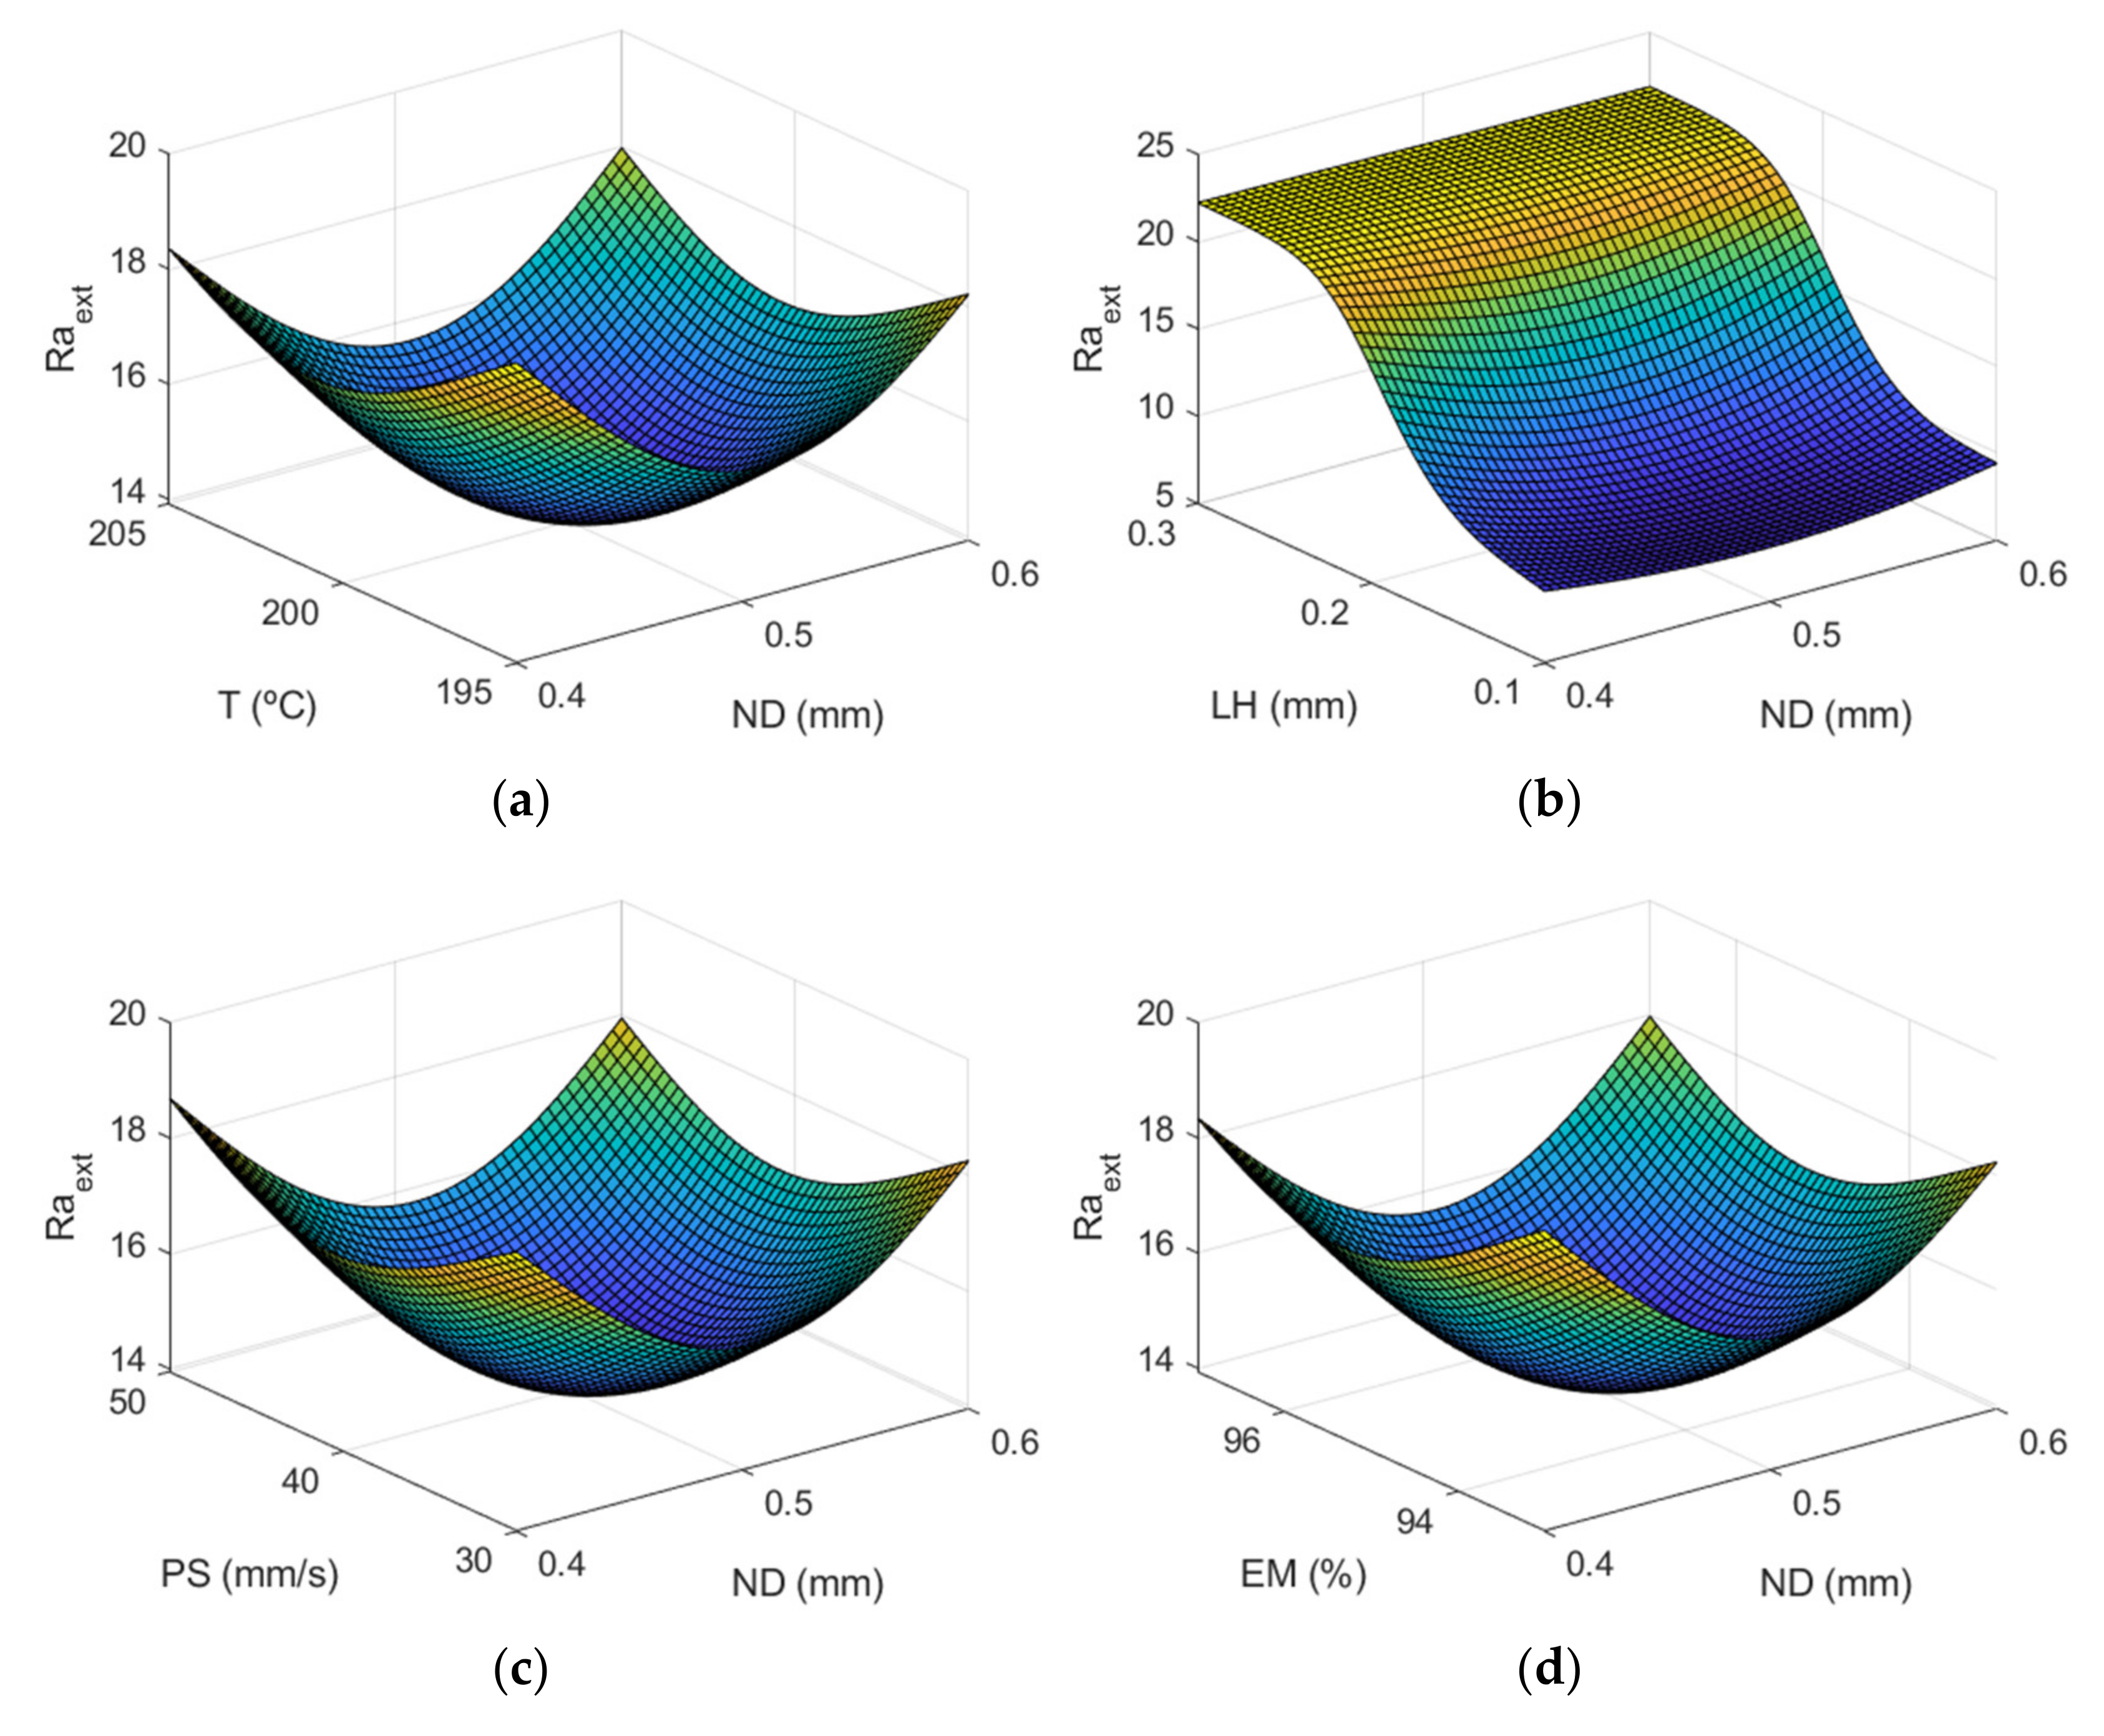
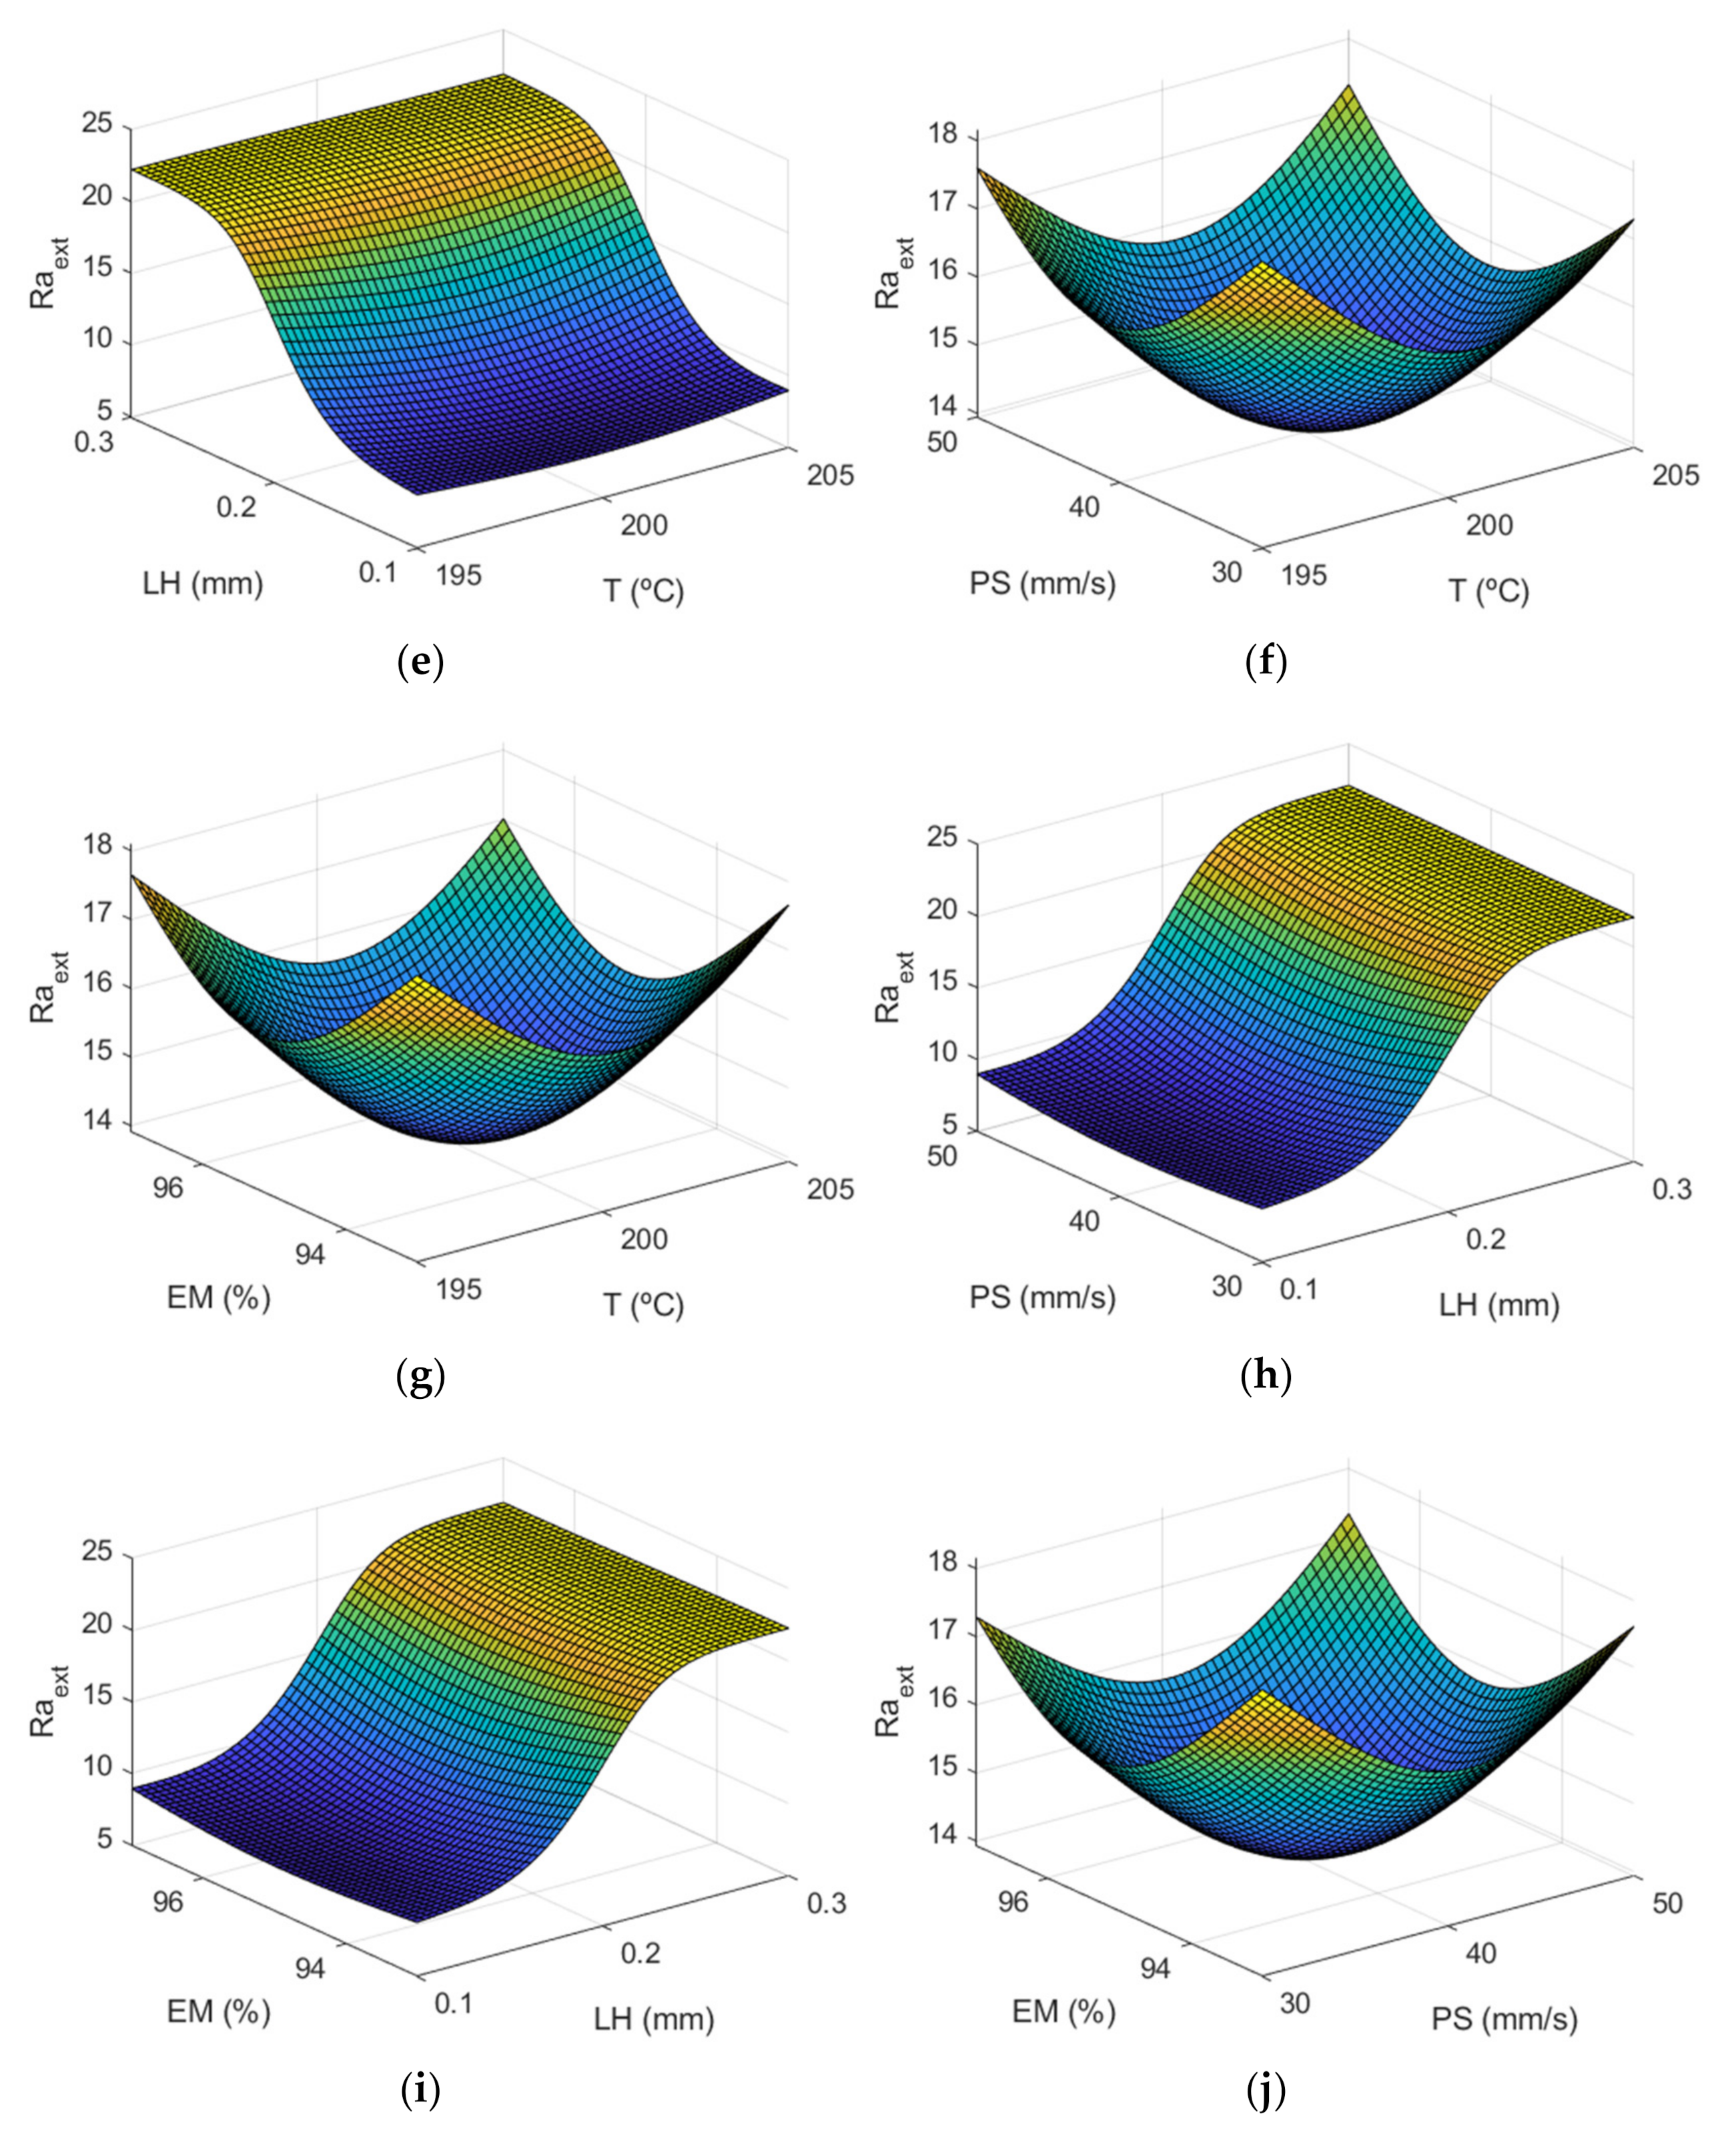
This section shows the results obtained when applying the ANFIS for modelling the above-mentioned roughness parameters. As previously mentioned, the roughness of the manufactured parts was measured inside and outside of the hemispherical cups made of PLA material that was printed using FFF technology. Figure 7 shows the surface plots of Raext vs different process variables.
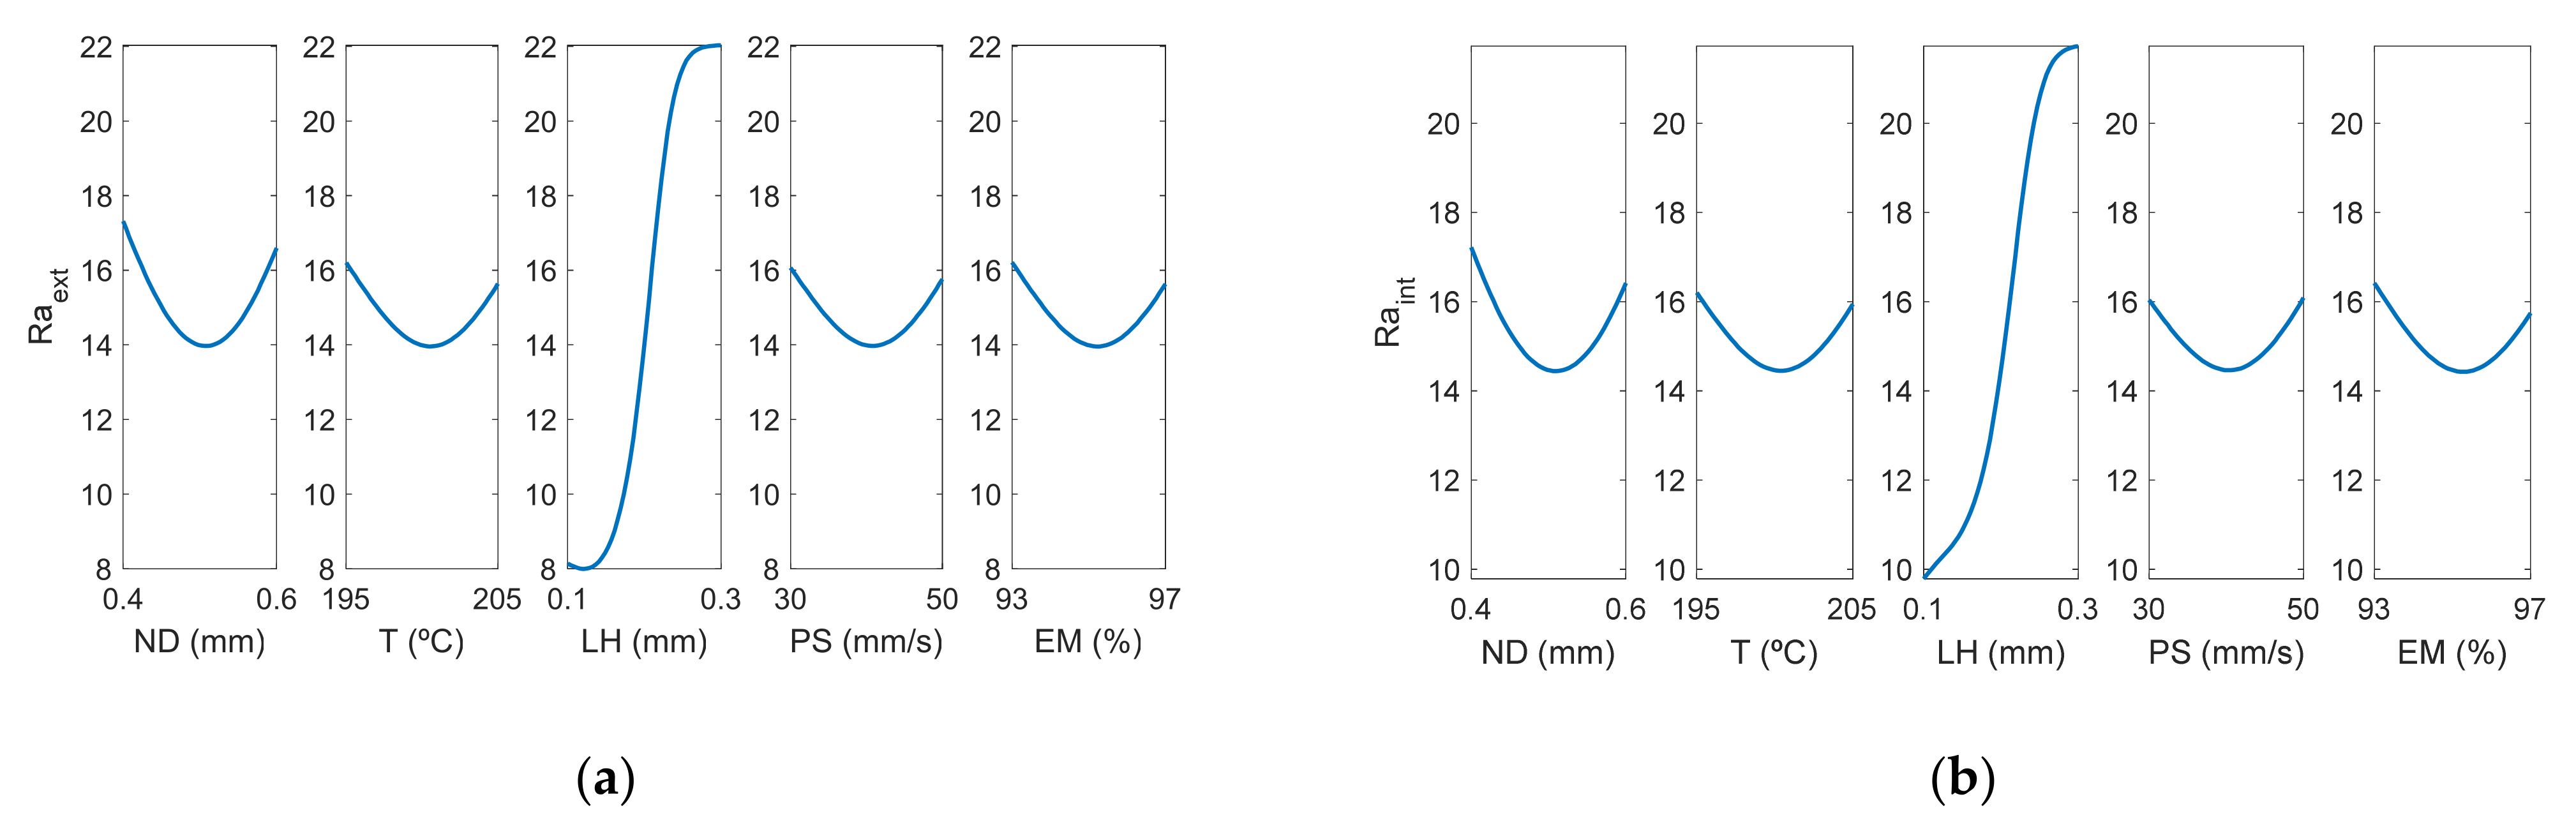
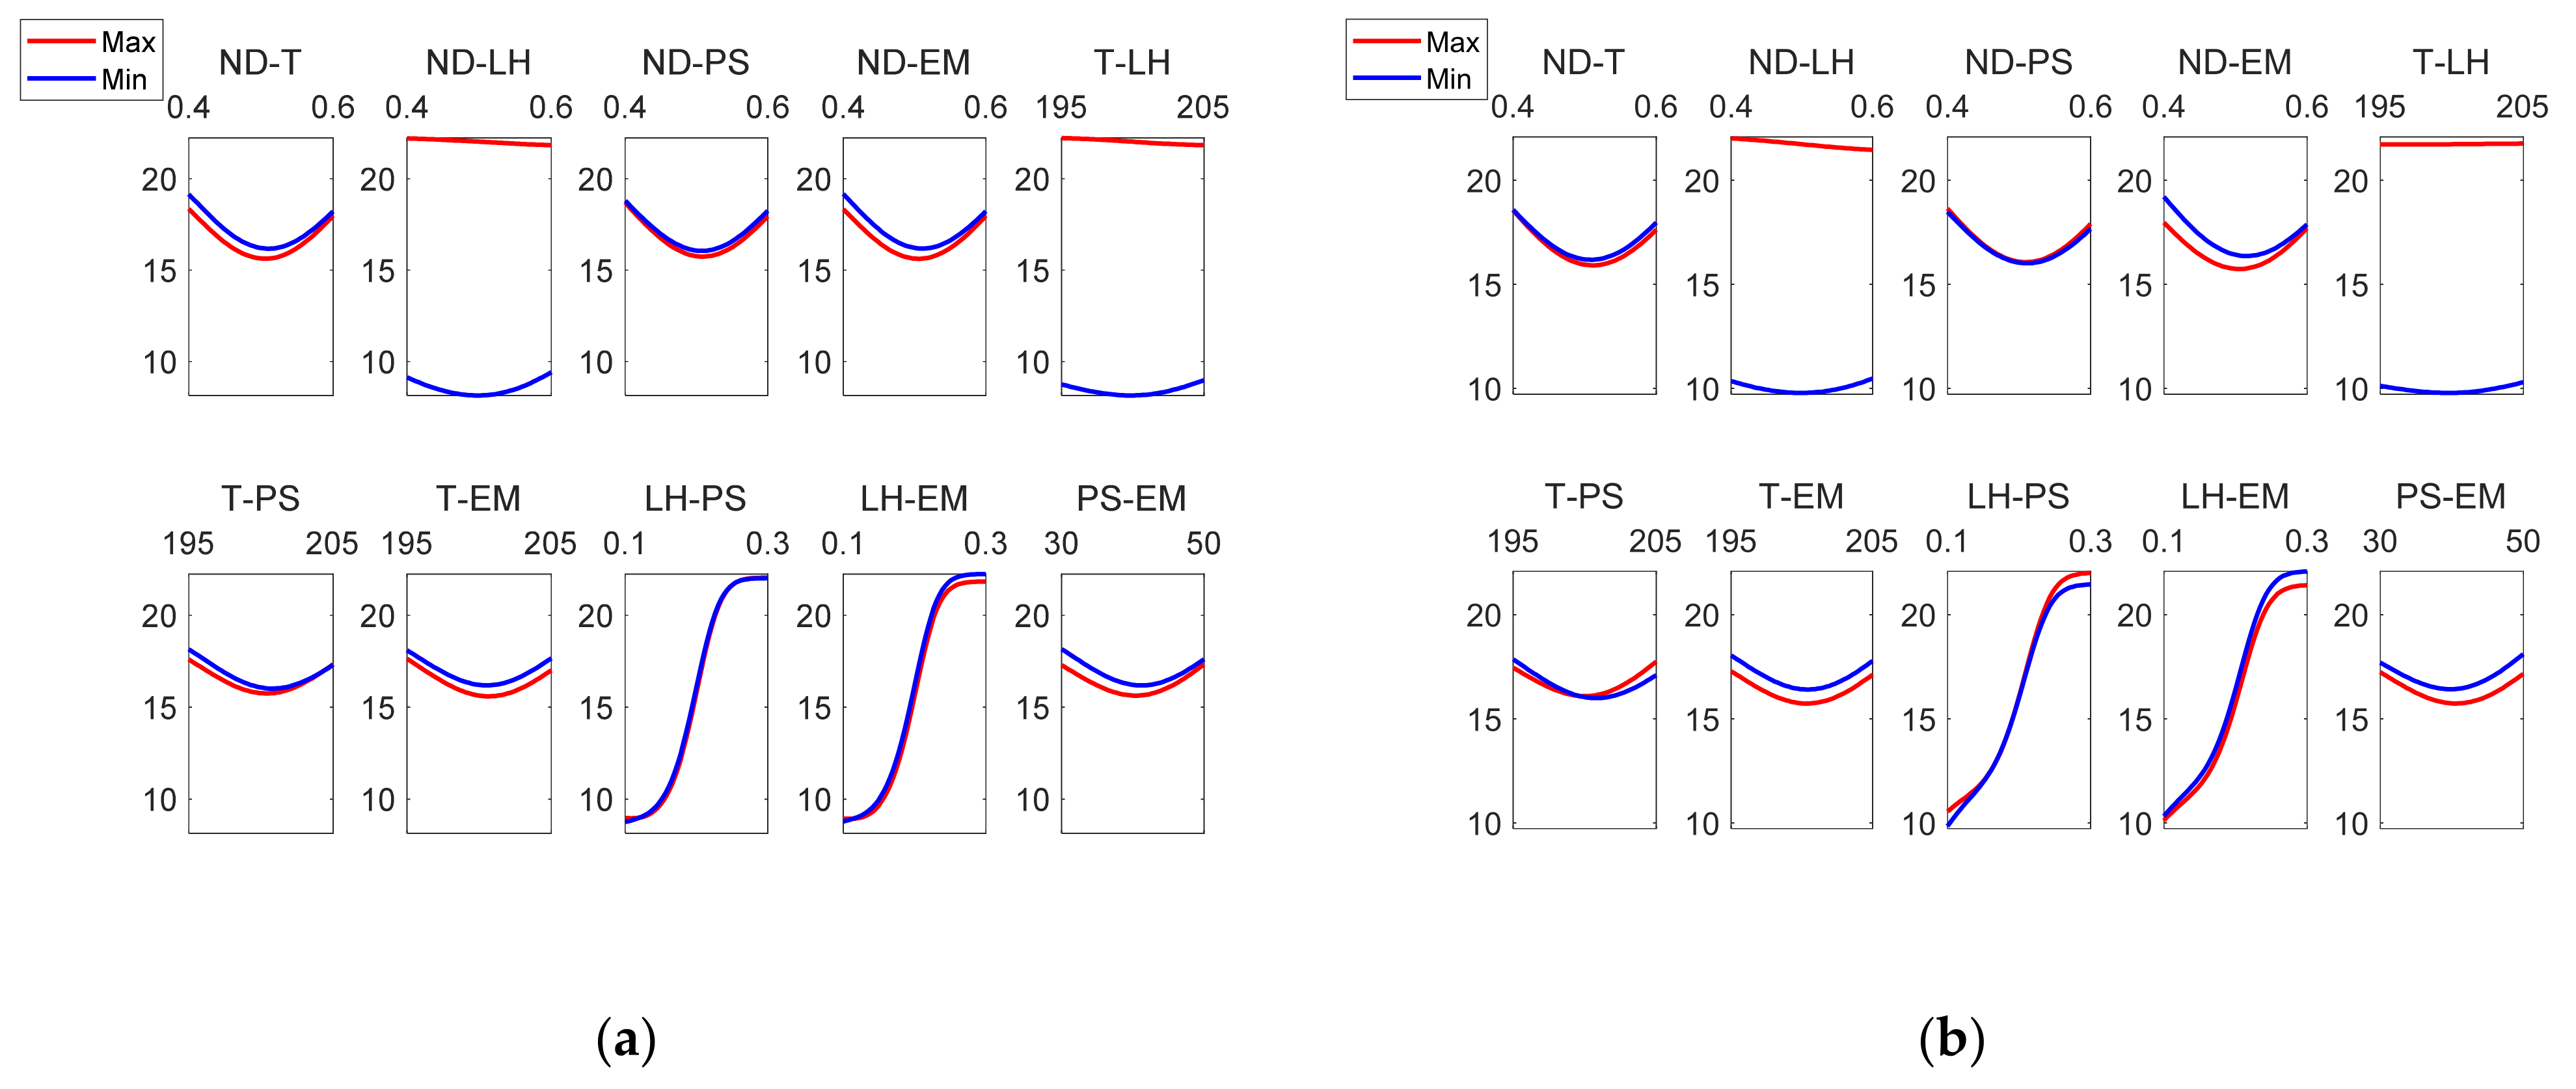
As can be observed in Figure 7, layer height is the most influential factor on roughness. Figure 8 corresponds to the main effects plots, while Figure 9 depicts the interaction effects plots for Raext.
Figure 8 and Figure 9 show that there is not a great difference between the roughness values obtained in the outer layer of the parts with respect to those obtained in the inner layer. The process parameter that had the greatest influence on the arithmetic average roughness (Ra) was the layer height, followed by the nozzle diameter. This behavior was also observed both in the roughness values obtained in the external and internal areas. In the interaction plot of ND vs LH (Figure 9a), the minimum roughness value corresponds to the situation where LH is at its → minimum value and T, EM, PS are at their central values. In this case, the model obtained by ANFIS gave a value of Raext = 8.14 µm. Similar values were reported experimentally by Alsoufi and Elsayed [12] for nozzle diameter 0.3 mm and layer height 0.1 mm.
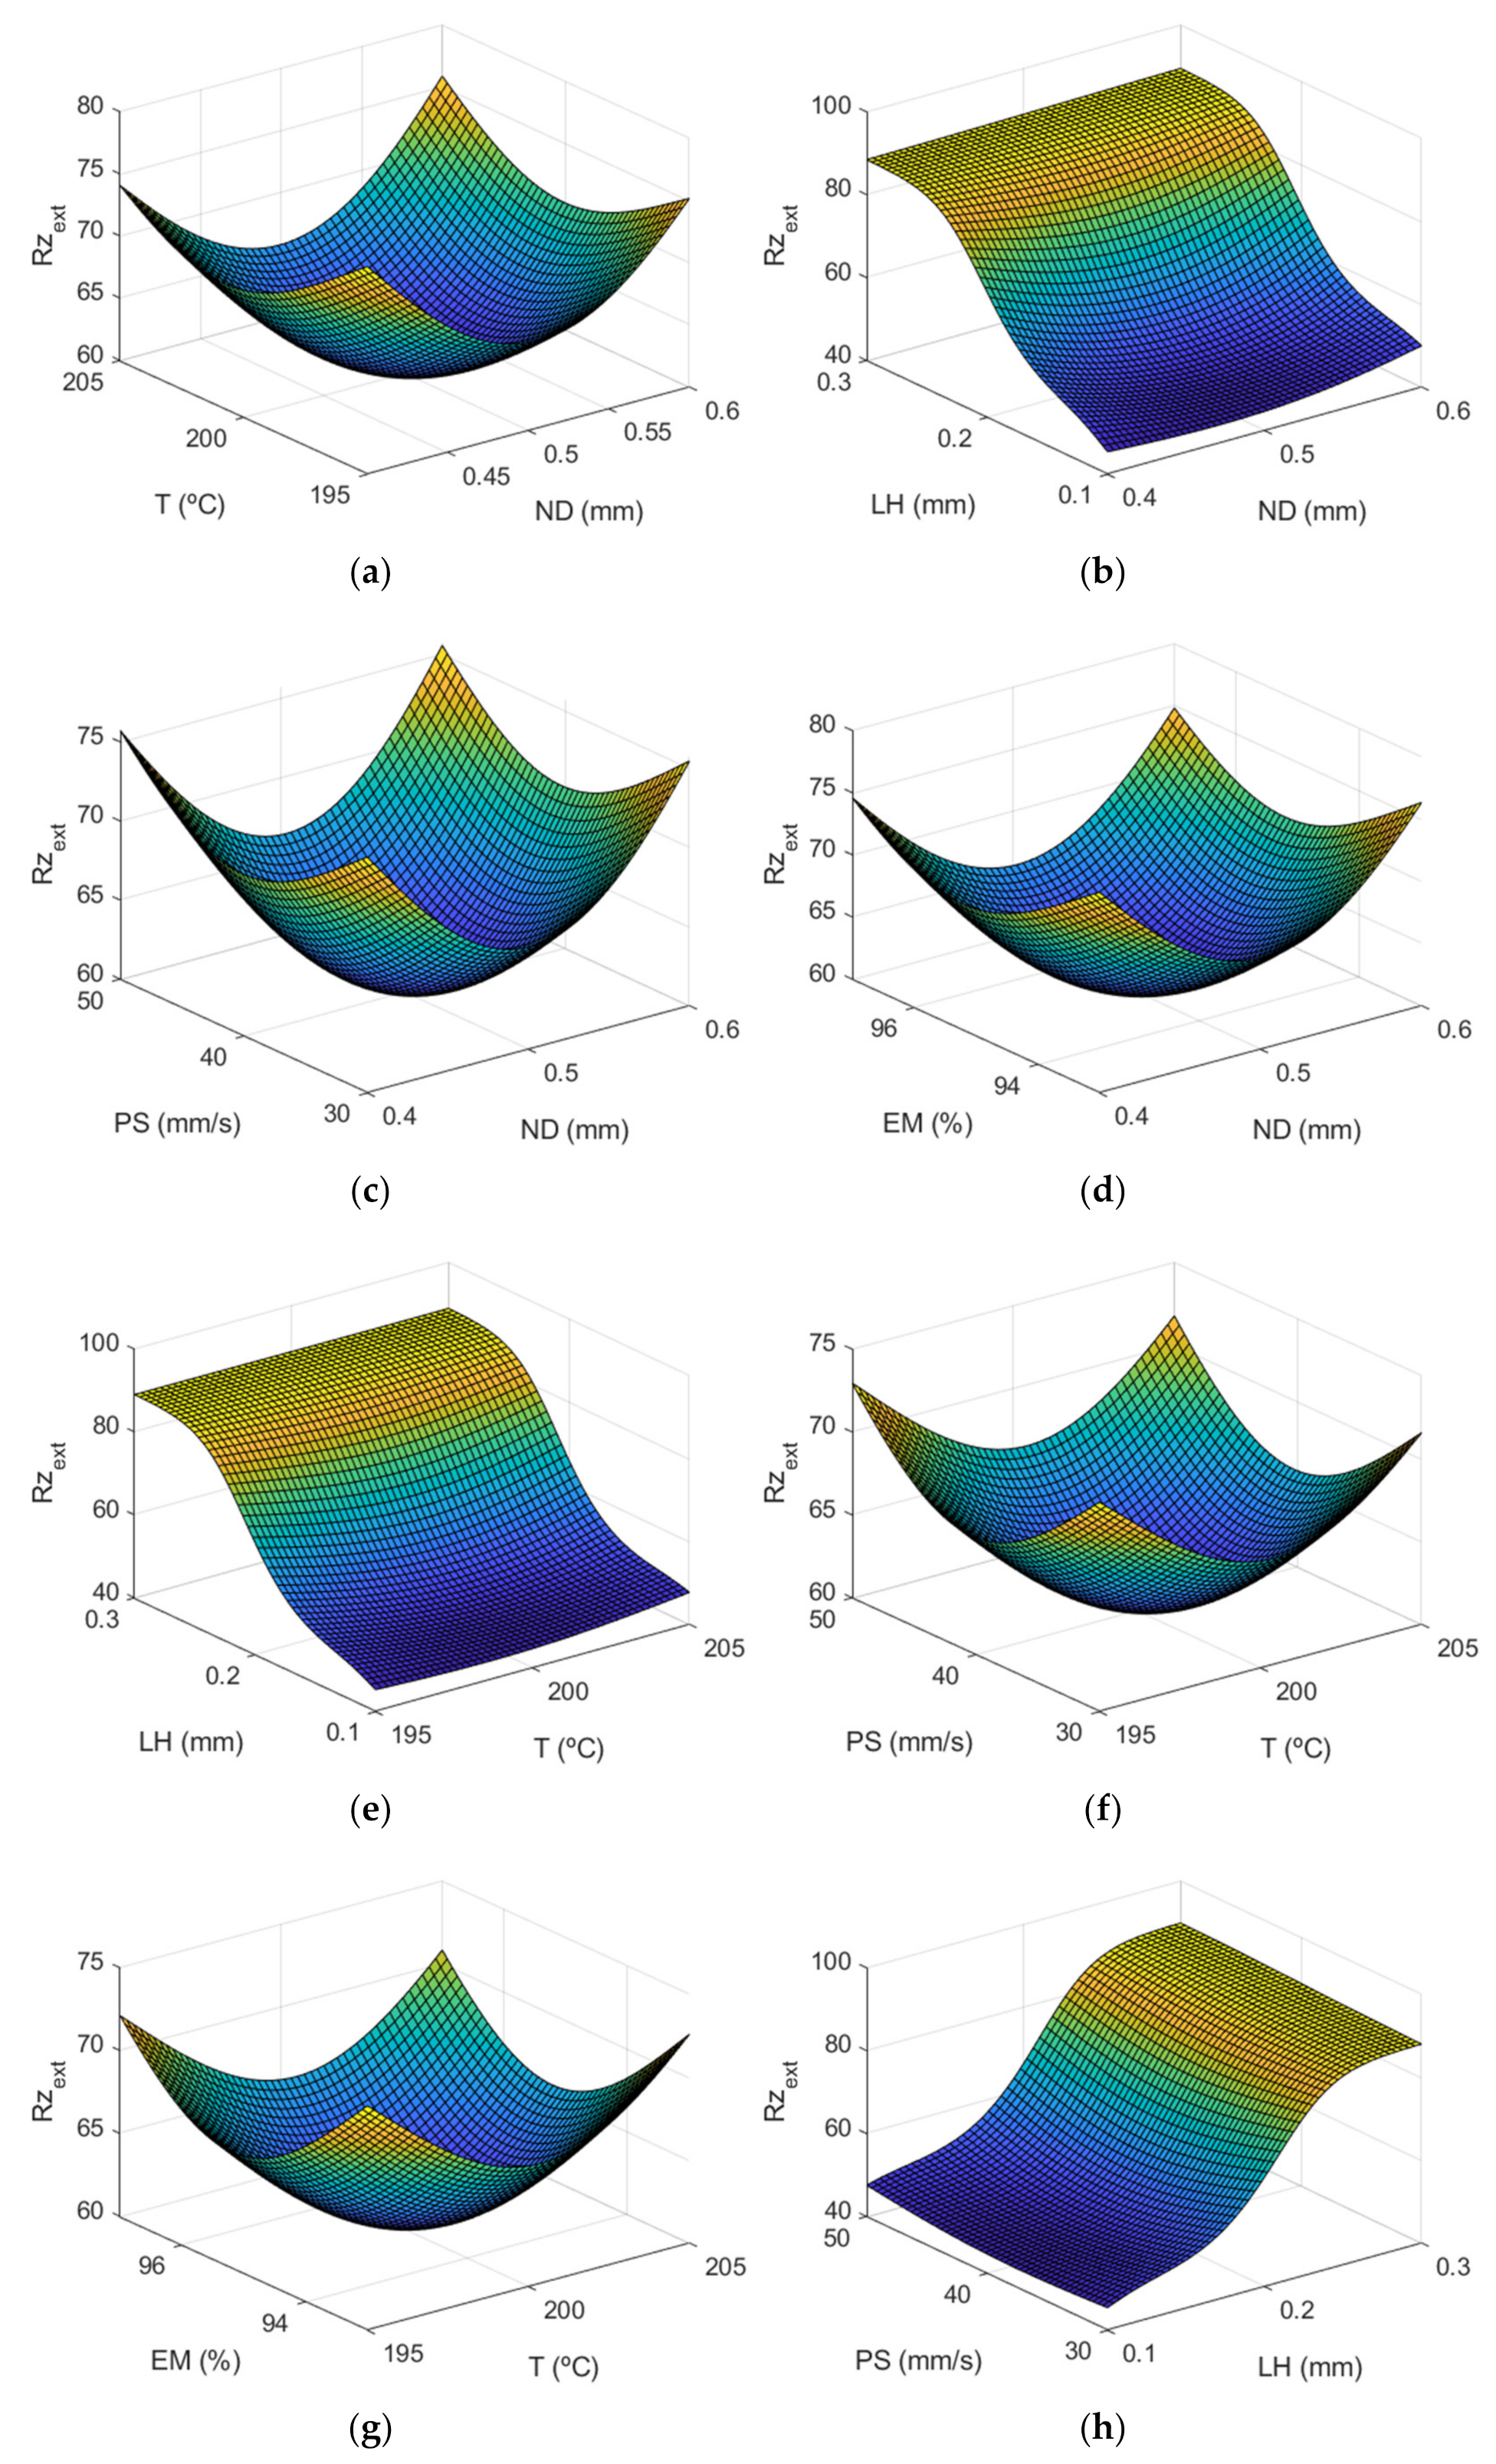
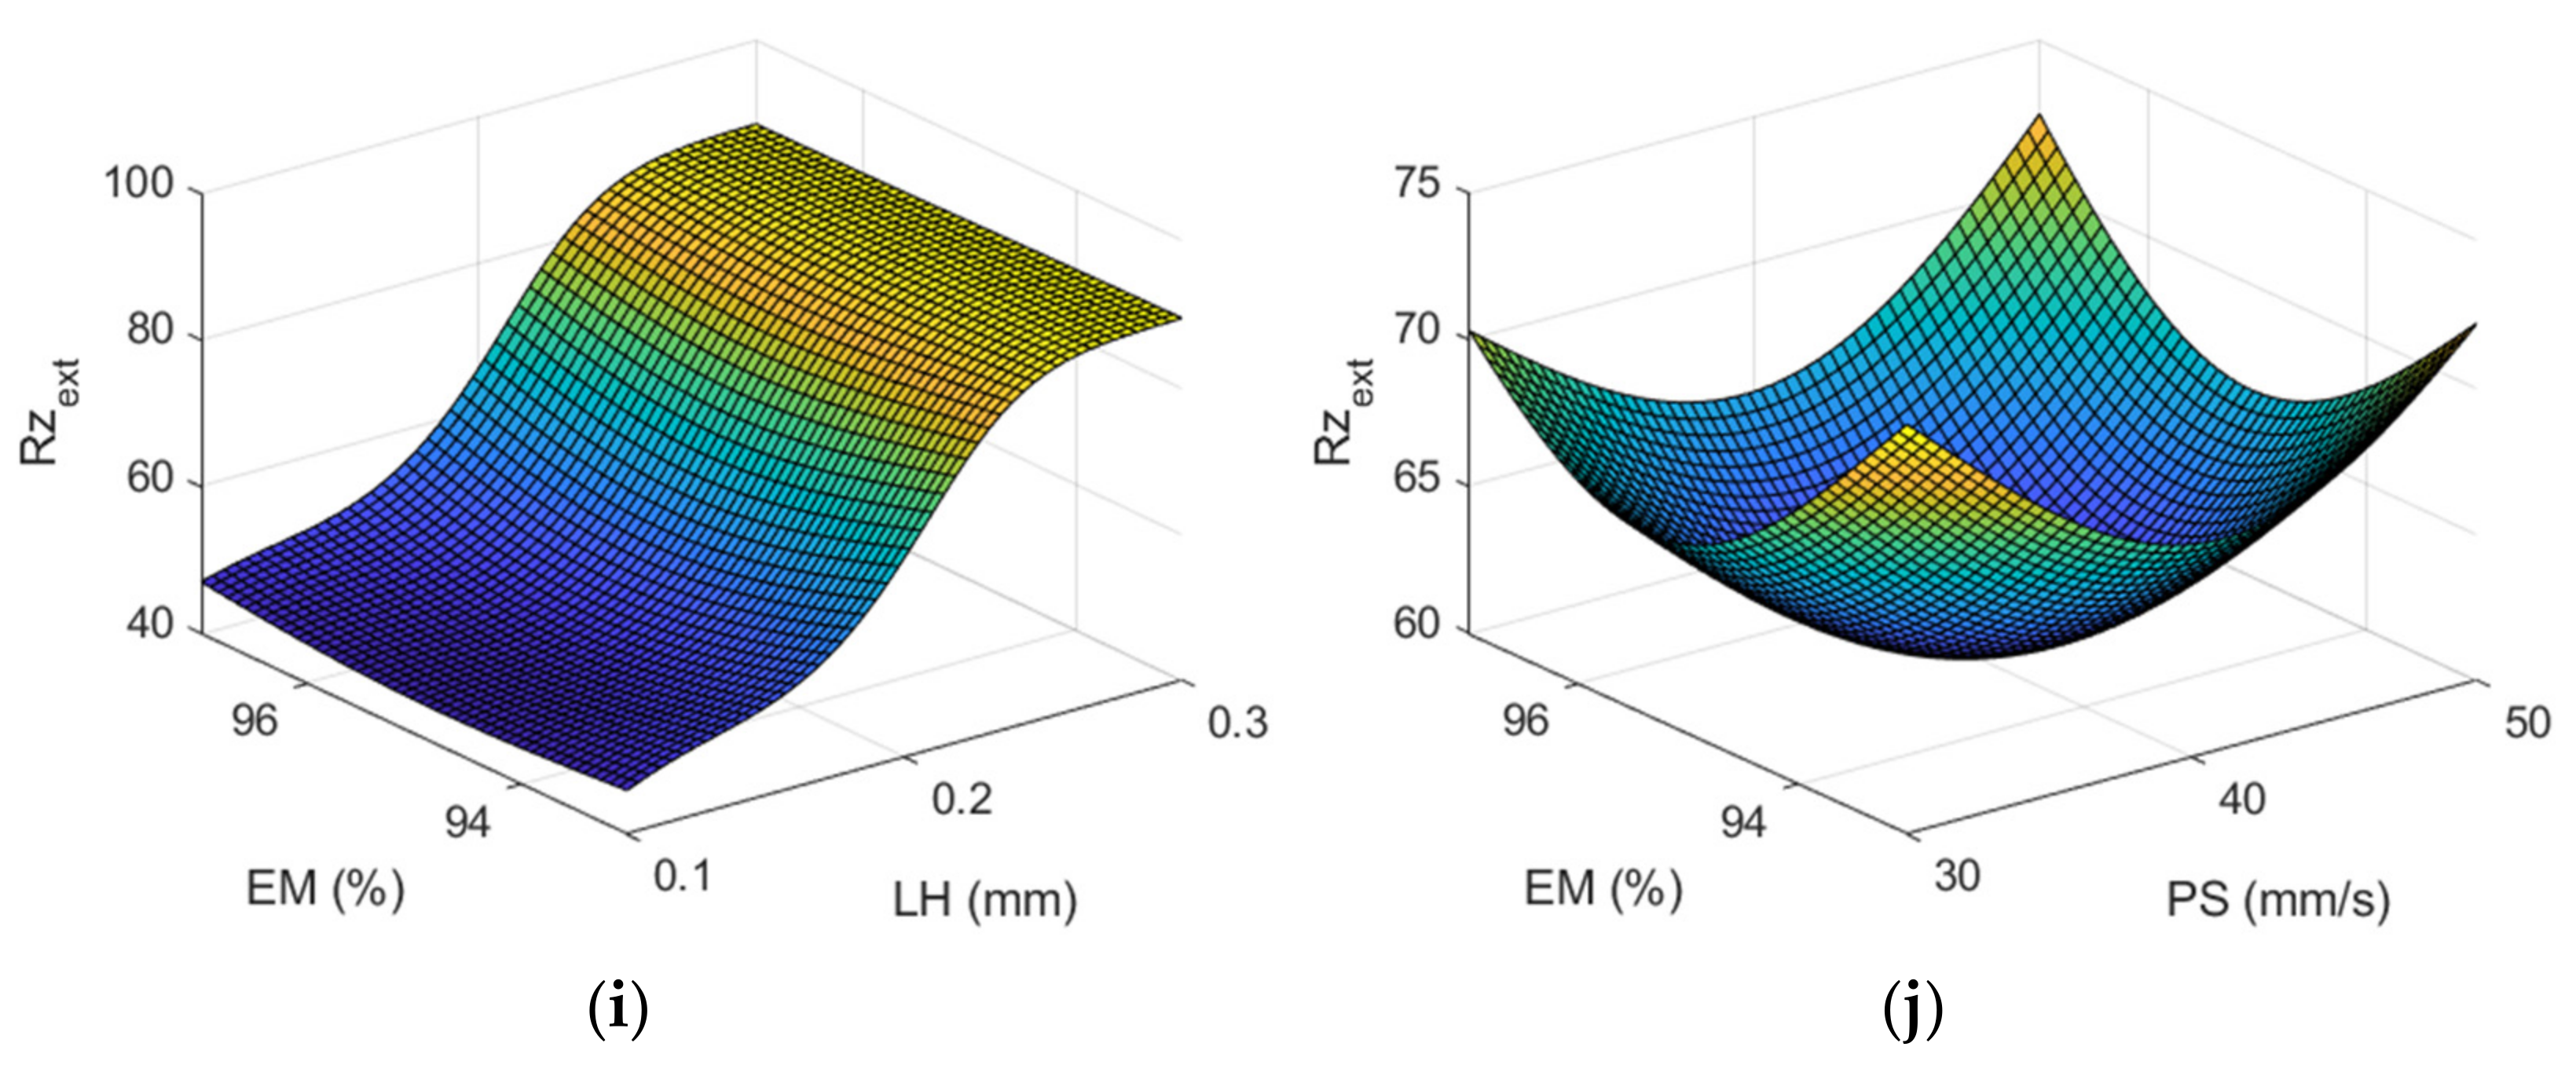
Figure 10 shows the response surface of parameter using the ANFIS. A similar behavior can be observed in this figure to that obtained in the case of Ra, the layer height being the most significant factor.
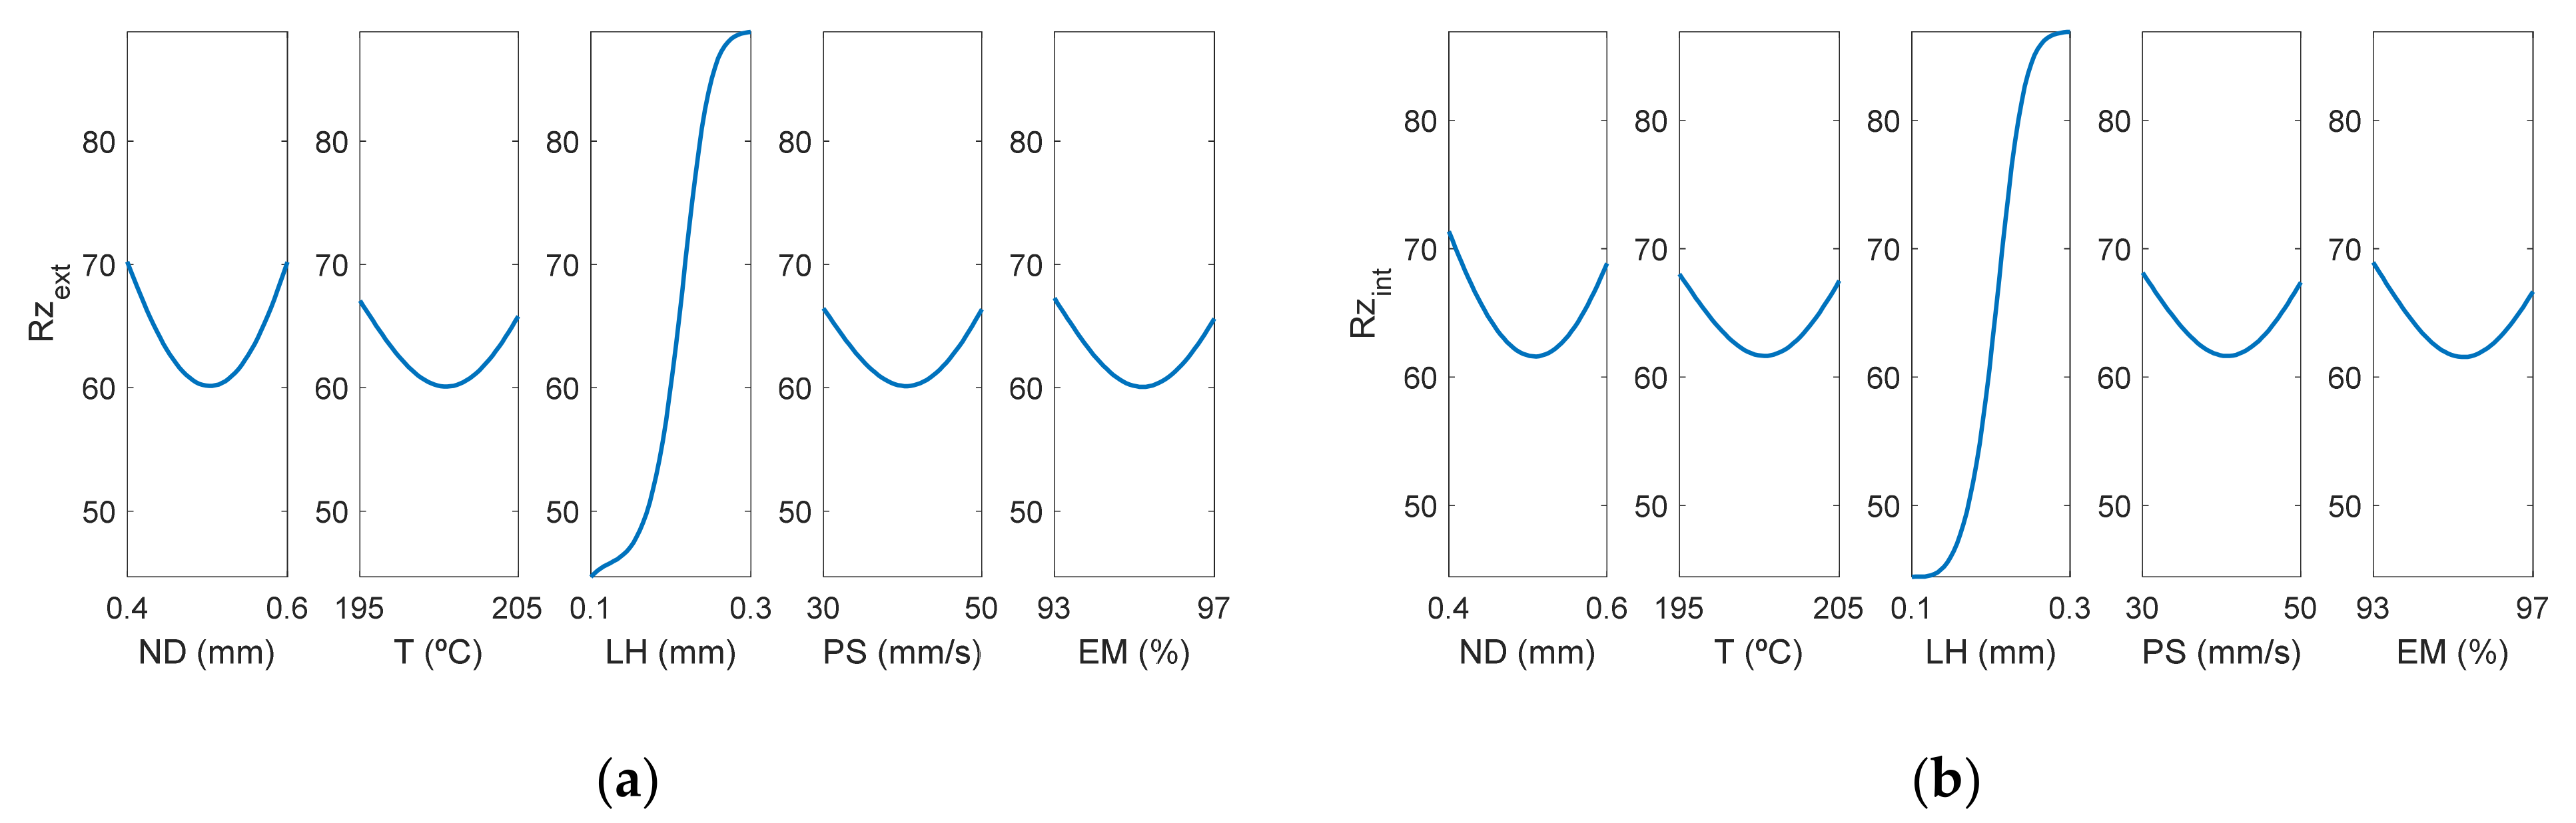
Figure 11 shows the main effect diagrams for Rz, the average maximum peak to valley distance of five consecutive cut-off lengths of the profile within a sampling length (l).
As can be observed in Figure 11, as could have been expected in advance, Rz on the internal and on the external surface presented a similar behavior.
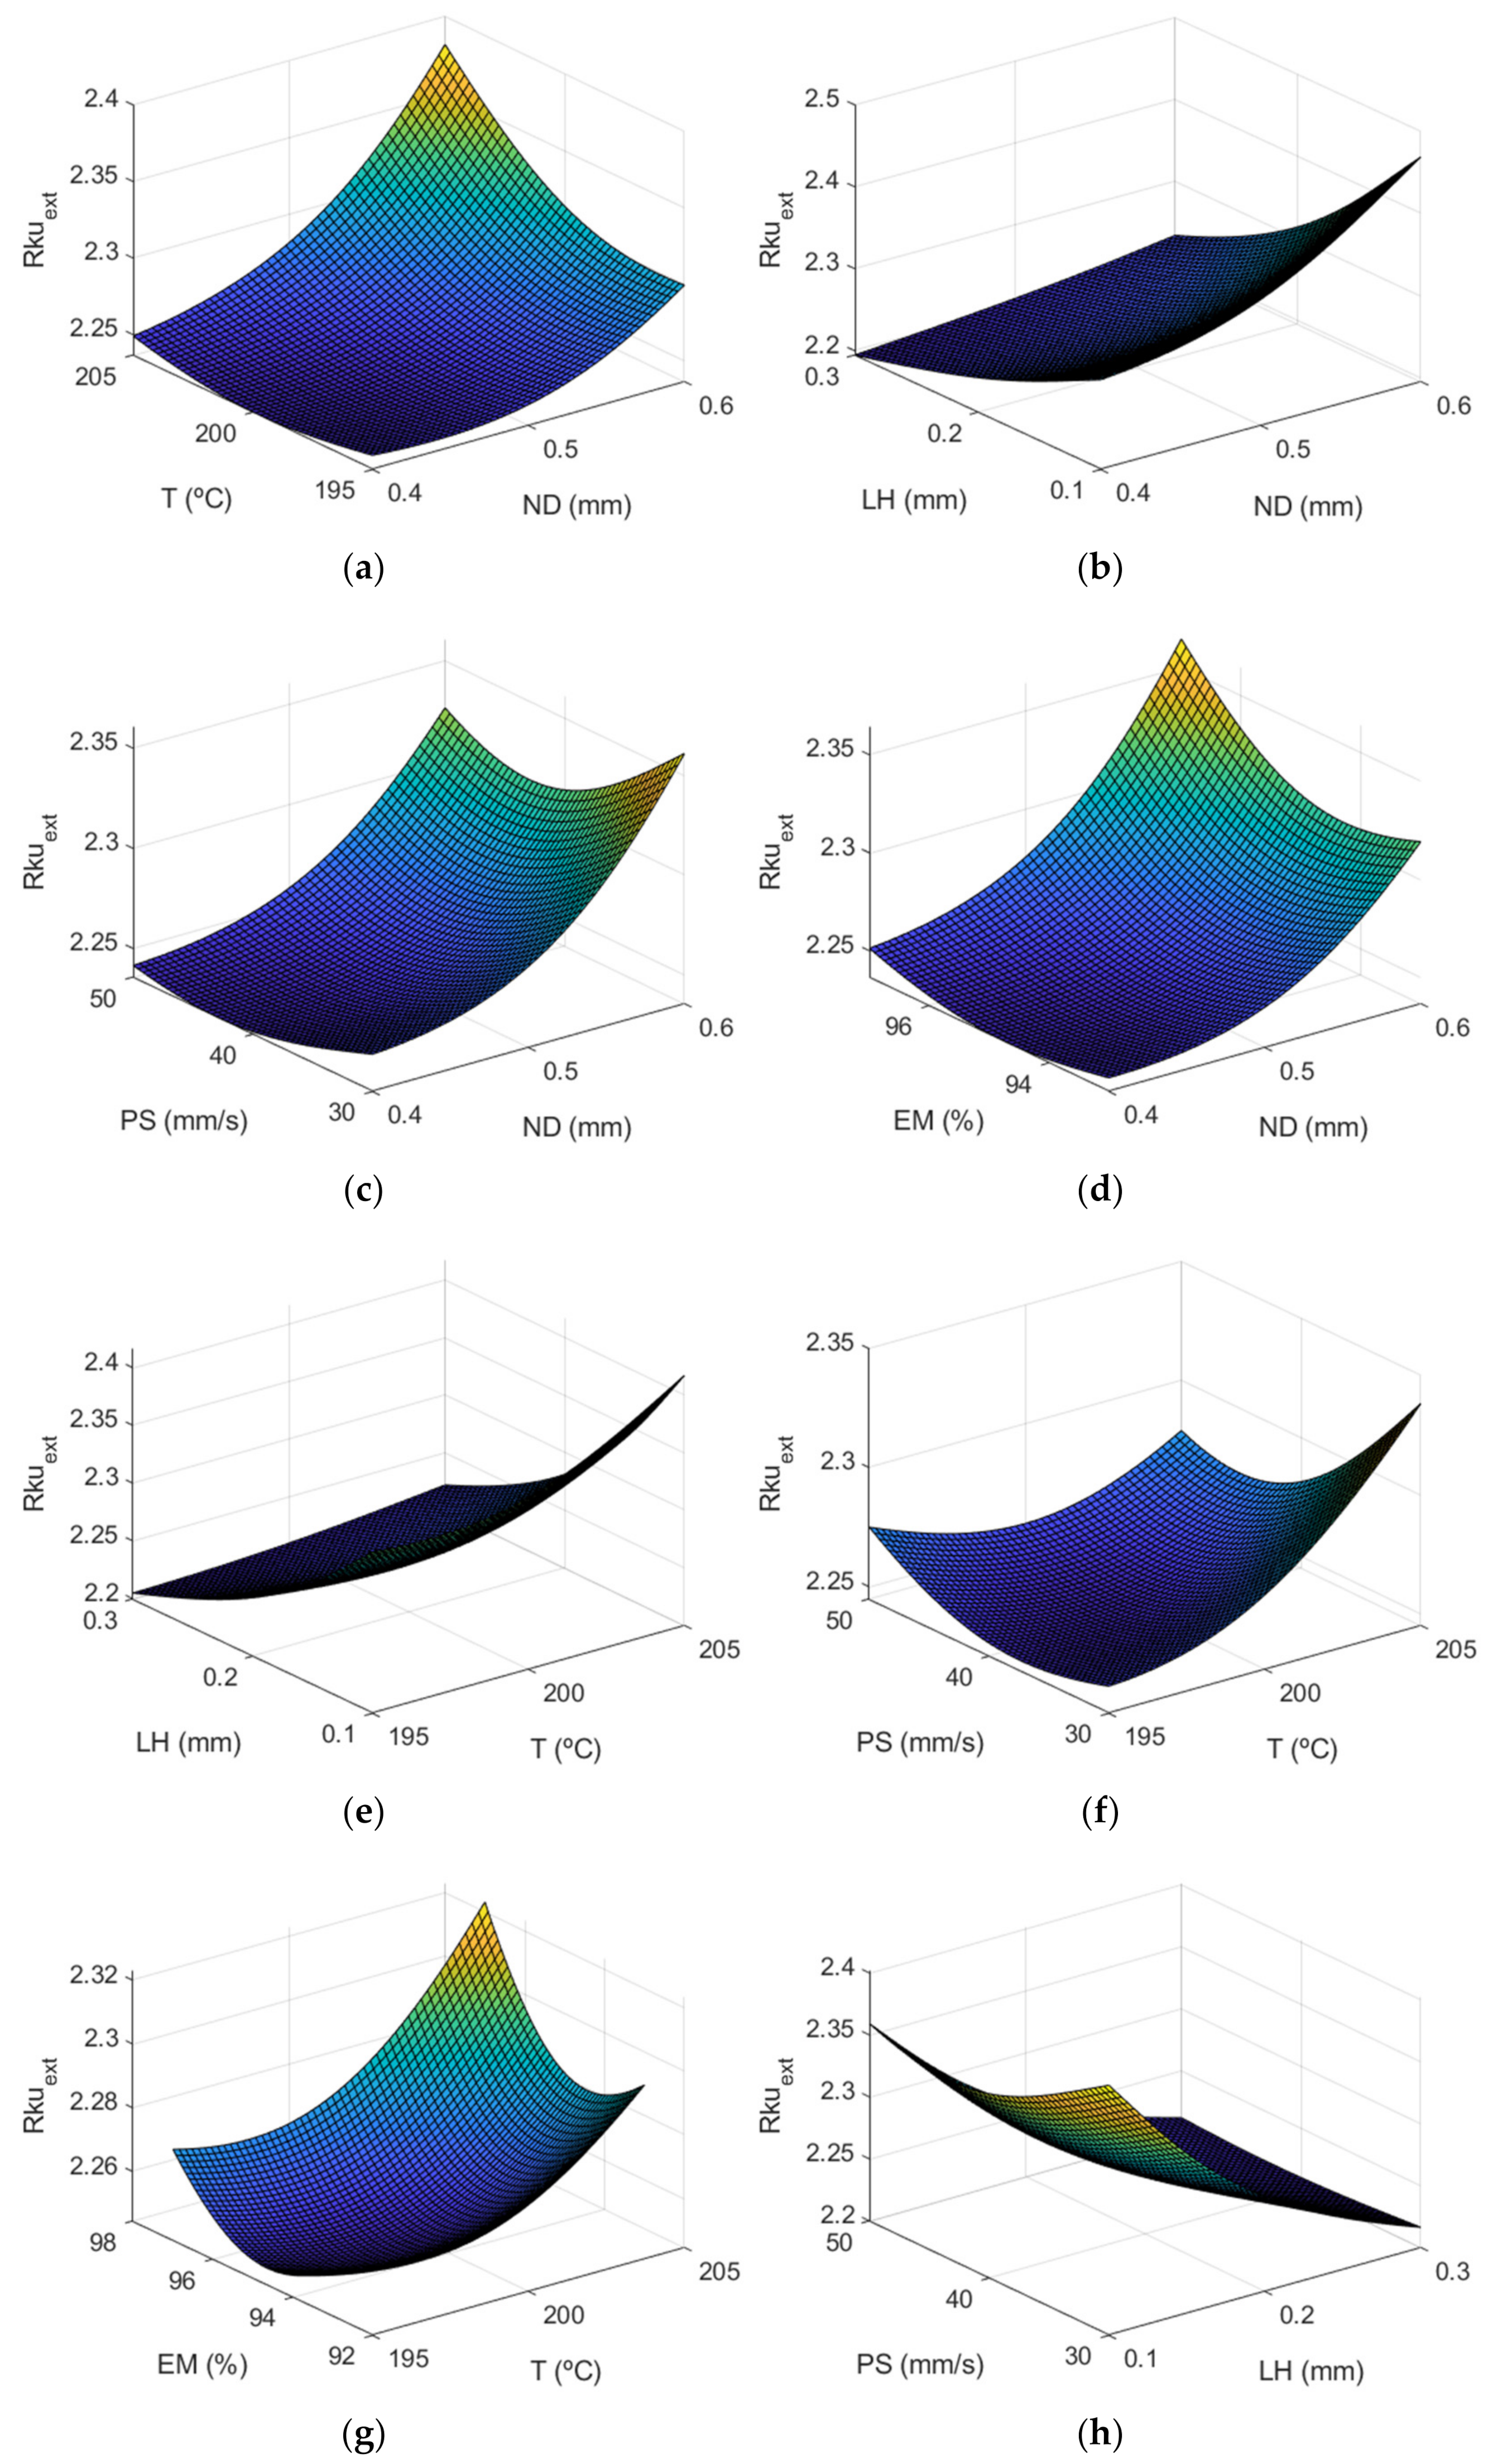
Figure 12 shows the surface response of using the ANFIS for the case of the outer layer of the manufactured specimens. In this case, it can be observed that layer height influences Rku too.
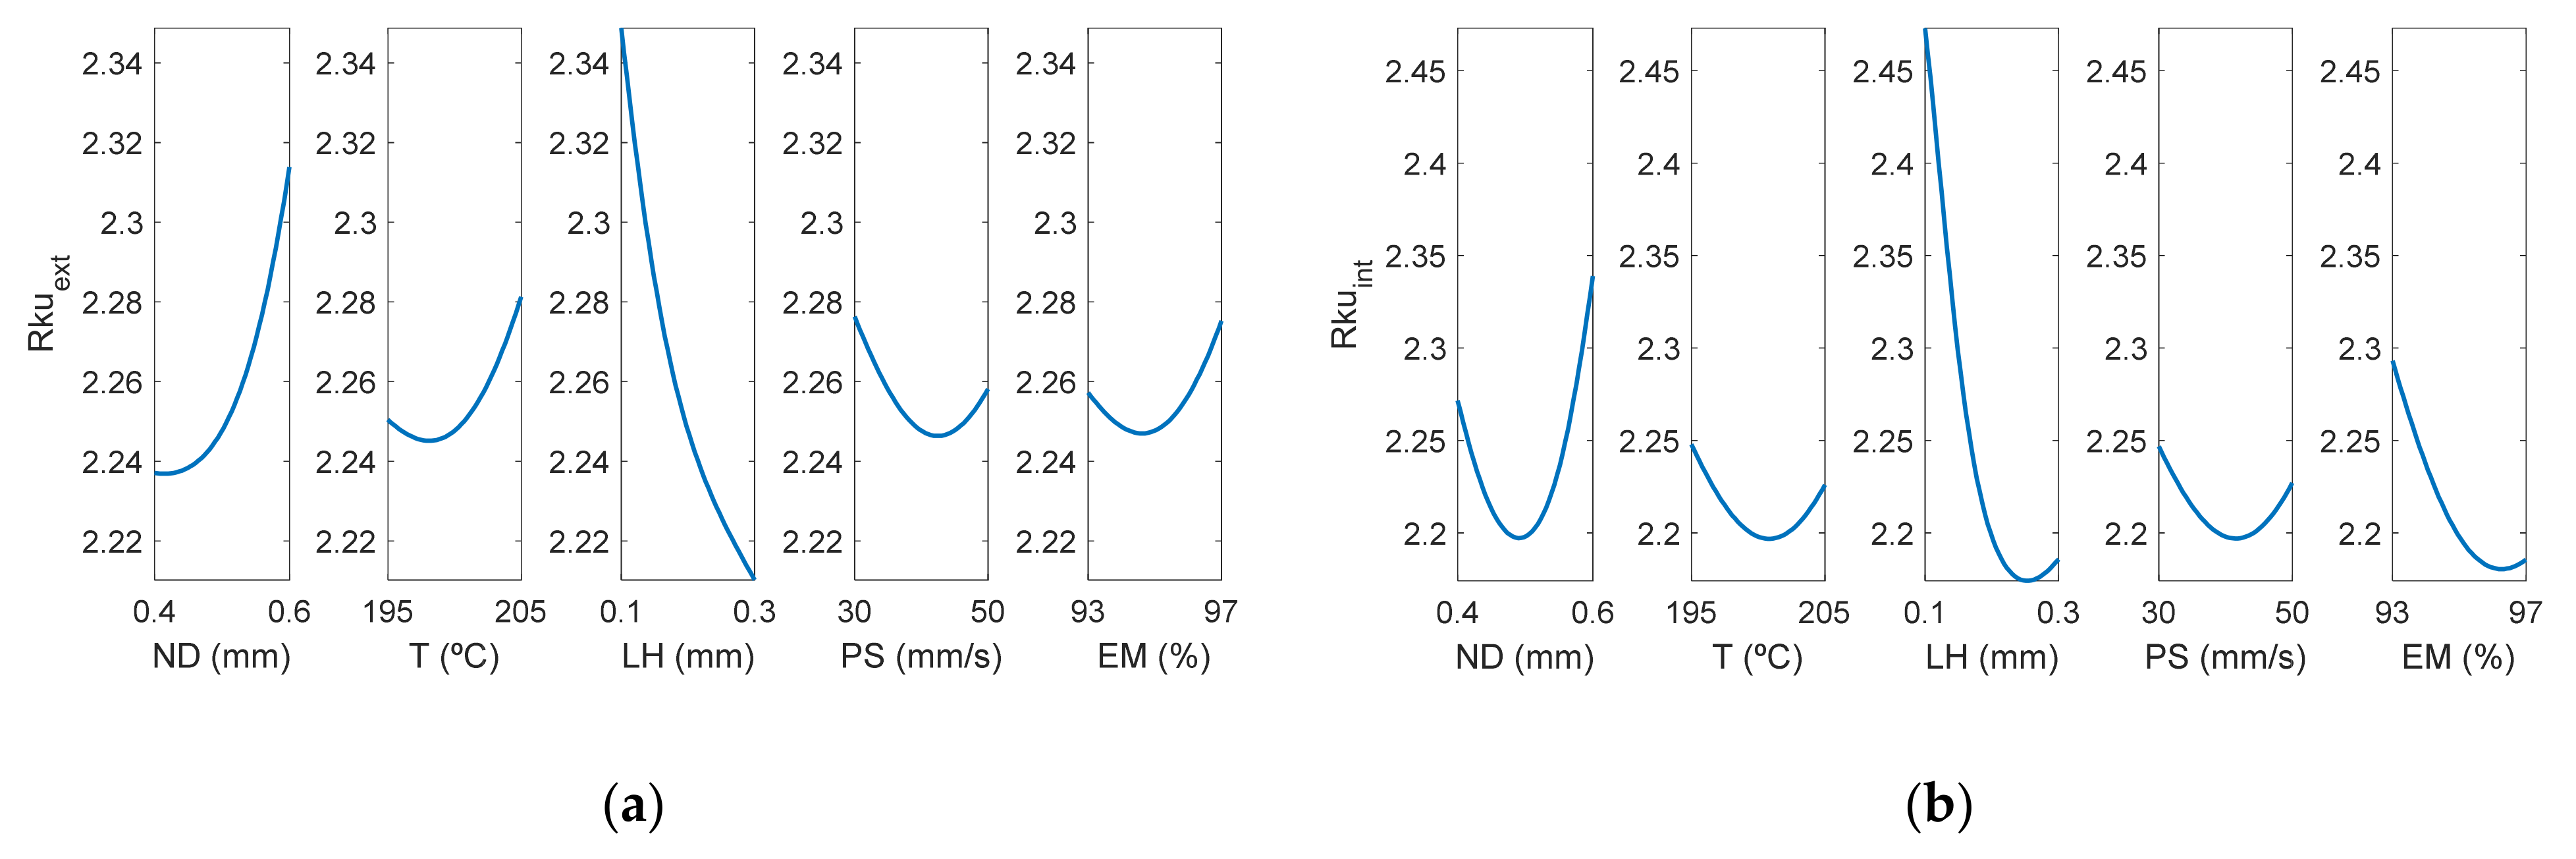
Figure 13 depicts that the most influential factor on Rku is layer height, followed by nozzle diameter. As can be observed in Table 3, the Rku parameter was lower equal or lower than 2.8 in all cases, showing that the distribution of the roughness profile was slightly rounded, to a greater extent on the external face than on the internal one. Likewise, it is shown that the parameter with the greatest influence on Rku was LH. In a previous work, Rku values around 2 were observed for low inclination angles, which decreased up to 1.7 for high inclination angles [13].
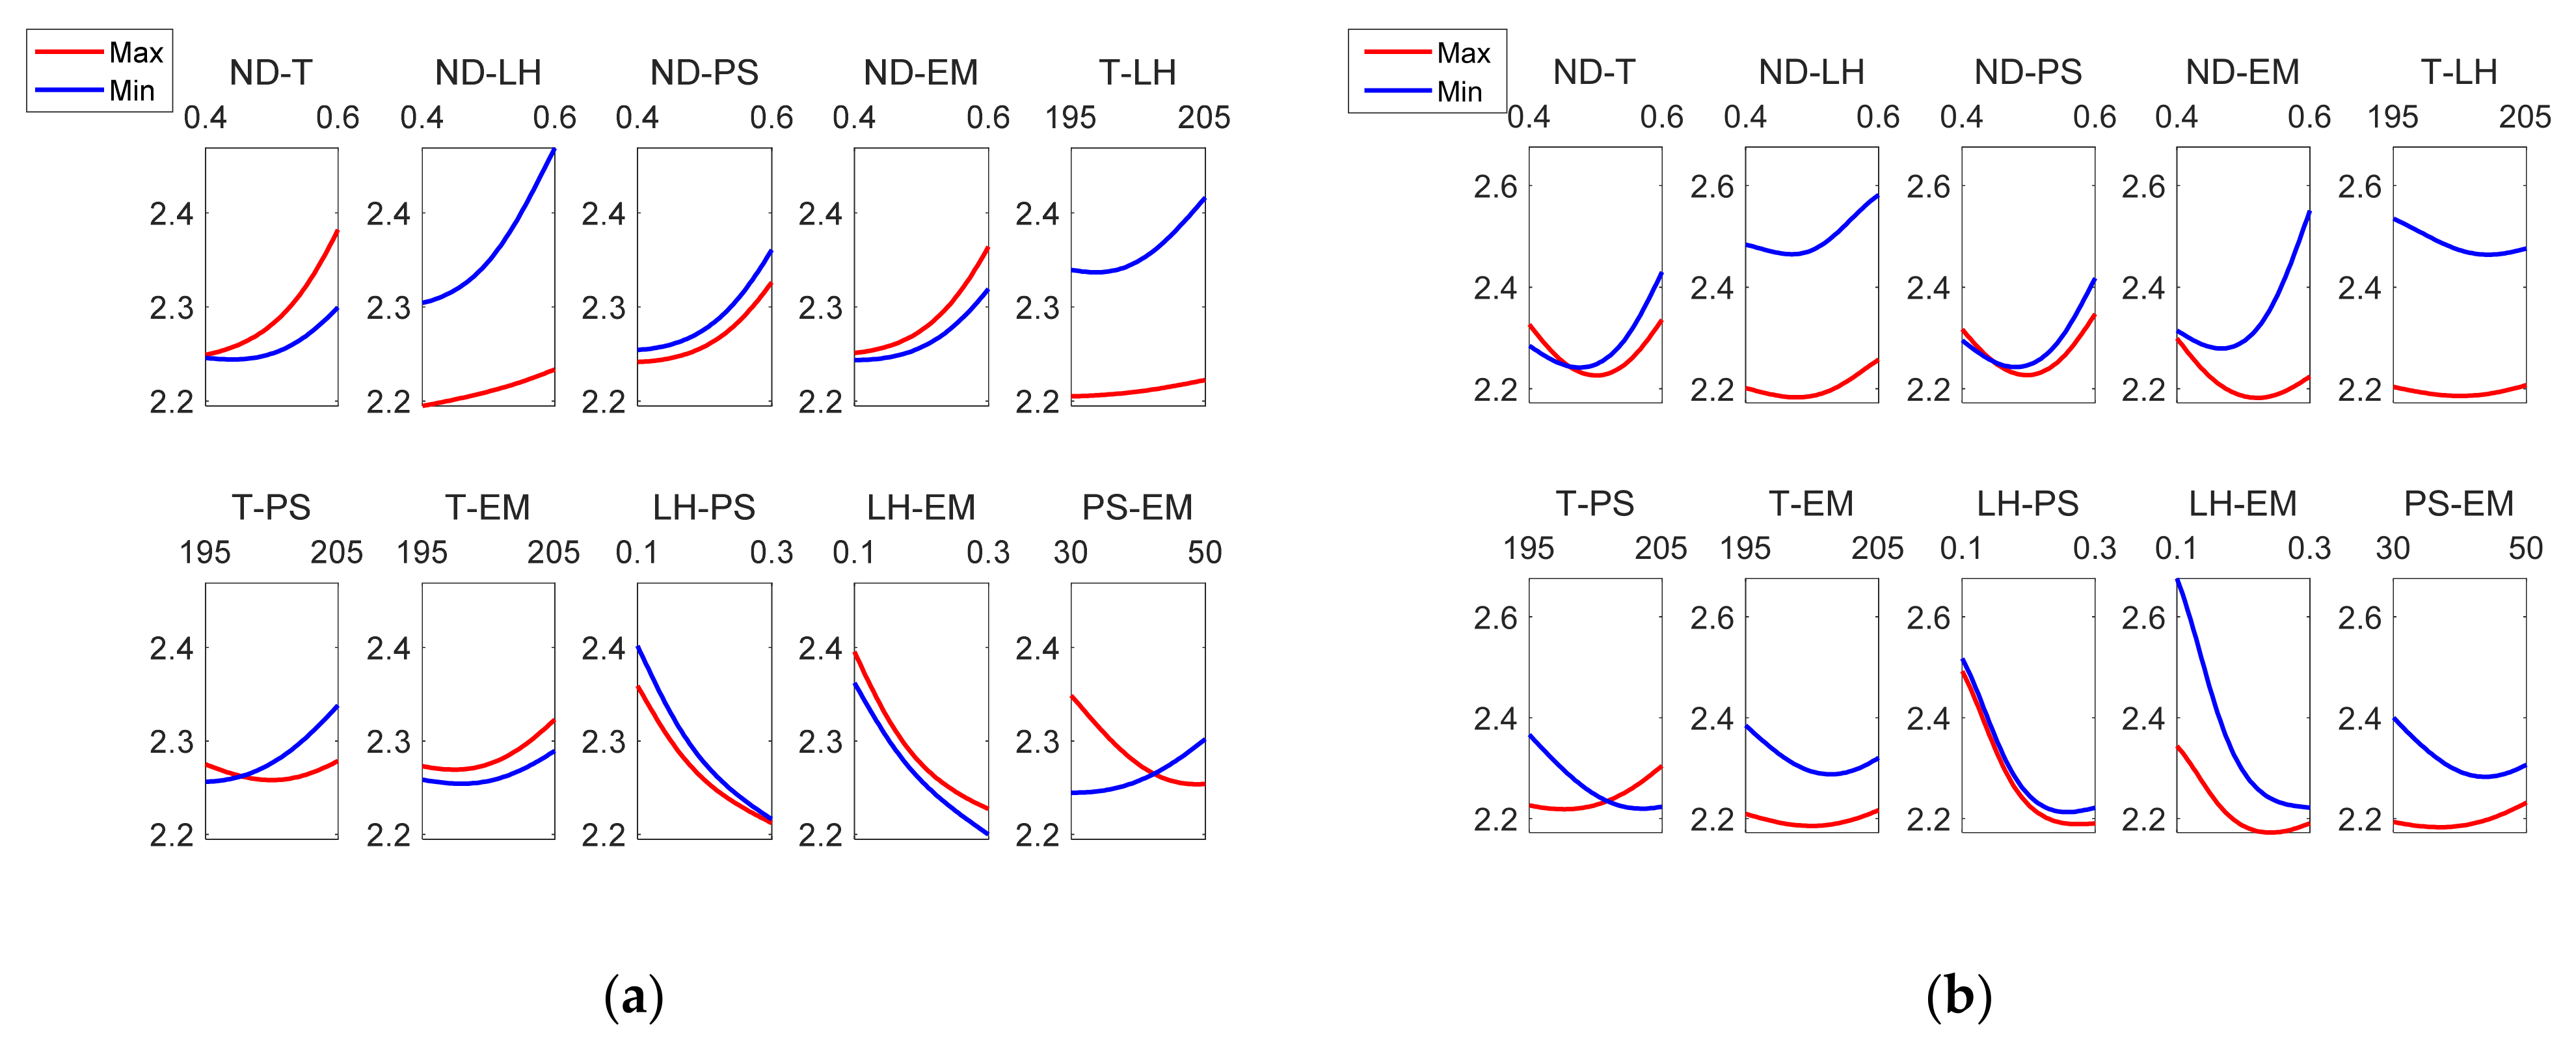
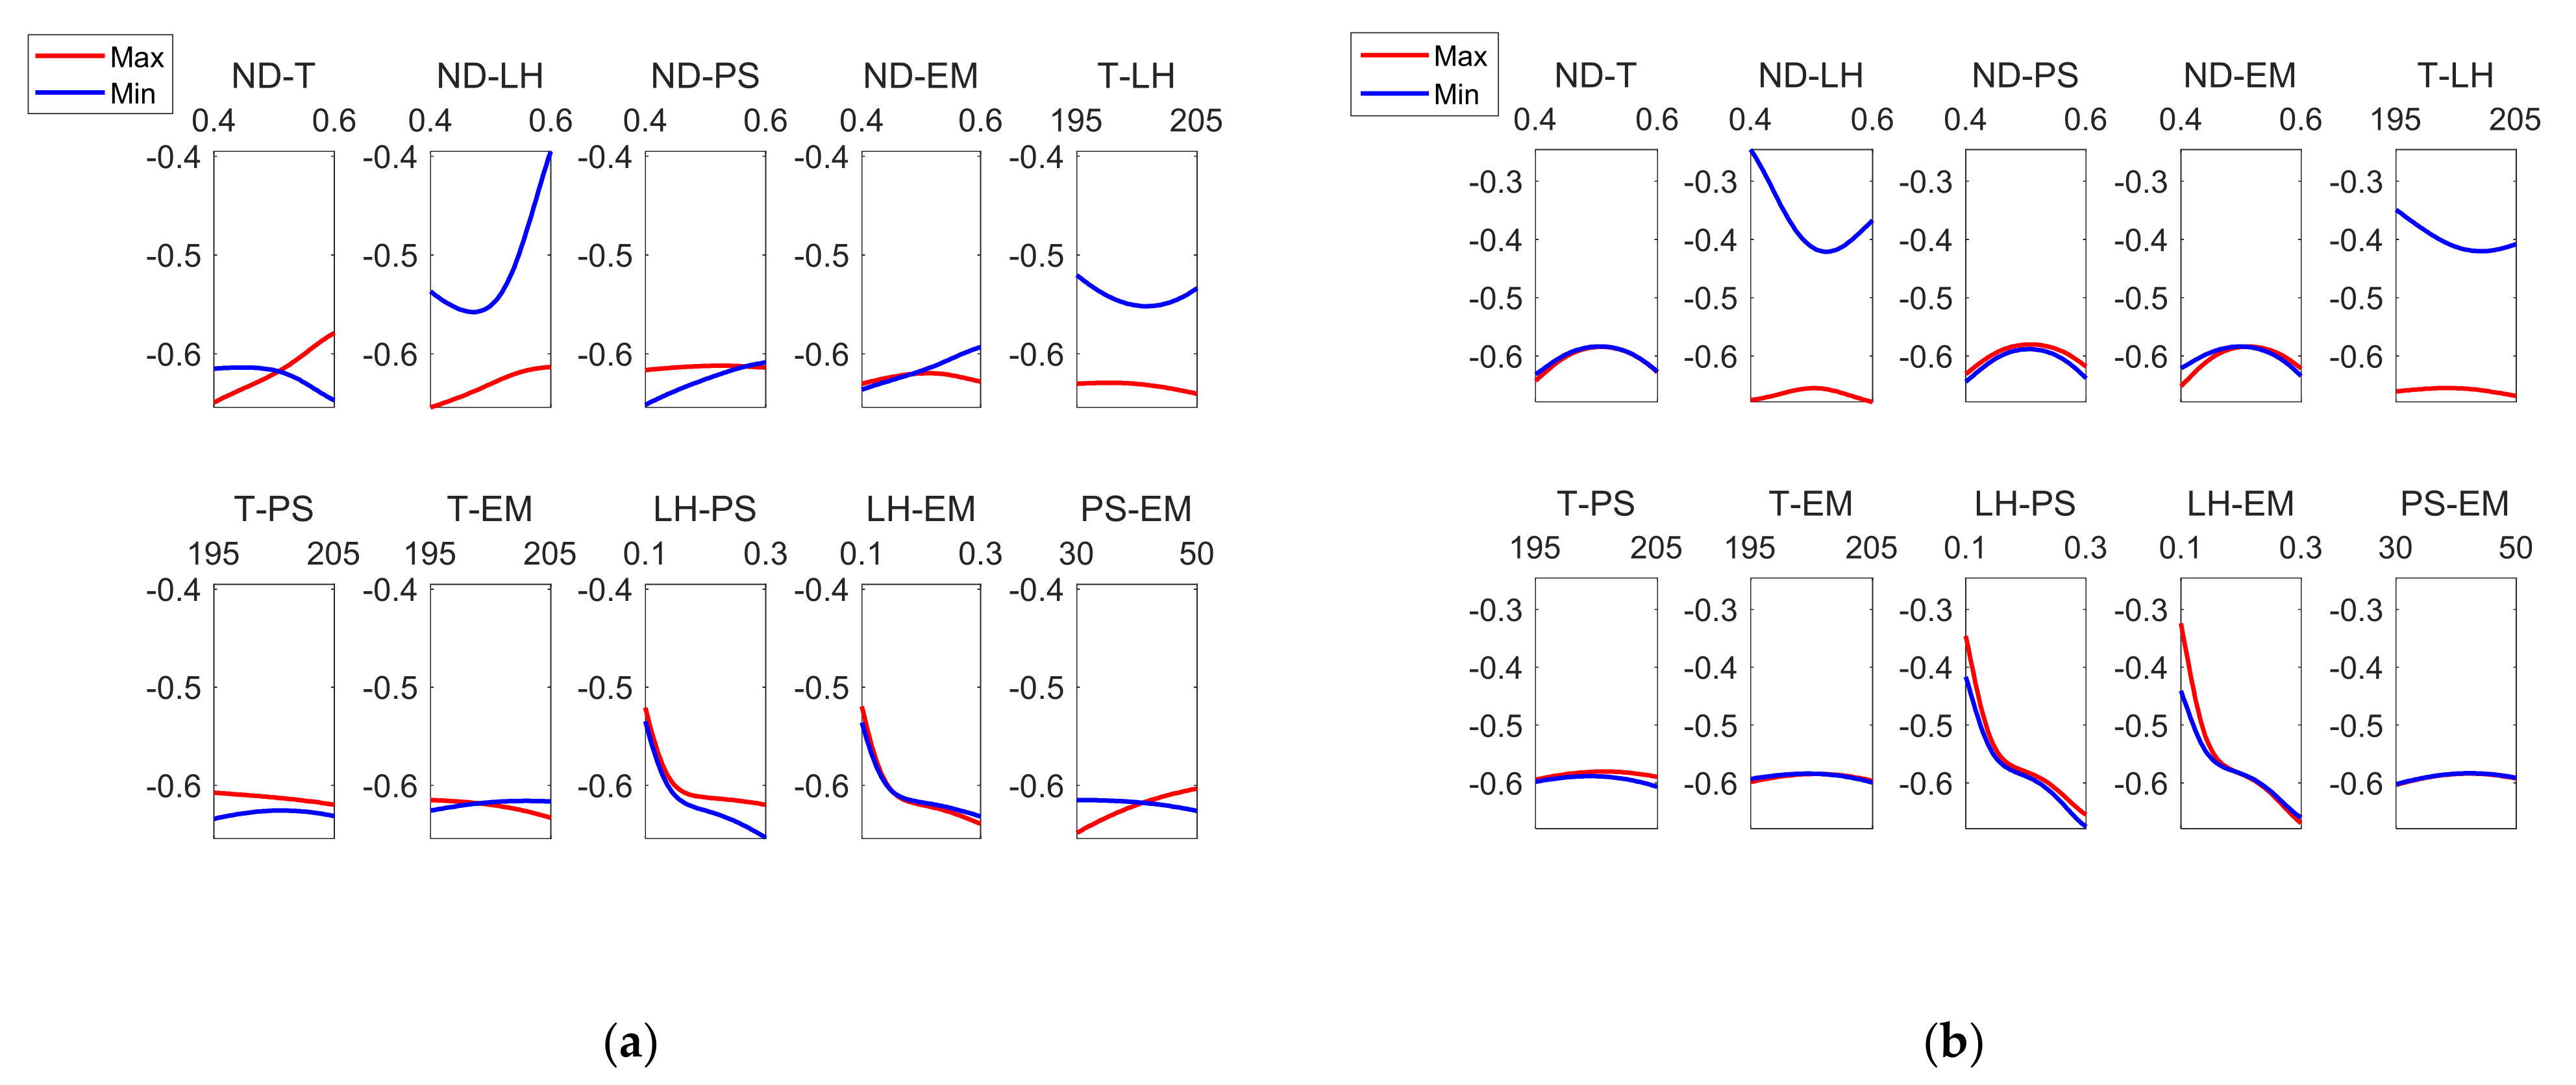
Regarding the interaction between factors, Figure 13 shows that there were differences between the external and the internal surface of the parts. Specifically, for Rkuext, the greatest interaction was found between PS-MS and ND-LH. On the other hand, for Rkuint, the greatest interactions occurred between ND-EM, T-PS, LH-EM. Similar Sku values below 3 were obtained in an analogous extrusion process, direct ink writing for ceramics [37].
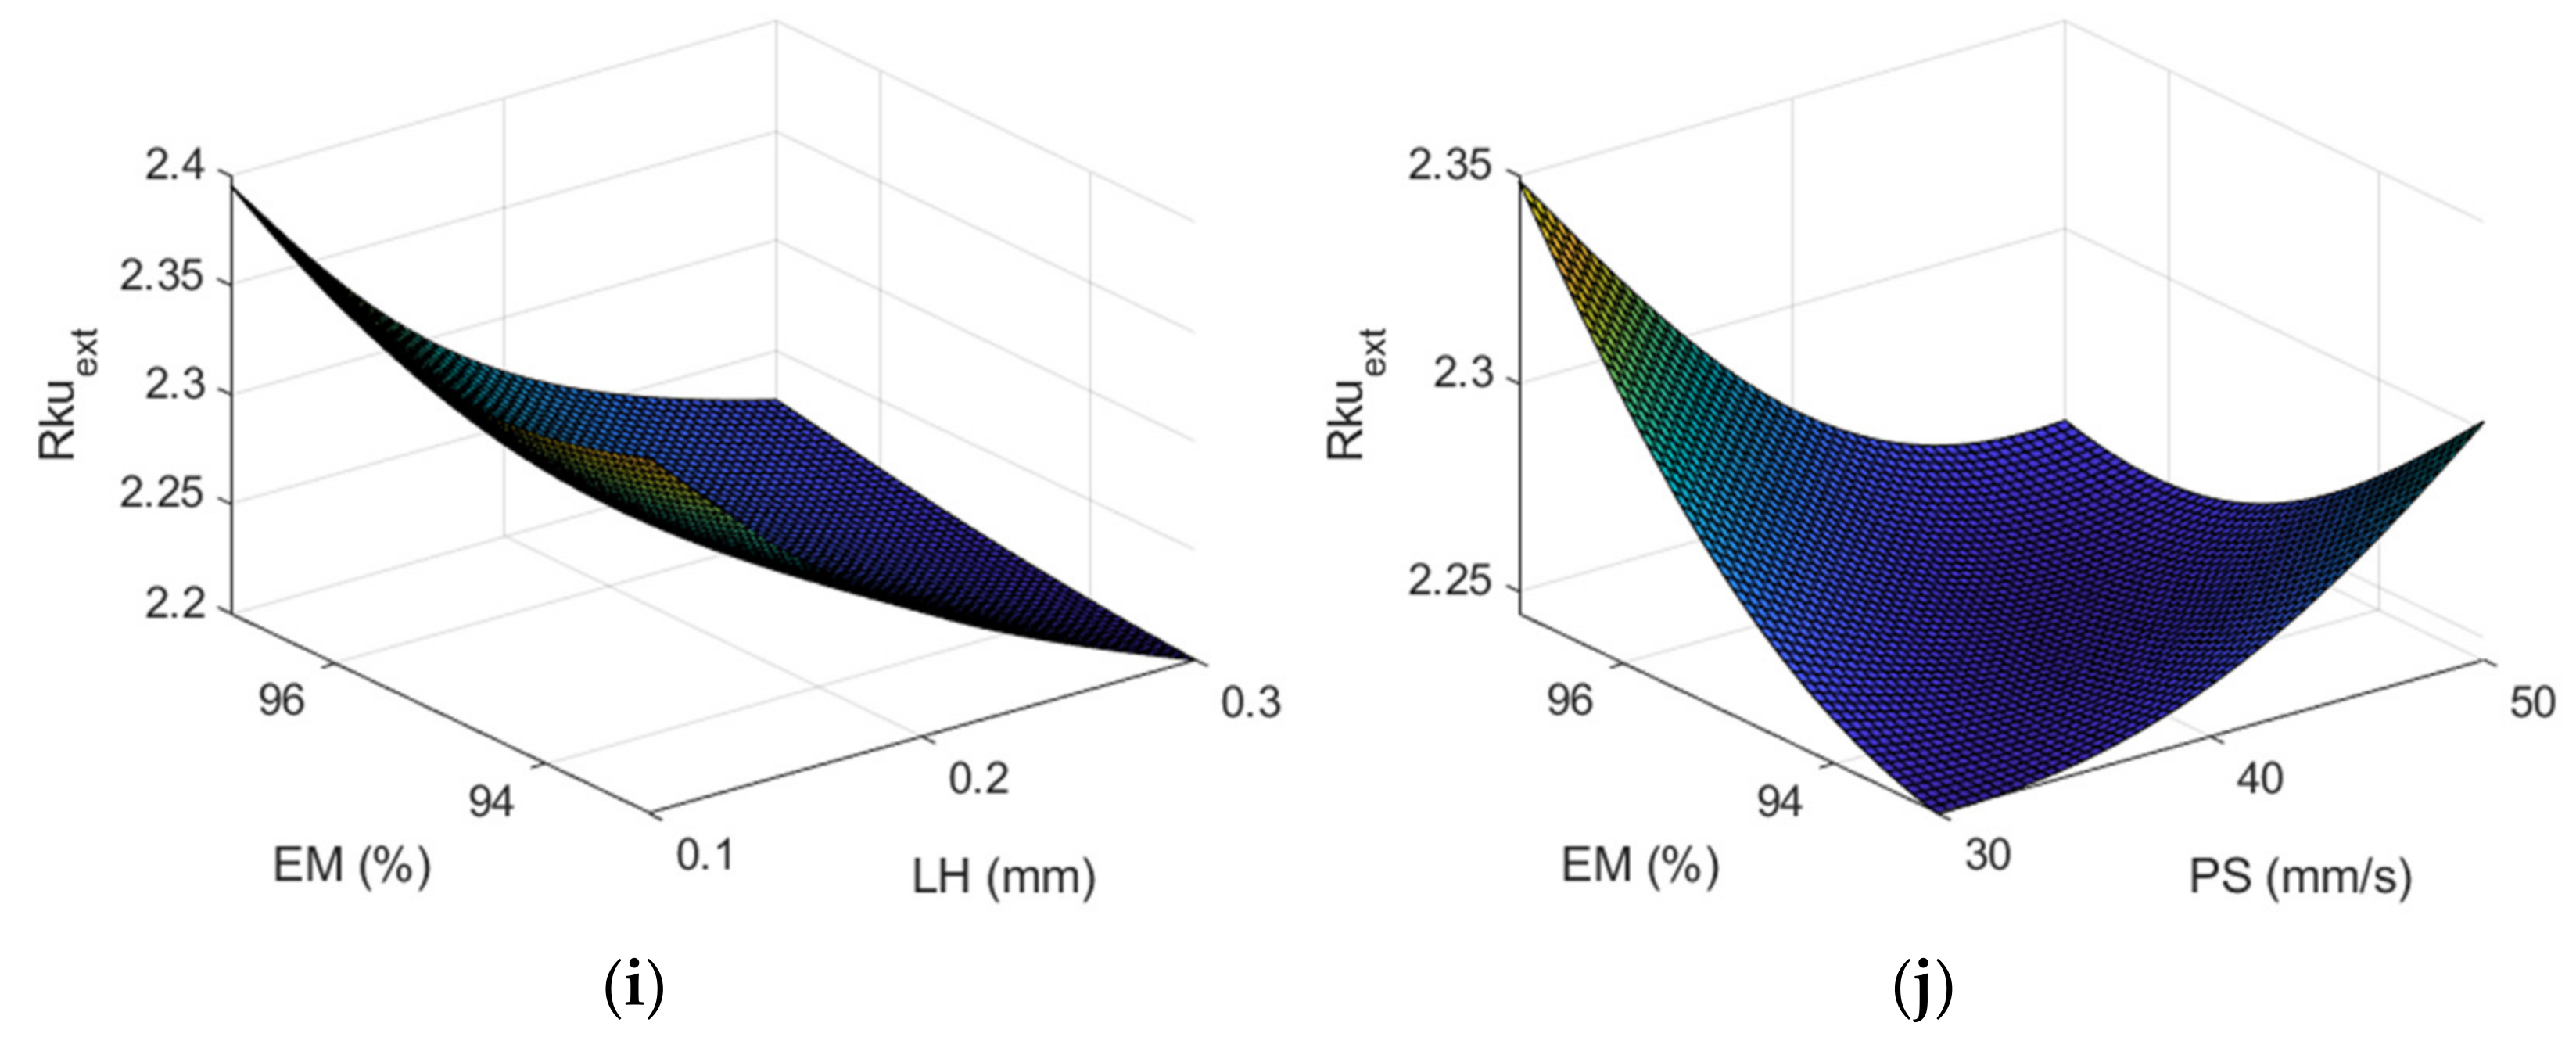
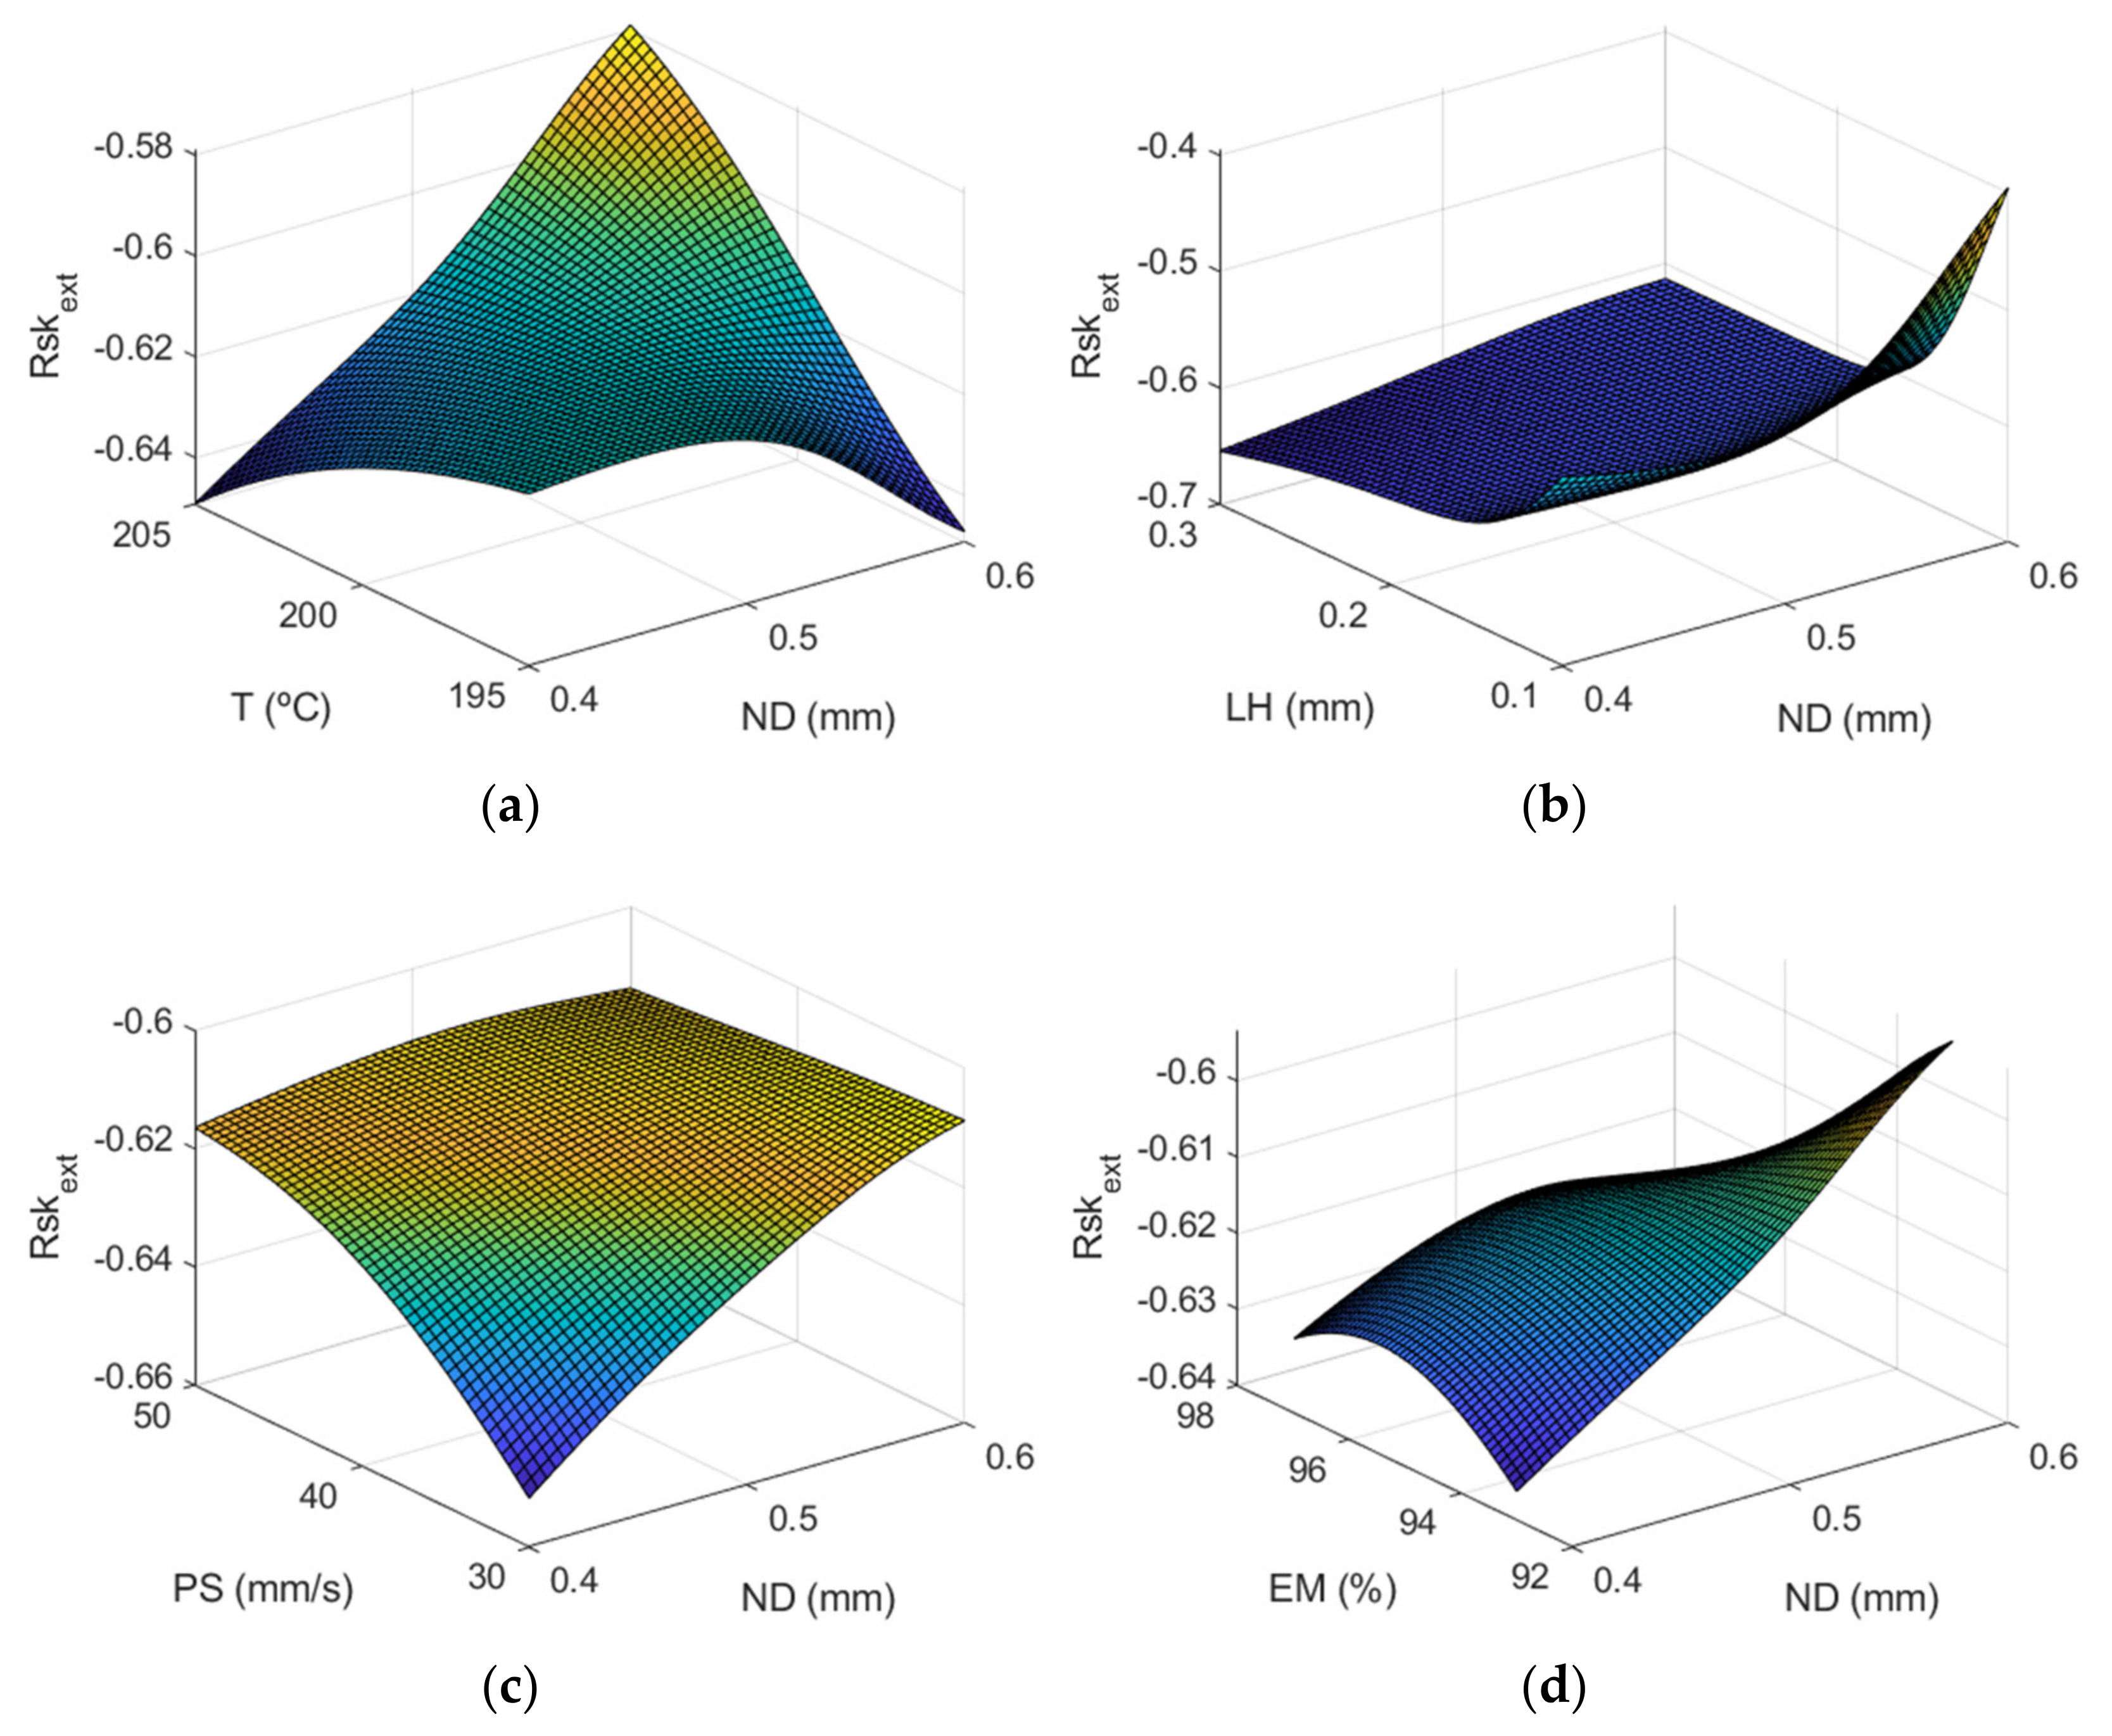
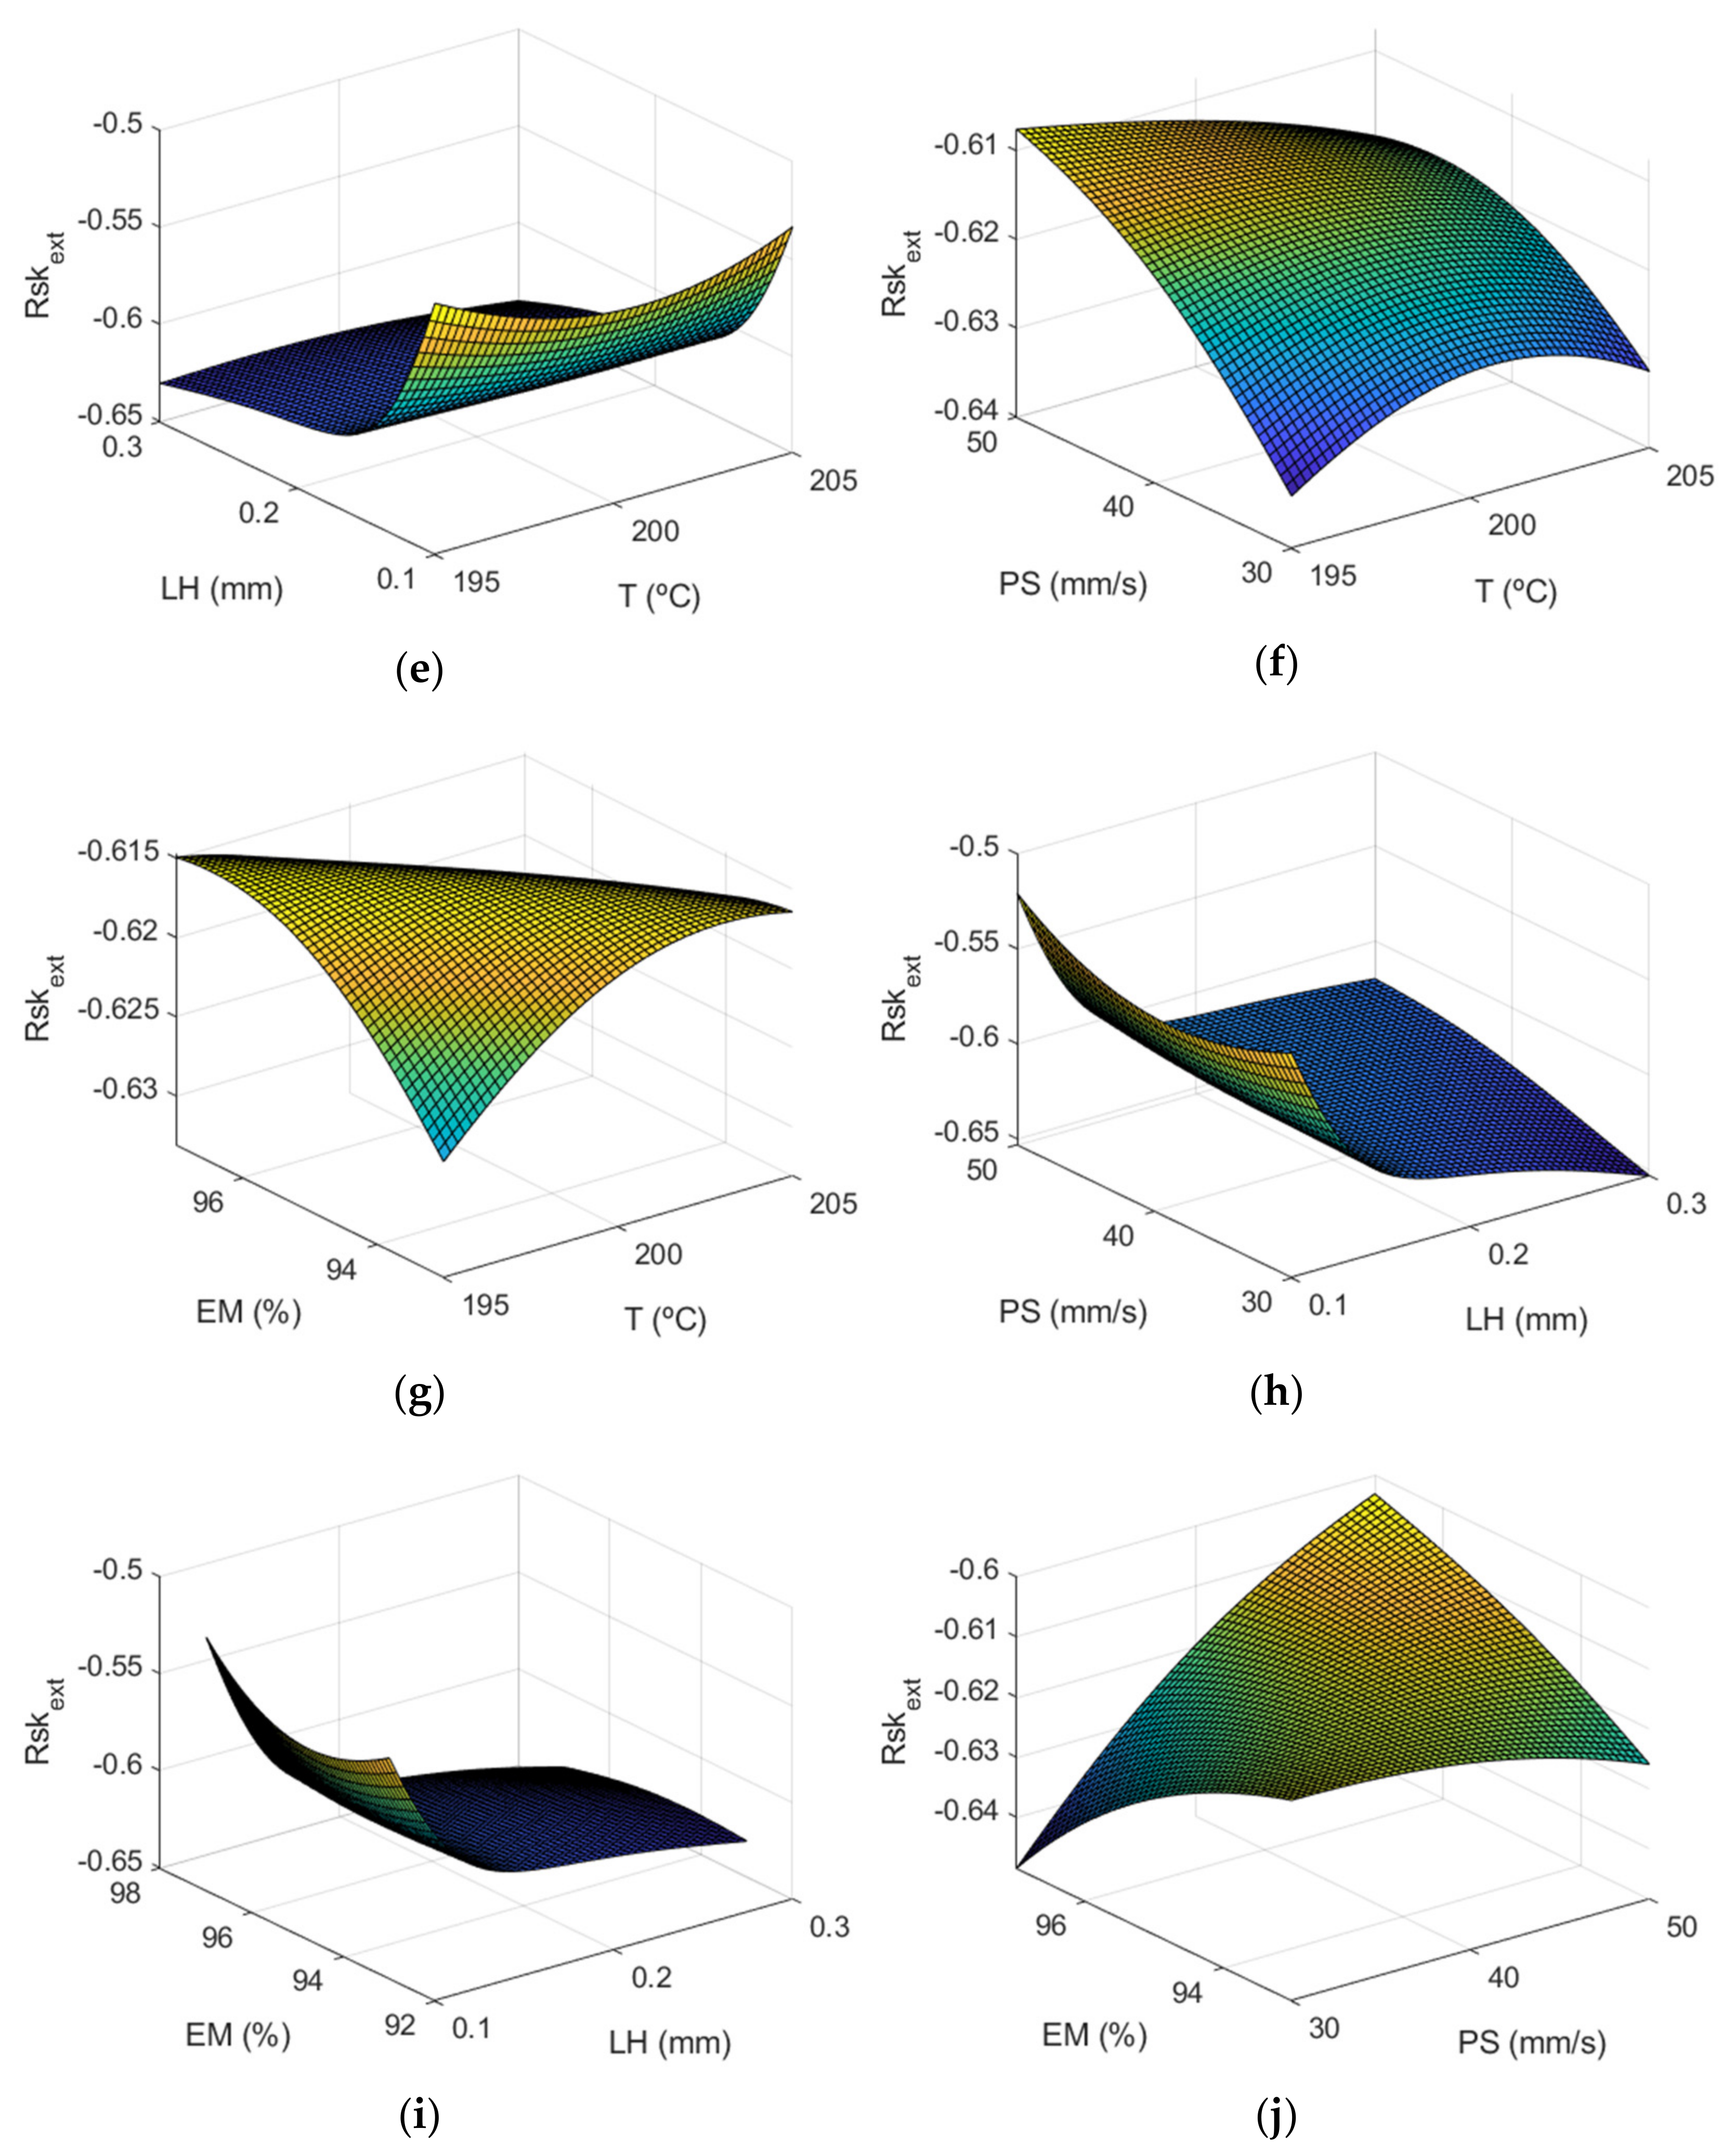
Figure 14 shows a similar behavior regarding the interactions between Rkuext and Rkuint. Figure 15 depicts the surface response of using the ANFIS for the case of the outer layer of the manufactured prototypes. Again layer height is the most influential factor on the Rsk parameter.
Figure 16 and Figure 17 correspond to the main effect plots and the interaction effects plots for . The main effect influencing was layer height, followed by nozzle diameter and print speed.
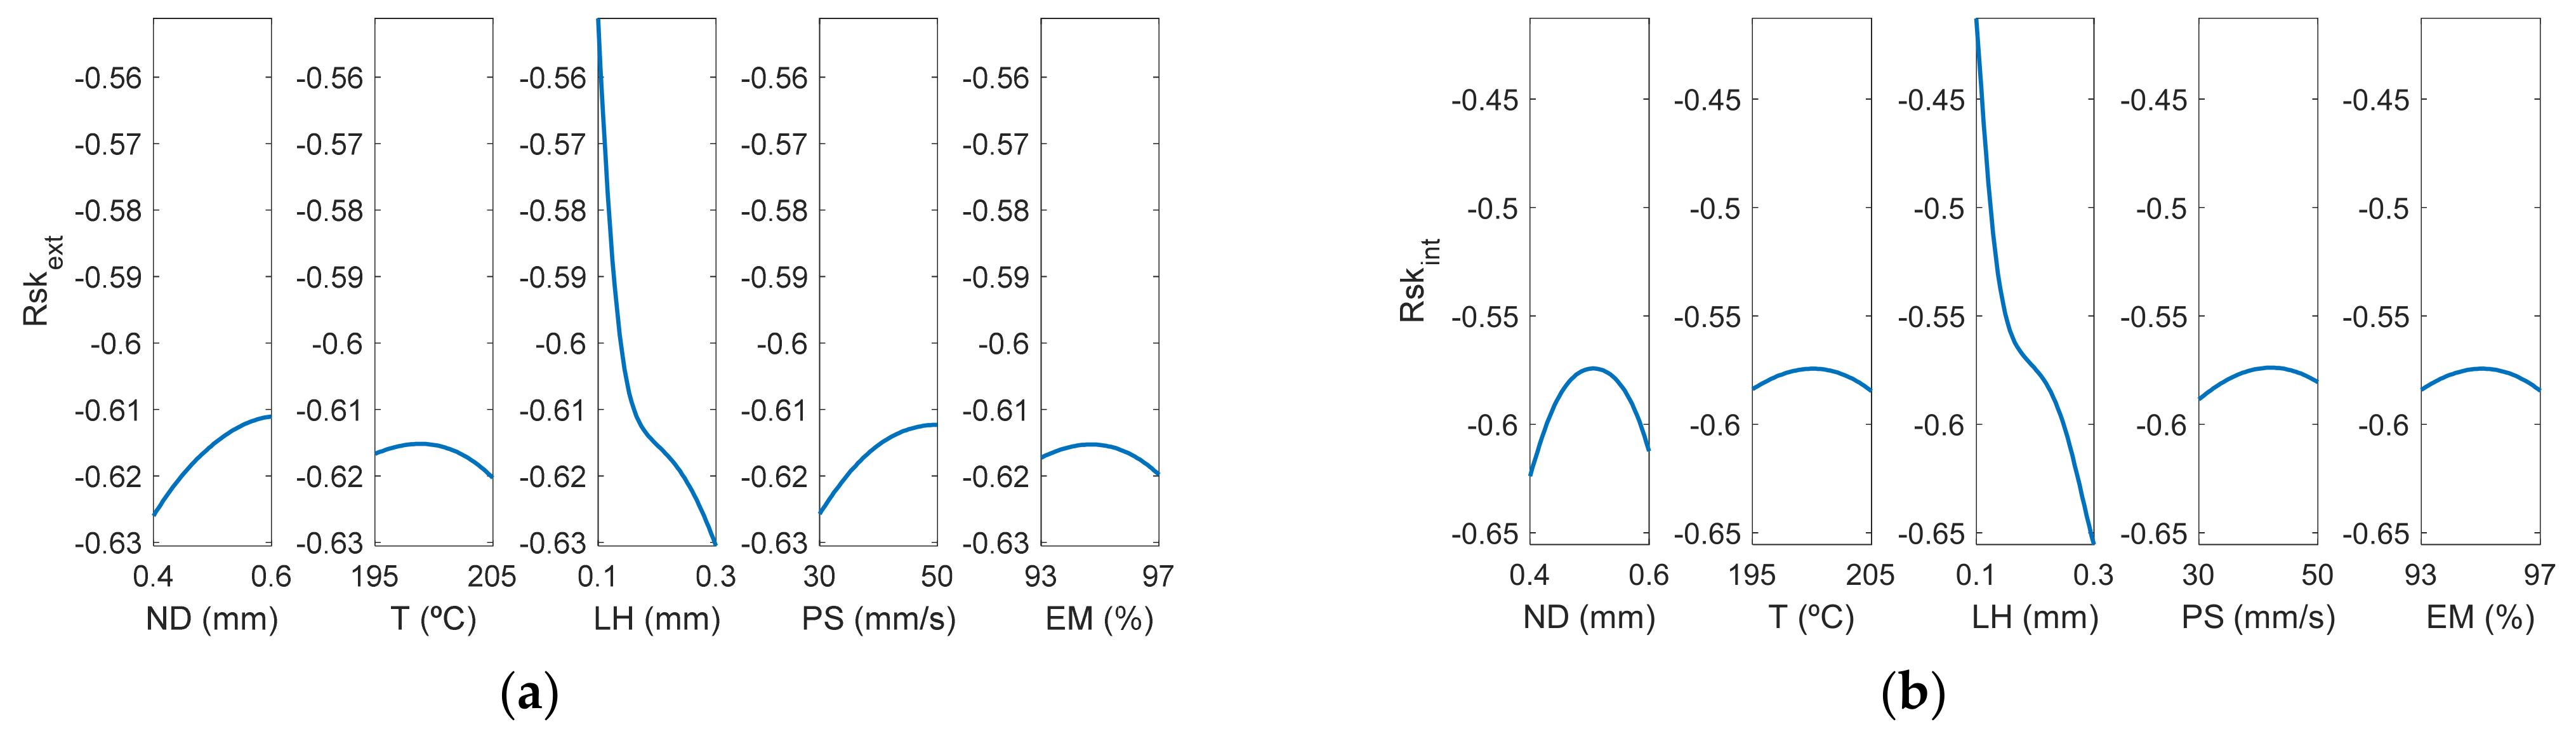
Rsk took negative values in almost all experiments, as shown in Table 3, which indicates that the distribution of the valleys was more pronounced than that of the peaks in the AM parts. This is usual in extrusion 3D printing processes for vertical walls [13]. For high inclination angles, Rsk values increase to zero or even positive values [45]. In the present work, the lowest values of this parameter were obtained for the case of LH being 0.3 mm, and the values closest to zero were for the case of LH 0.1 mm. Likewise, it was observed that the values were more pronounced in the case of the internal face of the manufactured prototypes and also with greater variability, while in the case of the external area of the parts they were more uniform. Finally, the factor that most influenced Rsk was LH and the greatest interactions occurred for ND-LH, T-EM and PS-EM. Specifically, the ANFIS model provided an Rskext that was close to 0 (Rskext = −0.39) when LH was at its minimum value and ND at its maximum, the rest of the design parameters being at their central values. On the other hand, a value of Rskint close to zero (Rskint = −0.25) was obtained when ND was at its minimum value and LH at the minimum. Similar negative Ssk values were obtained in an analogous extrusion process, direct ink writing for ceramics [37].
4. Conclusions
In this research study the roughness obtained in hemispherical cups printed in PLA material with FFF technology was analyzed by using ANFIS modeling. It was found, for the range of variation of the parameters analyzed in this present study, that there is no great difference between the roughness values obtained in the outer layer of the parts with respect to those obtained in the inner layer, where the layer height, followed by the nozzle diameter, are the process parameters that have the greatest influence on both the arithmetical mean height (Ra) and on the greatest height of the roughness profile (Rz).
With regard to the kurtosis Rku parameter, it was shown that the distribution of the roughness profile was slightly flattened (Rsk < 3), to a greater extent on the external face than on the internal one, and that the layer height was the most influential parameter. Higher values were obtained for LH being 0.1 mm than for 0.3 mm. On the other hand, as a general trend the skwness parameter Rsk took negative values in both faces of the parts, which indicates that the distribution of the valleys was more pronounced than that of the peaks in the AM parts. The lowest values of this parameter were obtained for the case of LH being 0.3 mm and the values closest to zero were for the case of LH 0.1 mm.
The present study will help to select appropriate 3D printing conditions in order to reduce surface roughness in curved surfaces, such as those used in the manufacture of the acetabular part of the hip prostheses.
Author Contributions
Conceptualization, I.B.-C. and C.J.L.-P.; methodology, I.B.-C. and X.S.-C.; software, C.J.L.-P. and X.S.-C.; validation, I.B.-C.; formal analysis, I.B.-C.; investigation, I.B.-C., X.S.-C. and C.J.L.-P.; resources, I.B.-C.; data curation, X.S.-C.; writing—original draft preparation, C.J.L.-P. and I.B.-C.; writing—review and editing, C.J.L.-P. and I.B.-C.; visualization, I.B.-C., C.J.L.-P. and X.S.-C.; supervision, C.J.L.-P.; project administration, I.B.-C.; funding acquisition, I.B.-C. All authors have read and agreed to the published version of the manuscript.
Funding
This research was co-financed by the European Union Regional Development Fund within the framework of the ERDF Operational Program of Catalonia 2014–2020 with a grant of 50% of total cost eligible, project BASE3D, grant number 001-P-001646.
Institutional Review Board Statement
Not applicable.
Informed Consent Statement
Not applicable.
Data Availability Statement
The data presented in this study are available upon request from the corresponding author.
Acknowledgments
The authors thank Alejandro Domínguez-Fernández and Ramón Casado-López for their help with the experimental tests.
Conflicts of Interest
The authors declare no conflict of interest.
References
- Pabinger, C.; Geissler, A. Utilization rates of hip arthroplasty in OECD countries. Osteoarthr. Cartil. 2014, 22, 734–741. [Google Scholar] [CrossRef] [PubMed] [Green Version]
- OECD. Health at a Glance 2019; Organisation for Economic Co-operation and Development: Paris, France, 2019. [Google Scholar]
- Sorokina, Y.; Wong, J. Cementless Hip Implants Are Gradually Losing Their Popularity in Europe; ODT Buyer’Guide. 2018. Available online: https://www.odtmag.com/contents/view_online-exclusives/2018-10-23/cementless-hip-implants-are-gradually-losing-their-popularity-in-europe/ (accessed on 22 June 2021).
- Vivek Sood, M. Cemented vs. Cementless Alternatives in Joint Replacement; Arthritis-Health. 2020. Available online: https://www.arthritis-health.com/surgery/shoulder-surgery/cemented-vs-cementless-alternatives-joint-replacement (accessed on 22 June 2021).
- Yuan, L.; Ding, S.; Wen, C. Additive manufacturing technology for porous metal implant applications and triple minimal surface structures: A review. Bioact. Mater. 2019, 4, 56–70. [Google Scholar] [CrossRef] [PubMed]
- Buj-Corral, I.; Tejo-Otero, A.; Fenollosa-Artés, F. Development of AM Technologies for Metals in the Sector of Medical Implants. Metals 2020, 10, 686. [Google Scholar] [CrossRef]
- Ramot, Y.; Haim-Zada, M.; Domb, A.J.; Nyska, A. Biocompatibility and safety of PLA and its copolymers. Adv. Drug Deliv. Rev. 2016, 107, 153–162. [Google Scholar] [CrossRef] [PubMed]
- Bostman, O.; Hirvensalo, E.; Makinen, J.; Rokkanen, P. Foreign-body reactions to fracture fixation implants of biodegradable synthetic polymers. J. Bone Jt. Surgery Br. Vol. 1990, 72-B, 592–596. [Google Scholar] [CrossRef]
- Böstman, O.M.; Pihlajamäki, H.K. Adverse Tissue Reactions to Bioabsorbable Fixation Devices. Clin. Orthop. Relat. Res. 2000, 371, 216–227. [Google Scholar] [CrossRef] [Green Version]
- Rahman, H.; John, T.; Sivadasan, M.; Singh, N. Investigation on the Scale Factor applicable to ABS based FDM Additive Manufacturing. In Proceedings of the Materials Today: Proceedings; Elsevier BV: Amsterdam, The Netherlands, 2018; Volume 5, pp. 1640–1648. [Google Scholar]
- Peng, T.; Yan, F. Dual-objective Analysis for Desktop FDM Printers: Energy Consumption and Surface Roughness. Procedia CIRP 2018, 69, 106–111. [Google Scholar] [CrossRef]
- Alsoufi, M.S.; Elsayed, A.E. How Surface Roughness Performance of Printed Parts Manufactured by Desktop FDM 3D Printer with PLA+ is Influenced by Measuring Direction. Am. J. Mech. Eng. 2017, 5, 211–222. [Google Scholar] [CrossRef]
- Buj-Corral, I.; Domínguez-Fernández, A.; Durán-Llucià, R. Influence of print orientation on surface roughness in fused deposition modeling (FDM) processes. Materials 2019, 12, 3824. [Google Scholar] [CrossRef] [Green Version]
- Alsoufi, M.S.; Elsayed, A.E. Surface Roughness Quality and Dimensional Accuracy—A Comprehensive Analysis of 100% Infill Printed Parts Fabricated by a Personal/Desktop Cost-Effective FDM 3D Printer. Mater. Sci. Appl. 2018, 9, 11–40. [Google Scholar] [CrossRef] [Green Version]
- Takagi, T.; Sugeno, M. Fuzzy identification of systems and its applications to modeling and control. IEEE Trans. Syst. Man Cybern. 1985, SMC-15, 116–132. [Google Scholar] [CrossRef]
- Mamdani, E. Application of fuzzy algorithms for control of simple dynamic plant. Proc. Inst. Electr. Eng. 1974, 121, 1585. [Google Scholar] [CrossRef]
- Mamdani Application of Fuzzy Logic to Approximate Reasoning Using Linguistic Synthesis. IEEE Trans. Comput. 1977, C-26, 1182–1191. [CrossRef]
- Jang, J.R. ANFIS: Adap tive-Ne twork-Based Fuzzy Inference System. IEEE Trans. Syst. Man Cybern. 1993, 23, 665–685. [Google Scholar] [CrossRef]
- Shihabudheen, K.; Pillai, G. Recent advances in neuro-fuzzy system: A survey. Knowl. Based Syst. 2018, 152, 136–162. [Google Scholar] [CrossRef]
- Aamir, M.; Tu, S.; Tolouei-Rad, M.; Giasin, K.; Vafadar, A. Optimization and Modeling of Process Parameters in Multi-Hole Simultaneous Drilling Using Taguchi Method and Fuzzy Logic Approach. Materials 2020, 13, 680. [Google Scholar] [CrossRef] [Green Version]
- Pandiyan, V.; Caesarendra, W.; Tjahjowidodo, T.; Praveen, G. Predictive Modelling and Analysis of Process Parameters on Material Removal Characteristics in Abrasive Belt Grinding Process. Appl. Sci. 2017, 7, 363. [Google Scholar] [CrossRef]
- Kojima, C.; Nishio, M.; Nakajima, Y.; Kawano, T.; Takatsuka, K.; Matsumoto, A. Rapid Photoinduced Single Cell Detachment from Gold Nanoparticle-Embedded Collagen Gels with Low Denaturation Temperature. Polymers 2020, 12, 213. [Google Scholar] [CrossRef] [Green Version]
- Wang, C.; Tan, X.; Tor, S.; Lim, C. Machine learning in additive manufacturing: State-of-the-art and perspectives. Addit. Manuf. 2020, 36, 101538. [Google Scholar] [CrossRef]
- Saleh, B.; Maher, I.; Abdelrhman, Y.; Heshmat, M.; Abdelaal, O. Adaptive Neuro-Fuzzy Inference System for Modelling the Effect of Slurry Impacts on PLA Material Processed by FDM. Polymers 2020, 13, 118. [Google Scholar] [CrossRef]
- Padhi, S.K.; Sahu, R.K.; Mahapatra, S.S.; Das, H.C.; Sood, A.K.; Patro, B.; Mondal, A.K. Optimization of fused deposition modeling process parameters using a fuzzy inference system coupled with Taguchi philosophy. Adv. Manuf. 2017, 5, 231–242. [Google Scholar] [CrossRef]
- Sai, T.; Pathak, V.K.; Srivastava, A.K. Modeling and optimization of fused deposition modeling (FDM) process through printing PLA implants using adaptive neuro-fuzzy inference system (ANFIS) model and whale optimization algorithm. J. Braz. Soc. Mech. Sci. Eng. 2020, 42, 1–19. [Google Scholar] [CrossRef]
- Deshwal, S.; Kumar, A.; Chhabra, D. Exercising hybrid statistical tools GA-RSM, GA-ANN and GA-ANFIS to optimize FDM process parameters for tensile strength improvement. CIRP J. Manuf. Sci. Technol. 2020, 31, 189–199. [Google Scholar] [CrossRef]
- Rajpurohit, S.R.; Dave, H.K. Prediction and Optimization of Tensile Strength in FDM Based 3D Printing Using ANFIS. In Optimization of Manufacturing Processes; Springer Series in Advanced Manufacturing: Berlin/Heidelberg, Germany, 2020; pp. 111–128. [Google Scholar]
- Mahesh, M.; Fuh, J.; Wong, Y.; Loh, H. Benchmarking for decision making in rapid prototyping systems. In Proceedings of the IEEE International Conference on Automation Science and Engineering, Edmonton, AB, Canada, 1–2 August 2005. [Google Scholar]
- Yadav, D.; Chhabra, D.; Gupta, R.K.; Phogat, A.; Ahlawat, A. Modeling and analysis of significant process parameters of FDM 3D printer using ANFIS. In Proceedings of the Materials Today: Proceedings; Elsevier BV: Amsterdam, The Netherlands, 2020; Volume 21, pp. 1592–1604. [Google Scholar]
- Huynh, H.N.; Nguyen, A.T.; Ha, N.L.; Thai, T.T.H. Application of fuzzy Taguchi method to improve the dimensional accuracy of Fused Deposition Modeling processed product. In Proceedings of the 2017 International Conference on System Science and Engineering (ICSSE), Ho Chi Minh City, Vietnam, 21–23 July 2017; pp. 107–112. [Google Scholar]
- Khan, M.S.; Mishra, S.B. Minimizing surface roughness of ABS-FDM build parts: An experimental approach. In Proceedings of the Materials Today: Proceedings; Elsevier BV: Amsterdam, The Netherlands, 2020; Volume 26, pp. 1557–1566. [Google Scholar]
- Vyavahare, S.; Kumar, S.; Panghal, D. Experimental study of surface roughness, dimensional accuracy and time of fabrication of parts produced by fused deposition modelling. Rapid Prototyp. J. 2020, 26, 1535–1554. [Google Scholar] [CrossRef]
- Şahin, M.; Erol, R. A Comparative Study of Neural Networks and ANFIS for Forecasting Attendance Rate of Soccer Games. Math. Comput. Appl. 2017, 22, 43. [Google Scholar] [CrossRef] [Green Version]
- Meftah, M.; Ebrahimpour, P.B.; He, C.; Ranawat, A.S.; Ranawat, C.S. Preliminary Clinical and Radiographic Results of Large Ceramic Heads on Highly Cross-Linked Polyethylene. Orthopedics 2011, 34, e133–e137. [Google Scholar] [CrossRef] [PubMed]
- Hansson, K.N.; Hansson, S. Skewness and Kurtosis: Important Parameters in the Characterization of Dental Implant Surface Roughness—A Computer Simulation. ISRN Mater. Sci. 2011, 2011, 1–6. [Google Scholar] [CrossRef] [Green Version]
- Buj-Corral, I.; Domínguez-Fernández, A.; Gómez-Gejo, A. Effect of Printing Parameters on Dimensional Error and Surface Roughness Obtained in Direct Ink Writing (DIW) Processes. Materials 2020, 13, 2157. [Google Scholar] [CrossRef]
- ISO. Geometrical Product Specifications (GPS)-Surface Texture: Profile Method-RULES and Procedures for the Assessment of Surface Texture; International Organization for Standardization: Geneva, Switzerland, 1996; pp. 1–8, ISO 4288:1996. [Google Scholar]
- Costa, S.; Duarte, F.; Covas, J. Thermal conditions affecting heat transfer in FDM/FFE: A contribution towards the numerical modelling of the process. Virtual Phys. Prototyp. 2014, 10, 35–46. [Google Scholar] [CrossRef]
- MATLAB. Fuzzy Logic Toolbox-MATLAB; MathWorks Inc.: Portola Valley, CA, USA, 2017. [Google Scholar]
- Calcagno, S.; Cacciola, M.; Morabito, F.C.; Palamara, I.; Pellicanó, D. Standard Soft Computing Techniques for Characterization of Defects in Nondestructive Evaluation. In Ultrasonic Nondestructive Evaluation Systems; Springer Science and Business Media LLC: Berlin/Heidelberg, Germany, 2014; pp. 175–199. [Google Scholar]
- Egaji, O.A.; Griffiths, A.; Hasan, M.S.; Yu, H.-N. A comparison of Mamdani and Sugeno fuzzy based packet scheduler for MANET with a realistic wireless propagation model. Int. J. Autom. Comput. 2015, 12, 1–13. [Google Scholar] [CrossRef]
- Pérez, C.J.L. A Proposal of an Adaptive Neuro-Fuzzy Inference System for Modeling Experimental Data in Manufacturing Engineering. Mathematics 2020, 8, 1390. [Google Scholar] [CrossRef]
- ISO. Geometrical Product Specifications (GPS)—Surface Texture: Profile method—Terms, Definitions and Surface Texture Parameters; International Organization for Standardization: Geneva, Switzerland, 1997; pp. 1–25, ISO 4287:1997. [Google Scholar]
- Li, Y.; Linke, B.S.; Voet, H.; Falk, B.; Schmitt, R.; Lam, M. Cost, sustainability and surface roughness quality—A comprehensive analysis of products made with personal 3D printers. CIRP J. Manuf. Sci. Technol. 2017, 16, 1–11. [Google Scholar] [CrossRef] [Green Version]
Figure 1.
3D-printed hemispherical cups (a) shape; (b) dimensions.

Figure 2.
Sigma R19 from BCN3D.

Figure 3.
Gaussian membership functions employed to obtain the fuzzy inference system for modelling the roughness parameter (before the ANFIS).
Figure 3.
Gaussian membership functions employed to obtain the fuzzy inference system for modelling the roughness parameter (before the ANFIS).

Figure 4.
Membership functions obtained after using the ANFIS for the case of Ra measured on the outer layer of the manufactured prototypes.
Figure 4.
Membership functions obtained after using the ANFIS for the case of Ra measured on the outer layer of the manufactured prototypes.


Figure 5.
External surface of experiment 12, obtained with high nozzle diameter, low layer height, high print speed, high temperature and low extrusion multiplier: (a) Image, (b) Roughness profile.
Figure 5.
External surface of experiment 12, obtained with high nozzle diameter, low layer height, high print speed, high temperature and low extrusion multiplier: (a) Image, (b) Roughness profile.

Figure 6.
External surface of sample 16, obtained with high nozzle diameter, high layer height, high print speed, high temperature and high extrusion multiplier: (a) Image, (b) Roughness profile.
Figure 6.
External surface of sample 16, obtained with high nozzle diameter, high layer height, high print speed, high temperature and high extrusion multiplier: (a) Image, (b) Roughness profile.

Figure 7.
Surface response of using the ANFIS for the case of the outer layer of the manufactured prototypes vs: (a) nozzle diameter and temperature, (b) nozzle diameter and layer height, (c) nozzle diameter and print speed, (d) nozzle diameter and extrusion multiplier, (e) temperature and layer height, (f) temperature and print speed, (g) temperature and extrusion multiplier, (h) layer height and print speed, (i) layer height and extrusion multiplier, (j) print speed and extrusion multiplier.


Figure 8.
Main effects plots for (a) and (b) .

Figure 9.
Interaction effects plots for (a) and (b) .

Figure 10.
Response surface of using the ANFIS for the case of the outer layer of the manufactured prototypes vs: (a) nozzle diameter and temperature, (b) nozzle diameter and layer height, (c) nozzle diameter and print speed, (d) nozzle diameter and extrusion multiplier, (e) temperature and layer height, (f) temperature and print speed, (g) temperature and extrusion multiplier, (h) layer height and print speed, (i) layer height and extrusion multiplier, (j) print speed and extrusion multiplier.


Figure 11.
Main effects plots for (a) and (b) .

Figure 12.
Surface response of using the ANFIS for the case of the outer layer of the manufactured prototypes vs: (a) nozzle diameter and temperature, (b) nozzle diameter and layer height, (c) nozzle diameter and print speed, (d) nozzle diameter and extrusion multiplier, (e) temperature and layer height, (f) temperature and print speed, (g) temperature and extrusion multiplier, (h) layer height and print speed, (i) layer height and extrusion multiplier, (j) print speed and extrusion multiplier.


Figure 13.
Main effects plots for (a) and (b) .

Figure 14.
Interaction effects plots for (a) and (b) .

Figure 15.
Surface response of using the ANFIS for the case of the outer layer of the manufactured prototypes vs: (a) nozzle diameter and temperature, (b) nozzle diameter and layer height, (c) nozzle diameter and print speed, (d) nozzle diameter and extrusion multiplier, (e) temperature and layer height, (f) temperature and print speed, (g) temperature and extrusion multiplier, (h) layer height and print speed, (i) layer height and extrusion multiplier, (j) print speed and extrusion multiplier.


Figure 16.
Main effects plots for (a) and (b) .

Figure 17.
Interaction effects plots for (a) and (b) .


Table 1.
Levels of the input variables of the design of experiments (DOE).
| Input Variables | Low | Center | High | ||
|---|---|---|---|---|---|
| ND: | Nozzle Diameter | (mm) | 0.4 | 0.5 | 0.6 |
| T: | Temperature | (°C) | 195 | 200 | 205 |
| LH: | Layer Height | (mm) | 0.1 | 0.2 | 0.3 |
| PS: | Print Speed | (mm/s) | 30 | 40 | 50 |
| EM: | Extrusion Multiplier | (%) | 93 | 95 | 97 |
Table 2.
Output variables (Roughness).
| Outputs (Int/Ext) | |||
|---|---|---|---|
| Ra (μm) | Rz (μm) | Rku | Rsk |
Table 3.
Values for the variables (ND: nozzle diameter; T: temperature; LH: layer height; PS: print speed; EM: extrusion multiplier), roughness results of the external surface and roughness results of the internal surface.
Table 3.
Values for the variables (ND: nozzle diameter; T: temperature; LH: layer height; PS: print speed; EM: extrusion multiplier), roughness results of the external surface and roughness results of the internal surface.
| External Roughness | Internal Roughness | ||||||||||||
|---|---|---|---|---|---|---|---|---|---|---|---|---|---|
| Exp. | ND | T | LH | PS | EM | Ra (μm) | Rz (μm) | Rku | Rsk | Ra (μm) | Rz (μm) | Rku | Rsk |
| 1 | 0.4 | 195 | 0.1 | 30 | 97 | 7.58 | 37.57 | 2.319 | −0.395 | 7.83 | 40.42 | 2.351 | −0.224 |
| 2 | 0.6 | 195 | 0.1 | 30 | 93 | 8.55 | 40.28 | 2.362 | −0.418 | 9.88 | 47.76 | 3.329 | −0.502 |
| 3 | 0.4 | 205 | 0.1 | 30 | 93 | 7.86 | 37.96 | 2.262 | −0.296 | 7.94 | 38.80 | 2.495 | −0.399 |
| 4 | 0.6 | 205 | 0.1 | 30 | 97 | 9.26 | 48.23 | 2.794 | −0.421 | 8.87 | 43.55 | 2.108 | −0.167 |
| 5 | 0.4 | 195 | 0.3 | 30 | 93 | 23.37 | 89.74 | 2.130 | −0.679 | 22.66 | 89.66 | 2.128 | −0.630 |
| 6 | 0.6 | 195 | 0.3 | 30 | 97 | 21.89 | 86.46 | 2.213 | −0.702 | 21.41 | 86.04 | 2.215 | −0.693 |
| 7 | 0.4 | 205 | 0.3 | 30 | 97 | 21.20 | 84.42 | 2.298 | −0.773 | 21.20 | 86.08 | 2.266 | −0.728 |
| 8 | 0.6 | 205 | 0.3 | 30 | 93 | 21.90 | 91.43 | 2.133 | −0.510 | 20.55 | 85.33 | 2.310 | −0.720 |
| 9 | 0.4 | 195 | 0.1 | 50 | 93 | 7.92 | 36.77 | 2.380 | −0.521 | 9.61 | 47.78 | 2.435 | 0.052 |
| 10 | 0.6 | 195 | 0.1 | 50 | 97 | 8.87 | 44.93 | 2.443 | 0.123 | 9.15 | 46.79 | 2.316 | −0.004 |
| 11 | 0.4 | 205 | 0.1 | 50 | 97 | 8.64 | 41.46 | 2.232 | −0.369 | 9.69 | 50.36 | 2.635 | −0.009 |
| 12 | 0.6 | 205 | 0.1 | 50 | 93 | 8.90 | 49.41 | 2.580 | −0.318 | 10.11 | 49.20 | 2.802 | −0.488 |
| 13 | 0.4 | 195 | 0.3 | 50 | 97 | 22.41 | 91.22 | 2.151 | −0.565 | 21.26 | 84.92 | 2.243 | −0.694 |
| 14 | 0.6 | 195 | 0.3 | 50 | 93 | 21.55 | 89.08 | 2.224 | −0.651 | 21.74 | 85.66 | 2.189 | −0.674 |
| 15 | 0.4 | 205 | 0.3 | 50 | 93 | 22.44 | 88.00 | 2.176 | −0.686 | 23.55 | 91.44 | 2.106 | −0.654 |
| 16 | 0.6 | 205 | 0.3 | 50 | 97 | 21.77 | 90.76 | 2.194 | −0.595 | 21.66 | 86.46 | 2.195 | −0.667 |
| 17-1 | 0.5 | 200 | 0.2 | 40 | 95 | 13.94 | 59.94 | 2.297 | −0.678 | 14.20 | 61.26 | 2.180 | −0.565 |
| 17-2 | 0.5 | 200 | 0.2 | 40 | 95 | 14.18 | 61.67 | 2.239 | −0.577 | 14.58 | 61.88 | 2.204 | −0.560 |
| 17-3 | 0.5 | 200 | 0.2 | 40 | 95 | 13.84 | 58.85 | 2.207 | −0.591 | 14.61 | 61.90 | 2.210 | −0.598 |
Publisher’s Note: MDPI stays neutral with regard to jurisdictional claims in published maps and institutional affiliations. |
© 2021 by the authors. Licensee MDPI, Basel, Switzerland. This article is an open access article distributed under the terms and conditions of the Creative Commons Attribution (CC BY) license (https://creativecommons.org/licenses/by/4.0/).
Share and Cite
MDPI and ACS Style
Buj-Corral, I.; Sánchez-Casas, X.; Luis-Pérez, C.J. Analysis of AM Parameters on Surface Roughness Obtained in PLA Parts Printed with FFF Technology. Polymers 2021, 13, 2384. https://0-doi-org.brum.beds.ac.uk/10.3390/polym13142384
AMA Style
Buj-Corral I, Sánchez-Casas X, Luis-Pérez CJ. Analysis of AM Parameters on Surface Roughness Obtained in PLA Parts Printed with FFF Technology. Polymers. 2021; 13(14):2384. https://0-doi-org.brum.beds.ac.uk/10.3390/polym13142384
Chicago/Turabian StyleBuj-Corral, Irene, Xavier Sánchez-Casas, and Carmelo J. Luis-Pérez. 2021. "Analysis of AM Parameters on Surface Roughness Obtained in PLA Parts Printed with FFF Technology" Polymers 13, no. 14: 2384. https://0-doi-org.brum.beds.ac.uk/10.3390/polym13142384
Note that from the first issue of 2016, this journal uses article numbers instead of page numbers. See further details here.