
Phase Transitions in Poly(vinylidene fluoride)/Polymethylene-Based Diblock Copolymers and Blends

 , , , , , and
Abstract
:
1. Introduction
2. Materials and Methods
2.1. Materials
2.2. Methods
2.2.1. Differential Scanning Calorimetry (DSC)
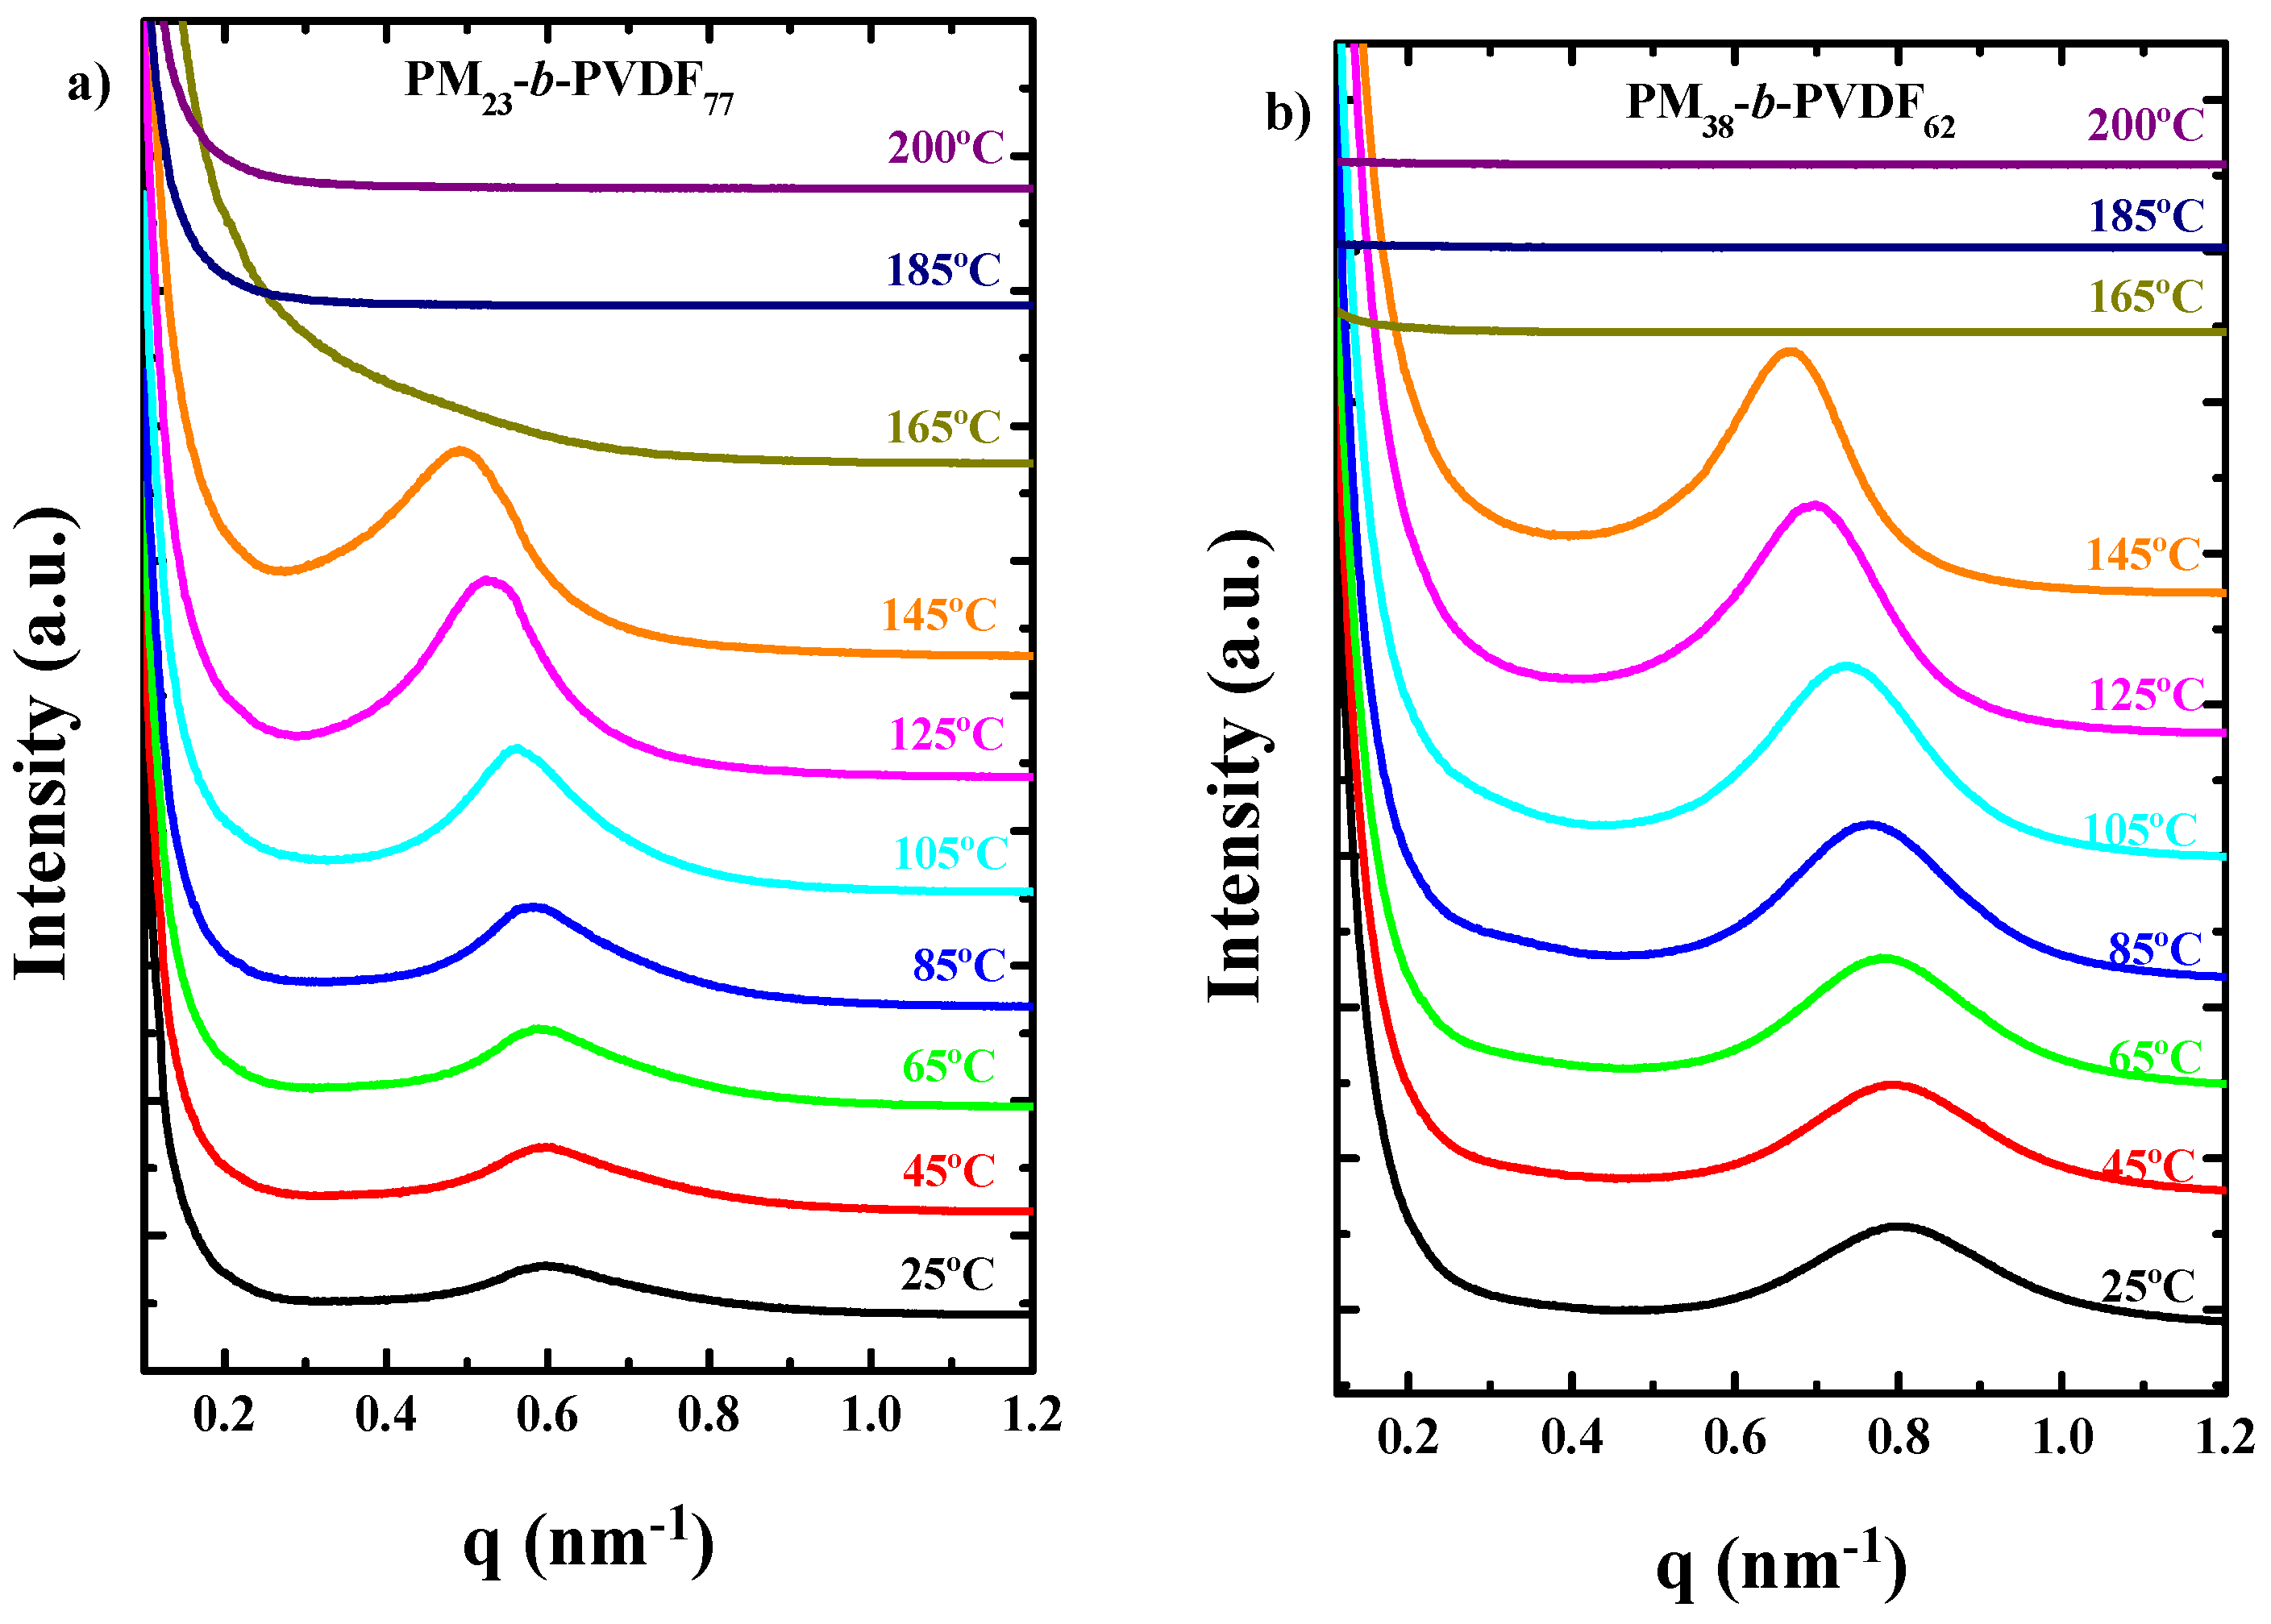
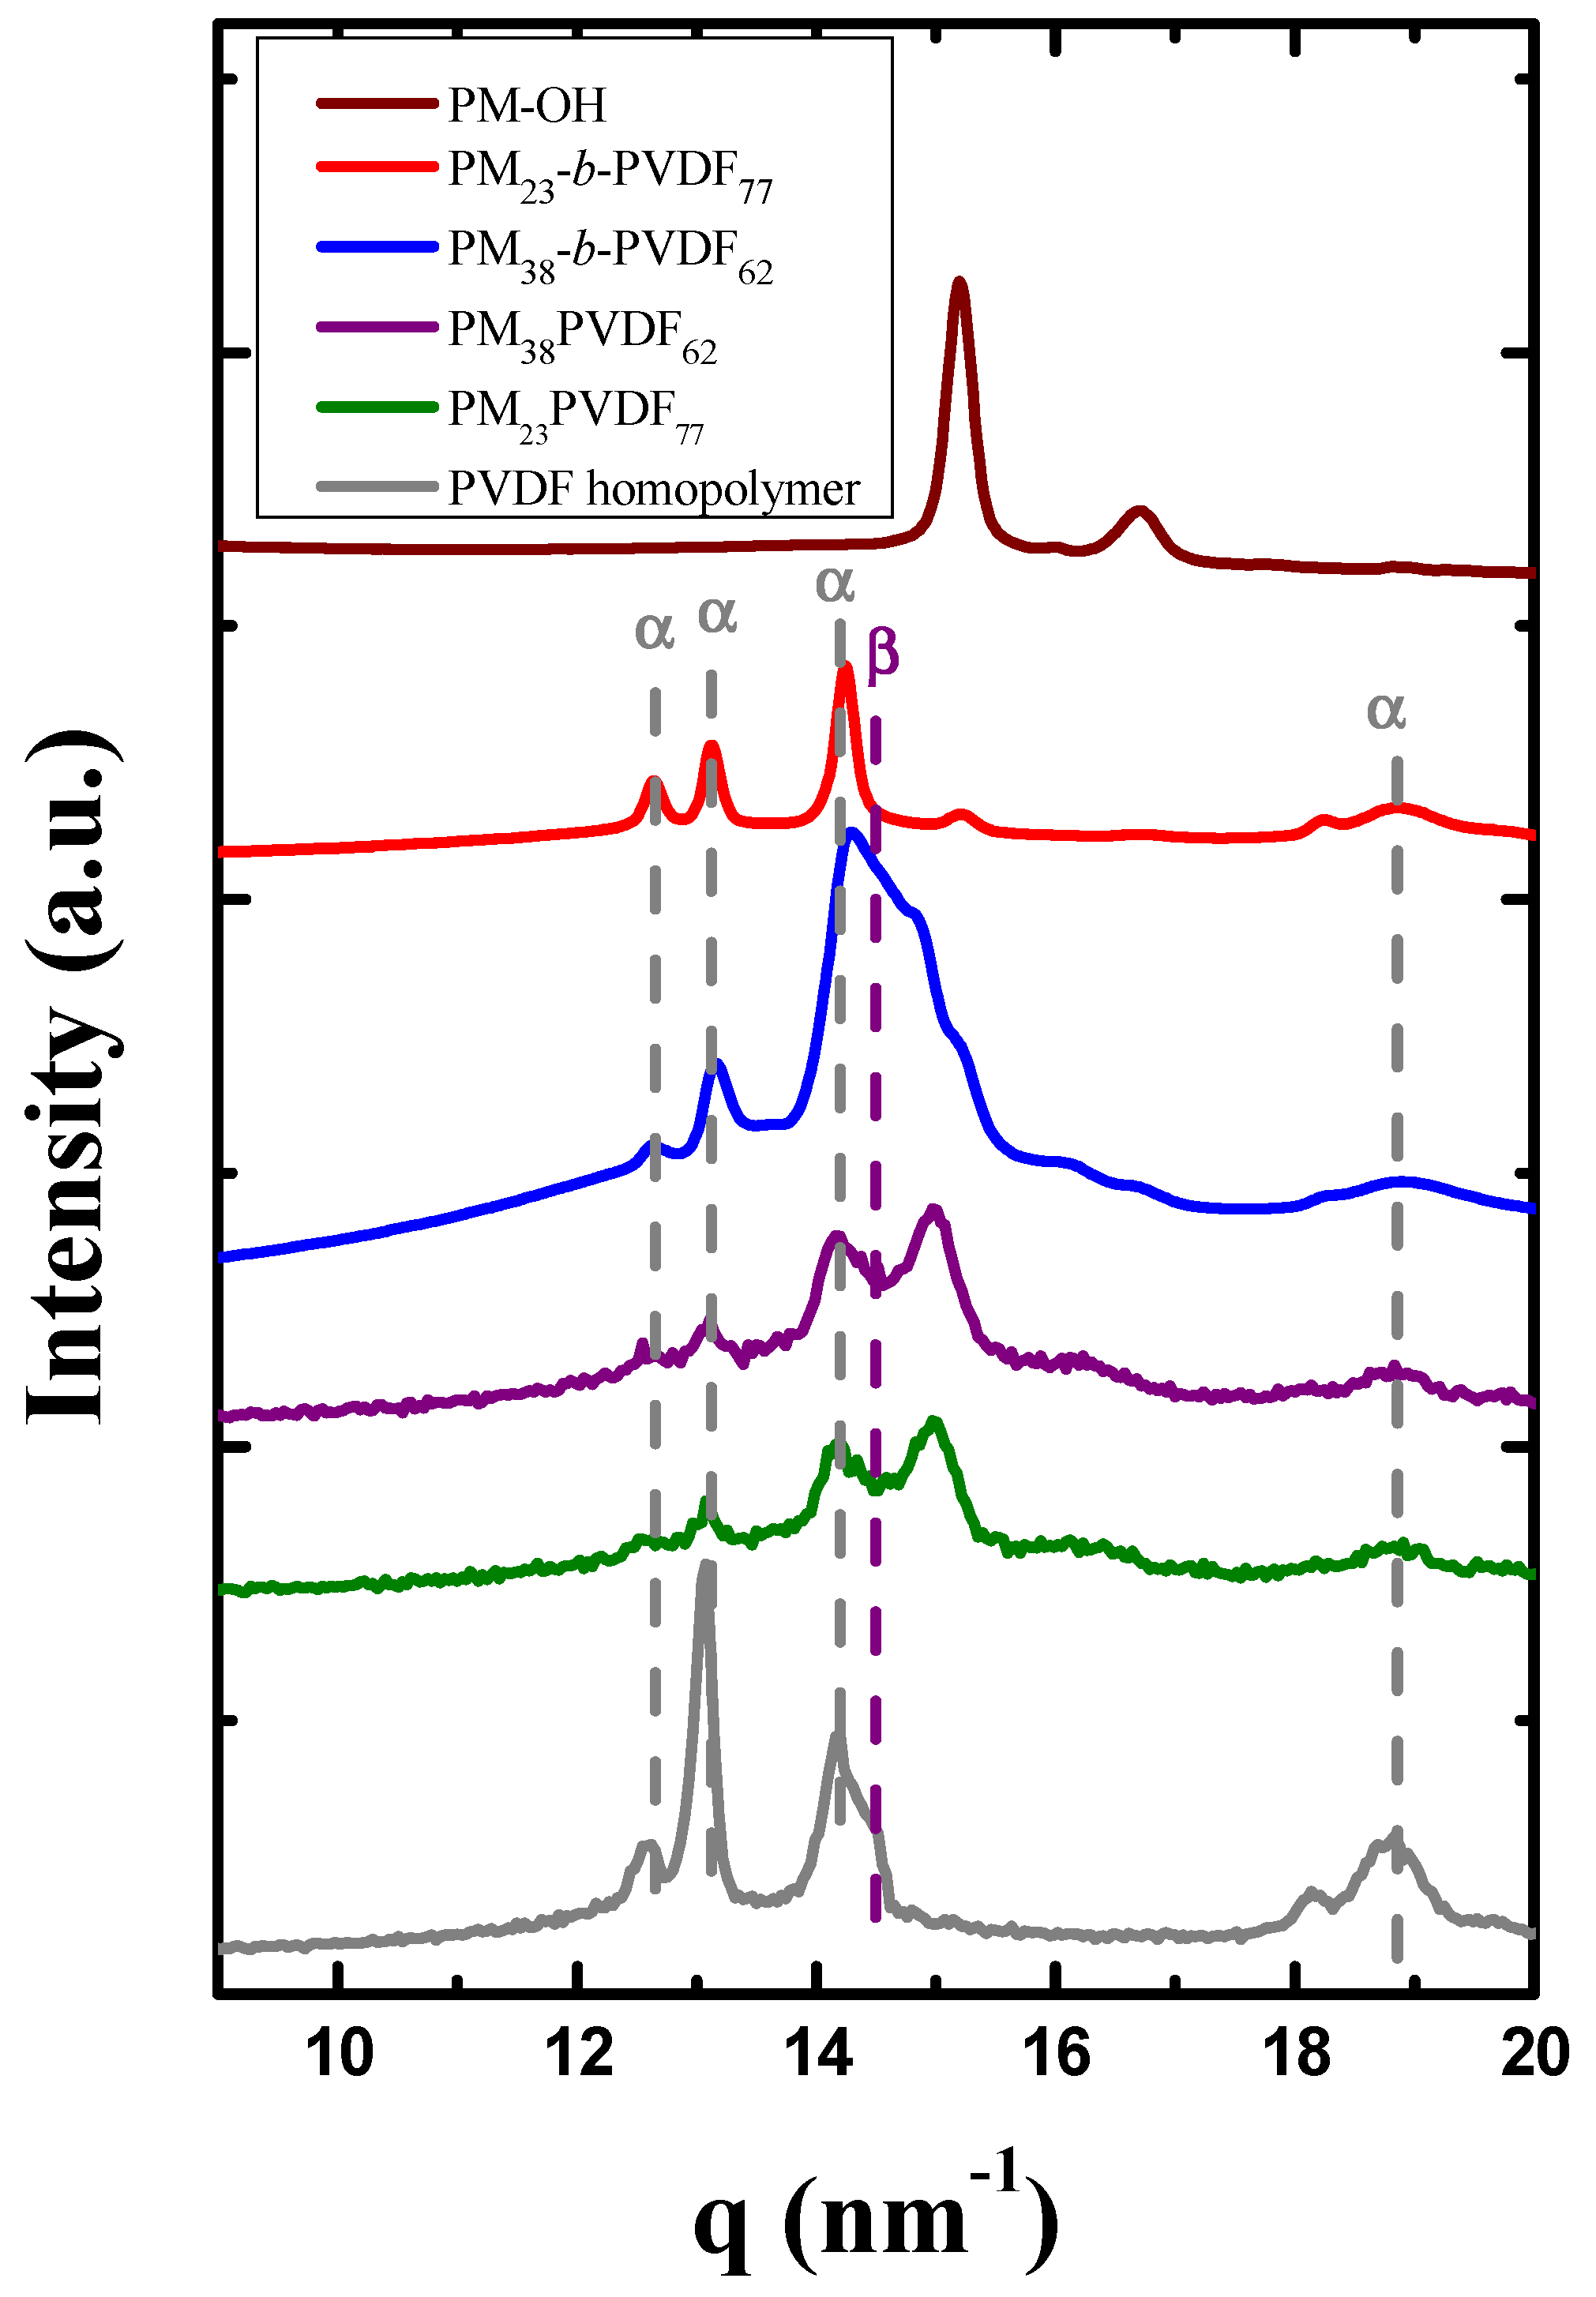
2.2.2. X-ray Diffraction
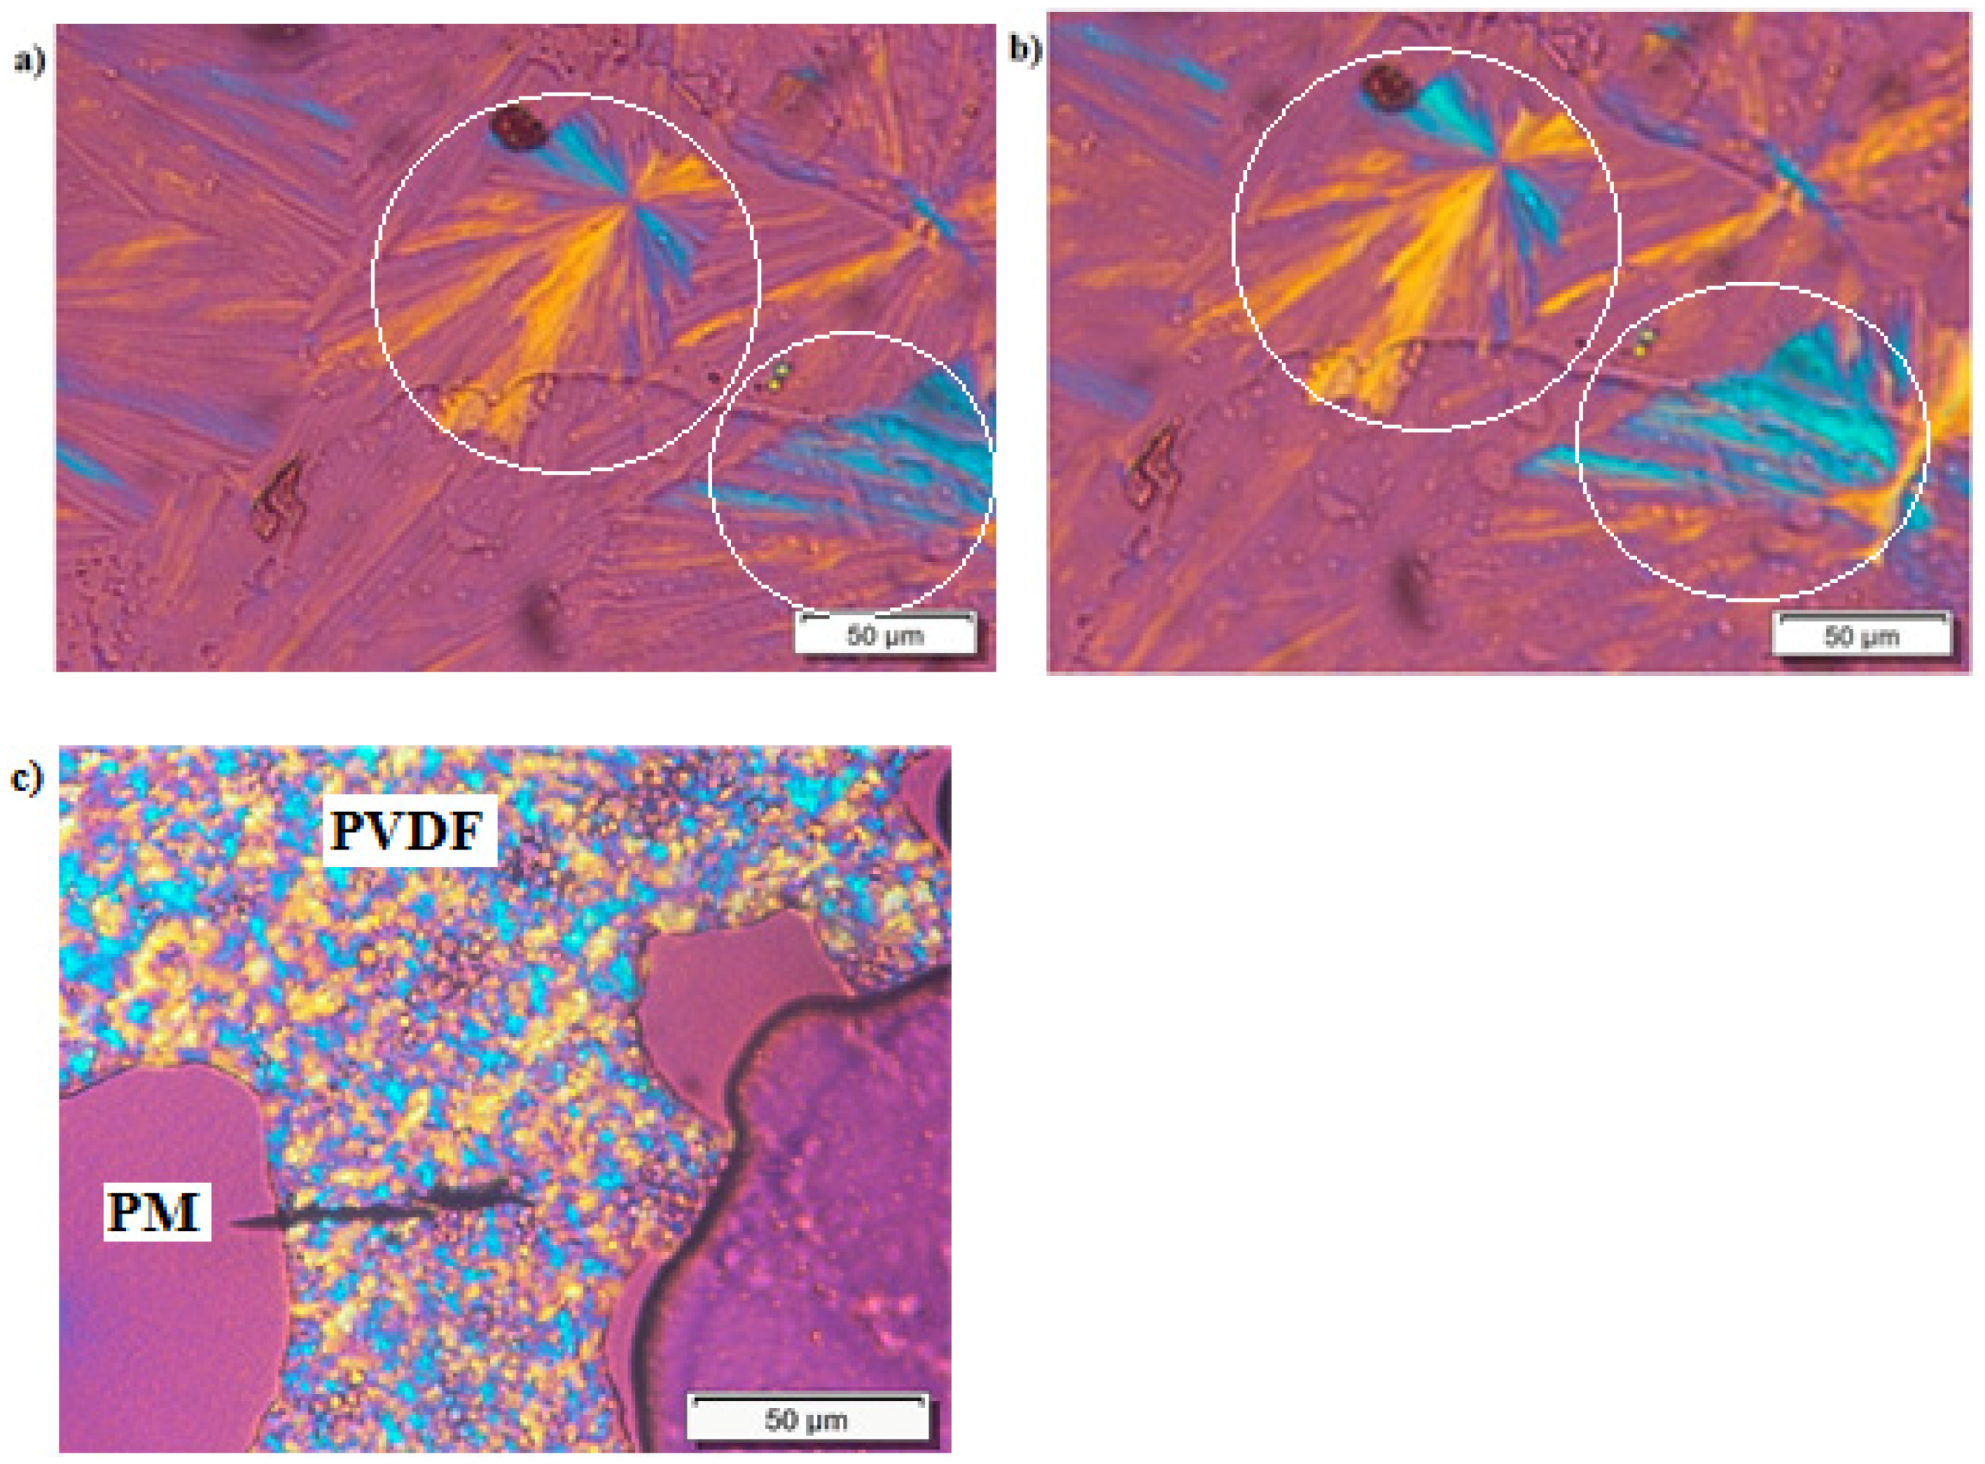
2.2.3. Polarized Light Optical Microscopy (PLOM)
2.2.4. Fourier Transform Infrared Spectroscopy (FTIR)
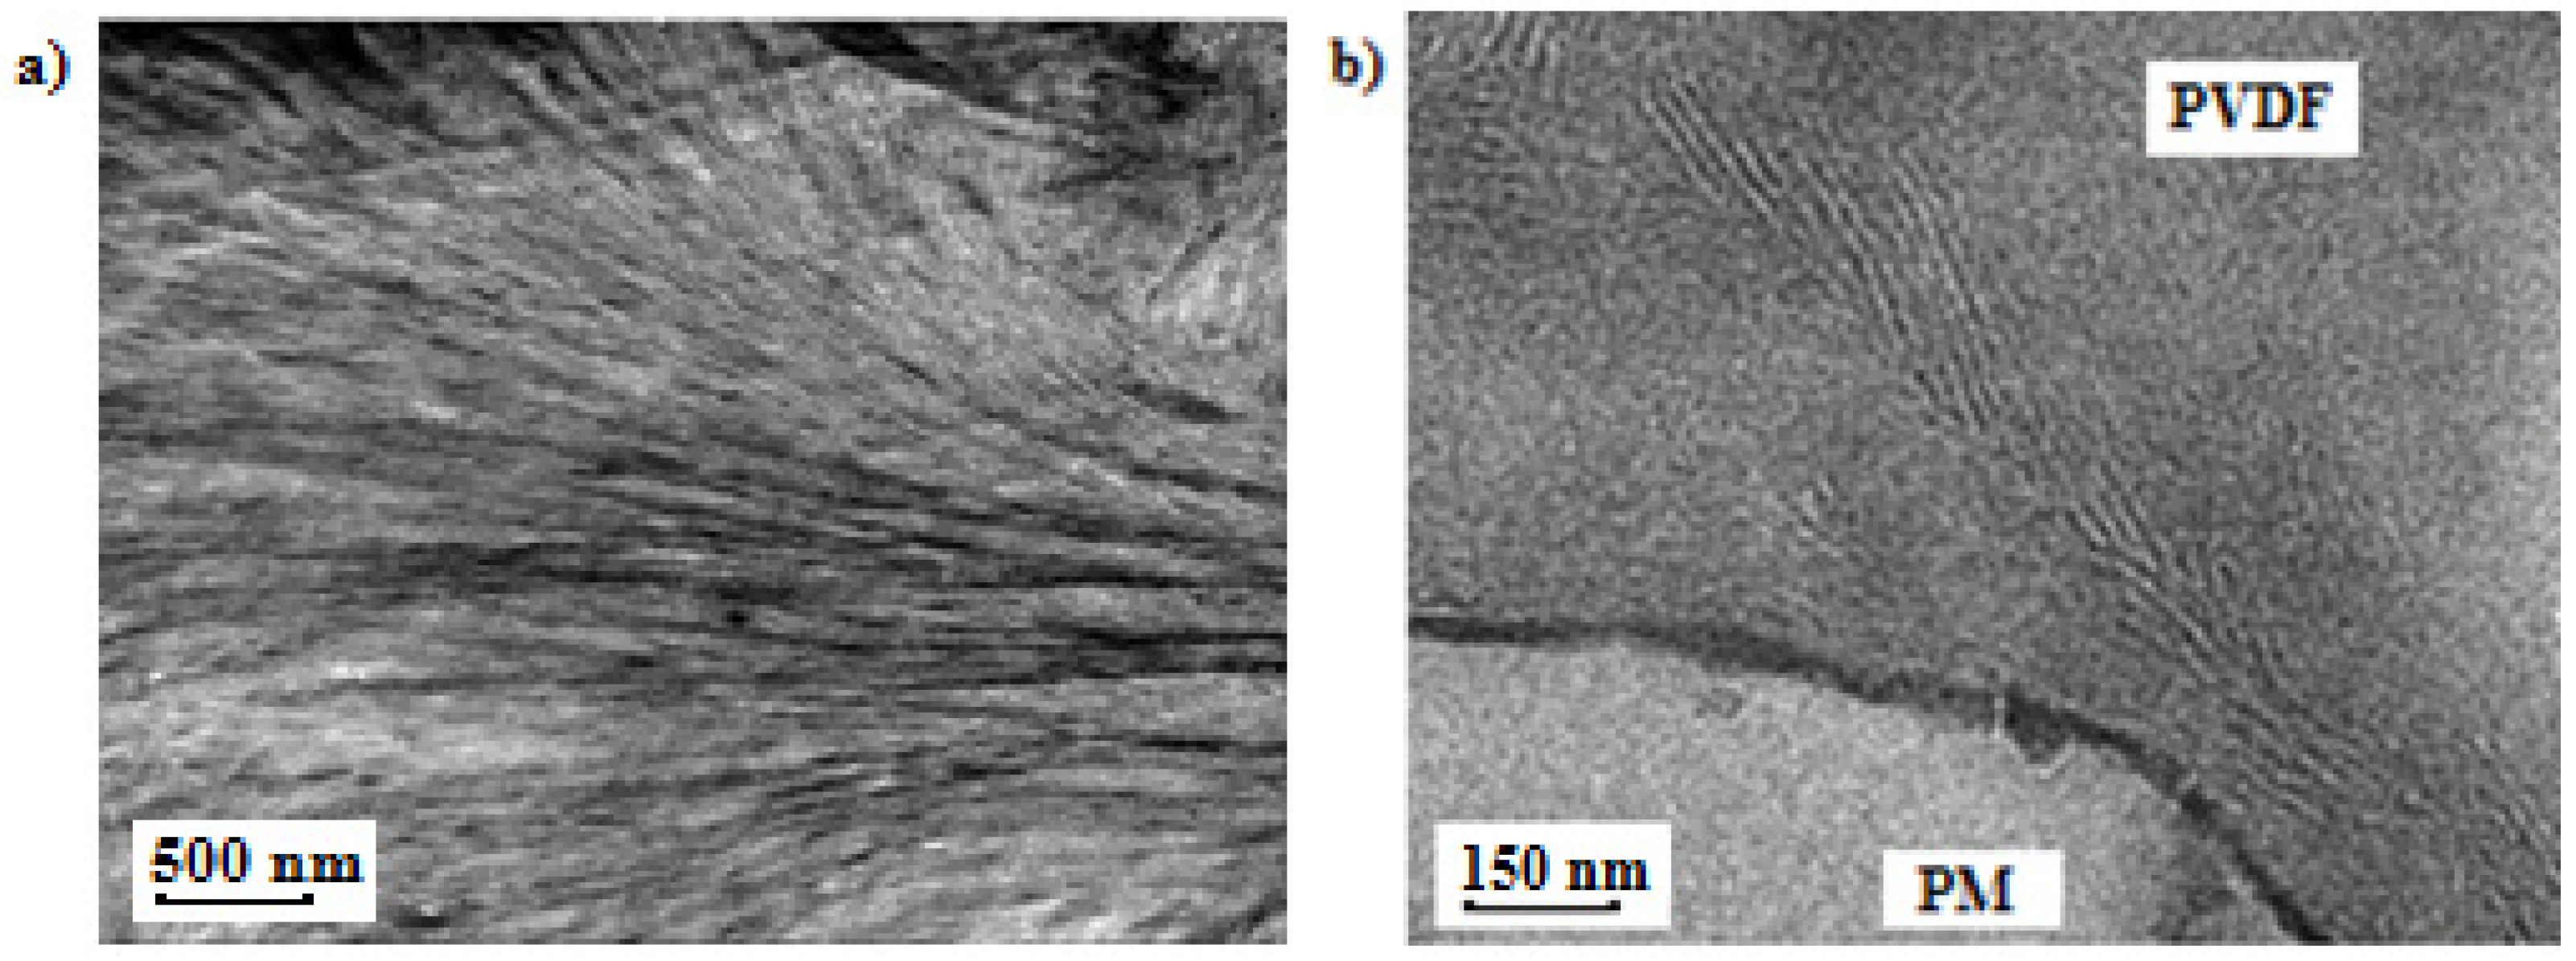
2.2.5. Transmission Electron Microscopy (TEM)
2.2.6. Broadband Dielectric Spectroscopy (BDS)
3. Results and Discussion
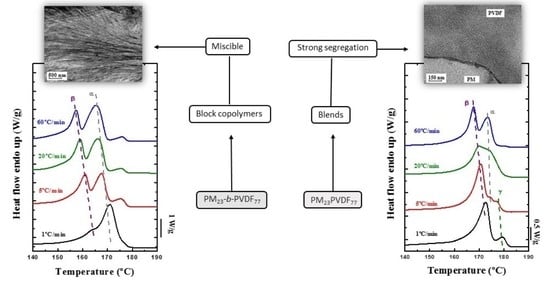
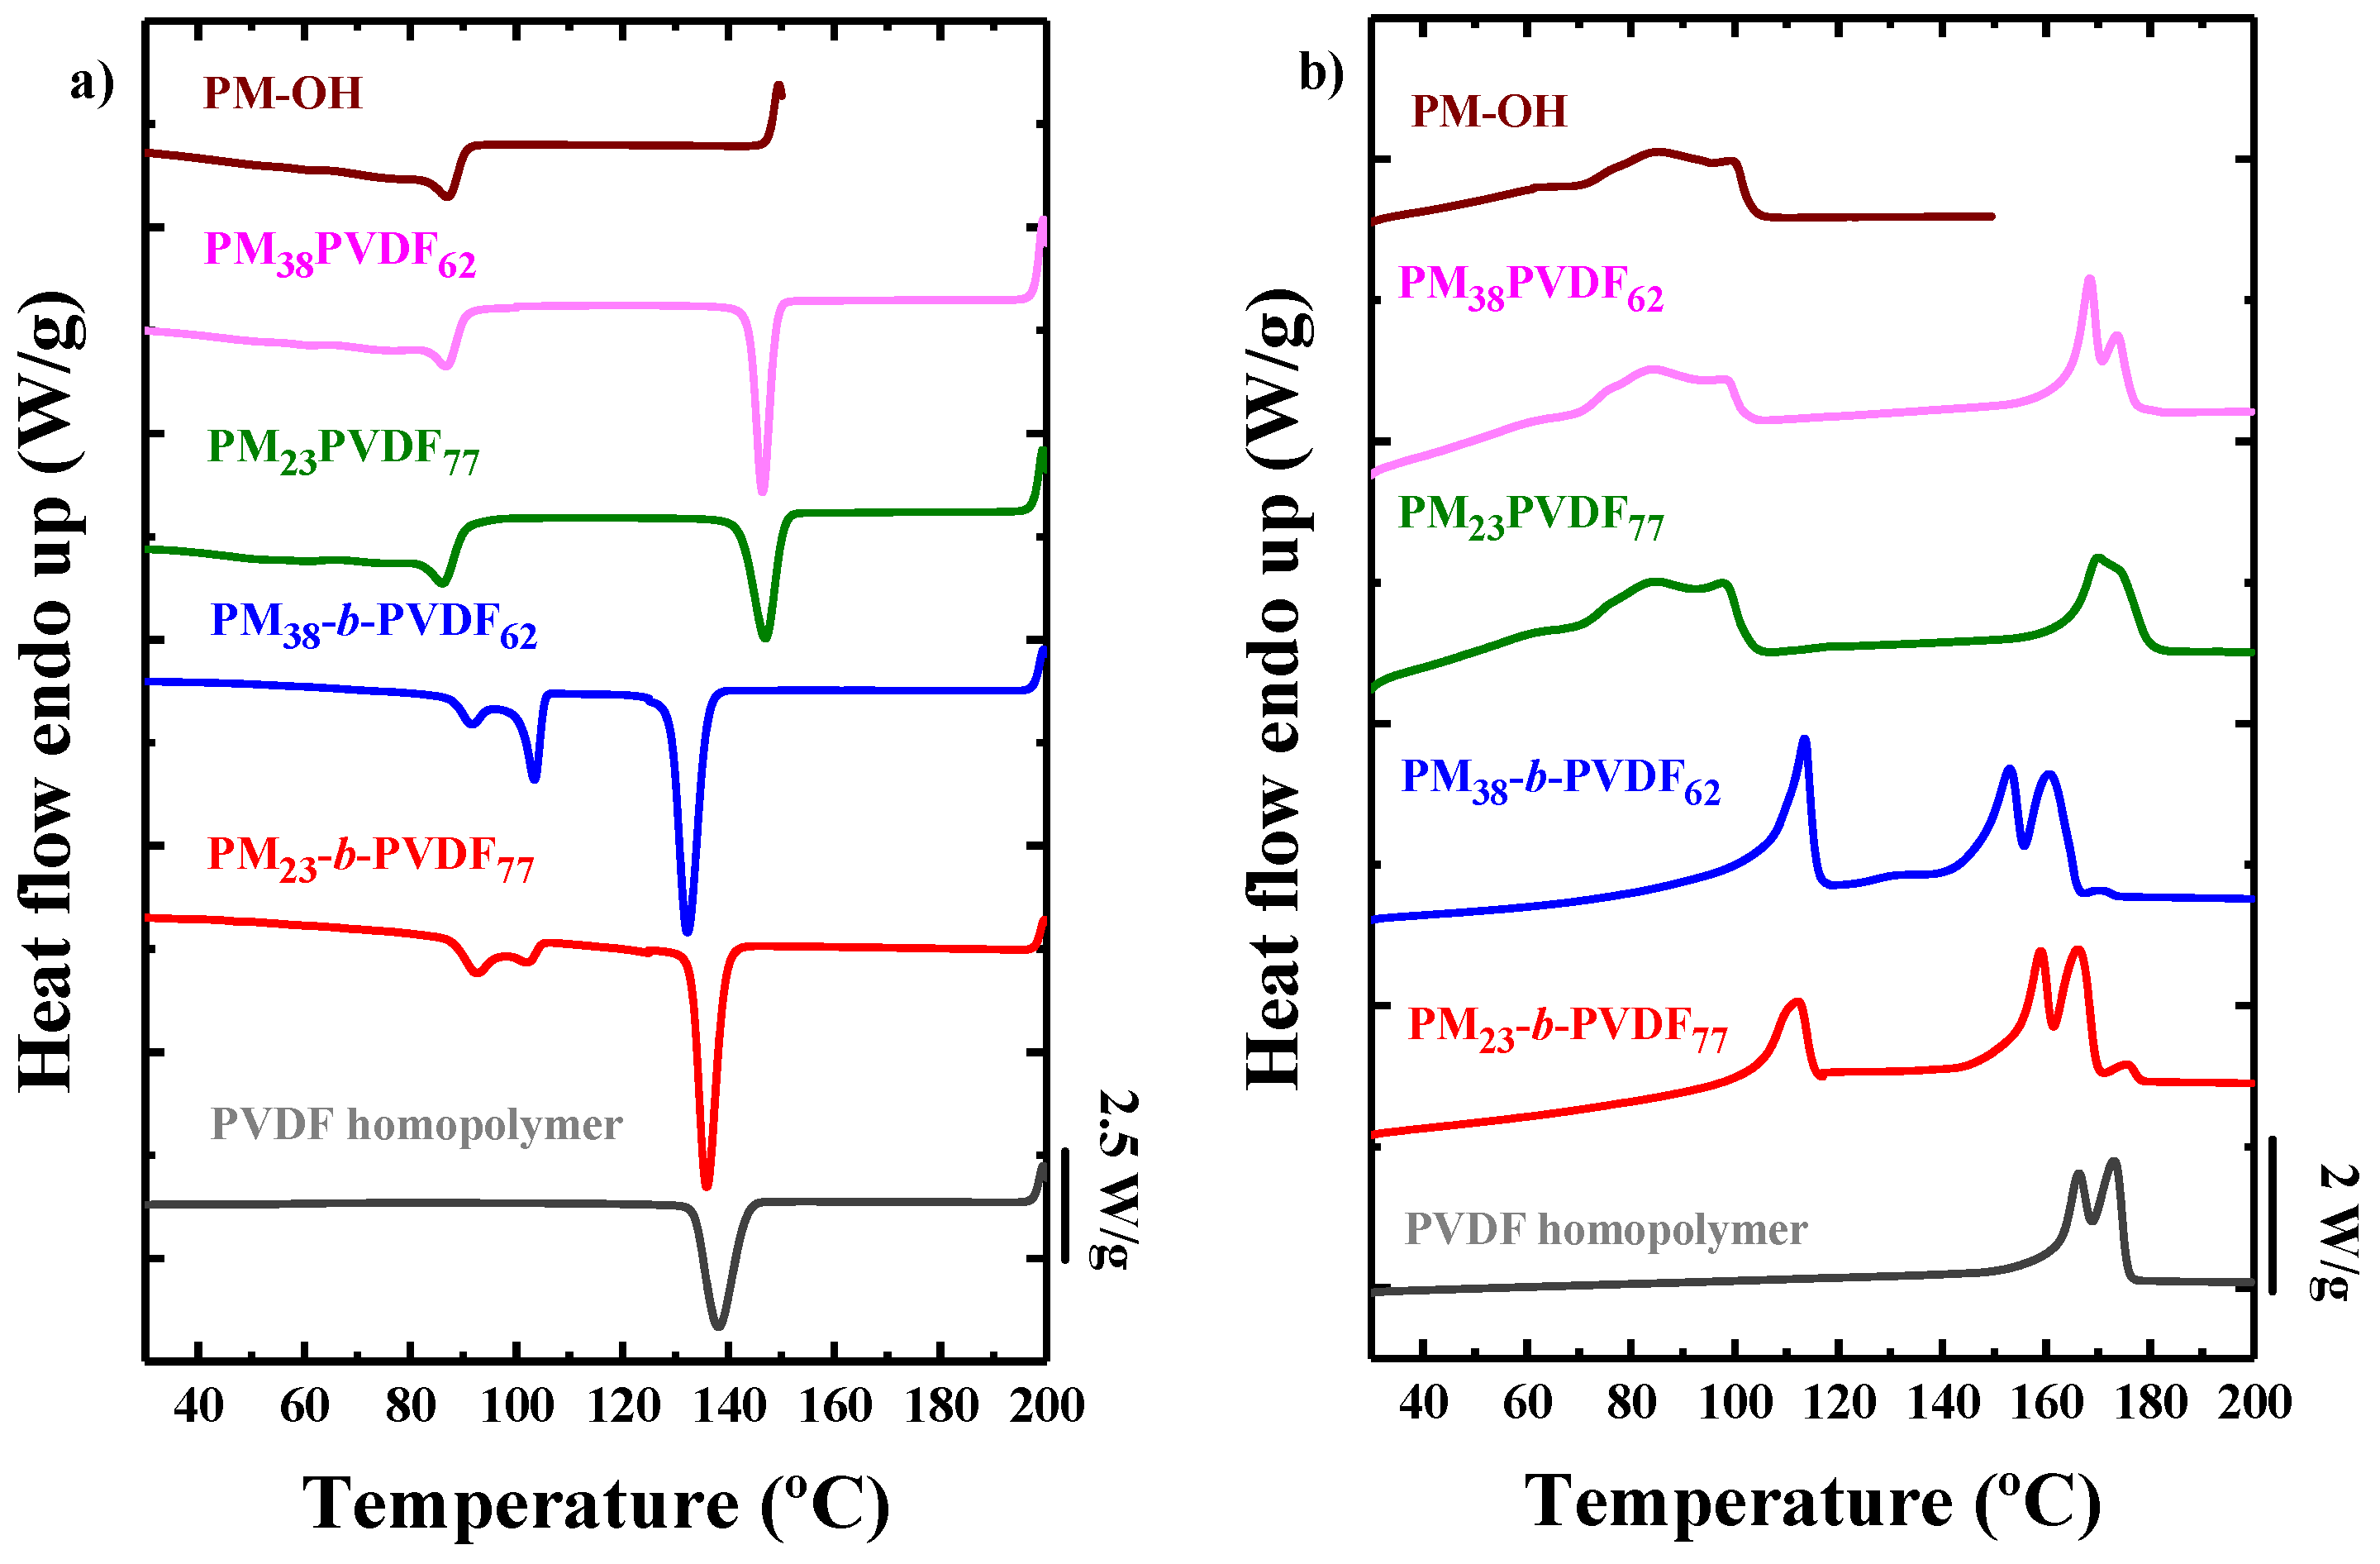
3.1. Miscibility between PM and PVDF
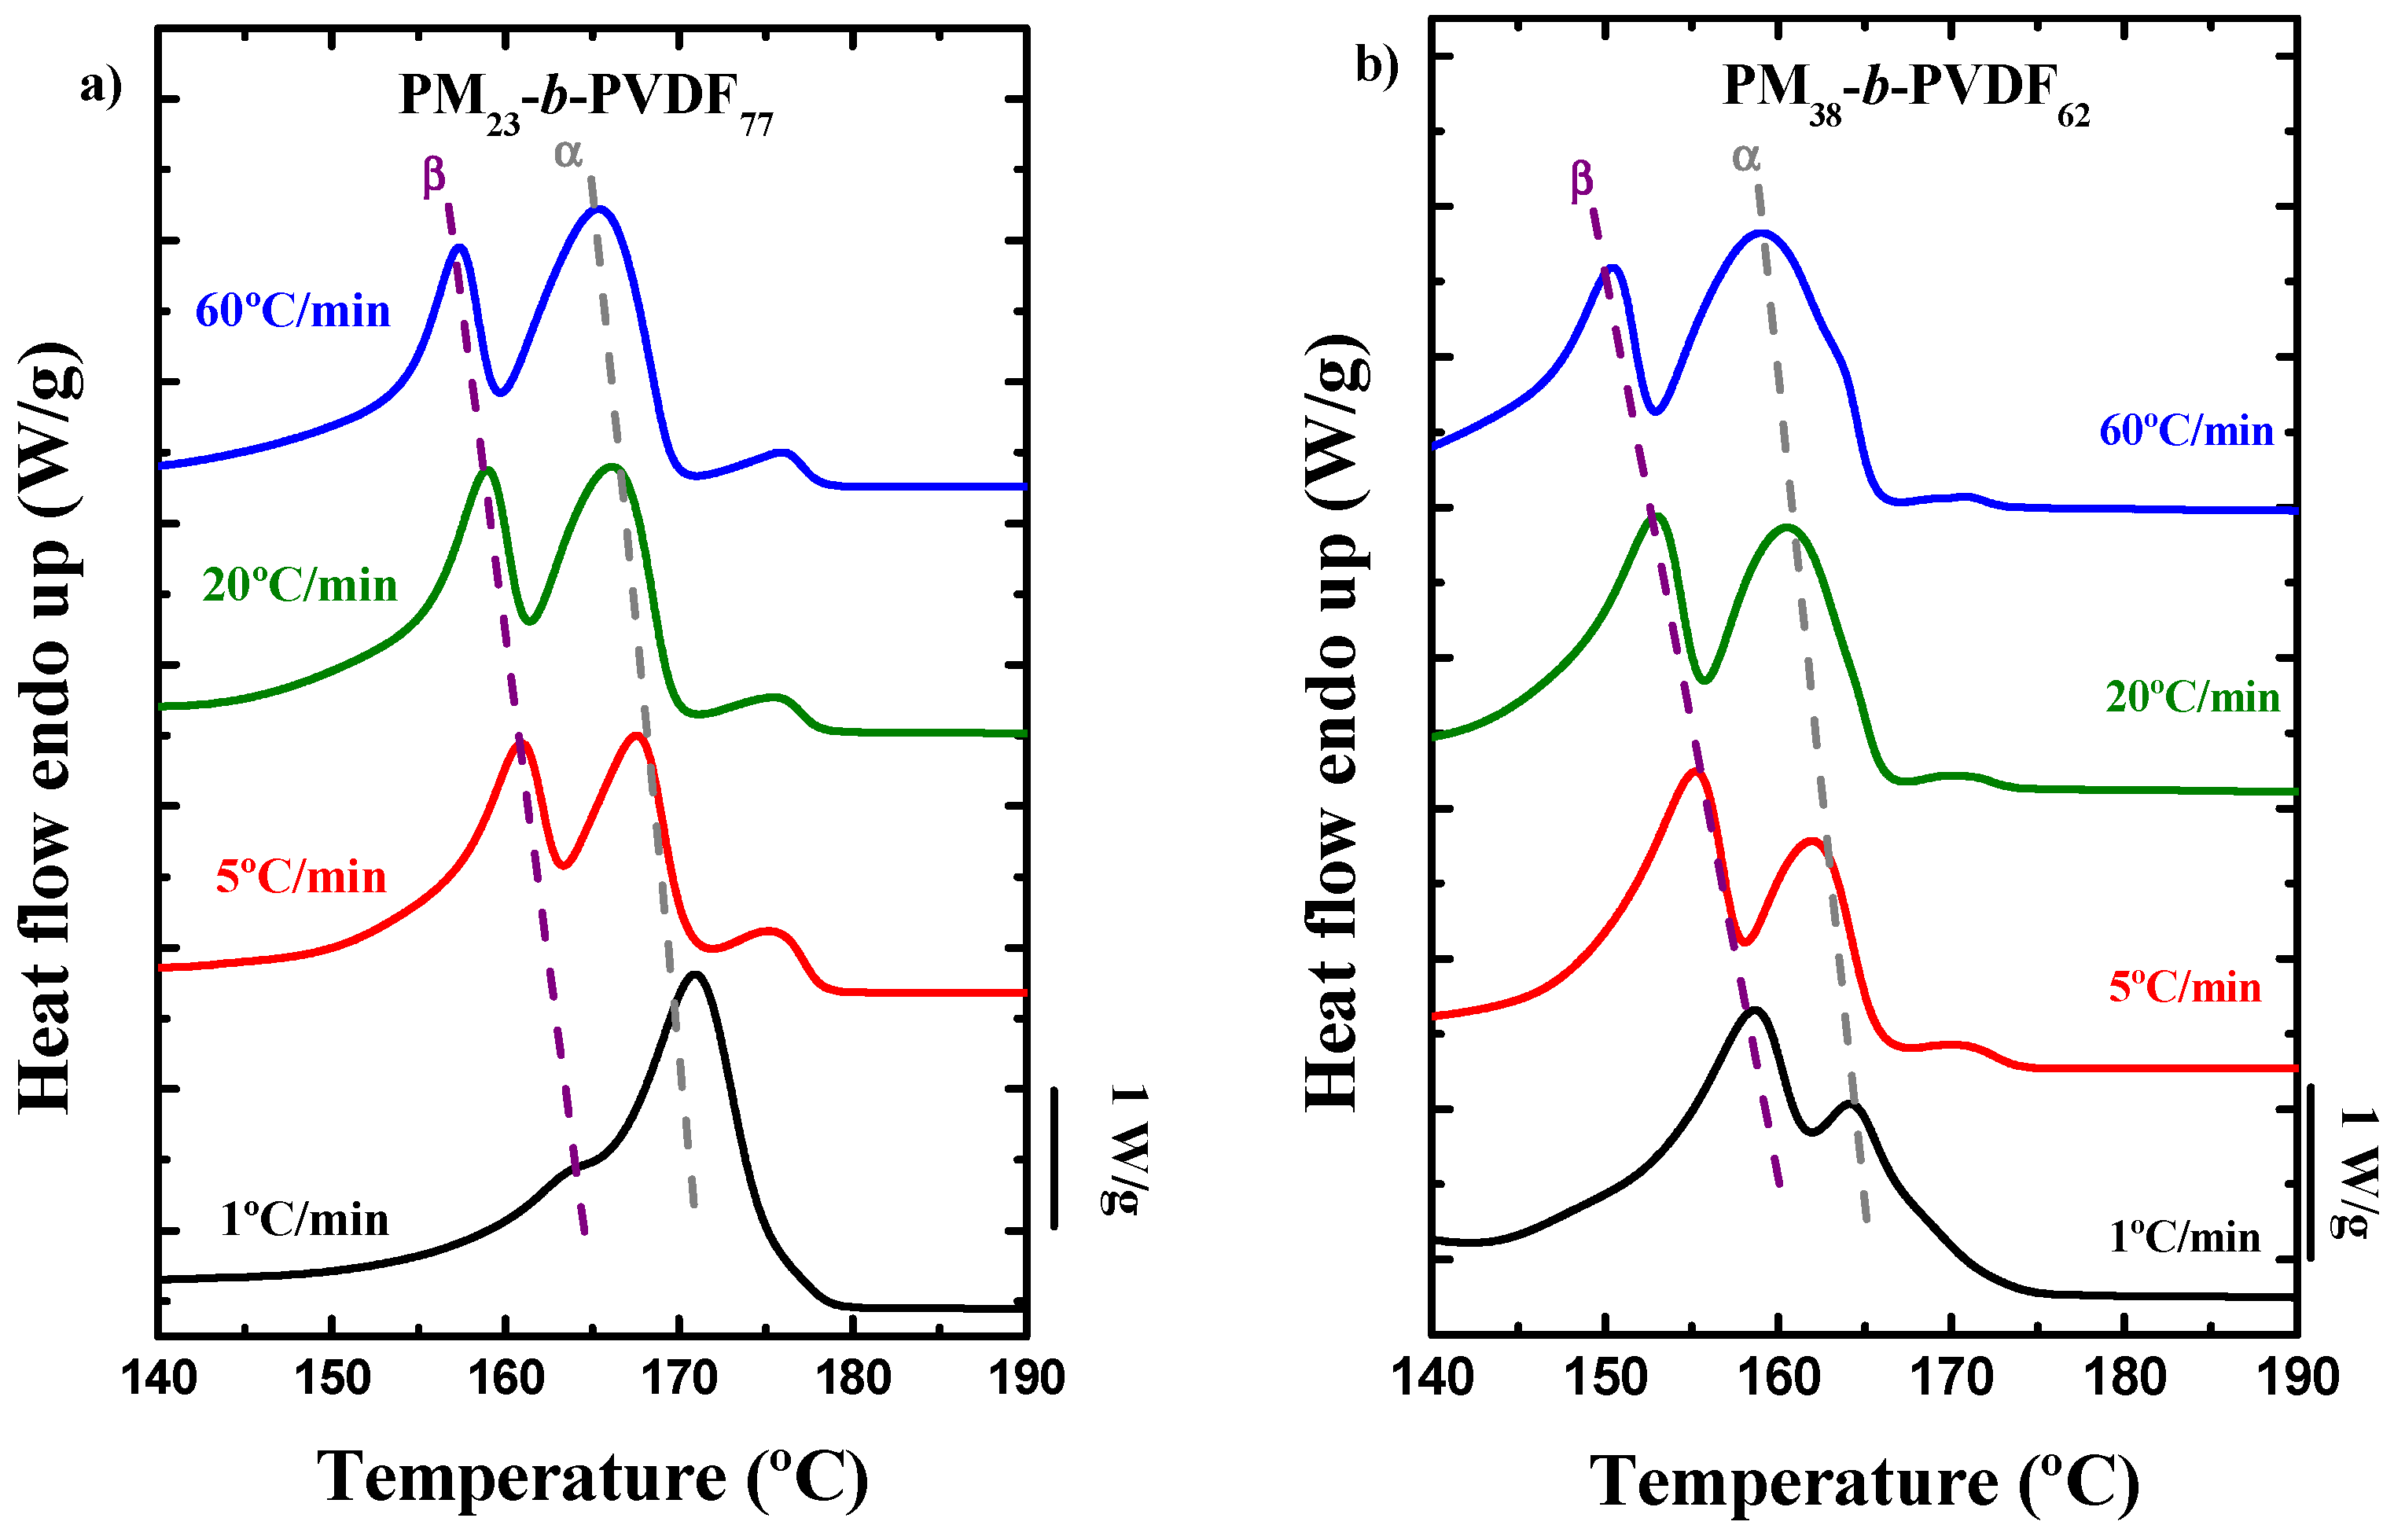
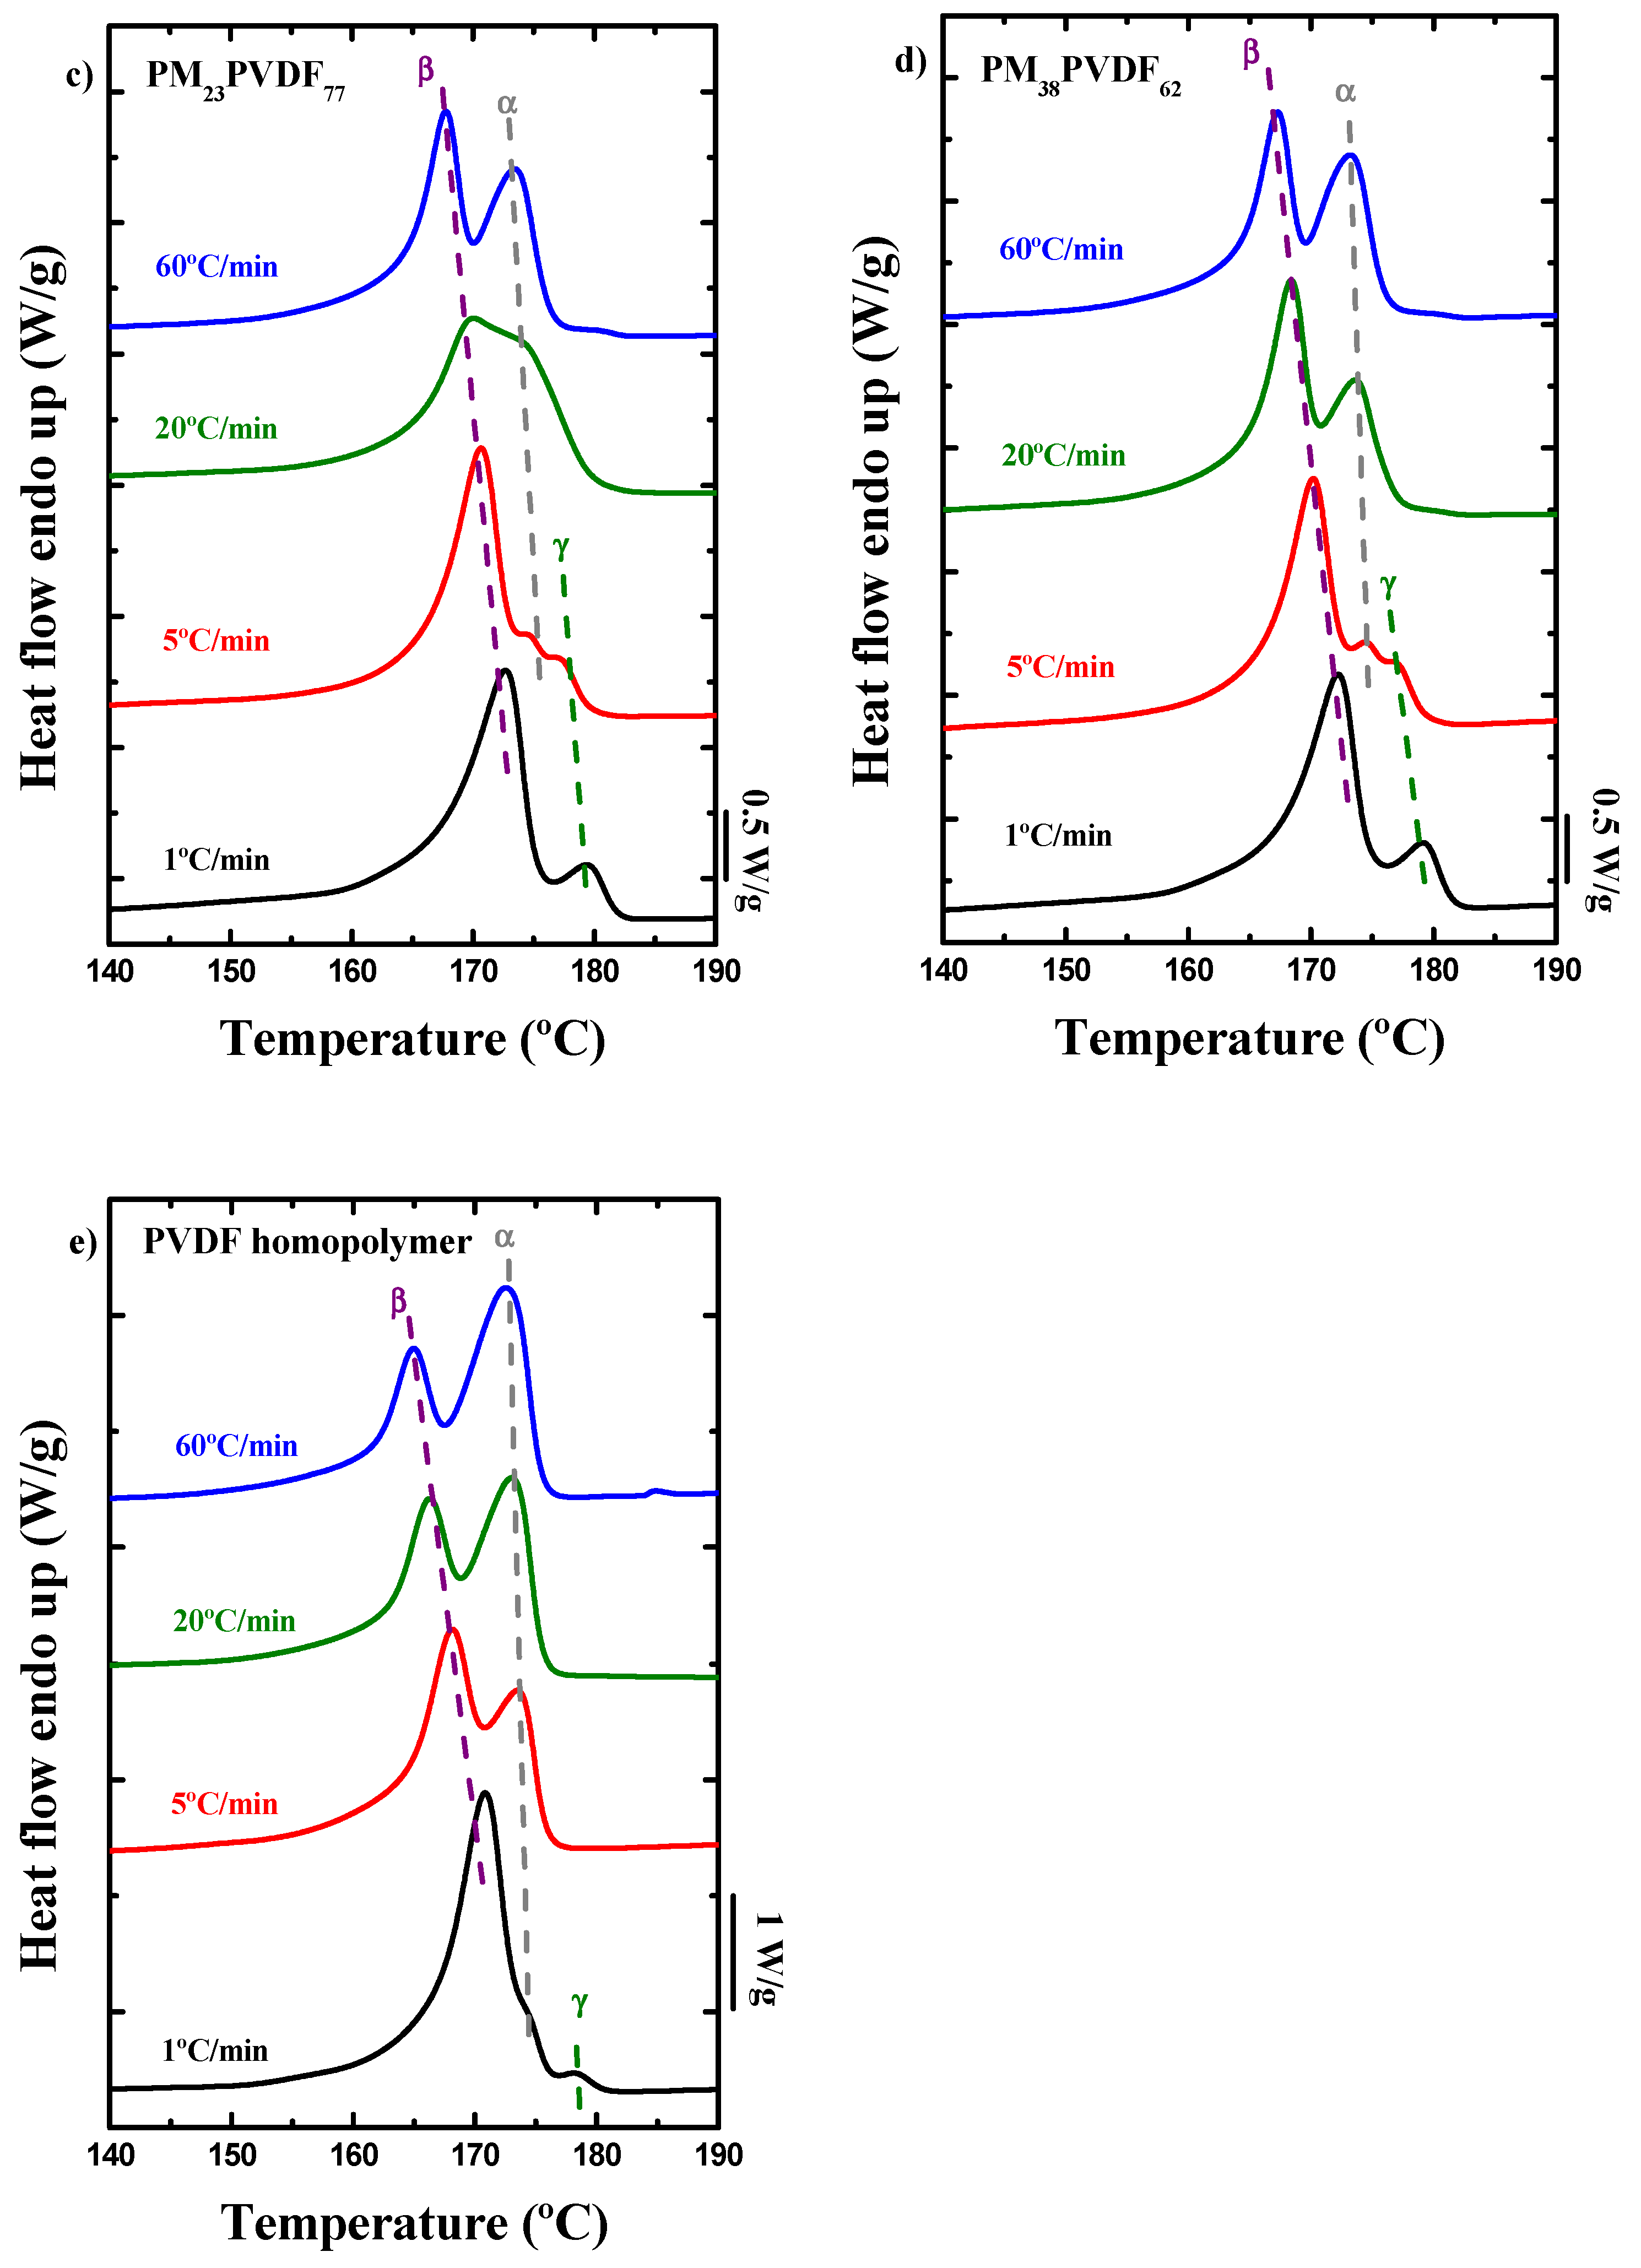
3.2. How the Cooling Rate Affects the Crystallization of the PVDF Phase in Block Copolymers and Blends
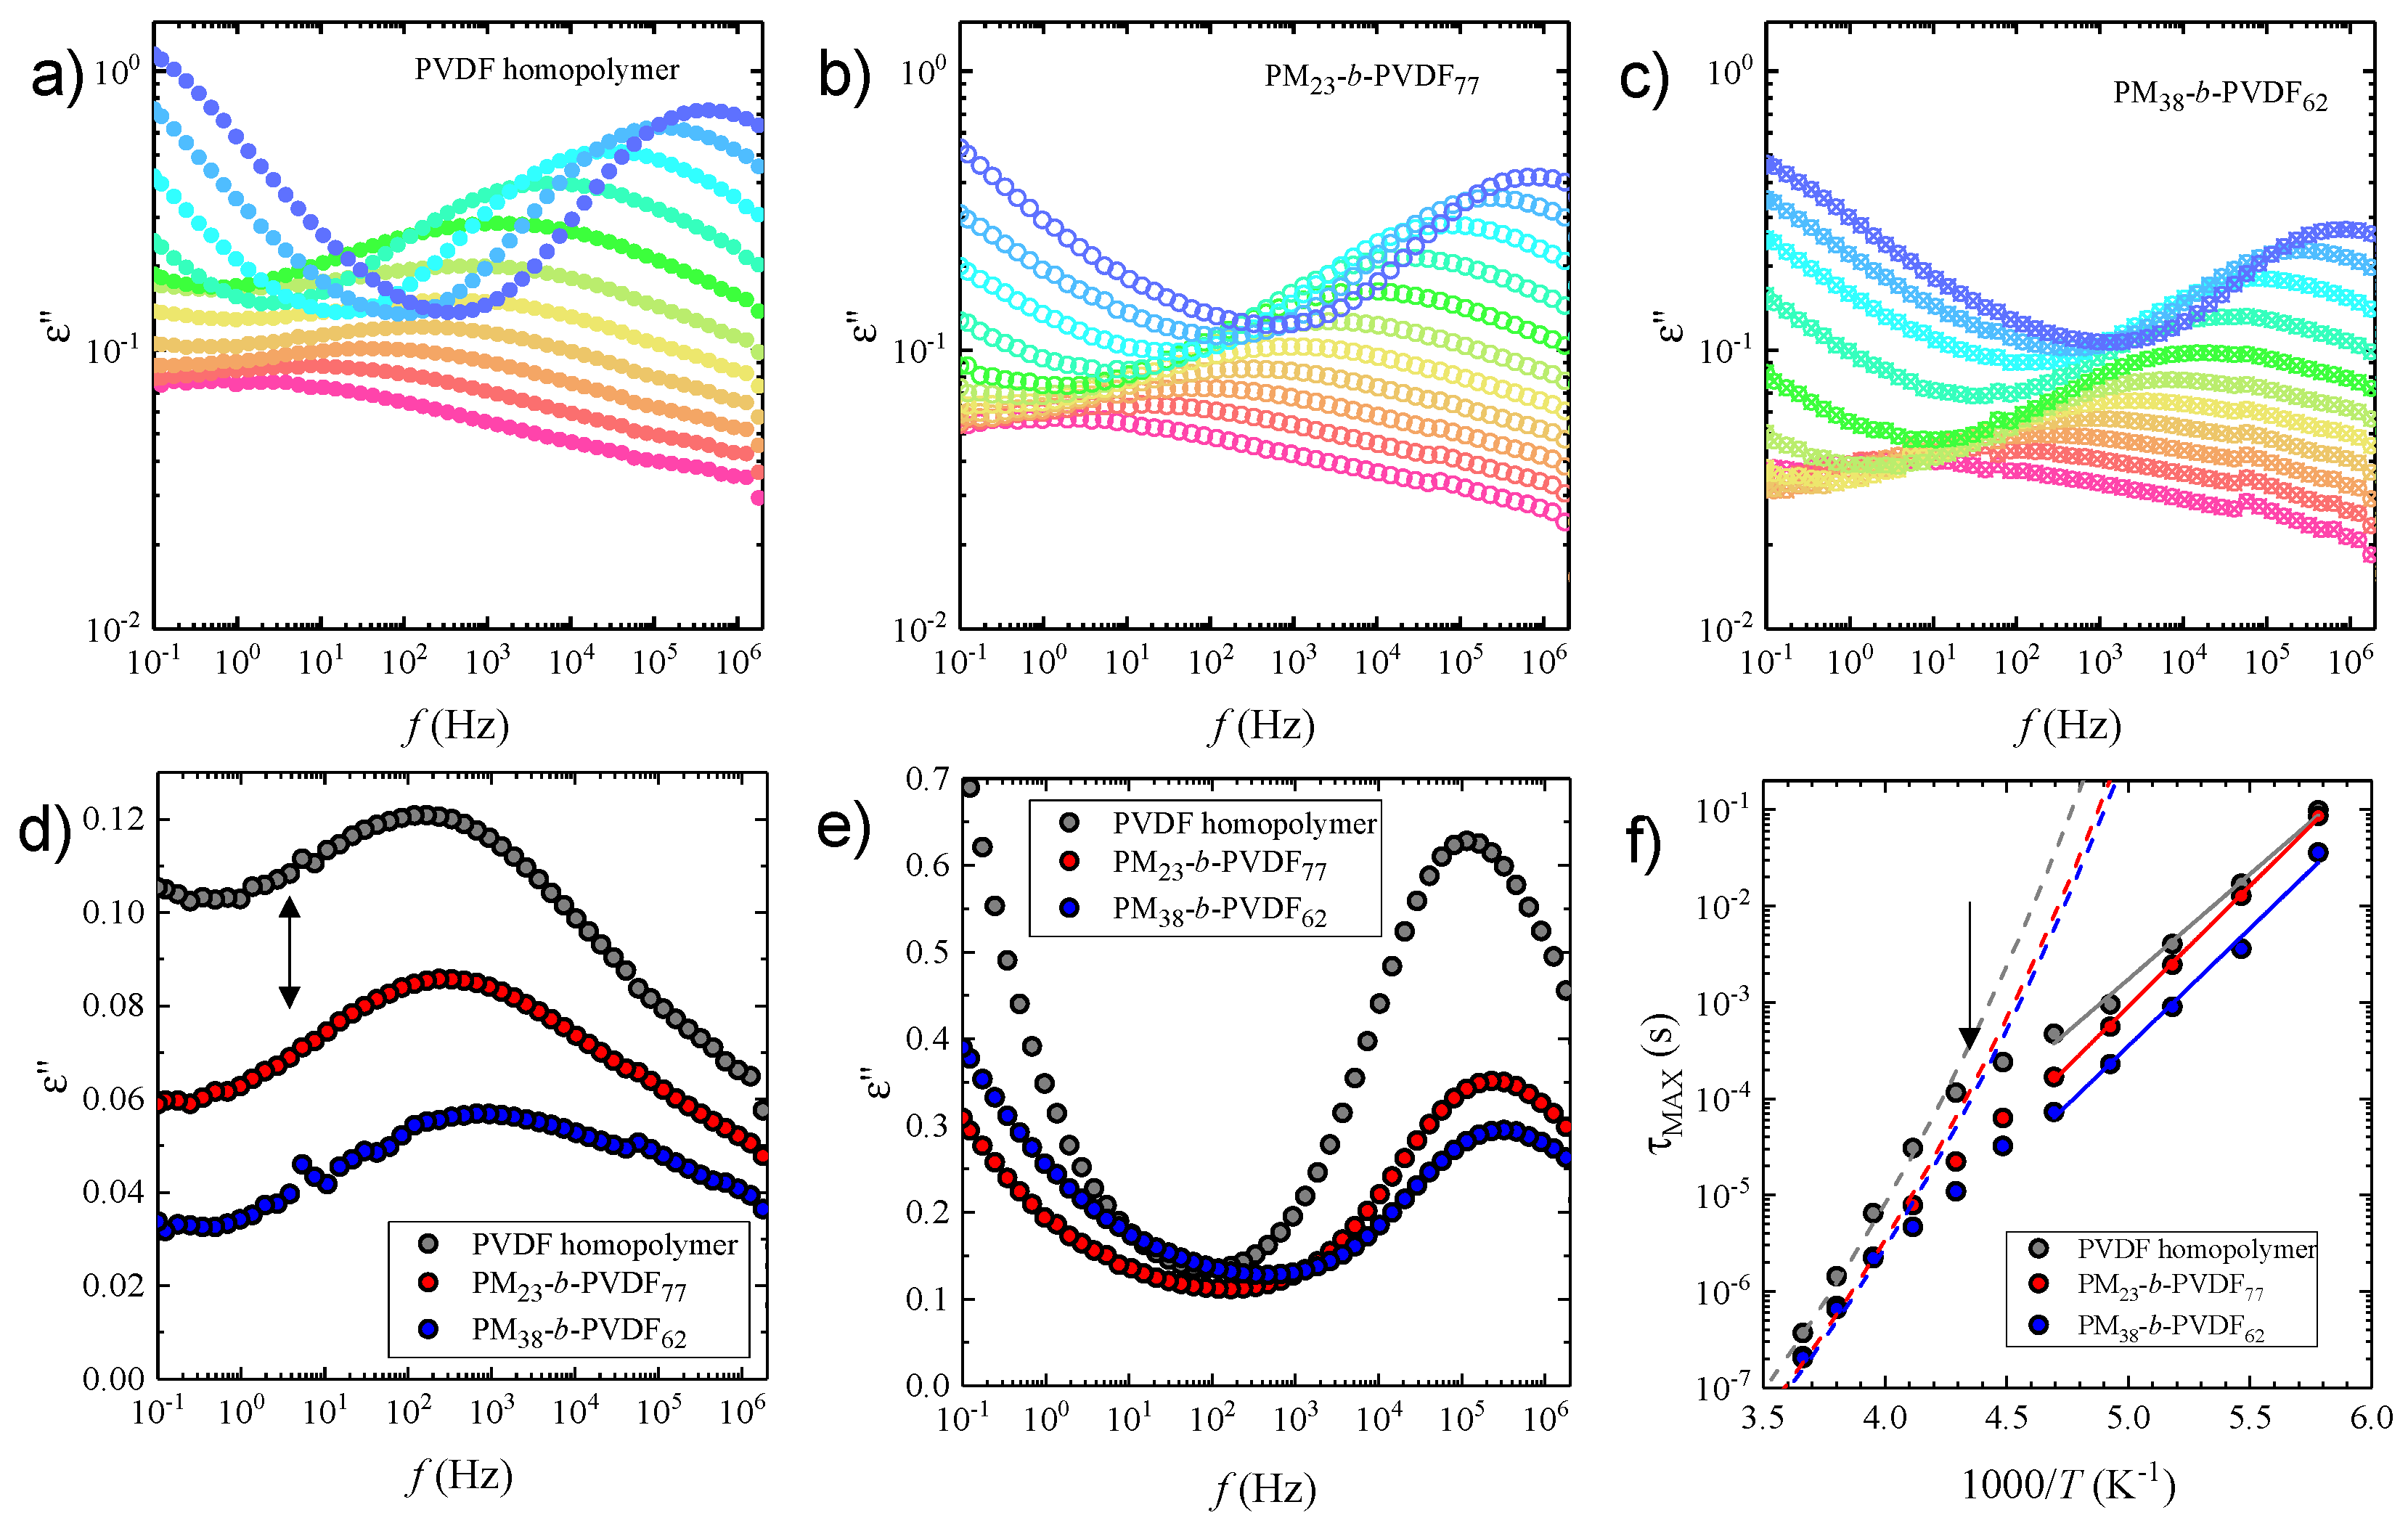
3.3. Dielectric Spectroscopy Studies in PVDF and Its Copolymers
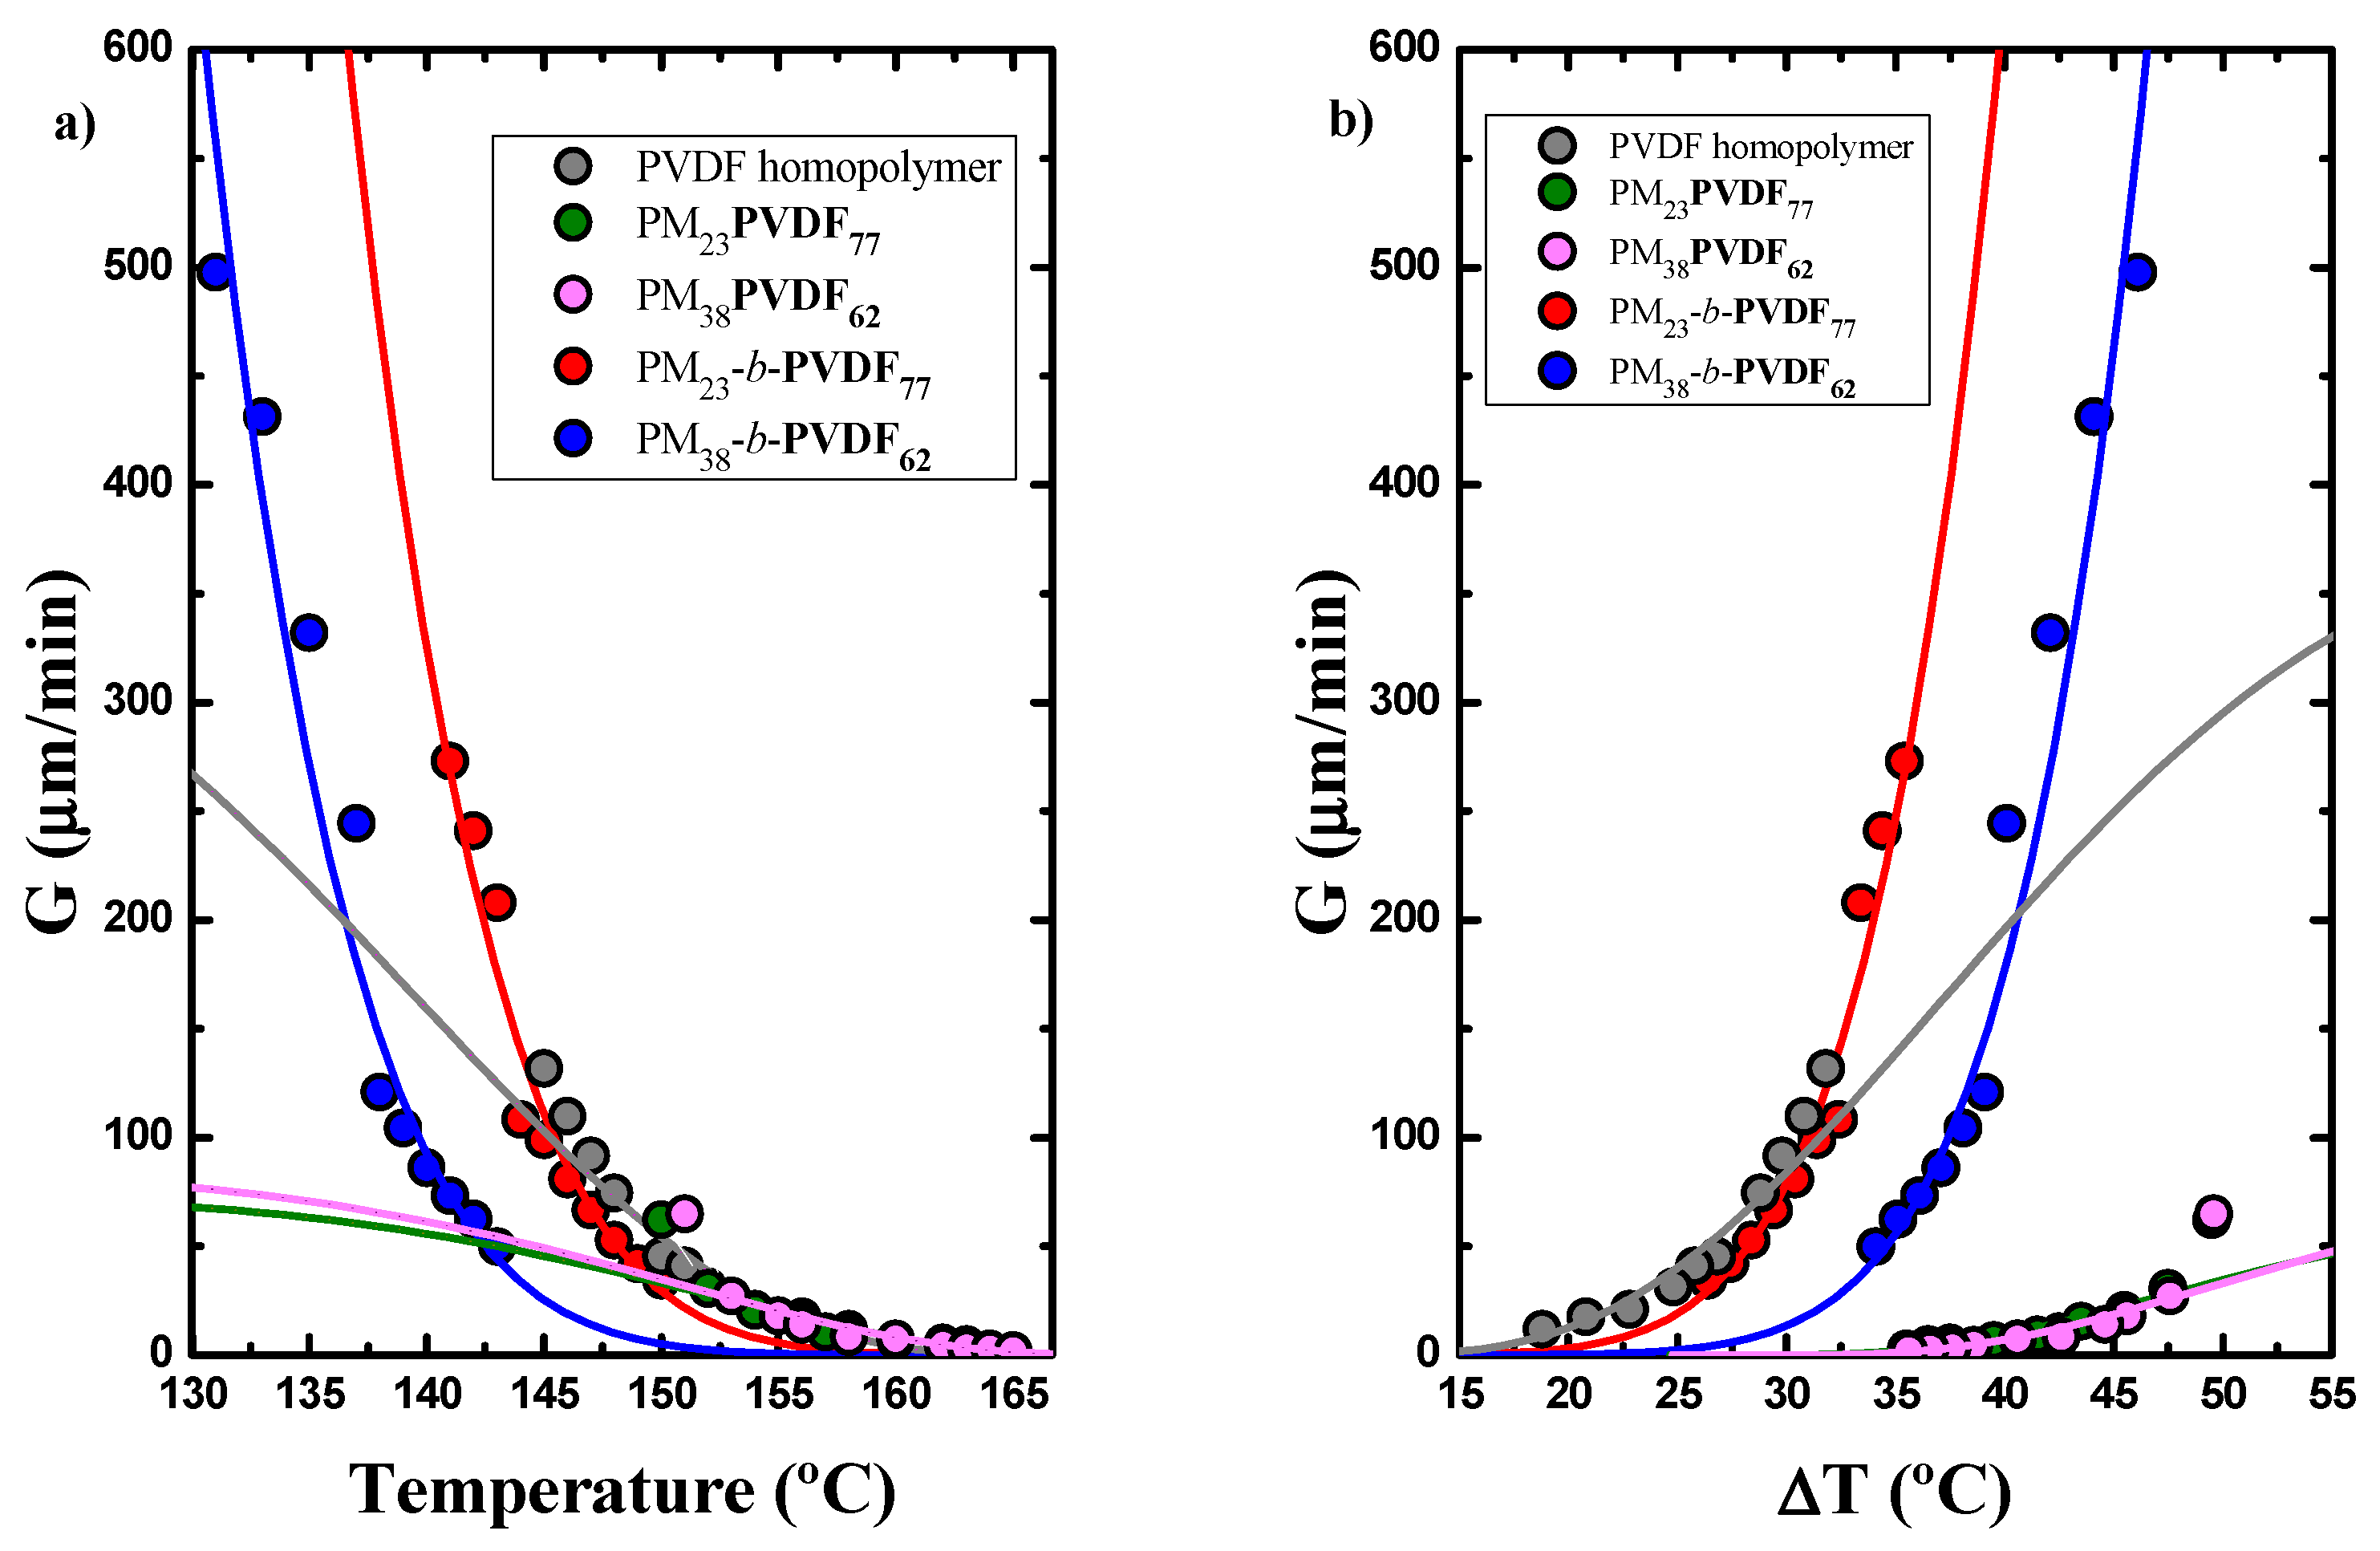
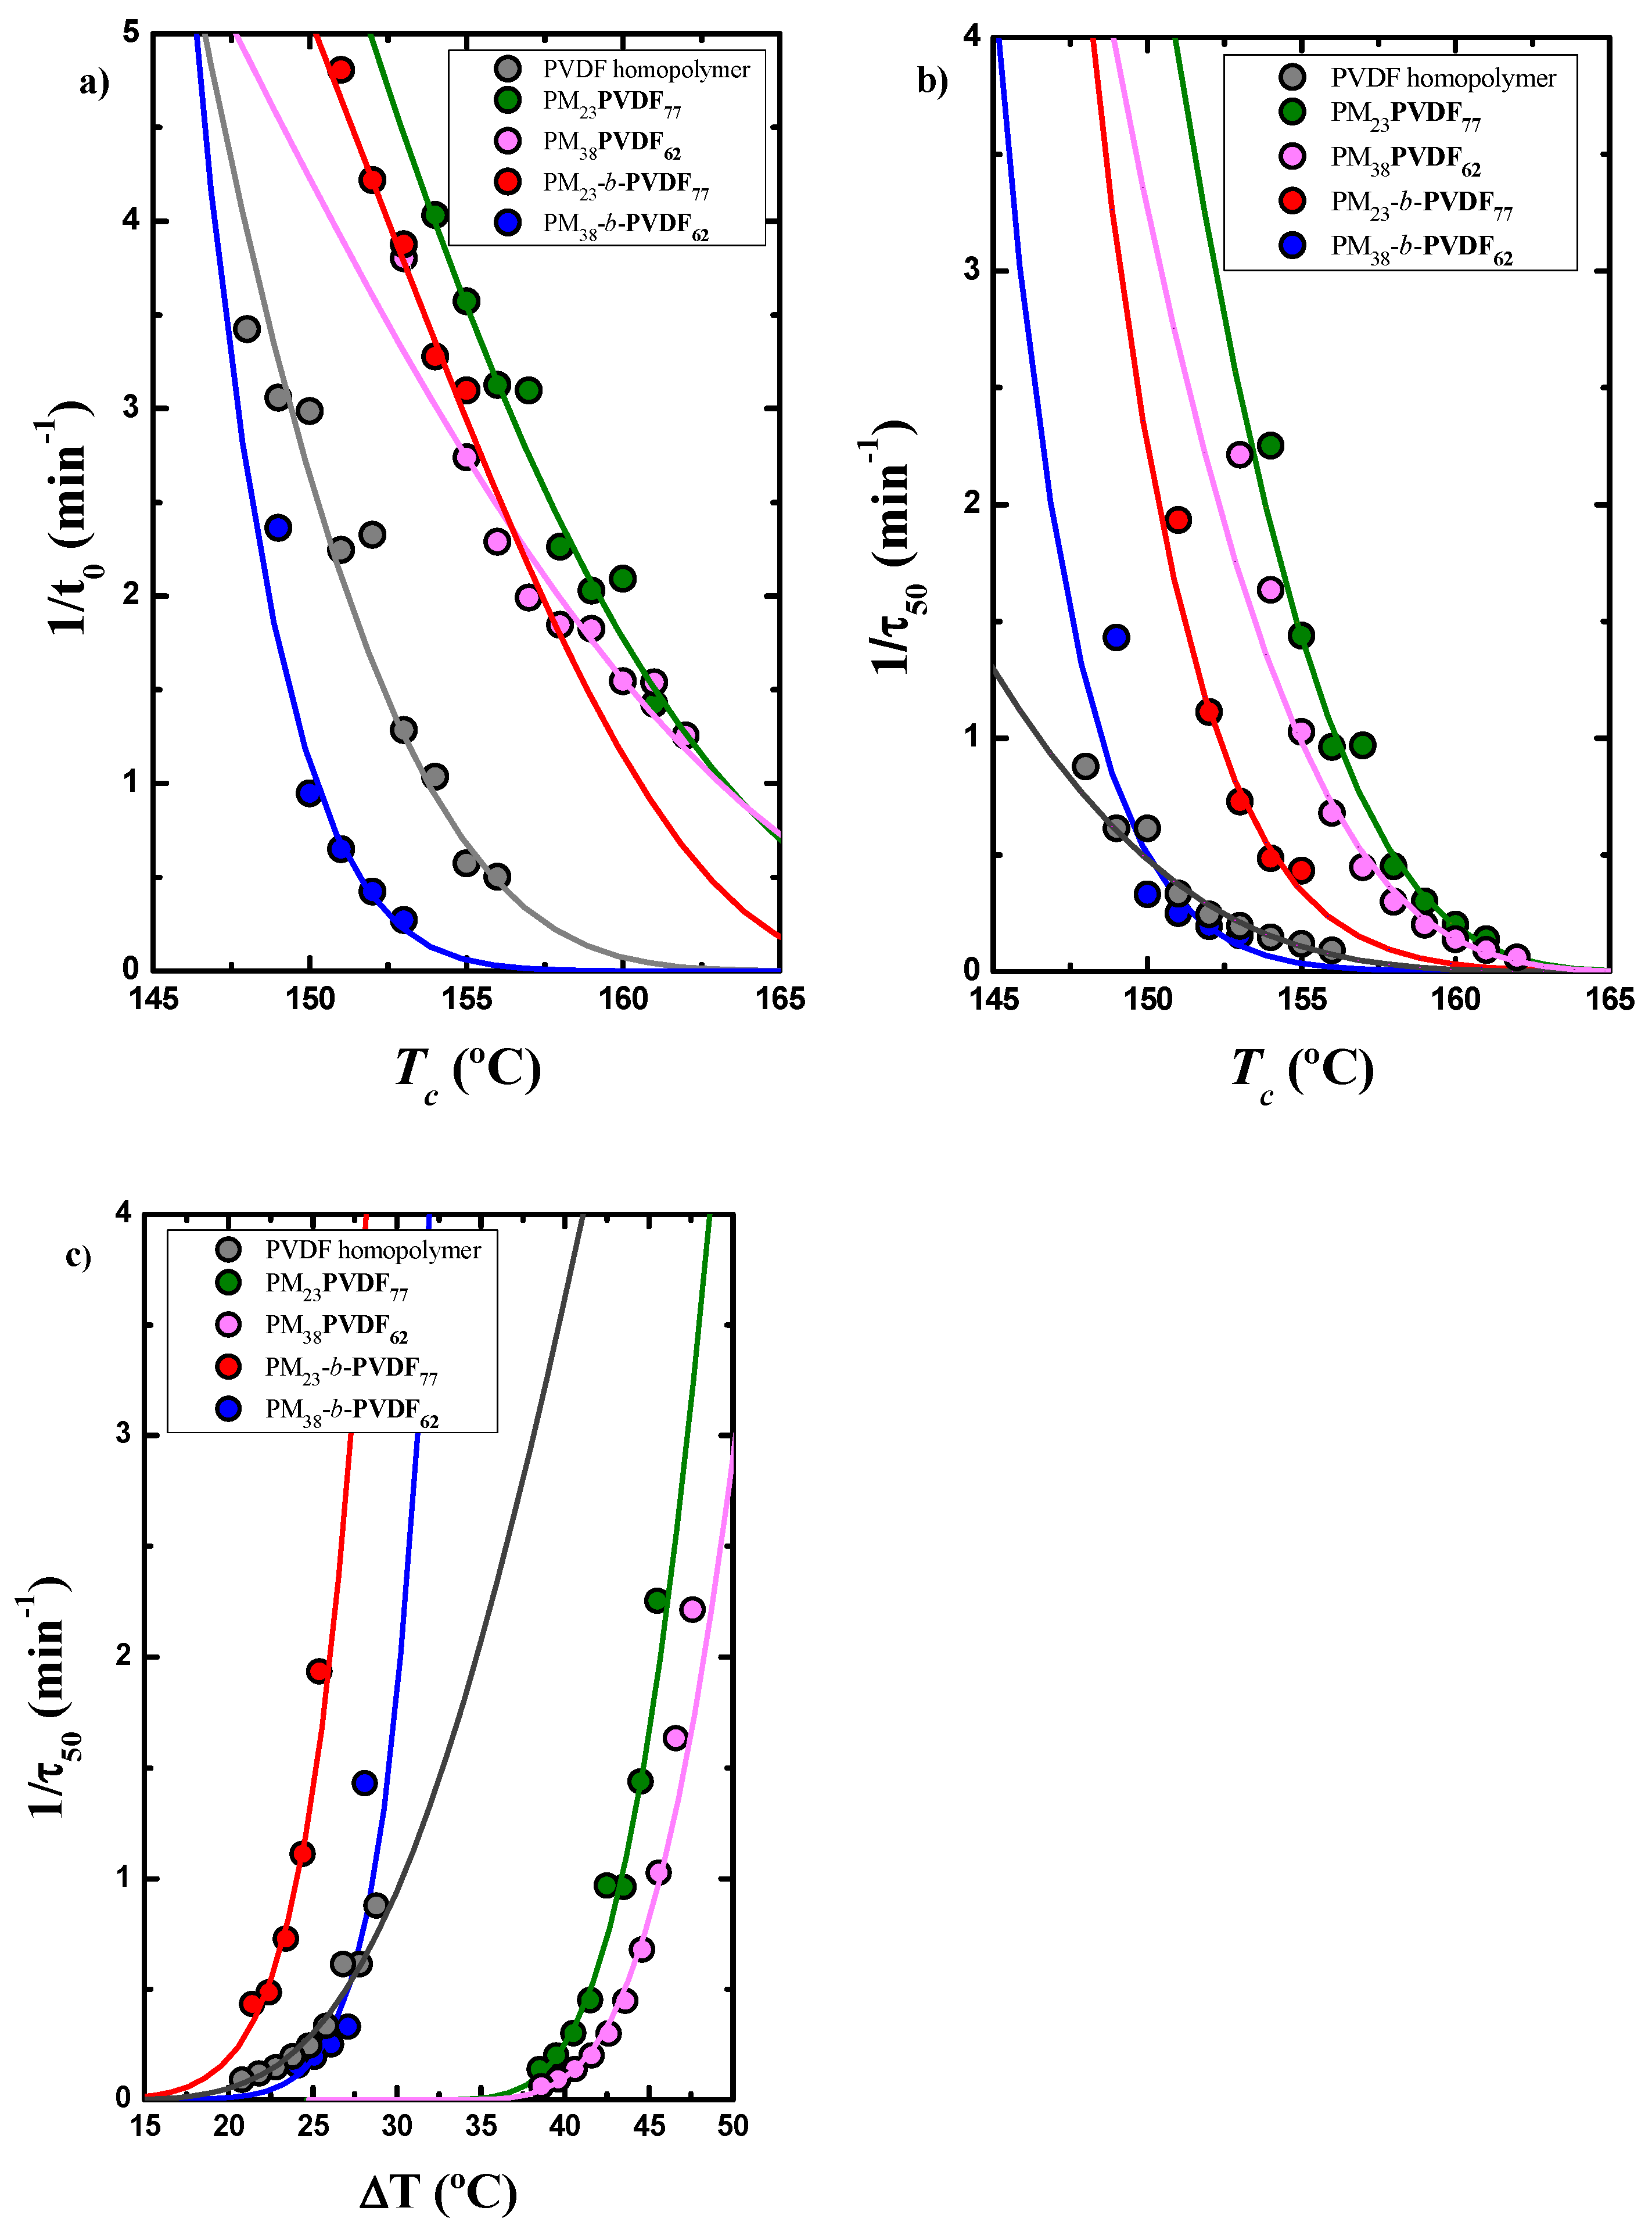
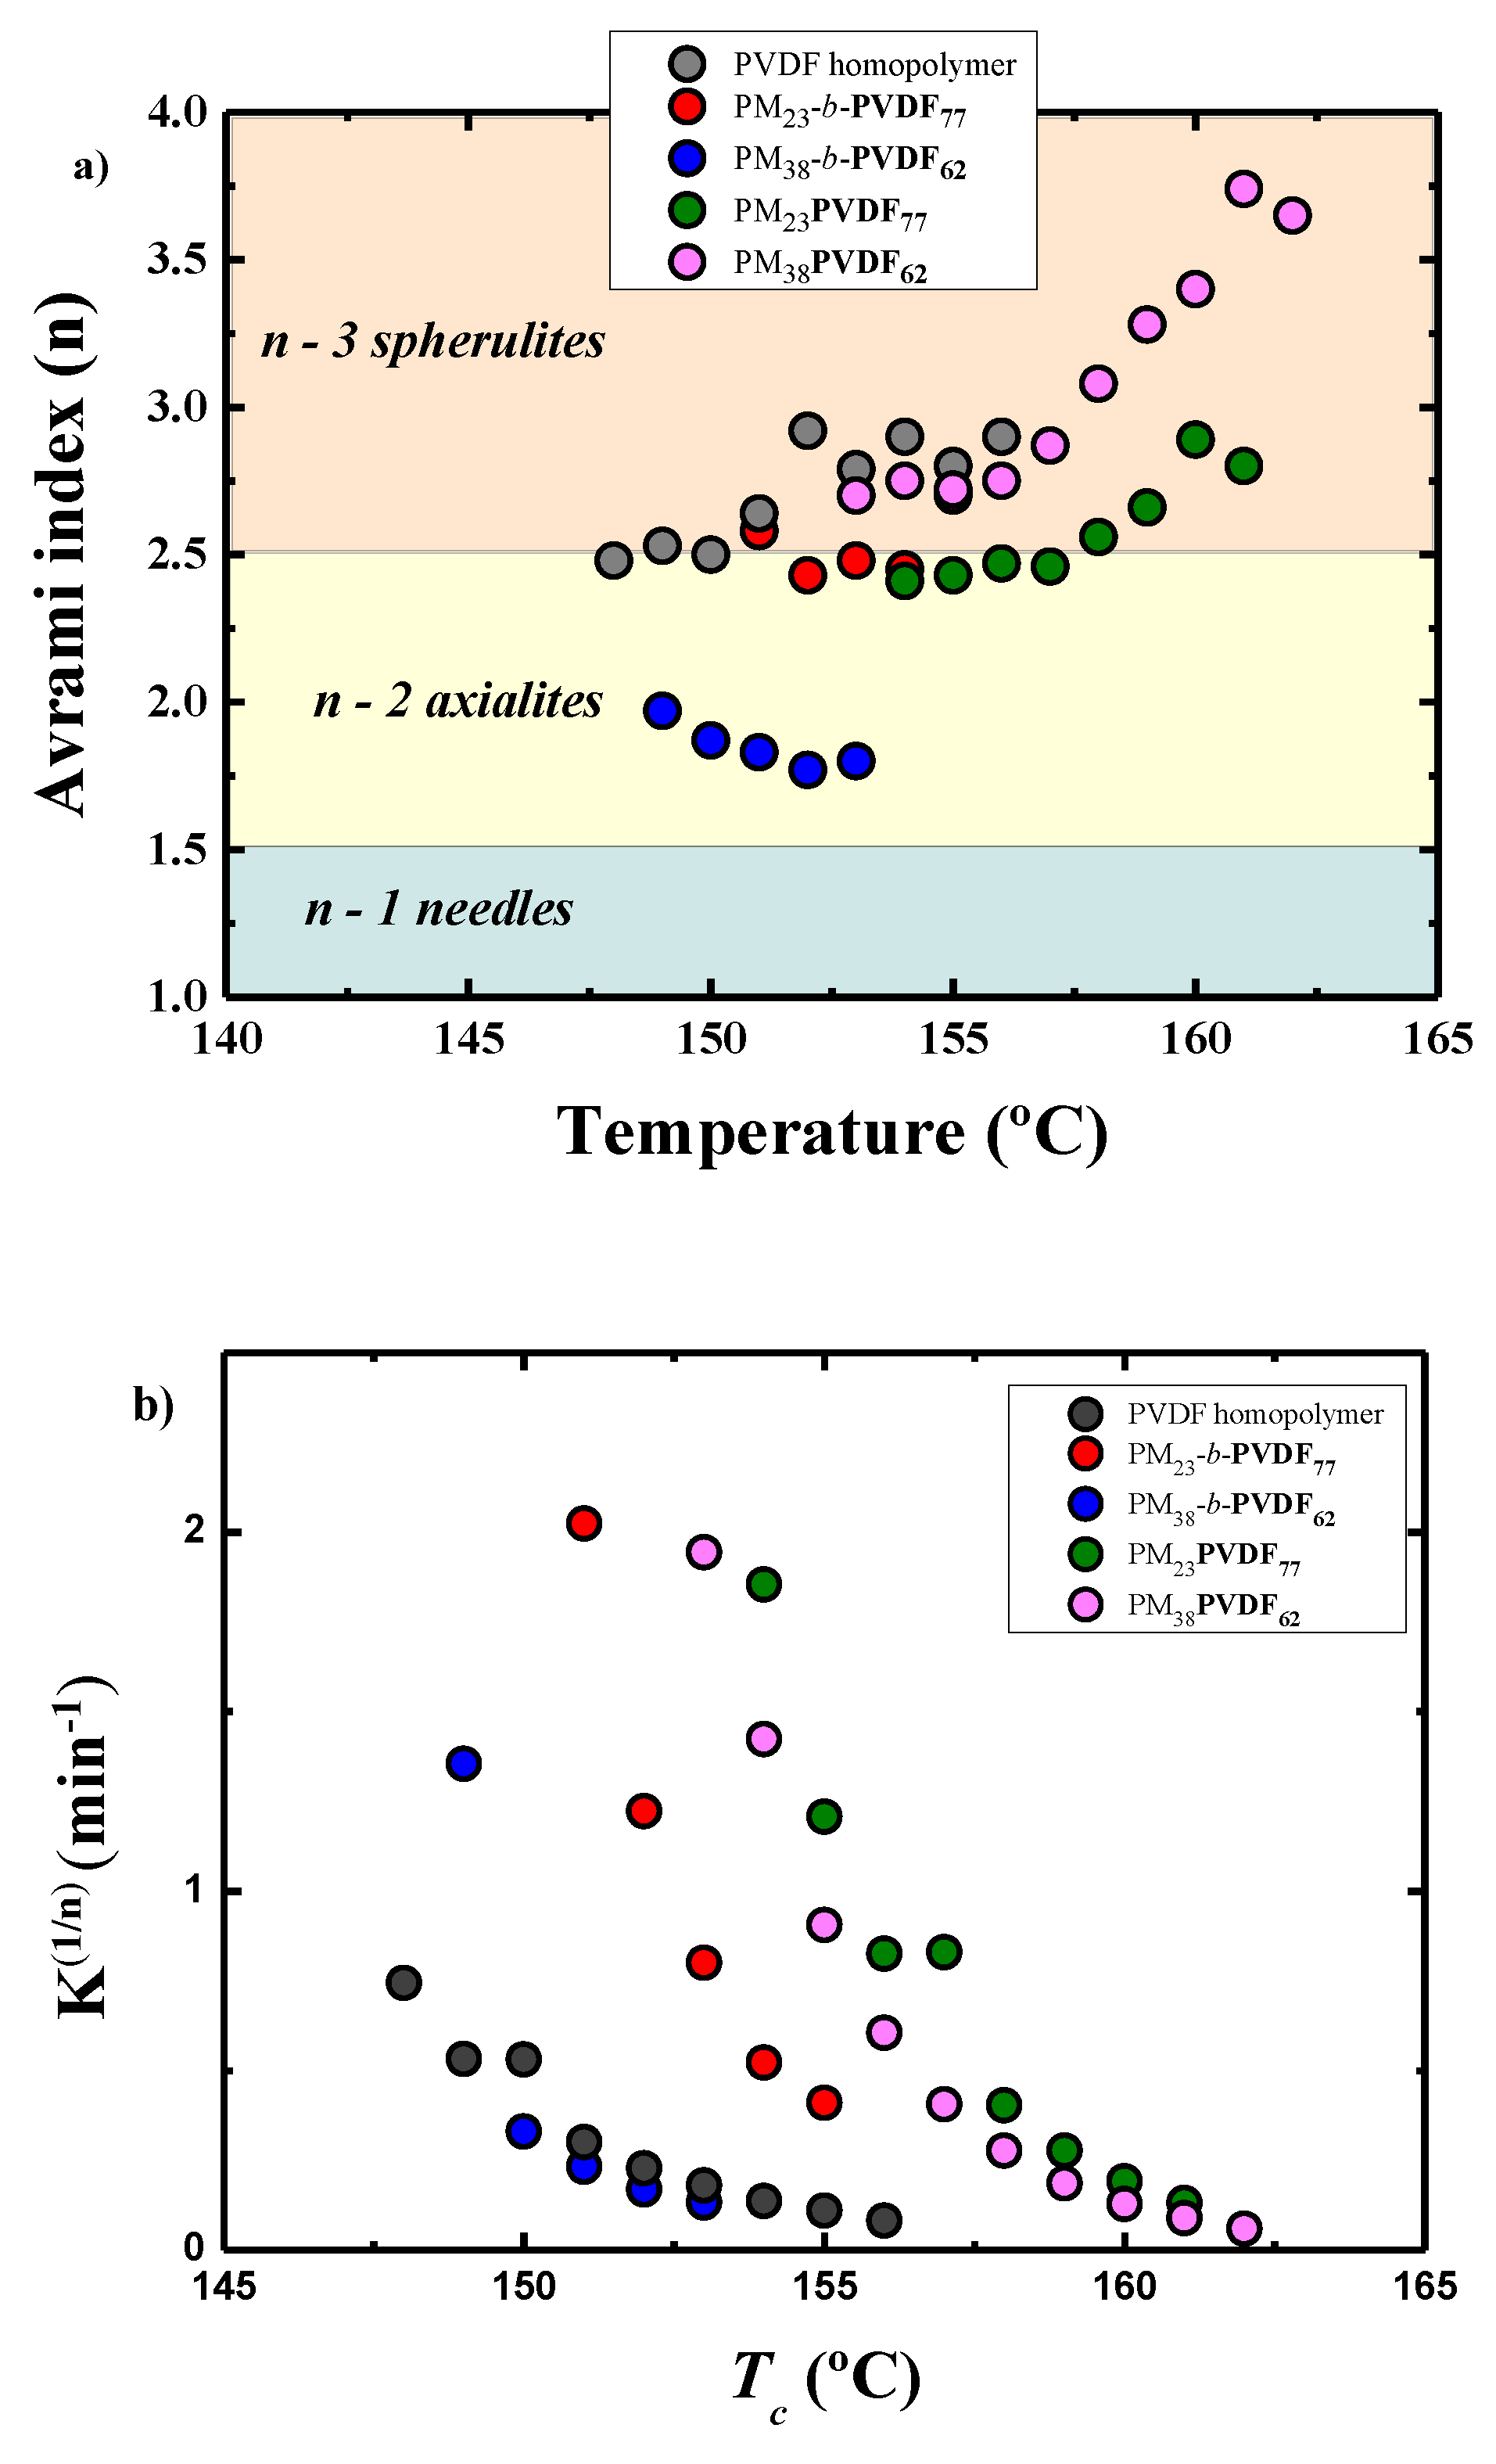
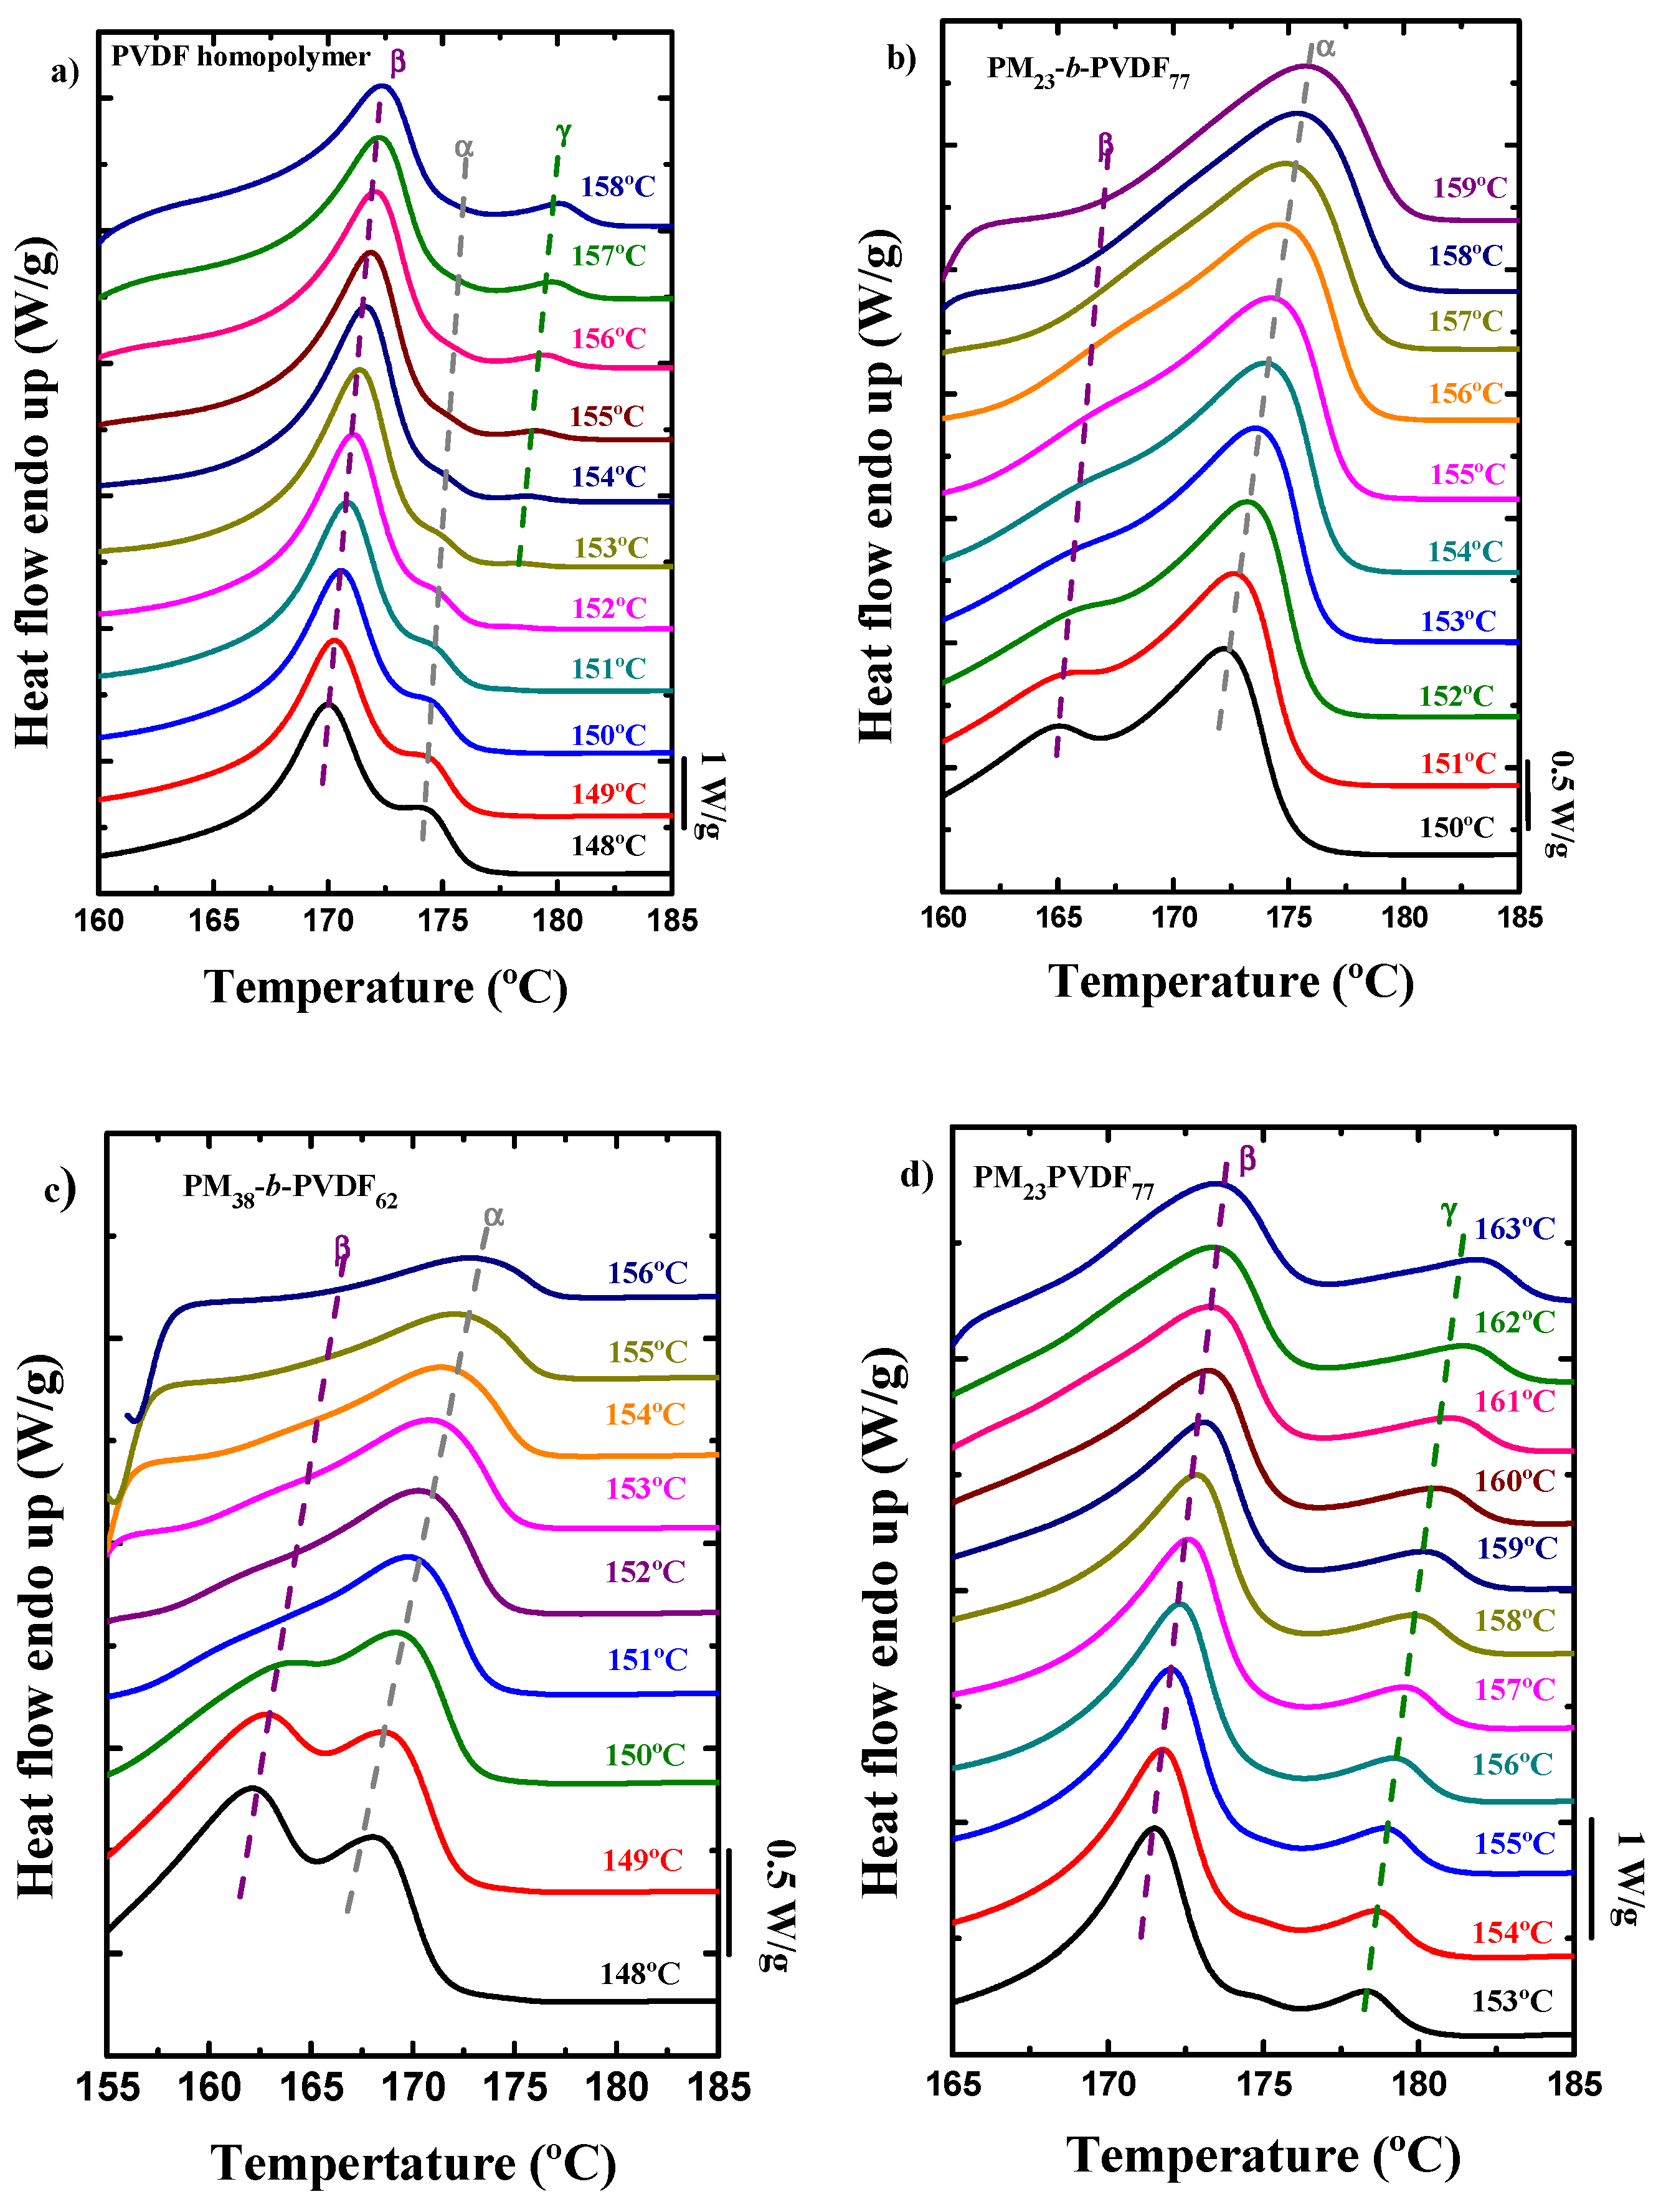
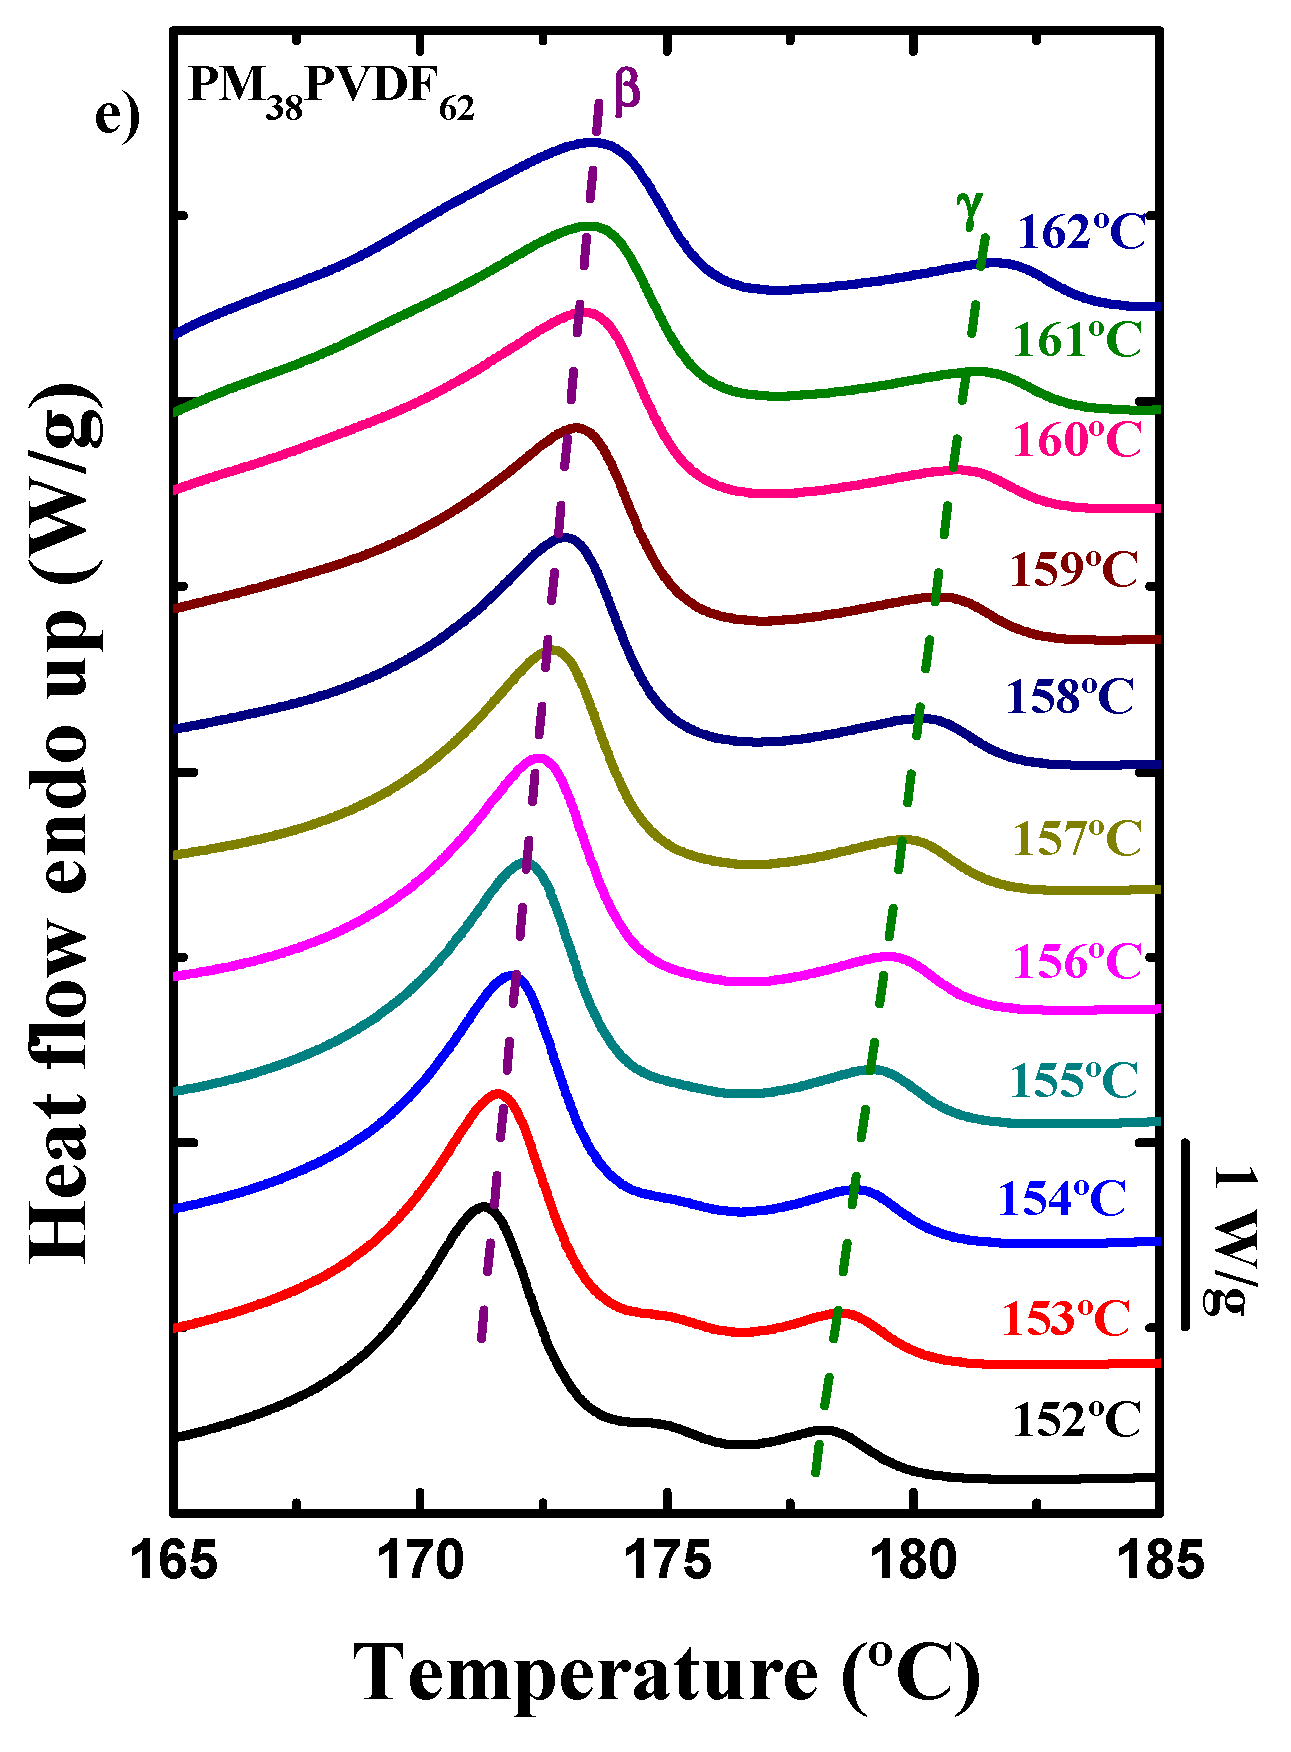
3.4. How the Isothermal Crystallization Affects PVDF Blends and Block Copolymer Samples
4. Conclusions
Supplementary Materials
Author Contributions
Funding
Institutional Review Board Statement
Informed Consent Statement
Data Availability Statement
Conflicts of Interest
References
- Düerkop, D.; Widdecke, H.; Schilde, C.; Kunz, U.; Schmiemann, A. Polymer Membranes for All-Vanadium Redox Flow Batteries: A Review. Membranes 2021, 11, 214. [Google Scholar] [CrossRef]
- Liao, C.-Y.; Hsiao, Y.-T.; Tsai, K.-W.; Teng, N.-W.; Li, W.-L.; Wu, J.-L.; Kao, J.-C.; Lee, C.-C.; Yang, C.-M.; Tan, H.-S.; et al. Photoactive Material for Highly Efficient and All Solution-Processed Organic Photovoltaic Modules: Study on the Efficiency, Stability, and Synthetic Complexity. Solar RRL 2021, 5, 2000749. [Google Scholar] [CrossRef]
- Patnam, H.; Dudem, B.; Graham, S.A.; Yu, J.S. High-performance and robust triboelectric nanogenerators based on optimal microstructured poly(vinyl alcohol) and poly(vinylidene fluoride) polymers for self-powered electronic applications. Energy 2021, 223, 120031. [Google Scholar] [CrossRef]
- Trevino, J.E.; Mohan, S.; Salinas, A.E.; Cueva, E.; Lozano, K. Piezoelectric properties of PVDF-conjugated polymer nanofibers. J. Appl. Polym. Sci. 2021, 138, 50665. [Google Scholar] [CrossRef]
- Bregar, T.; Starc, B.; Čepon, G.; Boltežar, M. On the Use of PVDF Sensors for Experimental Modal Analysis. In Topics in Modal Analysis & Testing; Springer: Cham, Switzerland, 2021; Volume 8, pp. 279–281. [Google Scholar]
- Tonazzini, I.; Bystrenova, E.; Chelli, B.; Greco, P.; De Leeuw, D.; Biscarini, F. Human Neuronal SHSY5Y Cells on PVDF:PTrFE Copolymer Thin Films. Adv. Eng. Mater. 2015, 17, 1051–1056. [Google Scholar] [CrossRef]
- Cardoso, V.F.; Correia, D.M.; Ribeiro, C.; Fernandes, M.M.; Lanceros-Méndez, S. Fluorinated Polymers as Smart Materials for Advanced Biomedical Applications. Polymers 2018, 10, 161. [Google Scholar] [CrossRef] [Green Version]
- Voet, V.S.D.; ten Brinke, G.; Loos, K. Well-defined copolymers based on poly(vinylidene fluoride): From preparation and phase separation to application. J. Polym. Sci. Part A Polym. Chem. 2014, 52, 2861–2877. [Google Scholar] [CrossRef]
- Liu, Z.H.; Pan, C.T.; Lin, L.W.; Lai, H.W. Piezoelectric properties of PVDF/MWCNT nanofiber using near-field electrospinning. Sens. Actuators A Phys. 2013, 193, 13–24. [Google Scholar] [CrossRef]
- Kepler, R.G.; Anderson, R.A. Ferroelectric polymers. Adv. Phys. 1992, 41, 1–57. [Google Scholar] [CrossRef]
- Scott, J.F.; Paz de Araujo, C.A. Ferroelectric Memories. Science 1989, 246, 1400. [Google Scholar] [CrossRef] [PubMed]
- Li, H.; Wang, R.; Han, S.-T.; Zhou, Y. Ferroelectric polymers for non-volatile memory devices: A review. Polym. Int. 2020, 69, 533–544. [Google Scholar] [CrossRef]
- Lee, Y.; Park, J.; Cho, S.; Shin, Y.-E.; Lee, H.; Kim, J.; Myoung, J.; Cho, S.; Kang, S.; Baig, C.; et al. Flexible Ferroelectric Sensors with Ultrahigh Pressure Sensitivity and Linear Response over Exceptionally Broad Pressure Range. ACS Nano 2018, 12, 4045–4054. [Google Scholar] [CrossRef] [PubMed]
- Guyomar, D.; Pruvost, S.; Sebald, G. Energy harvesting based on FE-FE transition in ferroelectric single crystals. IEEE Trans. Ultrason. Ferroelectr. Freq. Control 2008, 55, 279–285. [Google Scholar] [CrossRef]
- Lando, J.B.; Doll, W.W. The polymorphism of poly(vinylidene fluoride). I. The effect of head-to-head structure. J. Macromol. Sci. Part B 1968, 2, 205–218. [Google Scholar] [CrossRef]
- Lovinger, A.J. Ferroelectric Polymers. Science 1983, 220, 1115. [Google Scholar] [CrossRef]
- Cortili, G.; Zerbi, G. Further infra-red data on polyvinylidene fluoride. Spectrochim. Acta Part A Mol. Spectrosc. 1967, 23, 2216–2218. [Google Scholar] [CrossRef]
- Lando, J.B.; Olf, H.G.; Peterlin, A. Nuclear magnetic resonance and x-ray determination of the structure of poly(vinylidene fluoride). J. Polym. Sci. Part A-1 Polym. Chem. 1966, 4, 941–951. [Google Scholar] [CrossRef]
- Tashiro, K.; Kobayashi, M.; Tadokoro, H.; Fukada, E. Calculation of Elastic and Piezoelectric Constants of Polymer Crystals by a Point Charge Model: Application to Poly(vinylidene fluoride) Form I. Macromolecules 1980, 13, 691–698. [Google Scholar] [CrossRef]
- Murayama, N.; Nakamura, K.; Obara, H.; Segawa, M. The strong piezoelectricity in polyvinylidene fluroide (PVDF). Ultrasonics 1976, 14, 15–24. [Google Scholar] [CrossRef]
- Kaempf, G. Special Polymers for Data Memories. Polym. J. 1987, 19, 257–268. [Google Scholar] [CrossRef] [Green Version]
- Voet, V.S.D.; van Ekenstein, G.O.R.A.; Meereboer, N.L.; Hofman, A.H.; ten Brinke, G.; Loos, K. Double-crystalline PLLA-b-PVDF-b-PLLA triblock copolymers: Preparation and crystallization. Polym. Chem. 2014, 5, 2219–2230. [Google Scholar] [CrossRef]
- Bachmann, M.A.; Gordon, W.L.; Koenig, J.L.; Lando, J.B. An infrared study of phase-III poly(vinylidene fluoride). J. Appl. Phys. 1979, 50, 6106–6112. [Google Scholar] [CrossRef]
- Bachmann, M.; Gordon, W.L.; Weinhold, S.; Lando, J.B. The crystal structure of phase IV of poly(vinylidene fluoride). J. Appl. Phys. 1980, 51, 5095–5099. [Google Scholar] [CrossRef]
- Lovinger, A.J. Poly(Vinylidene Fluoride). In Developments in Crystalline Polymers—1; Bassett, D.C., Ed.; Springer: Dodrecht, The Netherlands, 1982; pp. 195–273. [Google Scholar] [CrossRef]
- Gal’perin, Y.L.; Strogalin, Y.V.; Mlenik, M.P. Crystal structure of polyvinylidene fluoride. Polym. Sci. USSR 1965, 7, 1031–1039. [Google Scholar] [CrossRef]
- Li, L.; Zhang, M.; Rong, M.; Ruan, W. Studies on the transformation process of PVDF from α to β phase by stretching. RSC Adv. 2014, 4, 3938–3943. [Google Scholar] [CrossRef]
- Du, C.-h.; Zhu, B.-K.; Xu, Y.-Y. Effects of stretching on crystalline phase structure and morphology of hard elastic PVDF fibers. J. Appl. Polym. Sci. 2007, 104, 2254–2259. [Google Scholar] [CrossRef]
- Kaempf, G.; Siebourg, W.; Loewer, H.; Lazear, N. Polymeric Data Memories and Polymeric Substrate Materials for Information Storage Devices. In Polymers in Information Storage Technology; Mittal, K.L., Ed.; Springer: Boston, MA, USA, 1989; pp. 77–104. [Google Scholar] [CrossRef]
- Li, M.; Stingelin, N.; Michels, J.J.; Spijkman, M.-J.; Asadi, K.; Feldman, K.; Blom, P.W.M.; de Leeuw, D.M. Ferroelectric Phase Diagram of PVDF:PMMA. Macromolecules 2012, 45, 7477–7485. [Google Scholar] [CrossRef] [Green Version]
- Domenici, C.; De Rossi, D.; Nannini, A.; Verni, R. Piezoelectric properties and dielectric losses in PVDF–PMMA blends. Ferroelectrics 1984, 60, 61–70. [Google Scholar] [CrossRef]
- Li, J.; Zhao, C.; Xia, K.; Liu, X.; Li, D.; Han, J. Enhanced piezoelectric output of the PVDF-TrFE/ZnO flexible piezoelectric nanogenerator by surface modification. Appl. Surf. Sci. 2019, 463, 626–634. [Google Scholar] [CrossRef]
- Kim, G.H.; Hong, S.M.; Seo, Y. Piezoelectric properties of poly(vinylidene fluoride) and carbon nanotube blends: β-phase development. Phys. Chem. Chem. Phys. 2009, 11, 10506–10512. [Google Scholar] [CrossRef] [PubMed]
- Zapsas, G.; Patil, Y.; Gnanou, Y.; Ameduri, B.; Hadjichristidis, N. Poly(vinylidene fluoride)-based complex macromolecular architectures: From synthesis to properties and applications. Prog. Polym. Sci. 2020, 104, 101231. [Google Scholar] [CrossRef]
- Gebrekrstos, A.; Prasanna Kar, G.; Madras, G.; Misra, A.; Bose, S. Does the nature of chemically grafted polymer onto PVDF decide the extent of electroactive β-polymorph? Polymer 2019, 181, 121764. [Google Scholar] [CrossRef]
- Golzari, N.; Adams, J.; Beuermann, S. Inducing β Phase Crystallinity in Block Copolymers of Vinylidene Fluoride with Methyl Methacrylate or Styrene. Polymers 2017, 9, 306. [Google Scholar] [CrossRef] [Green Version]
- Lederle, F.; Härter, C.; Beuermann, S. Inducing β phase crystallinity of PVDF homopolymer, blends and block copolymers by anti-solvent crystallization. J. Fluor. Chem. 2020, 234, 109522. [Google Scholar] [CrossRef]
- María, N.; Maiz, J.; Rodionov, V.; Hadjichristidis, N.; Müller, A.J. 4-Miktoarm star architecture induces PVDF β-phase formation in (PVDF)2-b-(PEO)2 miktoarm star copolymers. J. Mater. Chem. C 2020, 8, 13786–13797. [Google Scholar] [CrossRef]
- Imai, S.; Hirai, Y.; Nagao, C.; Sawamoto, M.; Terashima, T. Programmed Self-Assembly Systems of Amphiphilic Random Copolymers into Size-Controlled and Thermoresponsive Micelles in Water. Macromolecules 2018, 51, 398–409. [Google Scholar] [CrossRef]
- Imai, S.; Takenaka, M.; Sawamoto, M.; Terashima, T. Self-Sorting of Amphiphilic Copolymers for Self-Assembled Materials in Water: Polymers Can Recognize Themselves. J. Am. Chem. Soc. 2019, 141, 511–519. [Google Scholar] [CrossRef]
- Jiang, Z.; Liu, H.; He, H.; Ribbe, A.E.; Thayumanavan, S. Blended Assemblies of Amphiphilic Random and Block Copolymers for Tunable Encapsulation and Release of Hydrophobic Guest Molecules. Macromolecules 2020, 53, 2713–2723. [Google Scholar] [CrossRef]
- Cho, J. Analysis of Phase Separation in Compressible Polymer Blends and Block Copolymers. Macromolecules 2000, 33, 2228–2241. [Google Scholar] [CrossRef]
- Leibler, L. Theory of microphase separation in block copolymers. Macromolecules 1980, 13, 1602–1617. [Google Scholar] [CrossRef]
- Zhang, J.; Kremer, K.; Michels, J.J.; Daoulas, K.C. Exploring Disordered Morphologies of Blends and Block Copolymers for Light-Emitting Diodes with Mesoscopic Simulations. Macromolecules 2020, 53, 523–538. [Google Scholar] [CrossRef]
- Zapsas, G.; Patil, Y.; Bilalis, P.; Gnanou, Y.; Hadjichristidis, N. Poly(vinylidene fluoride)/Polymethylene-Based Block Copolymers and Terpolymers. Macromolecules 2019, 52, 1976–1984. [Google Scholar] [CrossRef] [Green Version]
- Lorenzo, A.T.; Arnal, M.L.; Albuerne, J.; Müller, A.J. DSC isothermal polymer crystallization kinetics measurements and the use of the Avrami equation to fit the data: Guidelines to avoid common problems. Polym. Test. 2007, 26, 222–231. [Google Scholar] [CrossRef]
- Hiemenz, P.C.; Lodge, T.P. Polymer Chemistry, 2nd ed.; CRC Press: Boca Raton, FL, USA, 2007. [Google Scholar]
- Schneider, C.A.; Rasband, W.S.; Eliceiri, K.W. NIH Image to ImageJ: 25 years of image analysis. Nat. Methods 2012, 9, 671–675. [Google Scholar] [CrossRef]
- Hamley, I.W.; Castelletto, V.; Castillo, R.V.; Müller, A.J.; Martin, C.M.; Pollet, E.; Dubois, P. Crystallization in Poly(l-lactide)-b-poly(ε-caprolactone) Double Crystalline Diblock Copolymers: A Study Using X-ray Scattering, Differential Scanning Calorimetry, and Polarized Optical Microscopy. Macromolecules 2005, 38, 463–472. [Google Scholar] [CrossRef]
- Castillo, R.V.; Müller, A.J. Crystallization and morphology of biodegradable or biostable single and double crystalline block copolymers. Prog. Polym. Sci. 2009, 34, 516–560. [Google Scholar] [CrossRef]
- Bartczak, Z.; Galeski, A.; Krasnikova, N.P. Primary nucleation and spherulite growth rate in isotactic polypropylene-polystyrene blends. Polymer 1987, 28, 1627–1634. [Google Scholar] [CrossRef]
- Su, Z.; Dong, M.; Guo, Z.; Yu, J. Study of Polystyrene and Acrylonitrile−Styrene Copolymer as Special β-Nucleating Agents To Induce the Crystallization of Isotactic Polypropylene. Macromolecules 2007, 40, 4217–4224. [Google Scholar] [CrossRef]
- Yang, B.; Ni, H.; Huang, J.; Luo, Y. Effects of Poly(vinyl butyral) as a Macromolecular Nucleating Agent on the Nonisothermal Crystallization and Mechanical Properties of Biodegradable Poly(butylene succinate). Macromolecules 2014, 47, 284–296. [Google Scholar] [CrossRef]
- Roerdink, E.; Challa, G. Influence of tacticity of poly(methyl methacrylate) on the compatibility with poly(vinylidene fluoride). Polymer 1978, 19, 173–178. [Google Scholar] [CrossRef]
- Bormashenko, Y.; Pogreb, R.; Stanevsky, O.; Bormashenko, E. Vibrational spectrum of PVDF and its interpretation. Polym. Test. 2004, 23, 791–796. [Google Scholar] [CrossRef]
- Gradys, A.; Sajkiewicz, P.; Adamovsky, S.; Minakov, A.; Schick, C. Crystallization of poly(vinylidene fluoride) during ultra-fast cooling. Thermochim. Acta 2007, 461, 153–157. [Google Scholar] [CrossRef]
- Soin, N.; Boyer, D.; Prashanthi, K.; Sharma, S.; Narasimulu, A.A.; Luo, J.; Shah, T.H.; Siores, E.; Thundat, T. Exclusive self-aligned β-phase PVDF films with abnormal piezoelectric coefficient prepared via phase inversion. Chem. Commun. 2015, 51, 8257–8260. [Google Scholar] [CrossRef]
- Gregorio, R.; Capitão, R.C. Morphology and phase transition of high melt temperature crystallized poly(vinylidene fluoride). J. Mater. Sci. 2000, 35, 299–306. [Google Scholar] [CrossRef]
- Gulmine, J.V.; Janissek, P.R.; Heise, H.M.; Akcelrud, L. Polyethylene characterization by FTIR. Polym. Test. 2002, 21, 557–563. [Google Scholar] [CrossRef]
- Lanceros-Méndez, S.; Mano, J.F.; Costa, A.M.; Schmidt, V.H. FTIR and DSC studies of mechanically deformed β-PVDF films. J. Macromol. Sci. Part. B 2001, 40, 517–527. [Google Scholar] [CrossRef] [Green Version]
- Boccaccio, T.; Bottino, A.; Capannelli, G.; Piaggio, P. Characterization of PVDF membranes by vibrational spectroscopy. J. Membr. Sci. 2002, 210, 315–329. [Google Scholar] [CrossRef]
- Ince-Gunduz, B.S.; Alpern, R.; Amare, D.; Crawford, J.; Dolan, B.; Jones, S.; Kobylarz, R.; Reveley, M.; Cebe, P. Impact of nanosilicates on poly(vinylidene fluoride) crystal polymorphism: Part 1. Melt-crystallization at high supercooling. Polymer 2010, 51, 1485–1493. [Google Scholar] [CrossRef]
- Tasumi, M.; Shimanouchi, T. Crystal Vibrations and Intermolecular Forces of Polymethylene Crystals. J. Chem. Phys. 1965, 43, 1245–1258. [Google Scholar] [CrossRef]
- Hughes, D.J.; Mahendrasingam, A.; Oatway, W.B.; Heeley, E.L.; Martin, C.; Fuller, W. A simultaneous SAXS/WAXS and stress-strain study of polyethylene deformation at high strain rates. Polymer 1997, 38, 6427–6430. [Google Scholar] [CrossRef]
- Lv, F.; Wan, C.; Chen, X.; Meng, L.; Chen, X.; Wang, D.; Li, L. Morphology diagram of PE gel films in wide range temperature-strain space: An in situ SAXS and WAXS study. J. Polym. Sci. Part B Polym. Phys. 2019, 57, 748–757. [Google Scholar] [CrossRef]
- Bartczak, Z.; Argon, A.S.; Cohen, R.E.; Kowalewski, T. The morphology and orientation of polyethylene in films of sub-micron thickness crystallized in contact with calcite and rubber substrates. Polymer 1999, 40, 2367–2380. [Google Scholar] [CrossRef]
- Bachmann, M.A.; Lando, J.B. A reexamination of the crystal structure of phase II of poly(vinylidene fluoride). Macromolecules 1981, 14, 40–46. [Google Scholar] [CrossRef]
- Newman, B.A.; Yoon, C.H.; Pae, K.D.; Scheinbeim, J.I. Piezoelectric activity and field-induced crystal structure transitions in poled poly(vinylidene fluoride) films. J. Appl. Phys. 1979, 50, 6095–6100. [Google Scholar] [CrossRef]
- Doll, W.W.; Lando, J.B. The polymorphism of poly(vinylidene fluoride) V. The effect of hydrostatic pressure on the melting behavior of copolymers of vinylidene fluoride. J. Macromol. Sci. Part B 1970, 4, 897–913. [Google Scholar] [CrossRef]
- Geiss, D.; Hofmann, D. Investigation of structural changes in PVDF by modified X-ray texture methods. IEEE Trans. Electr. Insul. 1989, 24, 1177–1182. [Google Scholar] [CrossRef]
- Hasegawa, R.; Takahashi, Y.; Chatani, Y.; Tadokoro, H. Crystal Structures of Three Crystalline Forms of Poly(vinylidene fluoride). Polym. J. 1972, 3, 600–610. [Google Scholar] [CrossRef] [Green Version]
- Davis, G.T.; McKinney, J.E.; Broadhurst, M.G.; Roth, S.C. Electric-field-induced phase changes in poly(vinylidene fluoride). J. Appl. Phys. 1978, 49, 4998–5002. [Google Scholar] [CrossRef]
- Sy, J.W.; Mijovic, J. Reorientational dynamics of poly (vinylidene fluoride)/poly (methyl methacrylate) blends by broad-band dielectric relaxation spectroscopy. Macromolecules 2000, 33, 933–946. [Google Scholar] [CrossRef]
- Linares, A.; Nogales, A.; Rueda, D.R.; Ezquerra, T.A. Molecular dynamics in PVDF/PVA blends as revealed by dielectric loss spectroscopy. J. Polym. Sci. Part. B Polym. Phys. 2007, 45, 1653–1661. [Google Scholar] [CrossRef]
- Zhao, X.; Jiang, X.; Peng, G.; Liu, W.; Liu, K.; Zhan, Z. Investigation of the dielectric relaxation, conductivity and energy storage properties for biaxially oriented poly(vinylidene fluoride-hexafluoropropylene)/poly(methyl methacrylate) composite films by dielectric relaxation spectroscopy. J. Mater. Sci. Mater. Electron. 2016, 27, 10993–11002. [Google Scholar] [CrossRef]
- Nieto Simavilla, D.; Abate, A.A.; Liu, J.; Geerts, Y.H.; Losada-Peréz, P.; Napolitano, S. 1D-Confinement Inhibits the Anomaly in Secondary Relaxation of a Fluorinated Polymer. ACS Macro Lett. 2021, 10, 649–653. [Google Scholar] [CrossRef]
- Hilczer, B.; Kułek, J.; Markiewicz, E.; Kosec, M.; Malič, B. Dielectric relaxation in ferroelectric PZT–PVDF nanocomposites. J. Non Cryst. Solids 2002, 305, 167–173. [Google Scholar] [CrossRef]
- Martín, J.; Iturrospe, A.; Cavallaro, A.; Arbe, A.; Stingelin, N.; Ezquerra, T.A.; Mijangos, C.; Nogales, A. Relaxations and relaxor-ferroelectric-like response of nanotubularly confined poly (vinylidene fluoride). Chem. Mater. 2017, 29, 3515–3525. [Google Scholar] [CrossRef] [Green Version]
- Linares, A.; Nogales, A.; Sanz, A.; Ezquerra, T.A.; Pieruccini, M. Restricted dynamics in oriented semicrystalline polymers: Poly (vinilydene fluoride). Phys. Rev. E 2010, 82, 031802. [Google Scholar] [CrossRef] [PubMed] [Green Version]
- Kremer, F.; Schönhals, A. Broadband Dielectric Spectroscopy; Springer: Berlin, Germany, 2003. [Google Scholar]
- Martínez-Tong, D.E.; Soccio, M.; Sanz, A.; García, C.; Ezquerra, T.A.; Nogales, A. Ferroelectricity and molecular dynamics of poly (vinylidenefluoride-trifluoroethylene) nanoparticles. Polymer 2015, 56, 428–434. [Google Scholar] [CrossRef]
- Angell, C.A. Formation of glasses from liquids and biopolymers. Science 1995, 267, 1924–1935. [Google Scholar] [CrossRef] [Green Version]
- Angell, C. Why C1 = 16–17 in the WLF equation is physical—And the fragility of polymers. Polymer 1997, 38, 6261–6266. [Google Scholar] [CrossRef]
- Nakagawa, K.; Ishida, Y. Annealing effects in poly(vinylidene fluoride) as revealed by specific volume measurements, differential scanning calorimetry, and electron microscopy. J. Polym. Sci. Polym. Phys. Ed. 1973, 11, 2153–2171. [Google Scholar] [CrossRef]
- Grieveson, B.M. The glass transition temperature in homologous series of linear polymers. Polymer 1960, 1, 499–512. [Google Scholar] [CrossRef]
- Arandia, I.; Mugica, A.; Zubitur, M.; Mincheva, R.; Dubois, P.; Müller, A.J.; Alegría, A. The Complex Amorphous Phase in Poly(butylene succinate-ran-butylene azelate) Isodimorphic Copolyesters. Macromolecules 2017, 50, 1569–1578. [Google Scholar] [CrossRef] [Green Version]
- Lorenzo, A.T.; Müller, A.J. Estimation of the nucleation and crystal growth contributions to the overall crystallization energy barrier. J. Polym. Sci. Part B Polym. Phys. 2008, 46, 1478–1487. [Google Scholar] [CrossRef]
- Hoffman, J.D.; Lauritzen, J.I., Jr. Crystallization of Bulk Polymers With Chain Folding: Theory of Growth of Lamellar Spherulites. J. Res. Natl. Bur. Stand. A Phys. Chem. 1961, 65A, 297–336. [Google Scholar] [CrossRef]
- Reiter, G.; Strobl, G.R. Progress in Understanding of Polymer Crystallization; Springer: Berlin, Germany, 2007; Volume 714. [Google Scholar]
- Avrami, M. Granulation, phase change, and microstructure kinetics of phase change. III. J. Chem. Phys. 1941, 9, 177–184. [Google Scholar] [CrossRef]
- Avrami, M. Kinetics of phase change. II transformation-time relations for random distribution of nuclei. J. Chem. Phys 1940, 8, 212–224. [Google Scholar] [CrossRef]


| Sample | Topology | Mn (g/mol) a | Mn PM (g/mol) a | Mn PVDF (g/mol) a | Đ b |
|---|---|---|---|---|---|
| PM23-b-PVDF77 | Linear diblock copolymer | 28.6 K | 6.6 K | 22.0 K | PM: 1.12 PVDF: 1.29 |
| PM38-b-PVDF62 | Linear diblock copolymer | 17.6 K | 6.6 K | 11.0 K | PM: 1.12 PVDF: 1.25 |
| PM23PVDF77 | Blend | - | 5.6 K | 7.6 K | |
| PM38PVDF62 | Blend | - | 5.6 K | 7.6 K | |
| PVDF | Linear homopolymer | 7.6 K | - | 7.6 K | 1.50 c |
| PM-OH | Linear homopolymer | 5.6 K | 5.6 K | - | 1.12 d |
| Sample | Polymer | Rate (°C/min) | Tm,PM (°C) | Tm,α (°C) | Tm,β (°C) | Tm,γ (°C) | Tc (°C) | ΔHm (J/g) | ΔHc (J/g) |
|---|---|---|---|---|---|---|---|---|---|
| Homopolymer | PVDF | 1 | - | - | 170.9 | 178.1 | 150.6 | 52.6 | 69.8 |
| 5 | - | 173.5 | 168.2 | - | 144.0 | 53.8 | 60.4 | ||
| 20 | - | 173.0 | 166.3 | - | 138.2 | 54.3 | 57.0 | ||
| 60 | - | 172.5 | 165.0 | - | 129.3 | 53.8 | 58.5 | ||
| PM23-b-PVDF77 | PM | 1 | 113.0 | - | - | - | 107.9 | 19.9 | 4.6 |
| 5 | 112.2 | - | - | - | 105.6 | 25.1 | 3.4 | ||
| 20 | 112.1 | - | - | - | 102.3 | 23.7 | 3.0 | ||
| 60 | 111.9 | - | - | - | 98.3 | 24.3 | 1.6 | ||
| PVDF | 1 | - | 170.9 | - | - | 147.8 | 67.1 | 67.0 | |
| 5 | - | 167.6 | 161.1 | - | 141.7 | 66.6 | 69.5 | ||
| 20 | - | 166.1 | 158.9 | - | 135.9 | 70.6 | 71.6 | ||
| 60 | - | 165.4 | 157.3 | - | 128.9 | 71.0 | 60.8 | ||
| PM38-b-PVDF62 | PM | 1 | 114.4 | - | - | - | 108.4 | 38.4 | 25.6 |
| 5 | 113.7 | - | - | - | 106.3 | 40.6 | 19.6 | ||
| 20 | 113.4 | - | - | - | 103.4 | 43.2 | 18.8 | ||
| 60 | 112.7 | - | - | - | 98.9 | 43.6 | 12.6 | ||
| PVDF | 1 | - | 164.3 | 158.7 | - | 141.9 | 60.7 | 66.9 | |
| 5 | - | 162.1 | 155.2 | - | 137.6 | 57.4 | 72.3 | ||
| 20 | - | 160.4 | 153.0 | - | 132.3 | 64.8 | 76.1 | ||
| 60 | - | 159.1 | 150.6 | - | 124.2 | 70.4 | 65.7 | ||
| PM23PVDF77 | PM | 1 | 100.5 | - | - | - | 92.7 | 24.6 | 37.5 |
| 5 | 98.5 | - | - | - | 90.1 | 23.9 | 12.2 | ||
| 20 | 97.8 | - | - | - | 86.1 | 13.1 | 10.9 | ||
| 60 | 97.1 | - | - | - | 80.8 | 13.8 | 12.9 | ||
| PVDF | 1 | - | - | 172.7 | 179.3 | 157.4 | 30.5 | 33.6 | |
| 5 | - | 174.4 | 170.7 | 176.9 | 152.5 | 37.3 | 38.9 | ||
| 20 | - | 174.2 | 170.1 | - | 147.0 | 33.5 | 37.4 | ||
| 60 | - | 173.4 | 167.8 | - | 141.0 | 35.0 | 37.7 | ||
| PM38PVDF62 | PM | 1 | 100.9 | - | - | - | 94.3 | 17.2 | 17.9 |
| 5 | 99.6 | - | - | - | 91.5 | 12.5 | 13.2 | ||
| 20 | 98.1 | - | - | - | 86.8 | 20.5 | 14.1 | ||
| 60 | 97.4 | - | - | - | 80.8 | 21.9 | 14.4 | ||
| PVDF | 1 | - | - | 172.2 | 179.1 | 157.5 | 25.8 | 26.8 | |
| 5 | - | 174.5 | 170.2 | 176.7 | 151.5 | 25.8 | 29.5 | ||
| 20 | - | 173.6 | 168.4 | - | 146.4 | 26.8 | 28.9 | ||
| 60 | - | 173.1 | 167.3 | - | 139.8 | 27.1 | 29.7 |
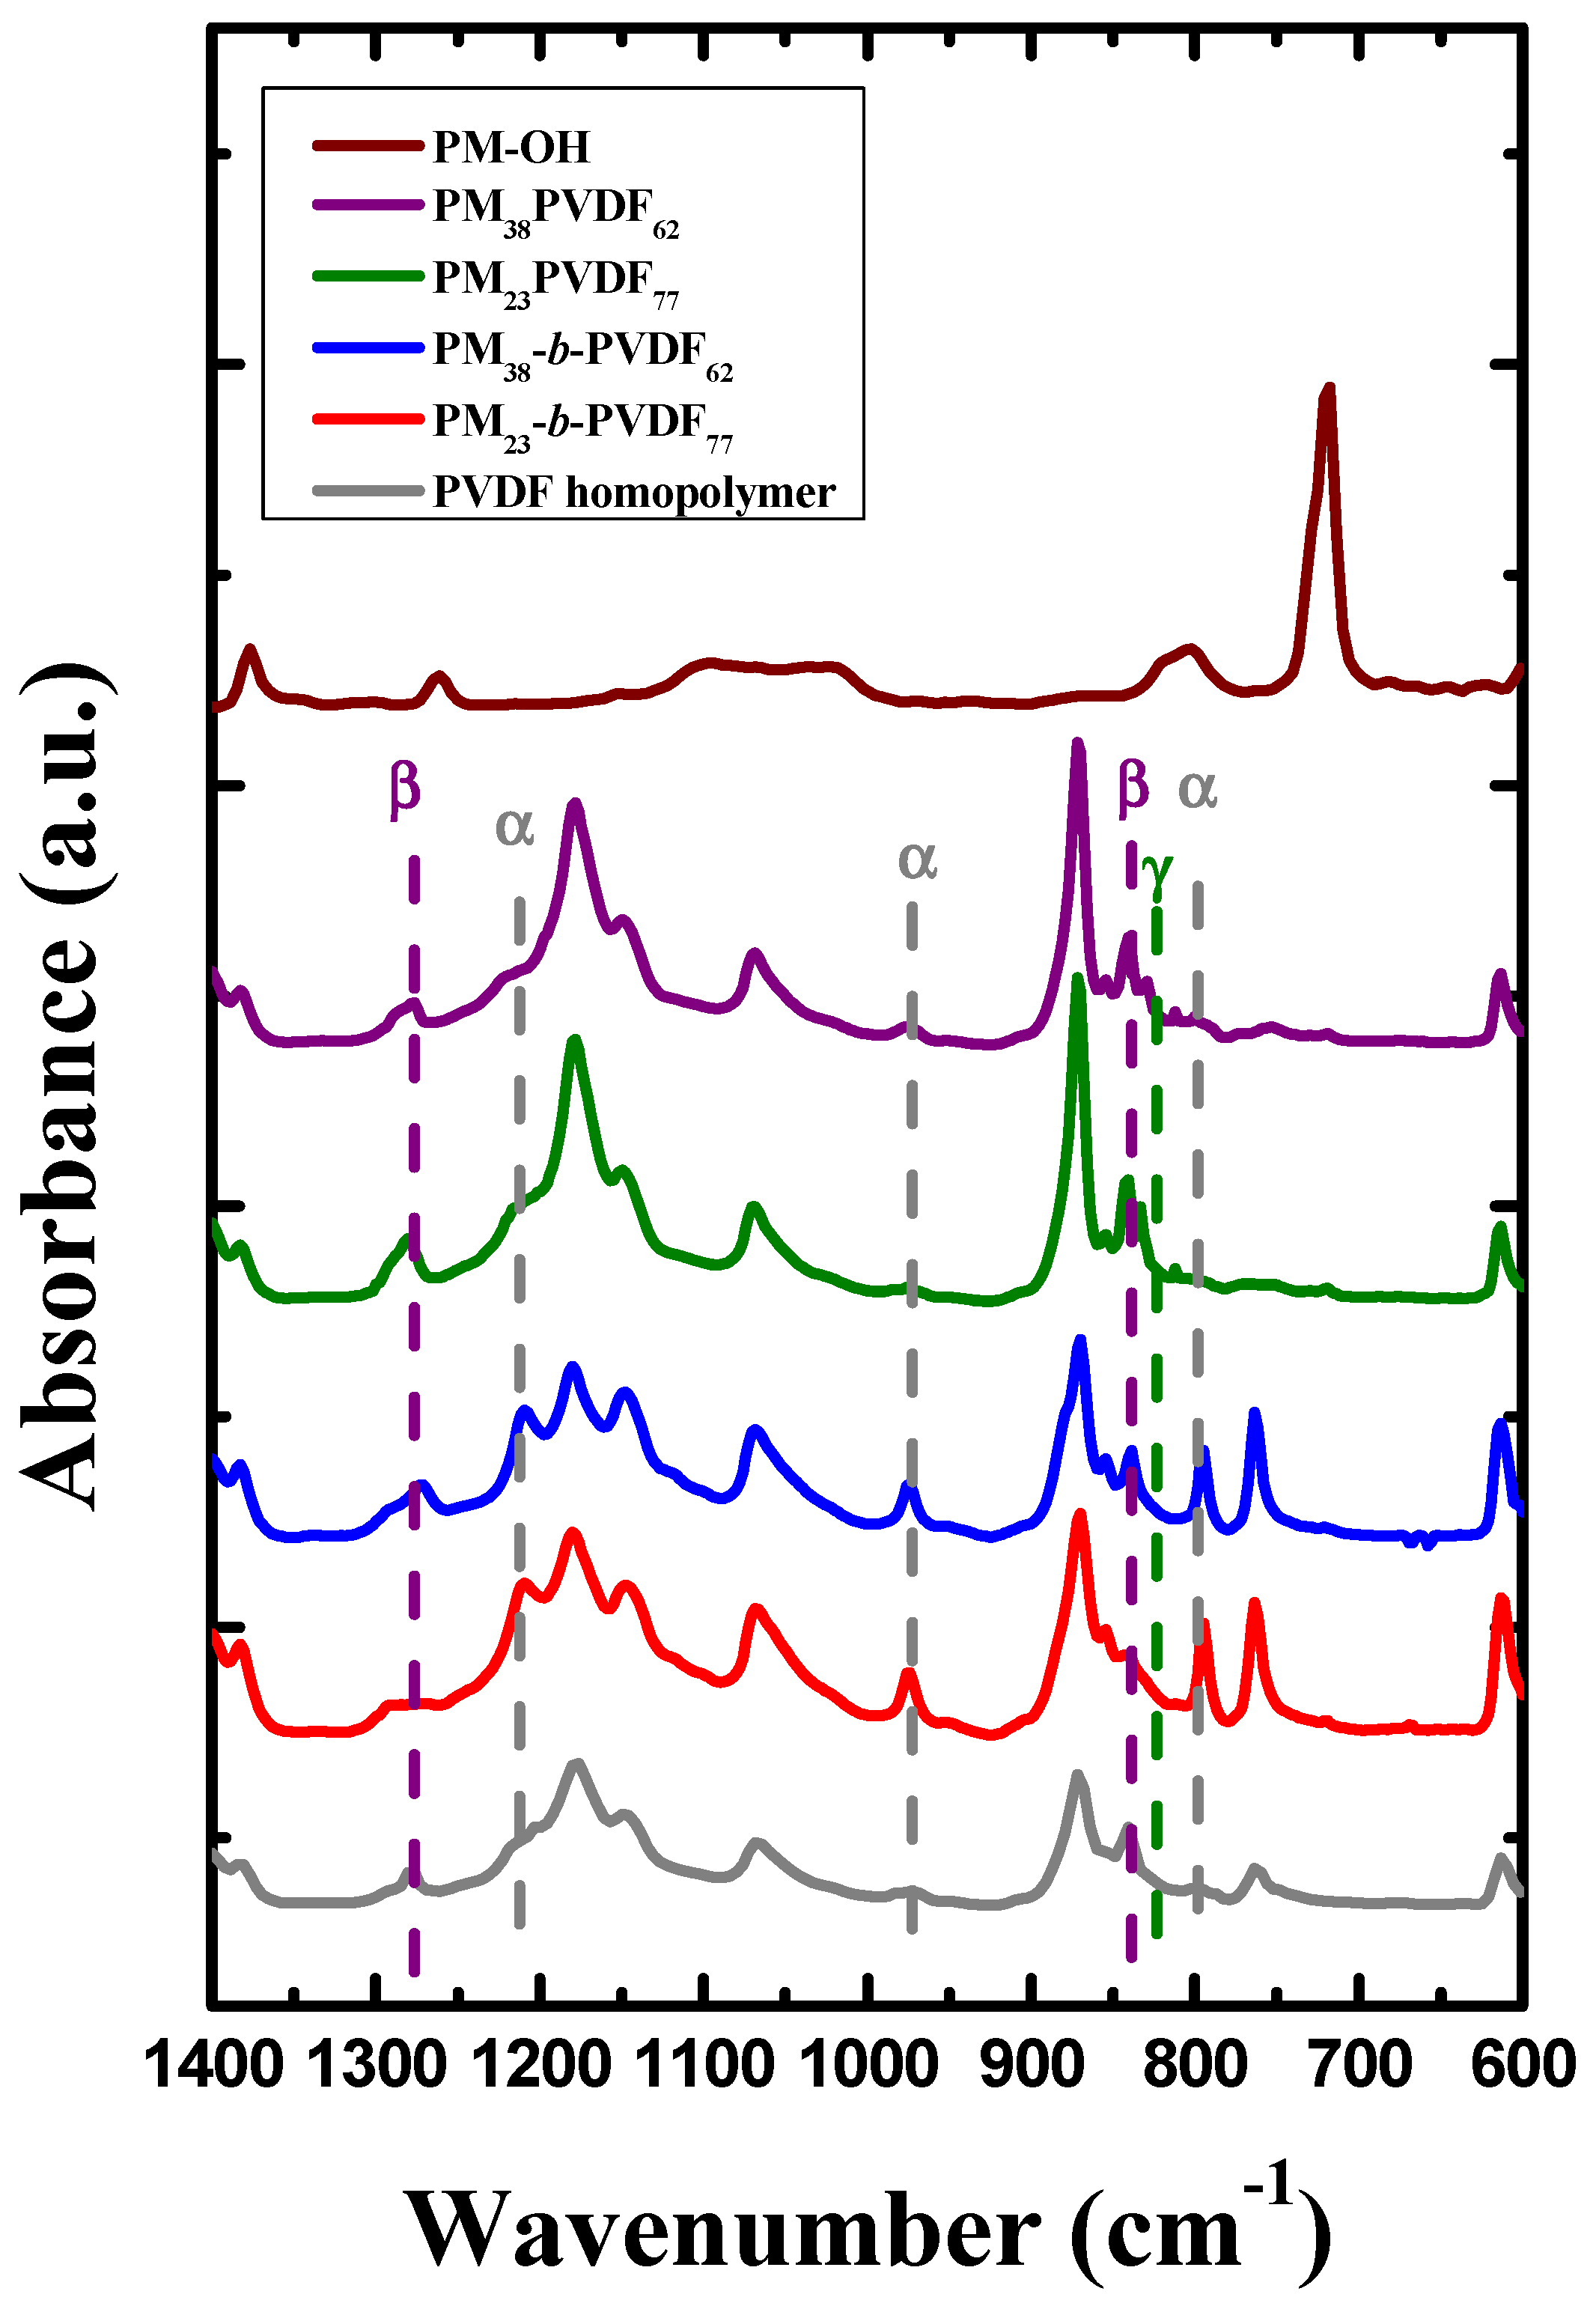
| Wavenumber (cm−1) | Phase | Description [61,62] |
| 720 | PM | C-C rocking deformation |
| 796 | α-PVDF | CH2 rocking |
| 811 | γ-PVDF | - |
| 840 | β-PVDF | CH2,CF2 asymmetric stretching vibration |
| 976 | α-PVDF | CH out of plane deformation |
| 1214 | α-PVDF | CF stretching |
| 1232 | γ-PVDF | CF out of plane deformation |
| 1275 | β-PVDF | CF out of plane deformation |
| 1377 | PM | CH3 symmetric deformation |
| Sample | (s) | (kJ/mol) | (s) | (°C) | (°C) | |
|---|---|---|---|---|---|---|
| PVDF | 2 × 10⁻¹⁴±1 | 42 ± 1 | 10−14 | 21 ± 1 | −151 ± 1 | −80 ± 1 |
| PM23-b-PVDF77 | 3 × 10⁻¹⁶±1 | 48 ± 1 | −154 ± 1 | −85 ± 1 | ||
| PM38-b-PVDF62 | 2 × 10⁻¹⁶±1 | 47 ± 1 | −155 ± 1 | −86 ± 1 |
Publisher’s Note: MDPI stays neutral with regard to jurisdictional claims in published maps and institutional affiliations. |
© 2021 by the authors. Licensee MDPI, Basel, Switzerland. This article is an open access article distributed under the terms and conditions of the Creative Commons Attribution (CC BY) license (https://creativecommons.org/licenses/by/4.0/).
Share and Cite
María, N.; Maiz, J.; Martínez-Tong, D.E.; Alegria, A.; Algarni, F.; Zapzas, G.; Hadjichristidis, N.; Müller, A.J. Phase Transitions in Poly(vinylidene fluoride)/Polymethylene-Based Diblock Copolymers and Blends. Polymers 2021, 13, 2442. https://0-doi-org.brum.beds.ac.uk/10.3390/polym13152442
María N, Maiz J, Martínez-Tong DE, Alegria A, Algarni F, Zapzas G, Hadjichristidis N, Müller AJ. Phase Transitions in Poly(vinylidene fluoride)/Polymethylene-Based Diblock Copolymers and Blends. Polymers. 2021; 13(15):2442. https://0-doi-org.brum.beds.ac.uk/10.3390/polym13152442
Chicago/Turabian StyleMaría, Nicolás, Jon Maiz, Daniel E. Martínez-Tong, Angel Alegria, Fatimah Algarni, George Zapzas, Nikos Hadjichristidis, and Alejandro J. Müller. 2021. "Phase Transitions in Poly(vinylidene fluoride)/Polymethylene-Based Diblock Copolymers and Blends" Polymers 13, no. 15: 2442. https://0-doi-org.brum.beds.ac.uk/10.3390/polym13152442