3.1. Influence of the Neat Amine Content
To investigate the foaming behavior with different DbI blends, an experimental series with ratios of 0/100
w, 20/80
w, 30/70
w and 50/50
w IPDA/B-IPDA was conducted. The resulting CO
2 content for each ratio was calculated according to Equation (5) and is presented in
Table 1. The corresponding DSC thermograms reveal the curing behavior of the different blend systems and are presented in
Figure 3.
In the DSC experiments, two exothermal peaks can be observed. The first one in the range of 20 to 60 °C (
Figure 3a) is related to the pre-curing of the systems, while the second one is related to the decomposition of the carbamate and further curing with the released IPDA. The onset is dependent on the blend system and can be observed at around 90 °C, whereas the actual reaction is expected to start at a lower temperature, as found in our previous study [
25]. The peaks are in the range between 133 and 142 °C, depending on the blend ratio. The shift can be explained by the diffusion of the released IPDA, which is highest at DbI 20/80
w and DbI 30/70
w, while the high pre-curing degree at DbI 50/50
w lowers the diffusion.
As the isothermal step of the experiment does not allow a direct evaluation of the peaks, a plot versus time (
Figure 3b) provides more accurate insights to the effects during pre-curing. It is observed that with increasing IPDA content, the exothermal energy in the pre-curing step, as well as the duration, increases. It is noted that the DbI 0/100
w sample exhibits a negligible endothermal energy, which contributes to the energy required to adjust the temperature in the initial state due to lower heat conductivity with the high filler content of B-IPDA. The pre-curing degree does not reach the theoretical maximum value calculated from the stoichiometric amount of IPDA for all systems, as shown in
Table 1.
The second peak reveals a decreasing energy value of the main curing and foaming step by increasing the blend ratio. This can be explained by the increasing pre-curing degree which reduces the amount of remaining IPDA released by the carbamate. The increasing peak size can be attributed to neat IPDA remaining after 2 h, which reacts further before the B-IPDA decomposes. The determined energy values in the range up to 180 °C are summarized in
Table 2. A small amount of energy released in the final isothermal step at 180 °C can be observed for all samples, but is not investigated further as the foaming is already completed at this point. The total energy released cannot be determined due to the mixture of dynamic and isothermal steps in the experiment. However, the trend confirms the expectation of a reduced total energy release with increasing B-IPDA content due to the endothermal decomposition [
24,
25,
26].
The pre-curing effect and trends are also observable in the rheology experiment, as shown in
Figure 4.
The overall trend of the rheological experiments matches well with the DSC results. The observed differences between DSC and rheology can be explained by the methodology of the measurement, as the DSC focuses on changes in the energy flow, while the rheometer physically applies shearing to the system and detects the response. In general, the initial viscosity decreases with increasing amounts of IPDA due to its lower viscosity and less solid B-IPDA filler content. The viscosity is increased up to different levels during isothermal pre-curing, with a subsequent drop caused by further temperature increases and carbamate decomposition, releasing CO
2 which provides plasticizing effects (
Figure 3a). Afterwards, the rising foam structure disturbs the measurement, resulting in different slopes and further noise due to some material being pushed out of the measurement gap. After an initial re-orientation of the system, the DbI 0/100
w sample shows a constant viscosity value of around 41 Pa × s during the 2h pre-curing time, which is lower compared to the initial viscosity at 25 °C with 136 Pa × s due to the temperature influence (
Figure 4b). Thus, combined with the DSC results, the latent characteristics of the B-IPDA can be confirmed.
The minimum viscosity was found at temperatures around 115–130 °C, caused by the temperature increase and the CO
2 release. As the released amine starts to cure the system, the viscosity increase is accelerated by temperature, once most of the B-IPDA decomposes and the CO
2 either escapes or is entrapped. The effect of curing and CO
2 release can be observed by the measurement noise at temperatures above 90 °C (
Figure 4a) and the time beyond 7650 s (
Figure 4b). For DbI 0/100
w, the measurement noise is very strong up to 130 °C, revealing the carbamate nature of curing and blowing at the same time. Only when most of the B-IPDA is decomposed and no further CO
2 disturbs the network formation can a continuous increase be detected. The observed slight increase at DbI 0/100
w before the drop in viscosity is related to an initial oligomer or network formation of the released IPDA, which overcomes the bubble nucleation at the initial stage. At around 98 °C, the viscosity of DbI 0/100
w matched the viscosity of DbI 20/80
w for a short time and further decreased. In fact, the pre-cured polymeric structure of DbI 20/80
w behaved pseudoplastically, so its viscosity was reduced with a higher temperature and also because of the presence of released IDPA and CO
2. The more significant reduction in viscosity of DbI 0/100
w is an evidence that it is still in a mainly monomeric state compared to the pre-cured network of DbI 20/80
w. This exhibits the advantage of blending neat amine and carbamate. The pre-cured network of the DbI 20/80
w leads to higher viscosities and modulus of the network, lowering the noise effect. This indicates a better ability to entrap the CO
2 with less cell fracturing. At DbI 30/70, the noise effect cannot be seen. This leads to the conclusion that the 30/70
w blend ratio leads to the best matching viscosity and modulus to keep the CO
2 in a stable pre-cured network for foaming. The increased pre-curing degree observed from DSC increases with the amount of neat IPDA in the blend, resulting in a lower viscosity drop because the polymeric network size increase and more entanglements and crosslinks are likely to stabilize it. This also leads to an earlier minimum of viscosity after pre-curing. In case of the DbI 50/50
w blend, even a full gelation of the network can be observed during the 2 h pre-curing time, leading to an abortion of the measurement. The fact that the system is still able to foam leads to the conclusion that the network reveals a viscous behavior during foaming at temperatures up to 180 °C.
The findings match well with the morphology of the foamed samples, as observed from the SEM images and photos in
Figure 5.
In addition to a compact surface caused by the fast reaction of the neat IPDA on the hot surface of the mold, a reduction in cell size can be seen (
Table 2). In systems containing neat IPDA, the surface of the foam cures immediately upon heating, resulting in a closed foam skin [
4,
24]. At the edges, the cells are irregularly deformed due to the fast-cured surface and the limited cell expansion in some directions, pushed by the expanding center region. The center region shows the desirable spherical morphology for DbI 0/100
w, DbI 20/80
w and DbI 30/70
w, as a uniform expansion is possible in all directions and the curing is controlled by the B-IPDA decomposition. The absence of pre-curing for the DbI 0/100
w system leads to a coarse foam structure. This results in a comparably large cell size and deviation, as well as remarkably large non-foamed areas and results in a low cell density. This is caused by the fact that the CO
2 cannot be stabilized properly in the matrix with a viscosity minimum around 9 Pa × s (
Figure 4) and the cells collapse and/or merge. With increasing neat IPDA content and consequently higher pre-curing degree and viscosity, the samples show a more homogeneous cell morphology. This can be observed from the lower deviations of the cell size and increases in cell distribution shown in
Table 2. The systems can stabilize the nucleated cells better and prevent their coalescence. For DbI 50/50, an edge region with irregularly formed, bigger cells and a cracked morphology with small cells at the center region can be observed. The origin of the cracks in the structure contributes to the decomposing B-IPDA in the already highly viscous and initially crosslinked matrix, as revealed in
Figure 4. The built-up pressure induced by CO
2 release damages the pre-cured polymeric network, resulting in microcracks throughout the whole foam morphology. Due to the simultaneous release of IPDA, the system cures and crosslinks further, freezing the cracked structure.
For cell size evaluation, the center regions of the foams were analyzed. The cell size and foam density are also presented in
Table 2.
The adjusted density was reached for all systems except the DbI 50/50
w which exhibits a slightly increased density. As the center region was taken for density measurements, the poor foam development thereof in the 50/50
w sample can be seen. It should be expected that the foaming does not influence the T
g. However, the results observed from DMA are different. This effect is also reported in the literature for other epoxy foams [
23]. While the DbI 0/100
w system exhibits the lowest T
g, the value increases for the DbI 30/70
w blend, being closest to the non-foamed value, then drops for the 50/50
w blend again. As all the systems are fully cured and no further curing effects were observed, this can be explained by the overall thermoset network with increased defects resulting from incomplete network formation during the foaming process. With ratios of 20/80
w and 30/70
w, the reaction kinetics and viscosity allow CO
2 diffusion and bubble formation in the pre-cured polymeric structures, which disturb the further ongoing network formation. This effect is most striking for the 0/100
w system due to the simultaneous curing and blowing without a pre-formed network [
23]. In the case of the 50/50
w ratio, the high pre-curing and fast gelation lowers the diffusion of the released IPDA. The additional bubble and crack formation can be seen to hinder the proper network formation or even weakens its structure. The overall influence of the porous structure on the storage modulus G′ at 30 °C can be seen when compared to the non-foamed DbI 100/0
w sample which exhibits a value nearly three times higher (
Table 2). The G′ was found to reflect the trend of the density in general. comparing DbI 20/80
w, 30/70
w and 50/50
w. However, the DbI 0/100
w value is higher compared to the DbI 50/50
w value and the density is lower. As an explanation, the big non-foamed areas compared to the more homogeneous, but cracked, structure in DbI 50/50
w can be seen. It can be concluded that the DbI 30/70
w system reveals the best performance with regard to rheological behavior and kinetics for a 2h pre-curing time. The DbI 30/70
w system was chosen for further investigations.
3.2. Influence of the Pre-Curing Time
To investigate the influence of the pre-curing time, the DbI 30/70
w system was used for further DSC and rheology measurements. It should be kept in mind that the stoichiometric amount of hardener in this system is shared between neat IPDA and B-IPDA. For a 30/70 wt.% ratio between IPDA and B-IPDA, a stoichiometric ratio of 35.2/64.8% is found. The corresponding diagrams of the process-related DSC are presented in
Figure 6.
In
Figure 6a, the DSC evaluation shows the expected D
P values for different pre-curing times. After 5 h at 60 °C, the value converges close to the theoretical maximum D
P of 35.2%, considering an additional curing during the heating ramp up to 60 °C. The value calculated after 2 h matches well with the experiment shown in
Figure 3b. The stability of B-IPDA at a given temperature leads to negligible release of IPDA in the timescale. The E
P is slightly lower compared to the 2 h experiment (
Figure 3), as less neat IPDA remains after 5 h of pre-curing which contributes to this curing step. The T
P was found in the same range compared to the 2 h experiment. The results of the rheological experiments are shown in
Figure 7.
The slowdown of the reaction due to the IPDA consumption and network increase can be confirmed with
Figure 6a. With increasing pre-curing time, the viscosity asymptotically approaches a constant value, as can be seen by the polynomial fit. This behavior is due to the limited content of neat IPDA in the hardener blend as well as the stability of B-IPDA at given conditions, limiting the amount of networking points. This behavior is typically observed for thermoset networks, as the molecular weight of the polymeric structures does not increase in a linear way due to crosslinking effects.
Figure 6b reveals the temperature dependence of the viscosity from 60 to 140 °C. Experimental data are cut off at 140 °C due to the increasing effect of noise disturbing the measurement at higher temperatures. The effects taking place during the temperature increase are the same as discussed before. The temperature-induced chain mobility results in a softening of the pre-cured network and a decrease in viscosity. In addition, the decomposition of B-IPDA releases CO
2 which acts as a plasticizer and further released IPDA causes further curing. Without pre-curing, a minimum viscosity of 1 Pa*s is detected at around 100 °C. Due to the IPDA content, the already formed network shapes the viscosity decrease effect differently compared to the experiment in
Figure 4a. An initial drop resulting from the CO
2 release is counterbalanced by an increase where further curing and CO
2 escape are assumed. The further released CO
2 lowers the viscosity again, before the system begins to cure fast at around 130 °C. At a pre-curing time of 1 h, the viscosity reaches a low-level region between 100 °C and 125 °C. This region becomes smaller with increasing pre-curing time and the minimum is shifted to lower temperatures. As a longer pre-curing time results in an enhanced polymeric structure with entanglements or even an initial network formation, a better stabilization of the nucleated cells due to a higher pre-curing degree can be assumed. The resulting samples and morphologies observed by SEM from the foaming experiments are shown in
Figure 8.
With increasing pre-curing time, an improvement of the foaming behavior in general and a reduction in cell size can be observed. A direct kick to 180 °C leads to a poorly foamed sample with negligible expansion, as the kinetics of decomposition and curing do not match properly. Similar results were observed in our previous study [
25]. The increasing pre-curing time contributes to the oligomer and polymeric structure formation, which increases the viscosity, leading to cell stabilization and prevention of cell collapse or coagulation. Thus, more cells can be stabilized and the cell size decreases while the cell distribution increases. This effect is similar to the melt strength of thermoplastic foam materials which is improved by longer chains and branching. The characteristics of the obtained foams are summarized in
Table 3.
As shown in
Table 3, the cell size of the foams decreases while the cell distribution increases with pre-curing time. The foam with 0 h pre-curing exhibits the highest density due to the high ratio of compact matrix with some entrapped bubbles, allowing no proper evaluation, as seen in
Figure 8a. A bulk DGEBA-IPDA system exhibits a density of around 1105 kg m
−3 [
25]. The lowest density value is observed for the 1 h pre-curing sample. This is due to the low viscosity, while still being able to keep some CO
2, as observed from the plateau in
Figure 7b. However, due to the CO
2 pressure in the closed mold, material was pushed out. Thus, the filling degree was lowered along with the resulting density. The foams which were pre-cured for 2–5 h were able to stabilize the CO
2 bubbles and withstand cell coalescence or diffusion of the CO
2 to the cavity, allowing them to withstand a push-out. Consequently, the target density of around 860 kg m
−³ was reached. The T
g can be seen as constant, indicating no effect resulting from pre-curing. The storage modulus G′ at 30 °C was found to increase with the pre-curing time of 2–5 h. As an explanation, the higher pre-curing degree of the network can be seen, as well as the increasing amount of non-foamed areas between the cells. The trend is also confirmed by the highest brittleness of the 5 h pre-cured sample, as indicated by
Figure 8m, where some parts were breaking out of the sample during preparation. This issue was less significant in the 2 h and 3 h pre-cured samples. In summary, the DbI system is most suitable in a two-step process with pre-curing between 2 h and 3 h at 60 °C to achieve homogeneous cell sizes below 100 µm.


 and
and 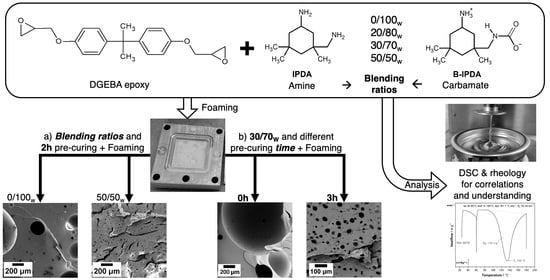


