
Properties Enhancement Nano Coconut Shell Filled in Packaging Plastic Waste Bionanocomposite

 , , and
Abstract
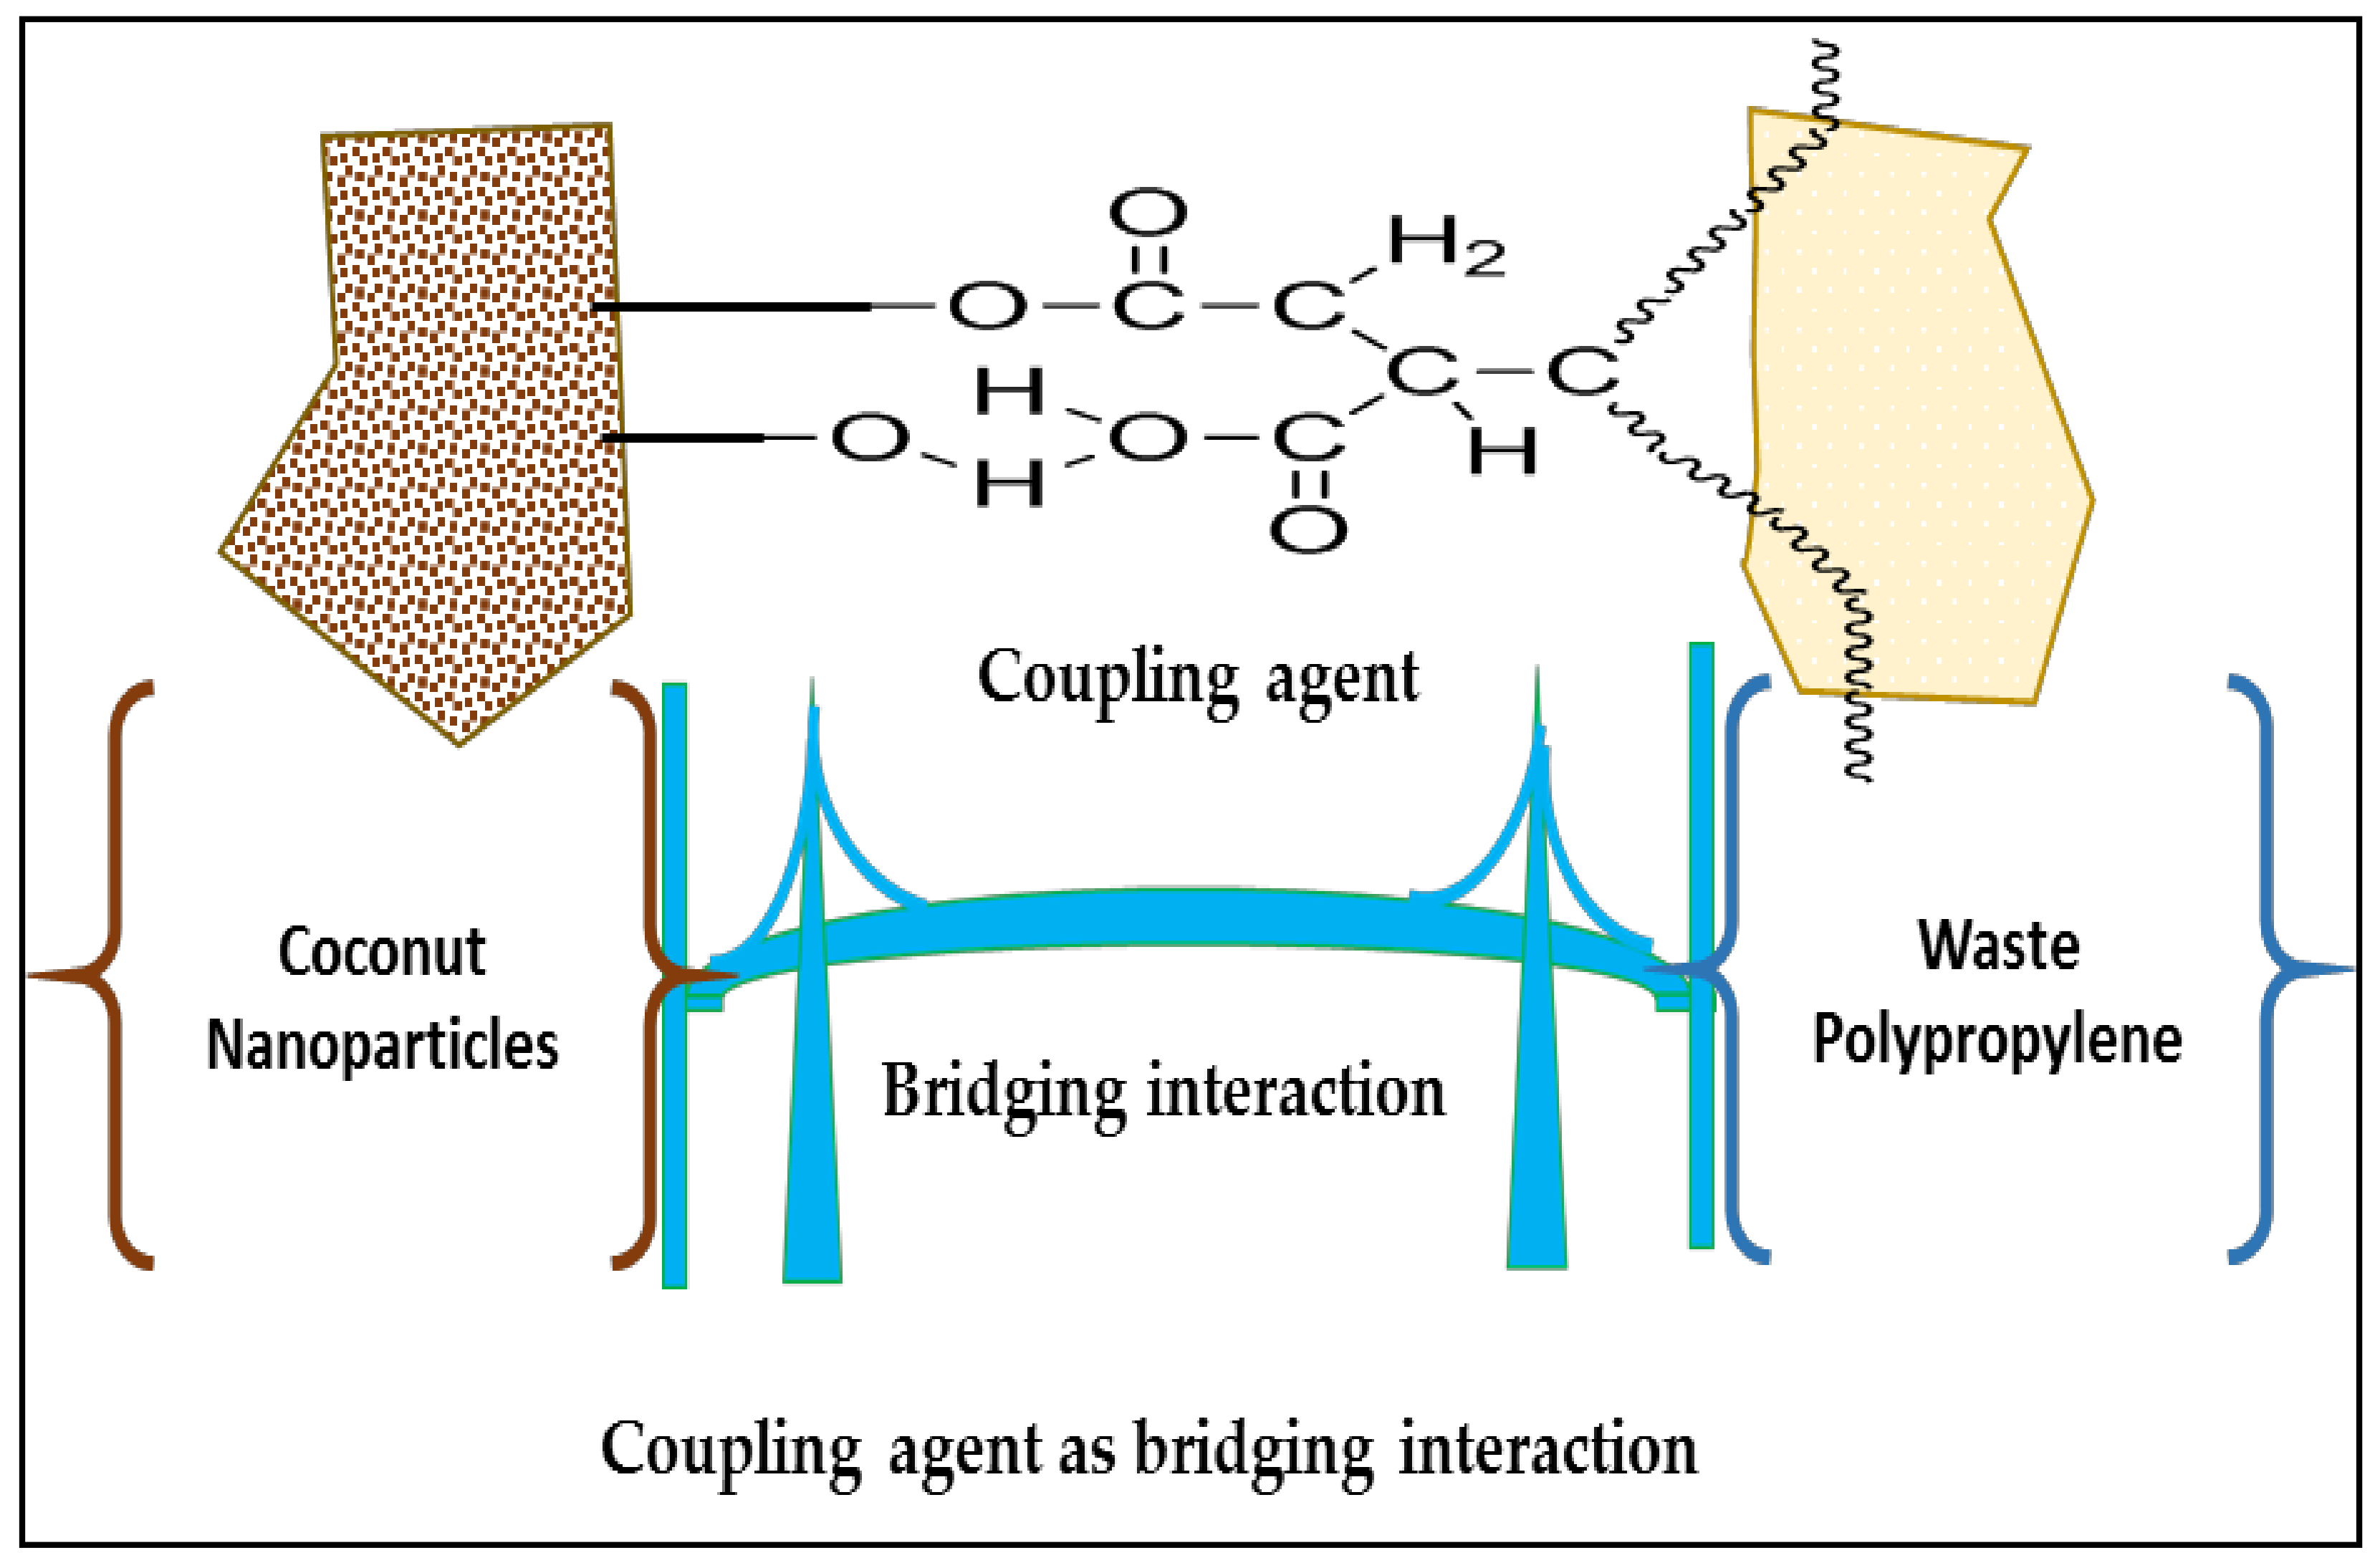
:1. Introduction
2. Materials and Methods
2.1. Materials
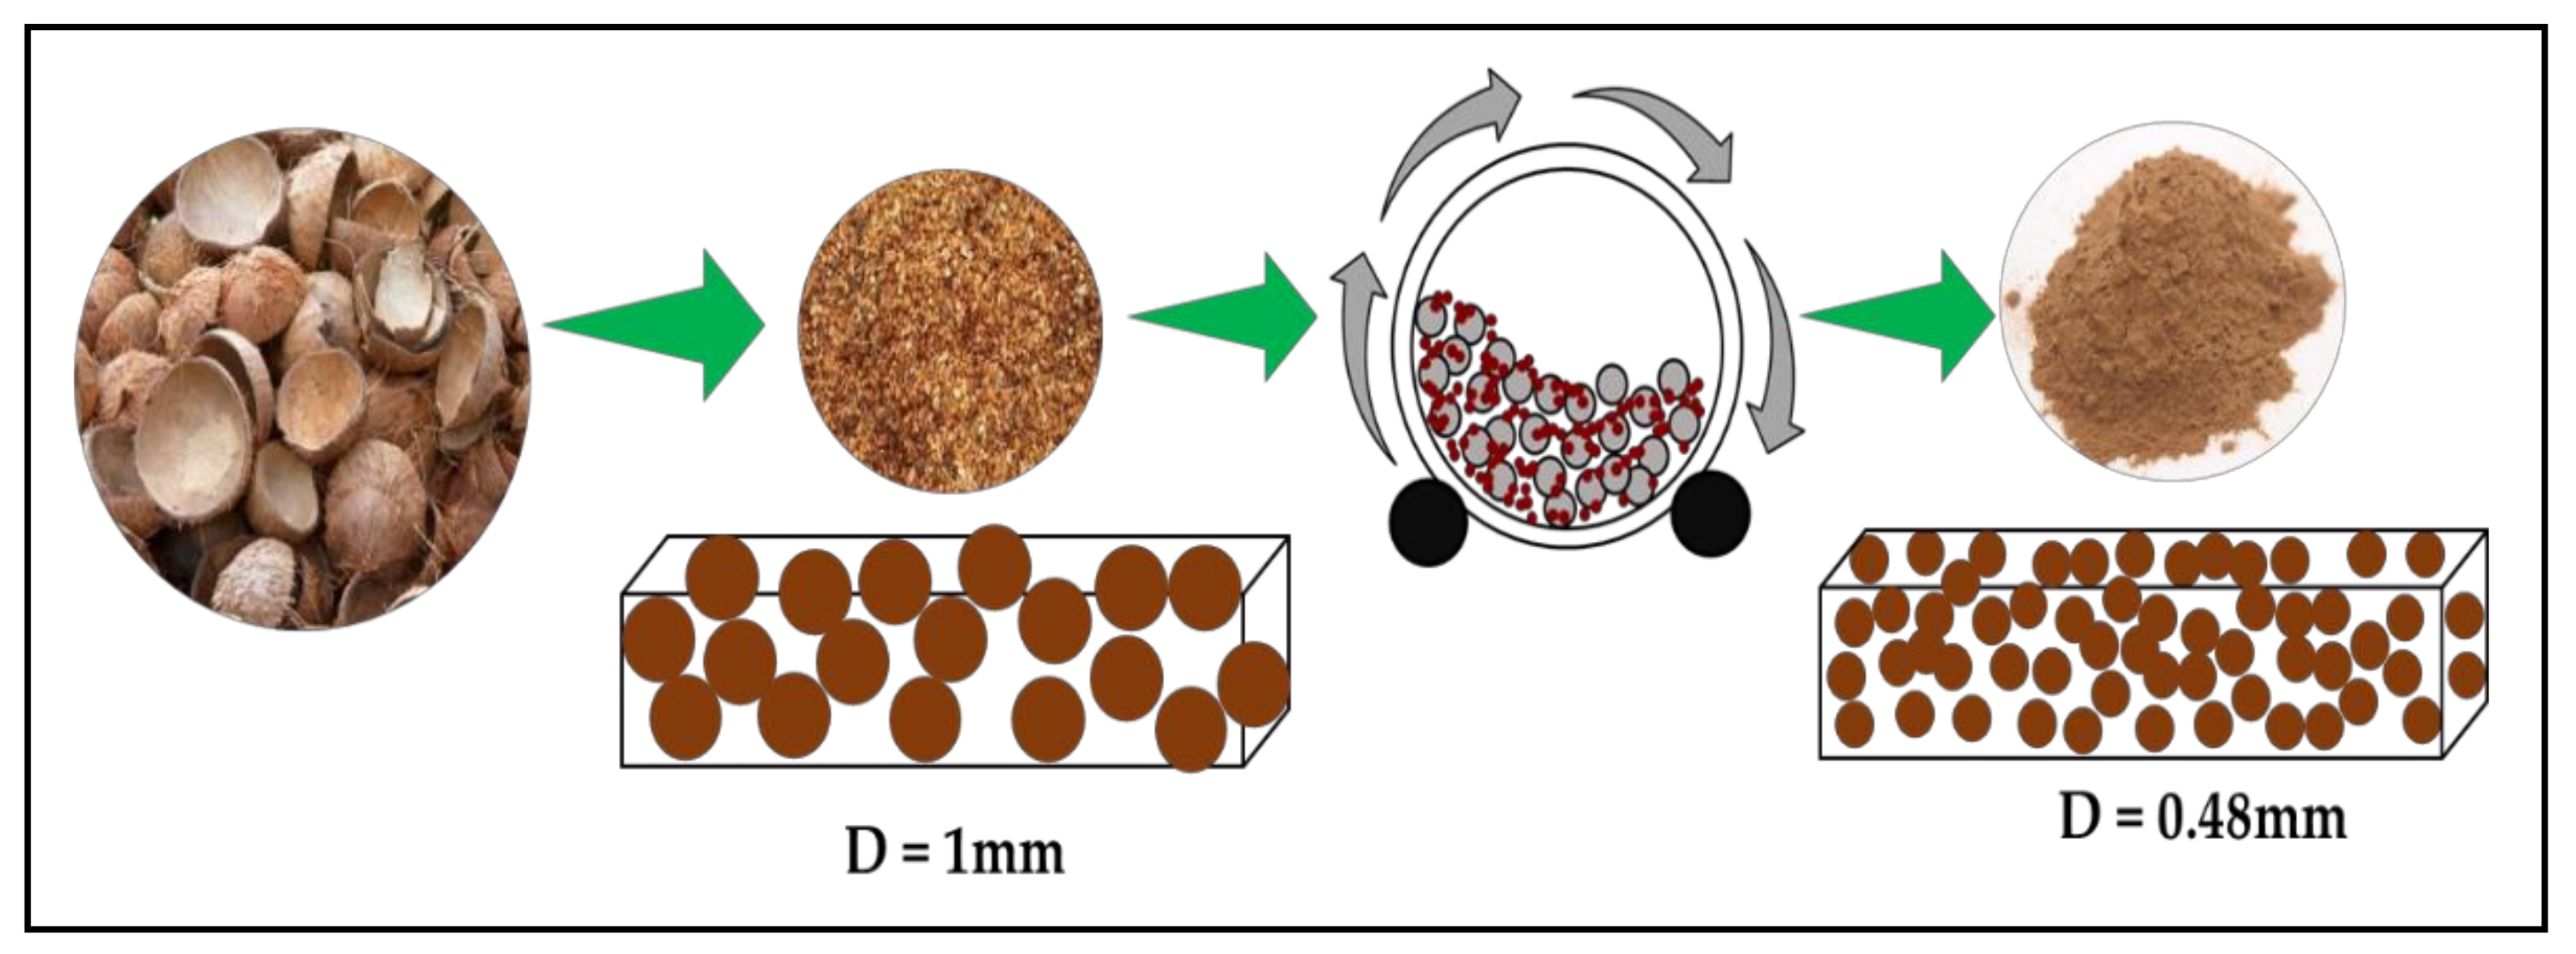
2.2. Sample Preparation
2.3. Characterisation of the Biocomposite
2.4. Statistical Analysis
3. Results and Discussion
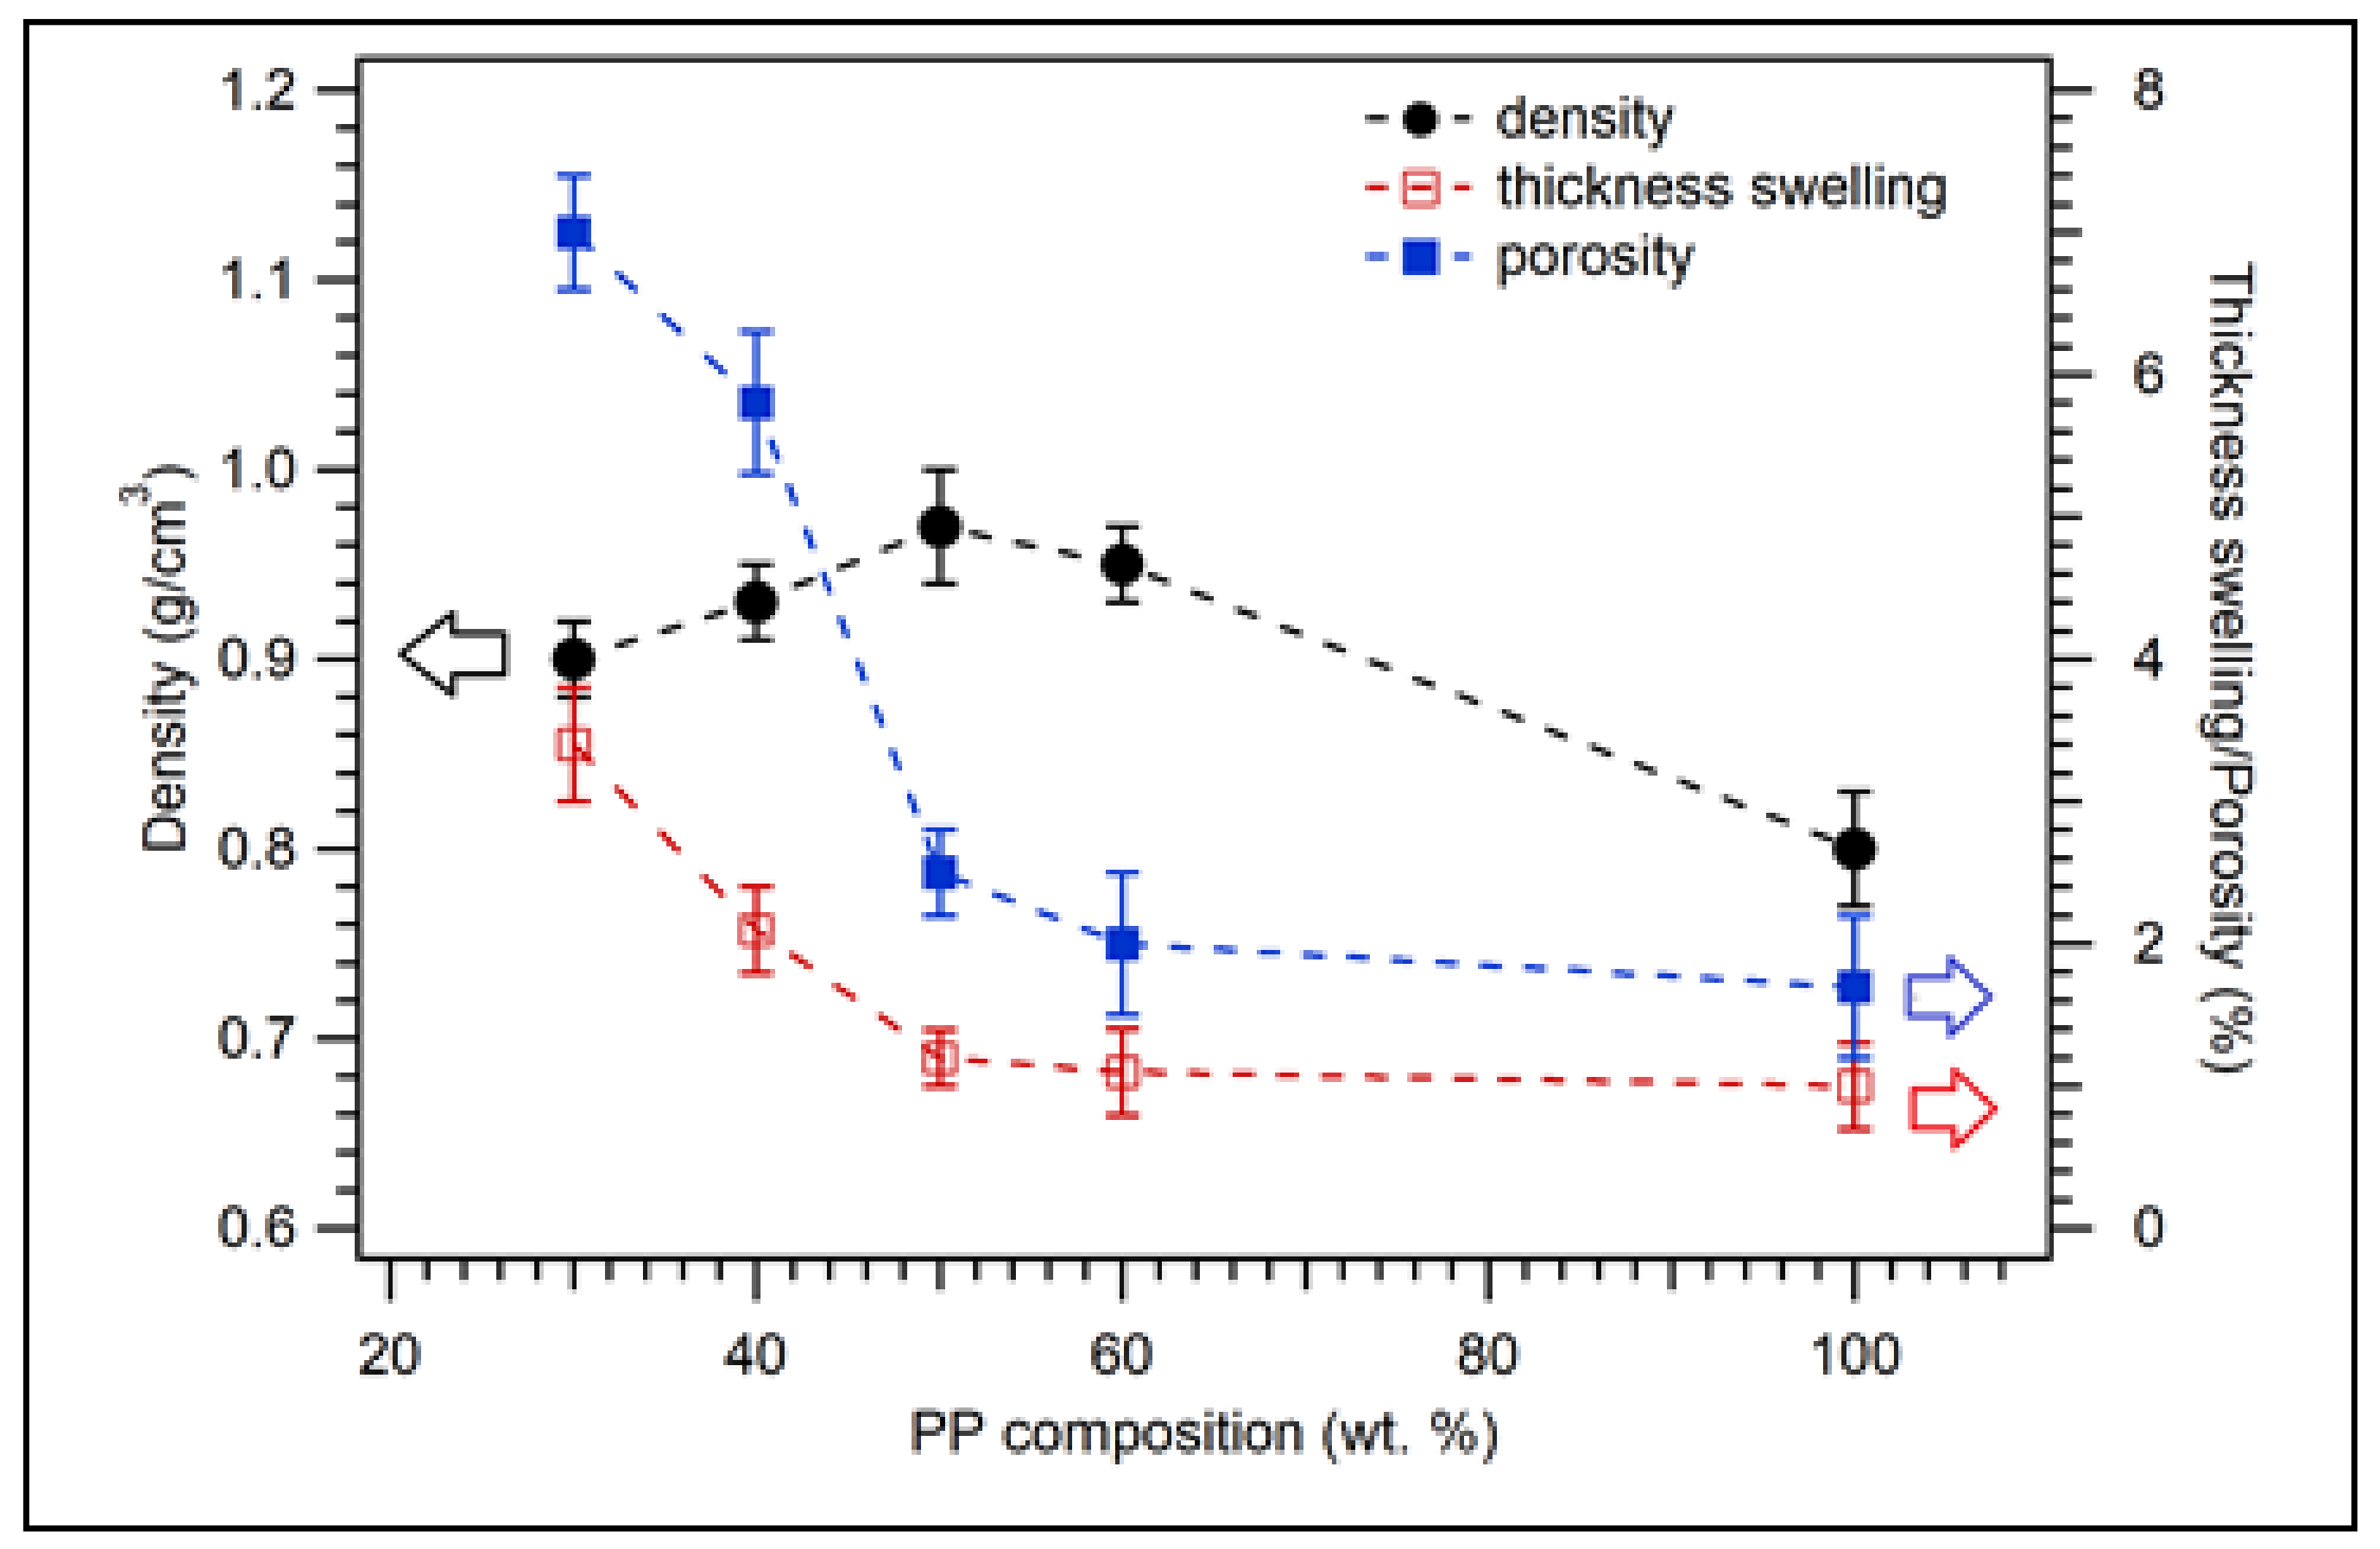
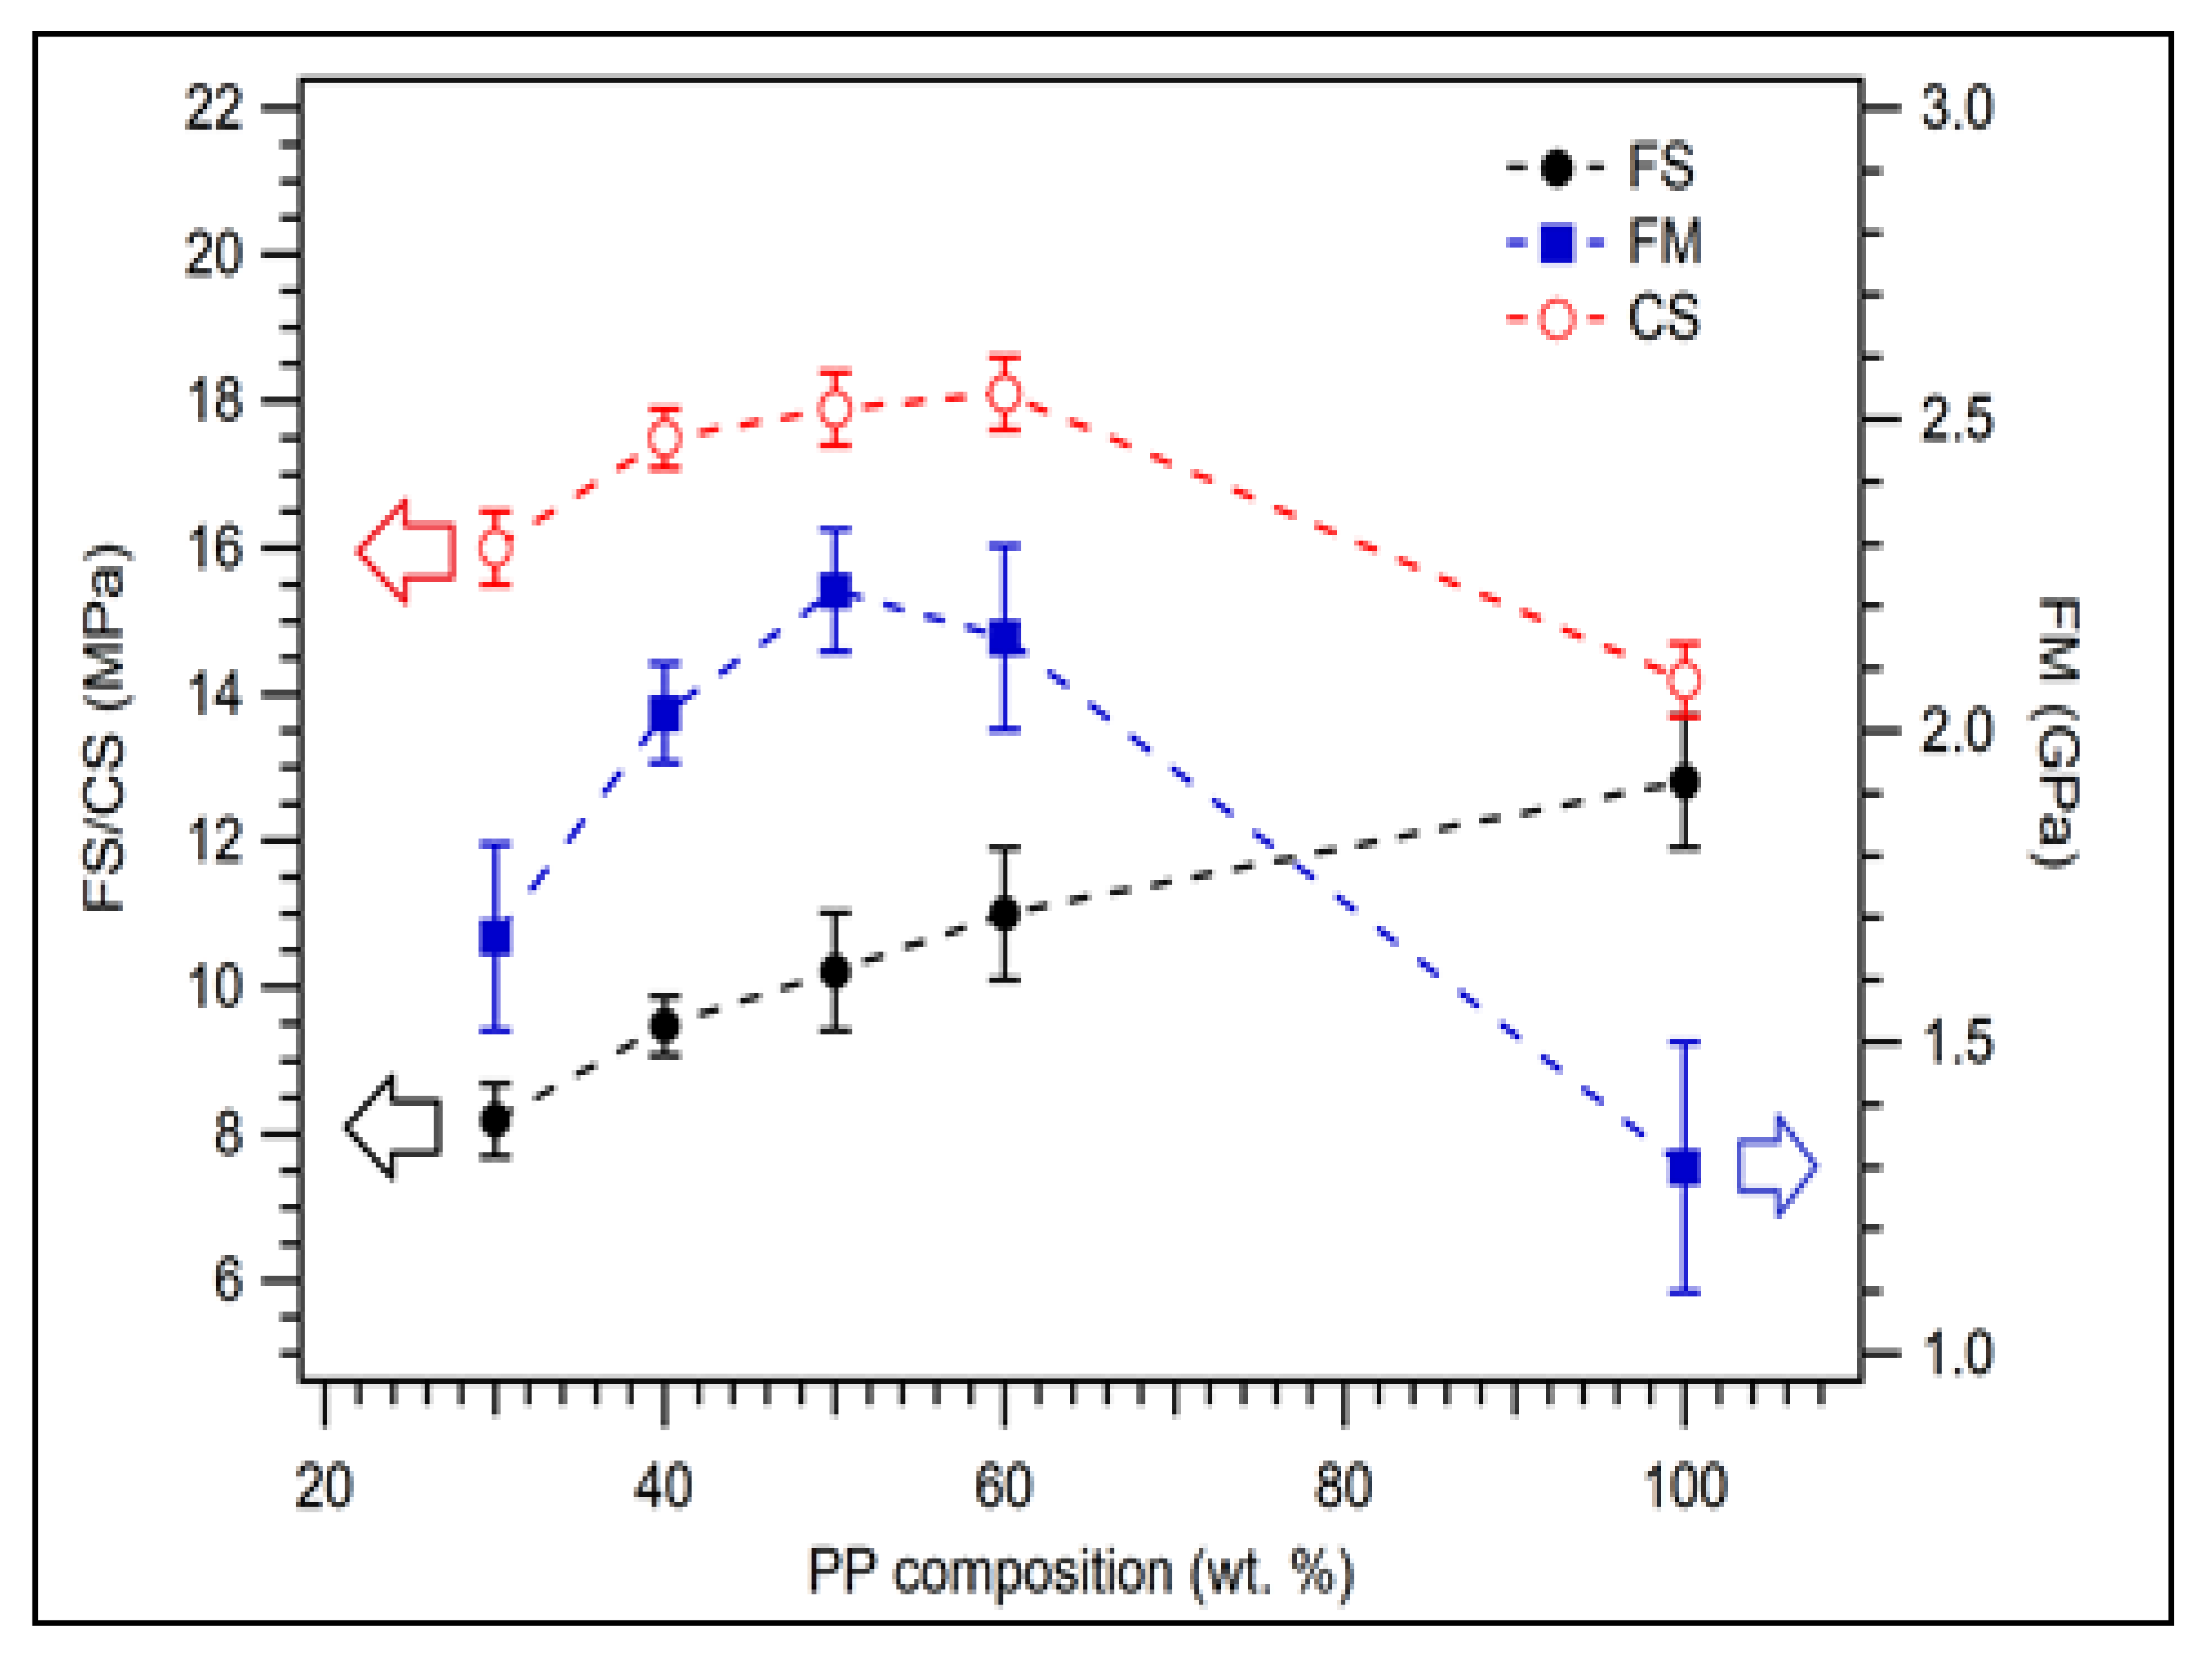
3.1. Properties of Biocomposite with Varying Composition
3.1.1. Physical Properties
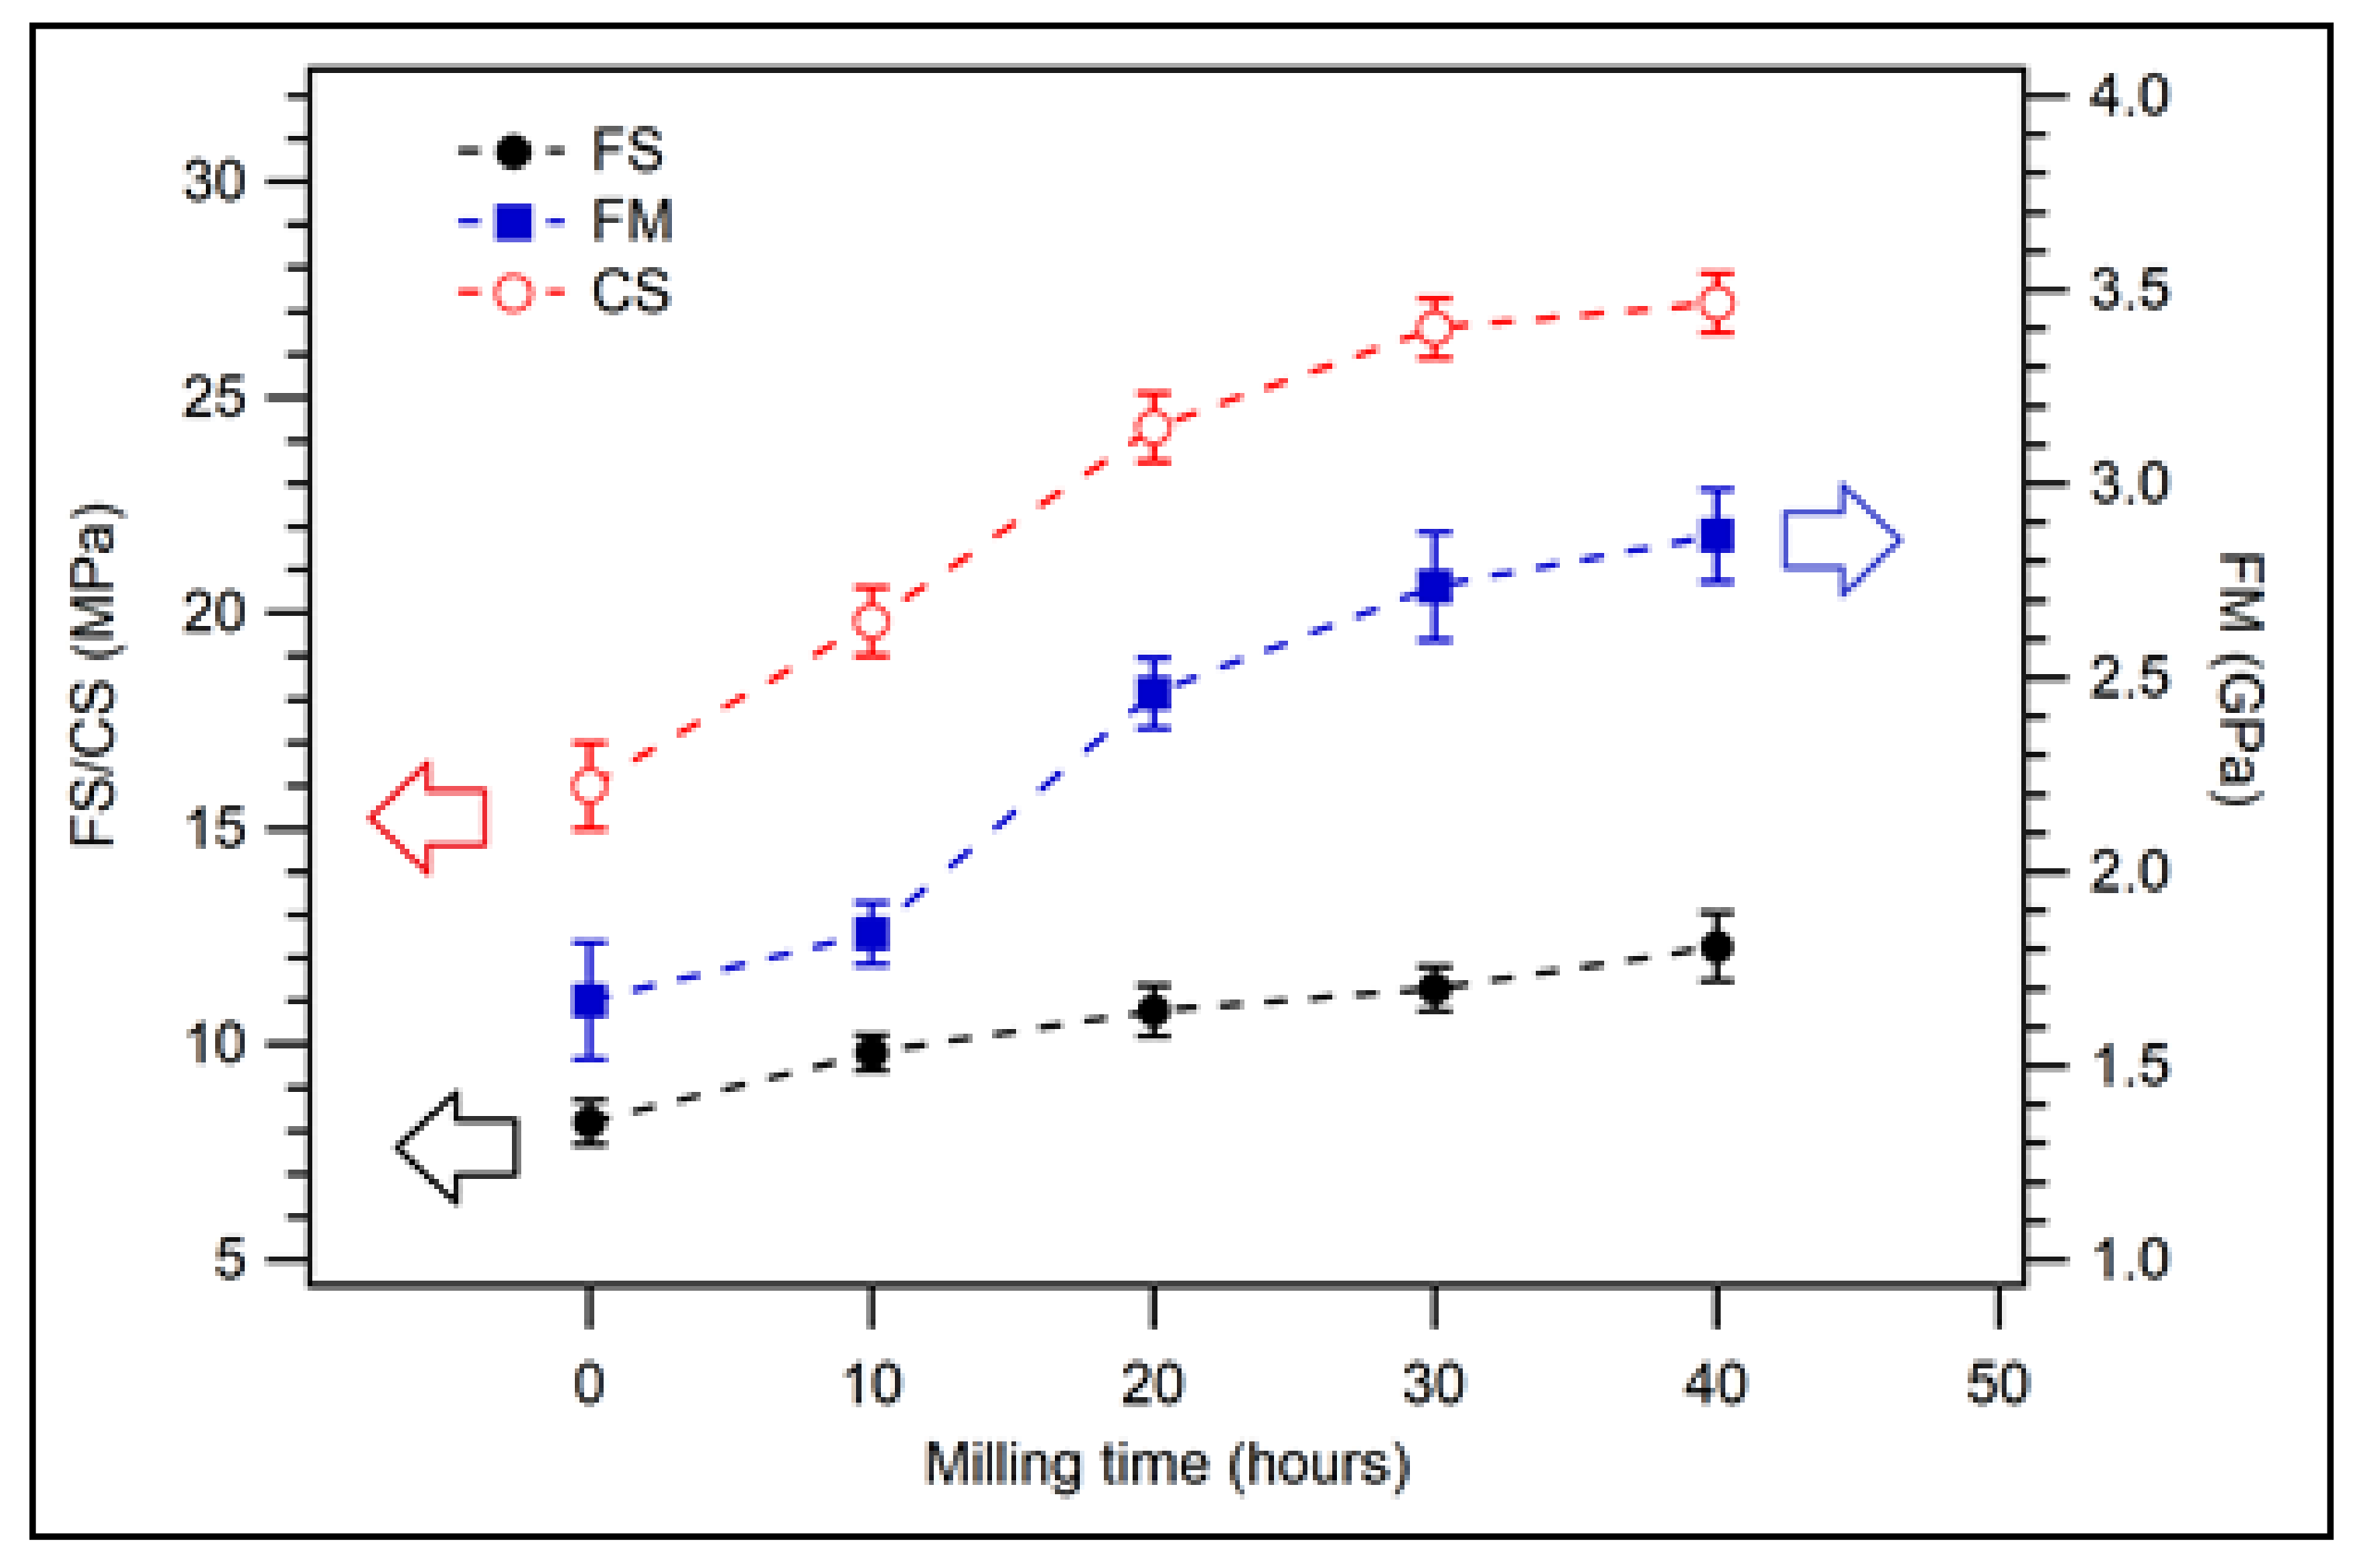
3.1.2. Mechanical Properties
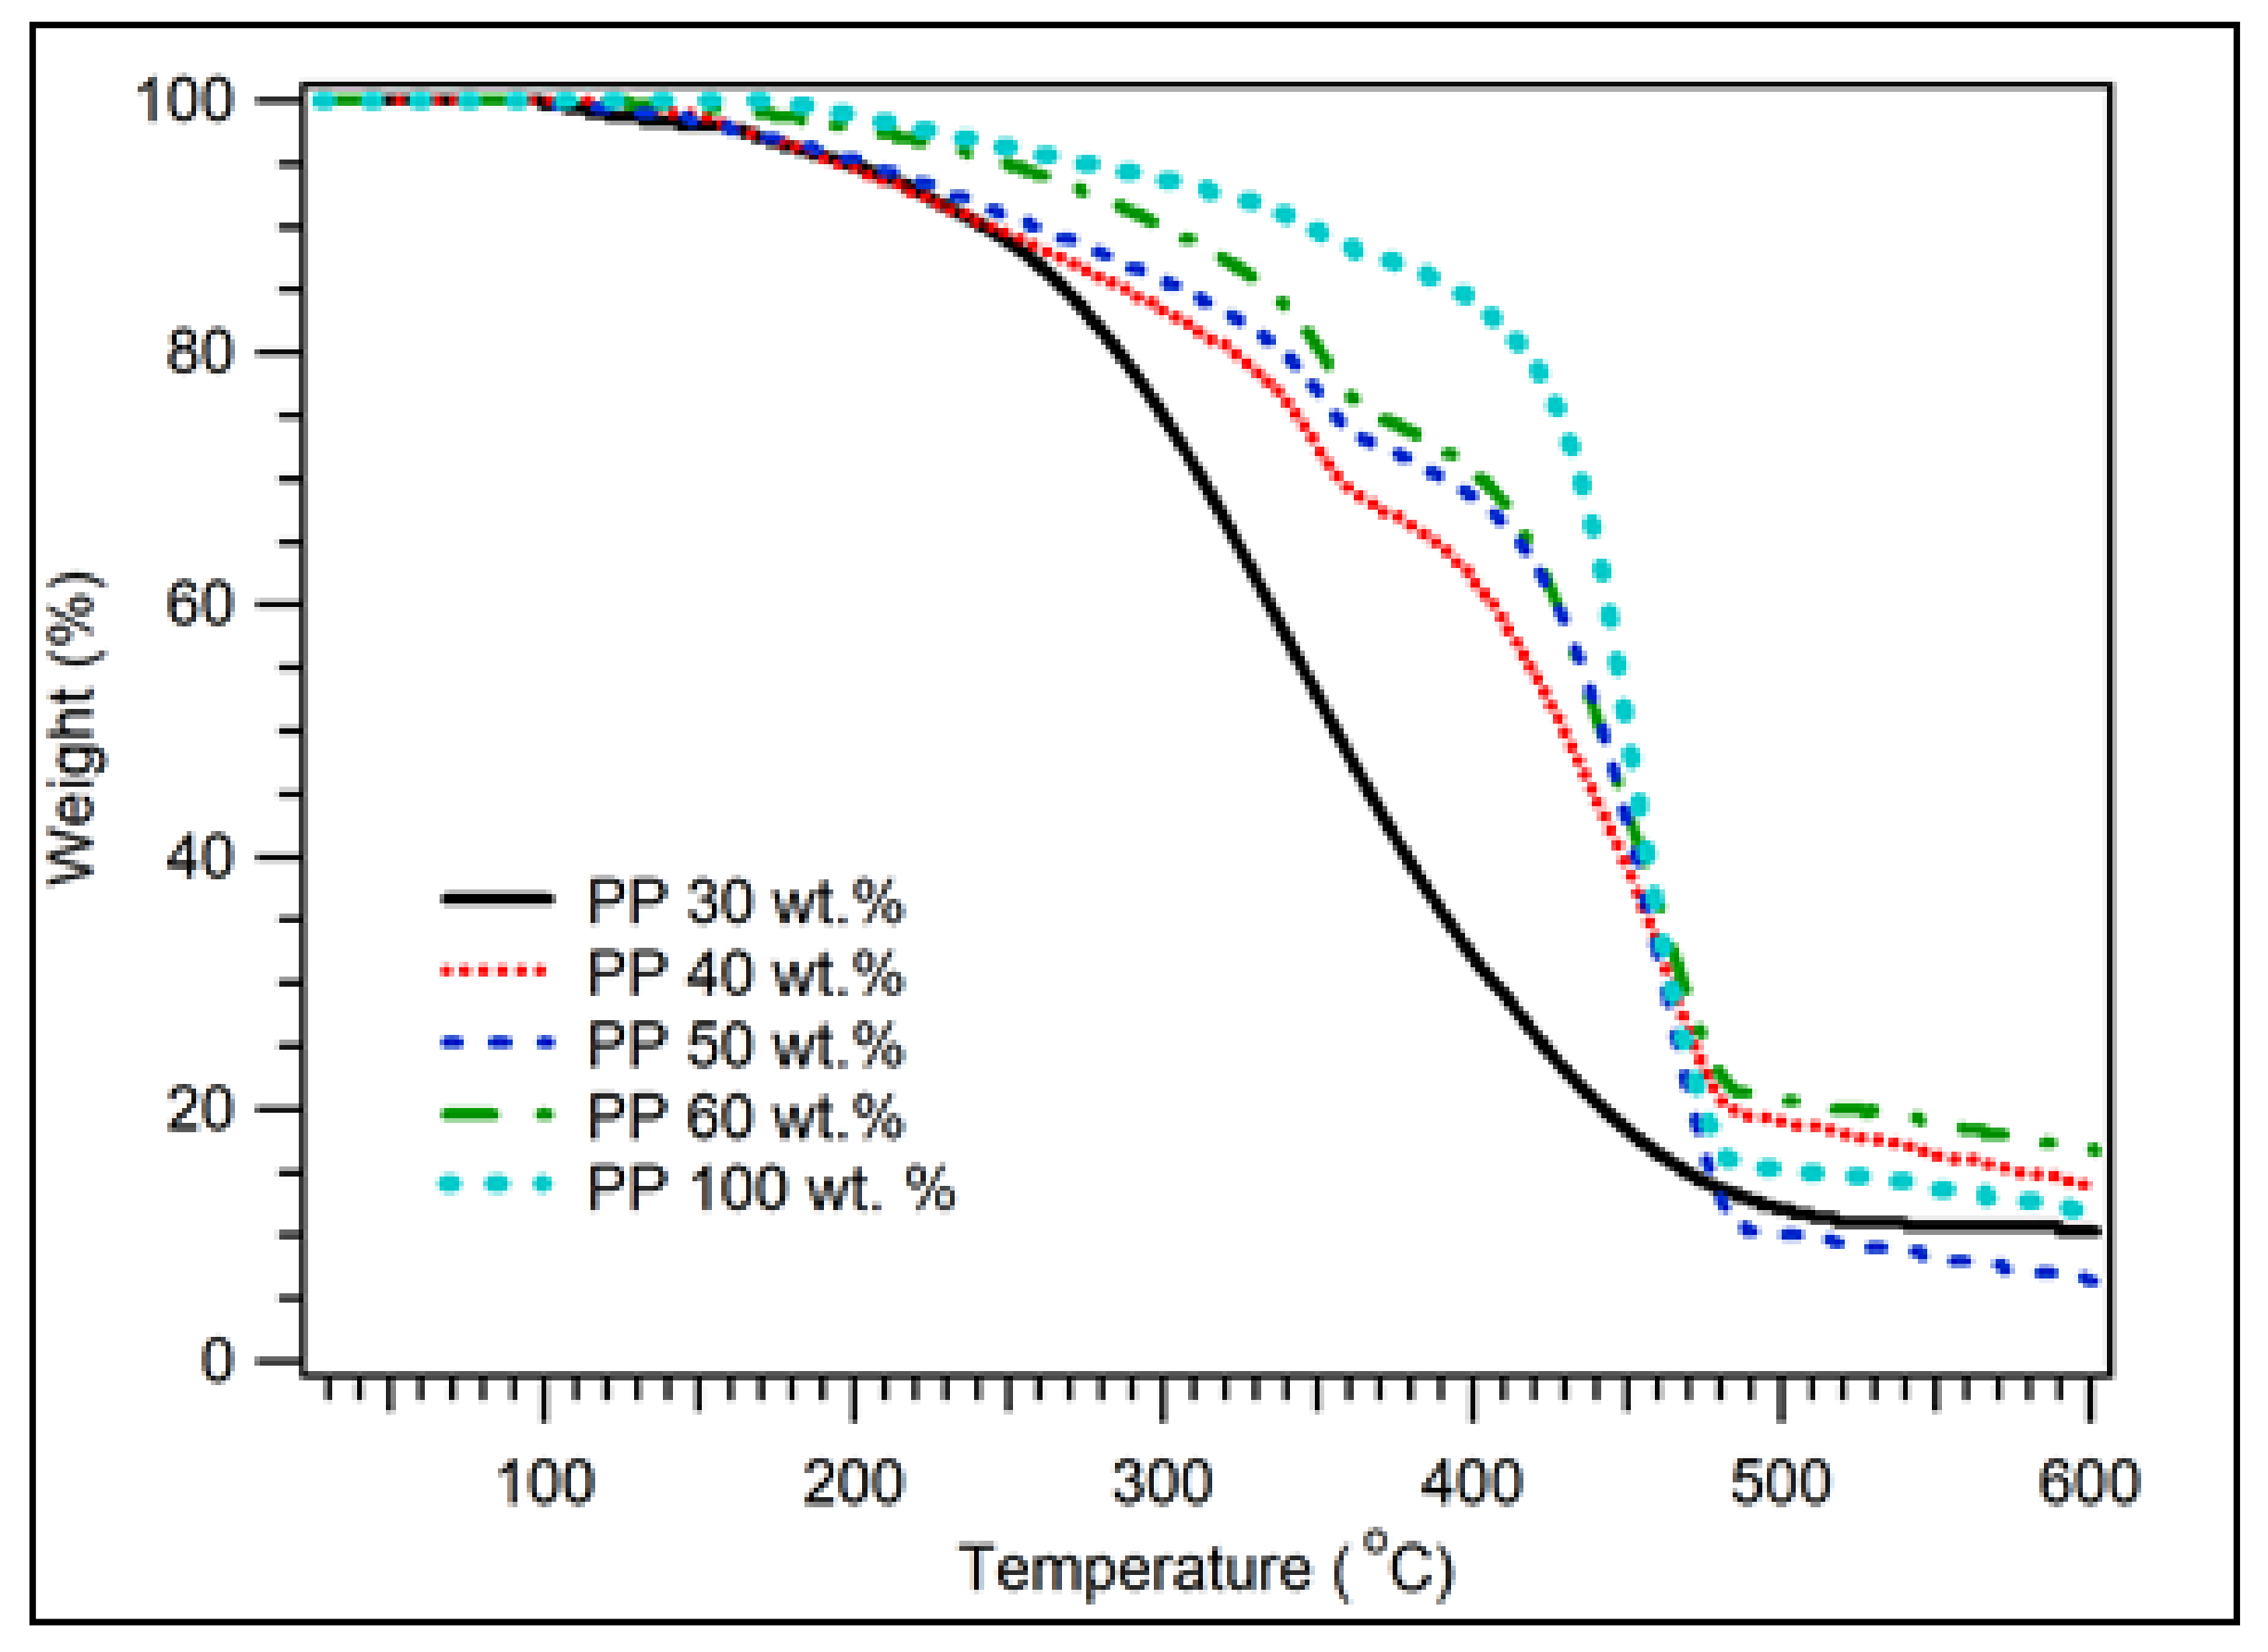
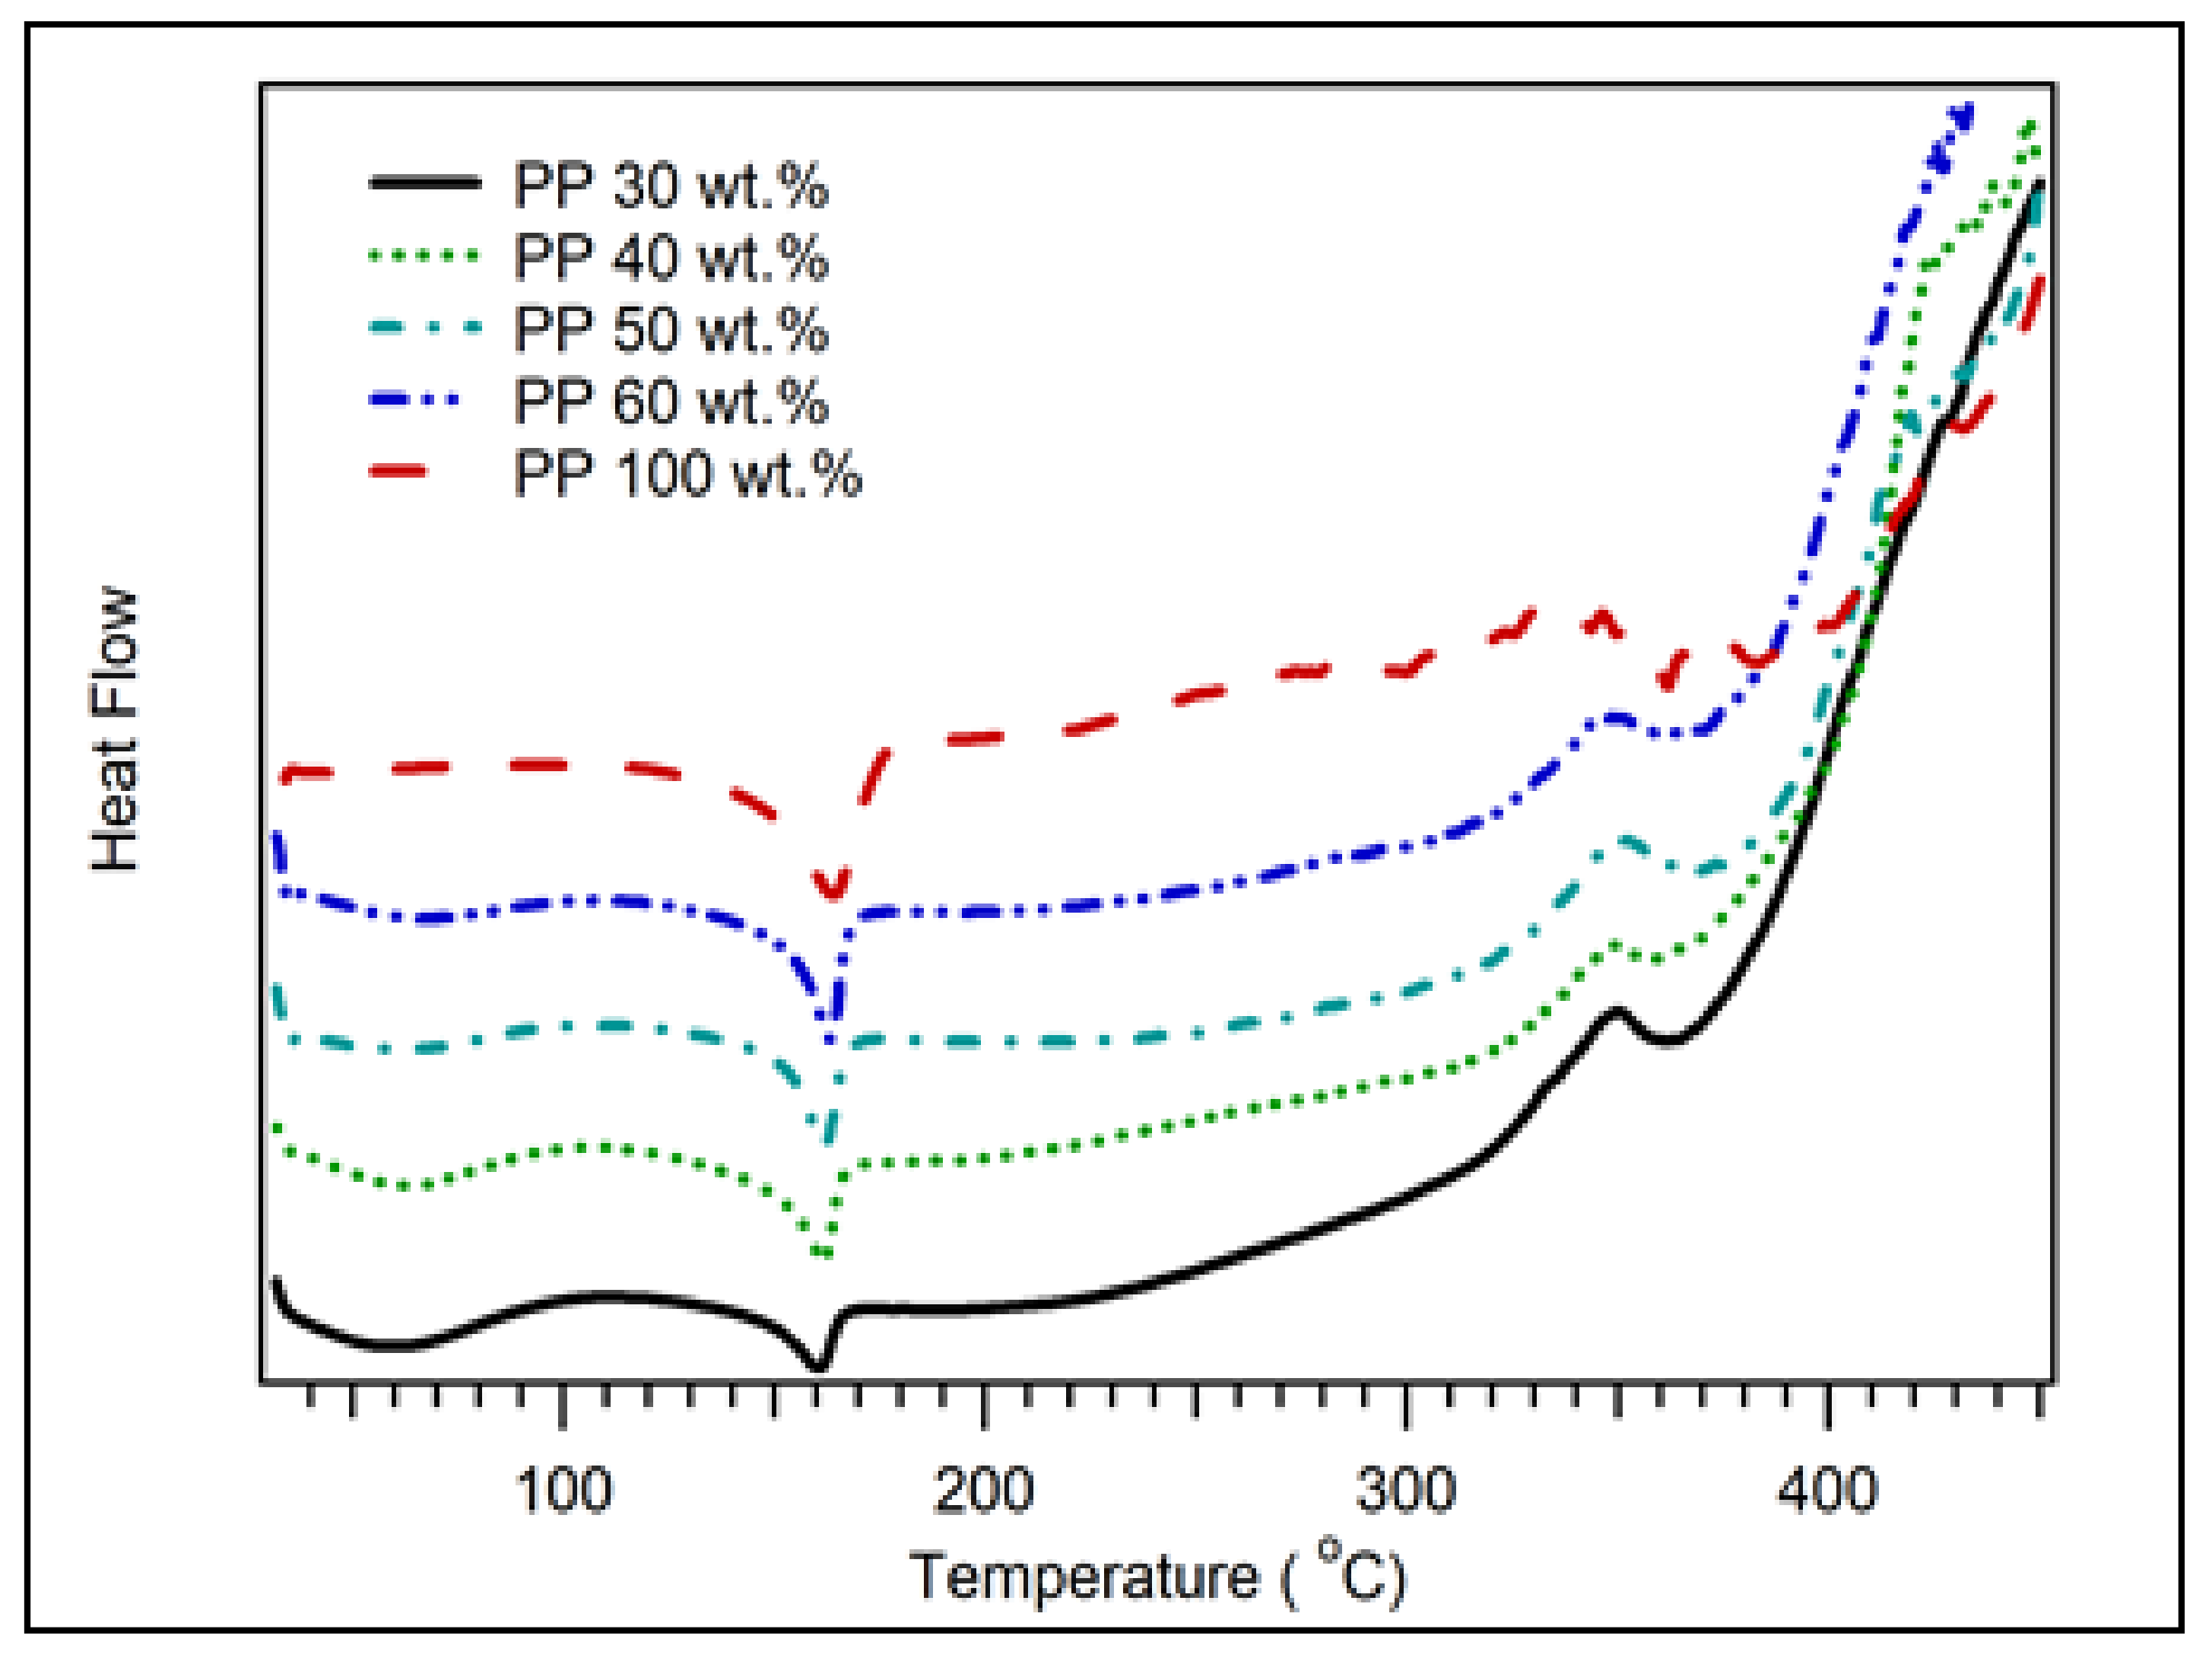
3.1.3. Thermal Properties
3.1.4. Morphological Properties
3.2. Properties of Biocomposite with Varying Particle Size
3.2.1. Physical Properties
3.2.2. Mechanical Properties
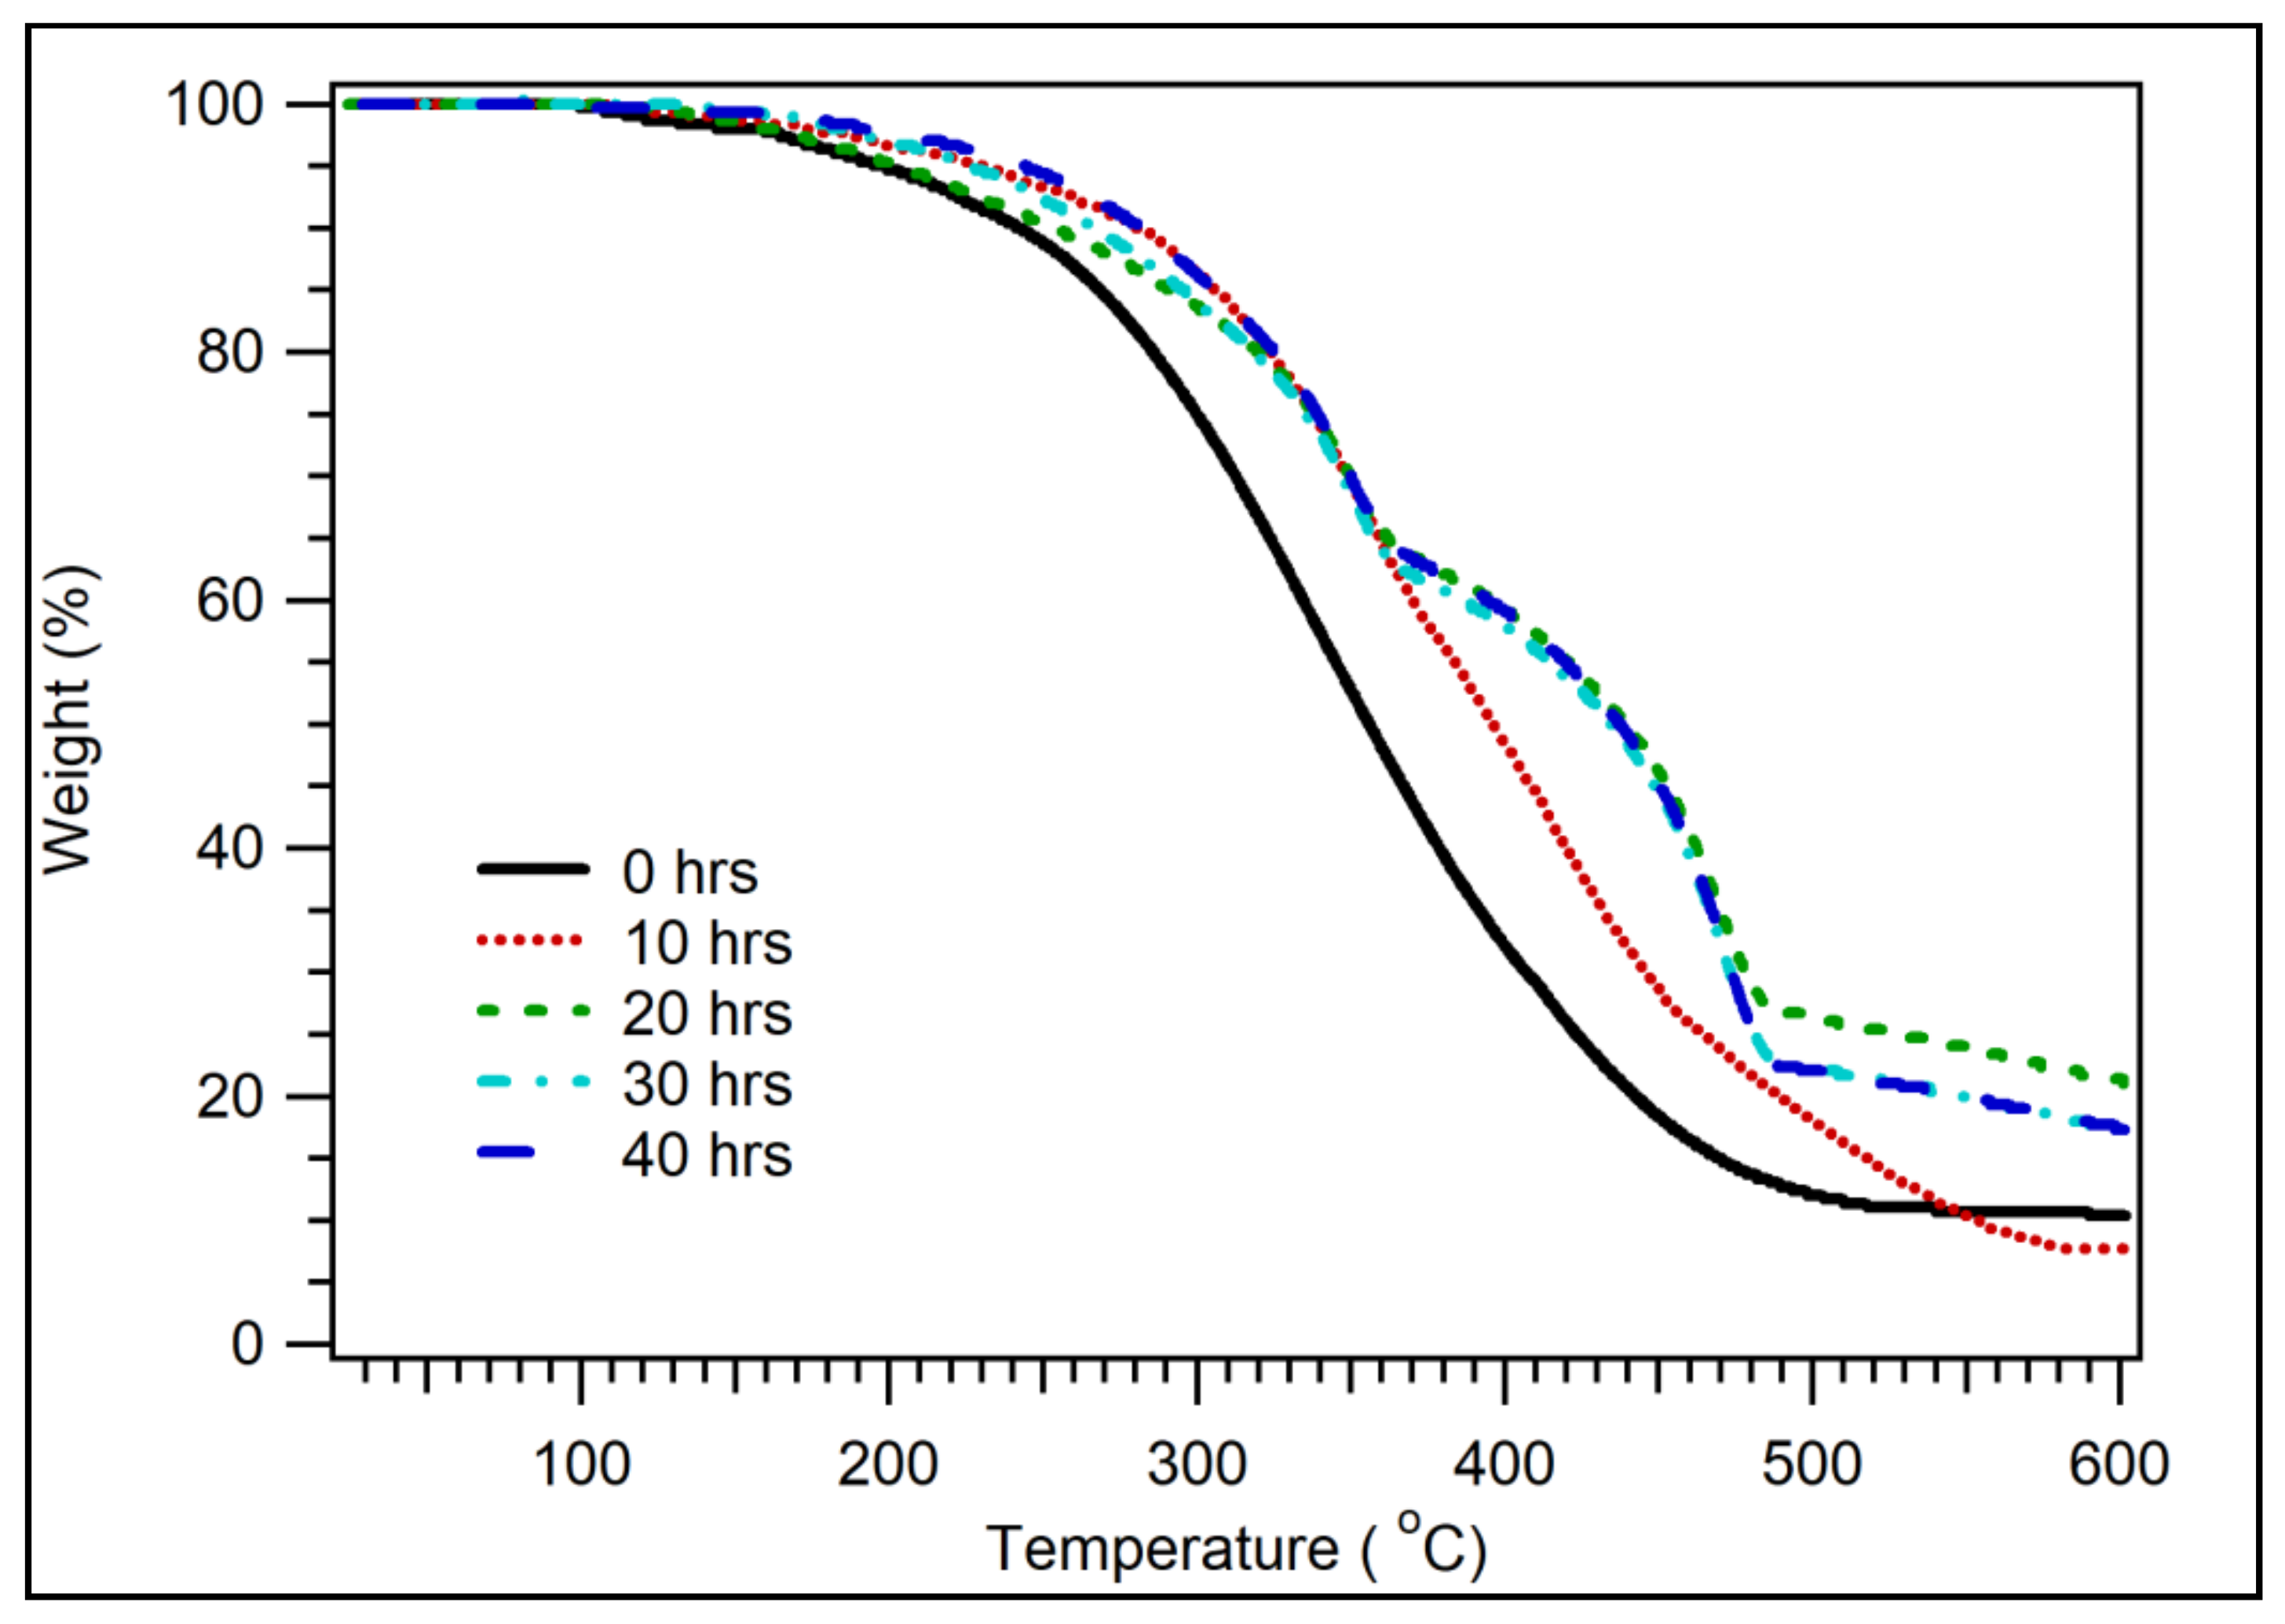
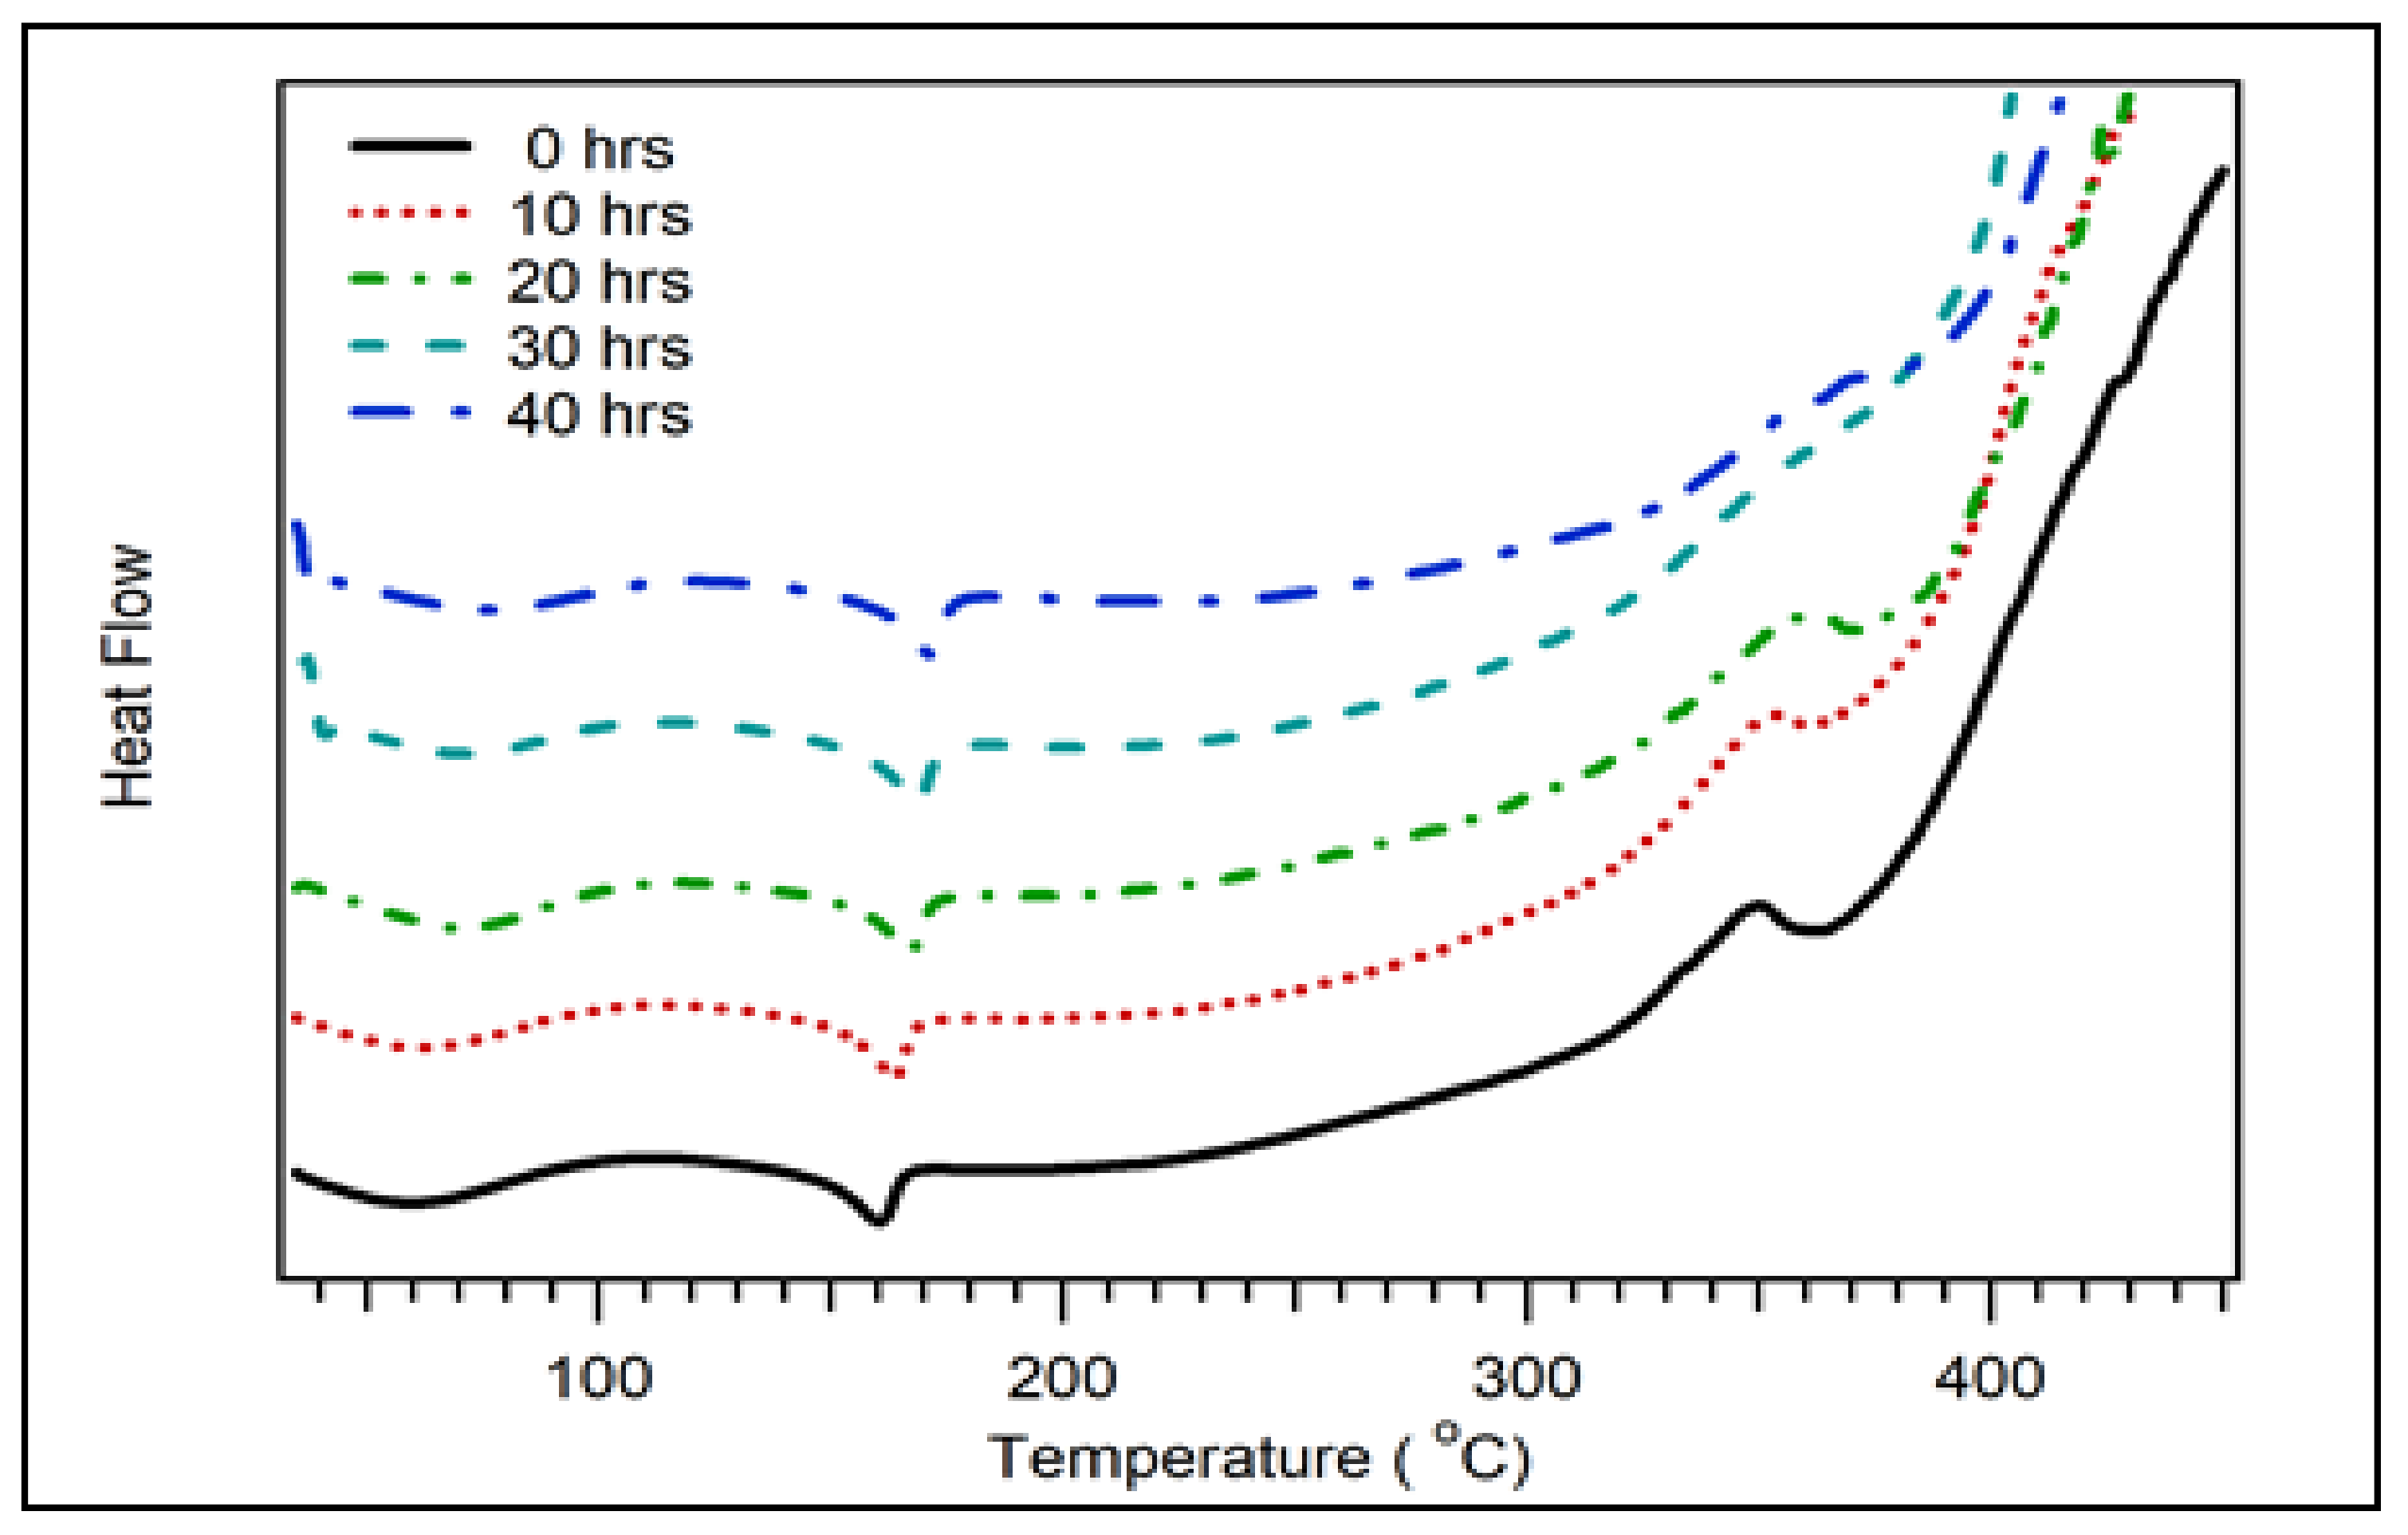
3.2.3. Thermal Properties
3.2.4. Morphological Properties
4. Conclusions
Author Contributions
Funding
Institutional Review Board Statement
Informed Consent Statement
Data Availability Statement
Acknowledgments
Conflicts of Interest
Appendix A

| Physical Properties | Sum of Squares | df | Mean Square | F | Sig. | ||
|---|---|---|---|---|---|---|---|
| Density | Levene Statistic df1 df2 Sig. | 0.495 4 20 0.740 | |||||
| Between Groups | 0.044 | 4 | 0.011 | 21.800 | 0.000 | ||
| Within Groups | 0.010 | 20 | 0.000 | ||||
| Total | 0.054 | 24 | |||||
| Thickness Swelling | Levene Statistic df1 df2 Sig. | 0.993 4 20 0.434 | |||||
| Between Groups | 21.006 | 4 | 5.251 | 54.138 | 0.000 | ||
| Within Groups | 1.940 | 20 | 0.097 | ||||
| Total | 22.946 | 24 | |||||
| Porosity | Levene Statistic df1 df2 Sig. | 0.899 4 20 0.483 | |||||
| Between Groups | 117.322 | 4 | 29.331 | 155.353 | 0.000 | ||
| Within Groups | 3.776 | 20 | 0.189 | ||||
| Total | 121.098 | 24 | |||||
| Mechanical Properties | Sum of Squares | df | Mean Square | F | Sig. | ||
|---|---|---|---|---|---|---|---|
| Flexural Strength | Levene Statistic df1 df2 Sig. | 0.799 4 20 0.540 | |||||
| Between Groups | 59.230 | 4 | 14.808 | 27.407 | 0.000 | ||
| Within Groups | 10.806 | 20 | 0.540 | ||||
| Total | 70.036 | 24 | |||||
| Flexural Modulus | Levene Statistic df1 df2 Sig. | 1.418 4 20 0.264 | |||||
| Between Groups | 2.975 | 4 | 0.744 | 36.774 | 0.000 | ||
| Within Groups | 0.405 | 20 | 0.020 | ||||
| Total | 3.380 | 24 | |||||
| Compressive Strength | Levene Statistic df1 df2 Sig. | 0.233 4 20 0.917 | |||||
| Between Groups | 53.382 | 4 | 13.346 | 56.935 | 0.000 | ||
| Within Groups | 4.688 | 20 | 0.234 | ||||
| Total | 58.070 | 24 | |||||
| Physical Properties | Sum of Squares | df | Mean Square | F | Sig. | ||
|---|---|---|---|---|---|---|---|
| Density | Levene Statistic df1 df2 Sig. | 1.793 4 20 0.170 | |||||
| Between Groups | 0.054 | 4 | 0.014 | 21.938 | 0.000 | ||
| Within Groups | 0.012 | 20 | 0.001 | ||||
| Total | 0.066 | 24 | |||||
| Thickness Swelling | Levene Statistic df1 df2 Sig. | 1.388 4 20 0.274 | |||||
| Between Groups | 8.046 | 4 | 2.011 | 28.571 | 0.000 | ||
| Within Groups | 1.408 | 20 | 0.070 | ||||
| Total | 9.454 | 24 | |||||
| Porosity | Levene Statistic df1 df2 Sig. | 1.152 4 20 0.361 | |||||
| Between Groups | 72.290 | 4 | 18.072 | 117.353 | 0.000 | ||
| Within Groups | 3.080 | 20 | 0.154 | ||||
| Total | 75.370 | 24 | |||||
| Mechanical Properties | Sum of Squares | df | Mean Square | F | Sig. | ||
|---|---|---|---|---|---|---|---|
| Flexural Strength | Levene Statistic df1 df2 Sig. | 1.298 4 20 0.305 | |||||
| Between Groups | 48.019 | 4 | 12.005 | 39.028 | 0.000 | ||
| Within Groups | 6.152 | 20 | 0.308 | ||||
| Total | 54.171 | 24 | |||||
| Flexural Modulus | Levene Statistic df1 df2 Sig. | 0.621 4 20 0.653 | |||||
| Between Groups | 5.723 | 4 | 1.431 | 102.017 | 0.000 | ||
| Within Groups | 0.280 | 20 | 0.014 | ||||
| Total | 6.004 | 24 | |||||
| Compressive Strength | Levene Statistic df1 df2 Sig. | 0.530 4 20 0.715 | |||||
| Between Groups | 456.262 | 4 | 114.065 | 228.771 | 0.000 | ||
| Within Groups | 9.972 | 20 | 0.499 | ||||
| Total | 466.234 | 24 | |||||
References
- Chen, Y.; Zheng, K.; Niu, L.; Zhang, Y.; Liu, Y.; Wang, C.; Chu, F. Highly mechanical properties nanocomposite hydrogels with biorenewable lignin nanoparticles. Int. J. Biol. Macromol. 2019, 128, 414–420. [Google Scholar] [CrossRef] [PubMed]
- Zheng, D.; Zhang, Y.; Guo, Y.; Yue, J. Isolation and characterization of nanocellulose with a novel shape from walnut (Juglans Regia L.) shell agricultural waste. Polymers 2019, 11, 1130. [Google Scholar] [CrossRef] [PubMed] [Green Version]
- Kai, D.; Chong, H.M.; Chow, L.P.; Jiang, L.; Lin, Q.; Zhang, K.; Zhang, H.; Zhang, Z.; Loh, X.J. Strong and biocompatible lignin/poly (3-hydroxybutyrate) composite nanofibers. Compos. Sci. Technol. 2018, 158, 26–33. [Google Scholar] [CrossRef]
- Mohanty, A.K.; Vivekanandhan, S.; Pin, J.-M.; Misra, M. Composites from renewable and sustainable resources: Challenges and innovations. Science 2018, 362, 536–542. [Google Scholar] [CrossRef] [PubMed] [Green Version]
- Mu, L.; Shi, Y.; Hua, J.; Zhuang, W.; Zhu, J. Engineering hydrogen bonding interaction and charge separation in bio-polymers for green lubrication. J. Phys. Chem. B 2017, 121, 5669–5678. [Google Scholar] [CrossRef] [PubMed]
- Faruk, O.; Bledzki, A.K.; Fink, H.-P.; Sain, M. Biocomposites reinforced with natural fibers: 2000–2010. Prog. Polym. Sci. 2012, 37, 1552–1596. [Google Scholar] [CrossRef]
- Nagalakshmaiah, M.; Afrin, S.; Malladi, R.P.; Elkoun, S.; Robert, M.; Ansari, M.A.; Svedberg, A.; Karim, Z. Biocomposites: Present trends and challenges for the future. In Green Composites for Automotive Applications; Elsevier: Amsterdam, The Netherlands, 2019; pp. 197–215. [Google Scholar]
- Motaleb, K.; Ahad, A.; Laureckiene, G.; Milasius, R. Innovative Banana Fiber Nonwoven Reinforced Polymer Composites: Pre-and Post-Treatment Effects on Physical and Mechanical Properties. Polymers 2021, 13, 3744. [Google Scholar] [CrossRef]
- Sherwani, S.; Zainudin, E.; Sapuan, S.; Leman, Z.; Abdan, K. Mechanical properties of sugar palm (Arenga pinnata Wurmb. Merr)/glass fiber-reinforced poly (lactic acid) hybrid composites for potential use in motorcycle components. Polymers 2021, 13, 3061. [Google Scholar] [CrossRef]
- Dordevic, D.; Necasova, L.; Antonic, B.; Jancikova, S.; Tremlová, B. Plastic cutlery alternative: Case study with biodegradable spoons. Foods 2021, 10, 1612. [Google Scholar] [CrossRef]
- Hasan, K.; Horváth, P.G.; Alpár, T. Potential natural fiber polymeric nanobiocomposites: A review. Polymers 2020, 12, 1072. [Google Scholar] [CrossRef]
- Alsewailem, F.D.; Binkhder, Y.A. Effect of Coupling Agent on the Properties of Polymer/Date Pits Composites. J. Compos. 2014, 2014, 412432. [Google Scholar] [CrossRef]
- The Science Agriculture. Available online: https://scienceagri.com/10-worlds-largest-coconut-producing-countries (accessed on 8 November 2021).
- Bledzki, A.K.; Mamun, A.A.; Volk, J. Barley husk and coconut shell reinforced polypropylene composites: The effect of fibre physical, chemical and surface properties. Compos. Sci. Technol. 2010, 70, 840–846. [Google Scholar] [CrossRef]
- Singh, A.; Singh, S.; Kumar, A. Study of mechanical properties and absorption behaviour of coconut shell powder-epoxy composites. Int. J. Mater. Sci. Appl. 2013, 2, 157–161. [Google Scholar] [CrossRef]
- Bhaskar, J.; Singh, V. Physical and mechanical properties of coconut shell particle reinforced-epoxy composite. J. Mater. Environ. Sci. 2013, 4, 227–232. [Google Scholar]
- Kumar, R.; Singh, T.; Singh, H. Solid waste-based hybrid natural fiber polymeric composites. J. Reinf. Plast. Compos. 2015, 34, 1979–1985. [Google Scholar] [CrossRef]
- Vasu, A.; Reddy, C.; Danaboyina, S.; Manchala, G.; Chavali, M. The Improvement in mechanical properties of coconut shell powder as filter in HDPE composites. J. Polym. Sci. Appl. 2017, 2, 2. [Google Scholar]
- Agunsoye, J.O.; Bello, S.A.; Azeez, S.O.; Yekinni, A.A.; Adeyemo, R.G. Recycled Polypropylene Reinforced Coconut Shell Composite: Surface Treatment Morphological, Mechanical and Thermal Studies. Int. J. Compos. Mater. 2014, 4, 168–178. [Google Scholar]
- Bello, S.A.; Agunsoye, J.O.; Hassan, S.B. Synthesis of coconut shell nanoparticles via a top down approach: Assessment of milling duration on the particle sizes and morphologies of coconut shell nanoparticles. Mater. Lett. 2015, 159, 514–519. [Google Scholar] [CrossRef]
- Obasi, H.C.; Mark, U.C.; Mark, U. Improving the mechanical properties of polypropylene composites with coconut shell particles. Compos. Adv. Mater. 2021, 30, 26349833211007497. [Google Scholar] [CrossRef]
- Kirby, M.; Lewis, B.; Peterson, B.; Anggono, J.; Bradley, W. The Effect of Coconut Shell Powder as Functional Filler in Polypropylene during Compounding and Subsequent Molding. E3S Web. Conf. 2019, 130, 01021. [Google Scholar] [CrossRef]
- Borrelle, S.B.; Ringma, J.; Law, K.L.; Monnahan, C.C.; Lebreton, L.; McGivern, A.; Murphy, E.; Jambeck, J.; Leonard, G.H.; Hilleary, M.A. Predicted growth in plastic waste exceeds efforts to mitigate plastic pollution. Science 2020, 369, 1515–1518. [Google Scholar] [CrossRef] [PubMed]
- MacArthur, E. Beyond plastic waste. Science 2017, 358, 843. [Google Scholar] [CrossRef] [PubMed] [Green Version]
- Alsabri, A.; Tahir, F.; Al-Ghamdi, S.G. Environmental impacts of polypropylene (PP) production and prospects of its recycling in the GCC region. Mater. Today Proc. 2021; in press. [Google Scholar] [CrossRef]
- Chun, K.S.; Husseinsyah, S.; Azizi, F.N. Characterization and properties of recycled polypropylene/coconut shell powder composites: Effect of sodium dodecyl sulfate modification. Polym. Plast. Technol. Eng. 2013, 52, 287–294. [Google Scholar] [CrossRef]
- Muller, J.; González-Martínez, C.; Chiralt, A. Combination of poly (lactic) acid and starch for biodegradable food packaging. Materials 2017, 10, 952. [Google Scholar] [CrossRef]
- Alwani, M.S.; Abdul Khalil, H.P.S.; Asniza, M.; Suhaily, S.; Amiranajwa, A.N.; Jawaid, M. Agricultural biomass raw materials: The current state and future potentialities. In Biomass Bioenergy; Springer: Cham, Switzerland, 2014; pp. 77–100. [Google Scholar]
- Atiqah, M.; Gopakumar, D.A.; Owolabi, F.A.T.; Pottathara, Y.B.; Rizal, S.; Aprilia, N.; Hermawan, D.; Paridah, M.; Thomas, S.; Abdul Khalil, H.P.S. Extraction of Cellulose Nanofibers via Eco-friendly Supercritical Carbon Dioxide Treatment Followed by Mild Acid Hydrolysis and the Fabrication of Cellulose Nanopapers. Polymers 2019, 11, 1813. [Google Scholar] [CrossRef] [Green Version]
- Abdul Khalil, H.P.S.; Adnan, A.; Yahya, E.B.; Olaiya, N.; Safrida, S.; Hossain, M.; Balakrishnan, V.; Gopakumar, D.A.; Abdullah, C.; Oyekanmi, A. A Review on plant cellulose nanofibre-based aerogels for biomedical applications. Polymers 2020, 12, 1759. [Google Scholar] [CrossRef]
- Abdullah, C.; Ismail, I.; Nurul Fazita, M.; Olaiya, N.; Nasution, H.; Oyekanmi, A.; Nuryawan, A.; Abdul Khalil, H.P.S. Properties and Interfacial Bonding Enhancement of Oil Palm Bio-Ash Nanoparticles Biocomposites. Polymers 2021, 13, 1615. [Google Scholar] [CrossRef]
- Ismail, I.; Arliyani; Jalil, Z.; Olaiya, N.; Abdullah, C.; Fazita, M.; Abdul Khalil, H.P.S. Properties and Characterization of New Approach Organic Nanoparticle-Based Biocomposite Board. Polymers 2020, 12, 2236. [Google Scholar] [CrossRef]
- Hewitt, S.A.; Kibble, K.A. Effects of ball milling time on the synthesis and consolidation of nanostructured W.C.–Co composites. Int. J. Refract. Met. Hard Mater. 2009, 27, 937–948. [Google Scholar] [CrossRef]
- Singh, P.; Abhash, A.; Yadav, B.; Shafeeq, M.; Singh, I.; Mondal, D. Effect of milling time on powder characteristics and mechanical performance of Ti4wt% Al alloy. Powder Technol. 2019, 342, 275–287. [Google Scholar] [CrossRef]
- Sitorus, R.; Wirjosentono, B.; Tamrin; Siregar, A.H.; Nasution, D.A. Characteristics of maleic anhydride-modified polystyrene and natural rubber blends containing “Talang” bamboo powder as sound damping material. Proc. AIP Conf. Proc. 2020, 2267, 020050. [Google Scholar]
- Bonilla-Cruz, J.; Hernández-Mireles, B.; Mendoza-Carrizales, R.; Ramírez-Leal, L.A.; Torres-Lubián, R.; RamosdeValle, L.F.; Paul, D.R.; Saldívar-Guerra, E. Chemical modification of butyl rubber with maleic anhydride via nitroxide chemistry and its application in polymer blends. Polymers 2017, 9, 63. [Google Scholar] [CrossRef] [PubMed] [Green Version]
- Lubis, M.R.; Maimun, T.; Kardi, J.; Masra, R.B. Characterizing particle board made of oil palm empty fruit bunch using central composite design. Makara J. Sci. 2018, 22, 3. [Google Scholar] [CrossRef]
- Tai, Y.; Qian, J.; Zhang, Y.; Huang, J. Study of surface modification of nano-SiO2 with macromolecular coupling agent (LMPB-g-MAH). Biochem. Eng. J. 2008, 141, 354–361. [Google Scholar] [CrossRef]
- González-López, M.; Robledo-Ortíz, J.; Manríquez-González, R.; Silva-Guzmán, J.; Pérez-Fonseca, A. Polylactic acid functionalization with maleic anhydride and its use as coupling agent in natural fiber biocomposites: A review. Compos. Interfaces 2018, 25, 515–538. [Google Scholar] [CrossRef]
- Severini, F.; Pegoraro, M.; Yuan, L.; Ricca, G.; Fanti, N. Free radical grafting of maleic anhydride in vapour phase on polypropylene film. Polymer 1999, 40, 7059–7064. [Google Scholar] [CrossRef]
- Obiukwu, O.; Uchechukwu, M.; Nwaogwugwu, M. Study on the properties of coconut shell powder reinforced high-density polyethylene composite. Futo J. Ser 2016, 2, 43–55. [Google Scholar]
- Kada, D.; Migneault, S.; Tabak, G.; Koubaa, A. Physical and mechanical properties of polypropylene-wood-carbon fiber hybrid composites. BioResources 2016, 11, 1393–1406. [Google Scholar] [CrossRef] [Green Version]
- Shayuti, M.S.M.; Abdullah, M.Z.; Yusoff, P. Compressive properties and morphology of polypropylene/polycarbonate blends. In Proceedings of the International Conference on Environment and Industrial Innovation (ICEII 2011), Kuala Lumpur, Malaysia, 4–5 June 2011. [Google Scholar]
- Ismail, I.; Fitri, N.; Zulfalina; Fadzullah, S.H.S.M. Evaluation possibilities to utilize rice straw and plastic waste for particleboard. IOP Conf. Series J. Phys. 2018, 1120, 012015. [Google Scholar] [CrossRef] [Green Version]
- Liyanage, C.D.; Pieris, M. A physico-chemical analysis of coconut shell powder. Procedia Chem. 2015, 16, 222–228. [Google Scholar] [CrossRef] [Green Version]


| Sample No. | Particle Size (Mesh) | CSP (wt.%) | PP (wt.%) |
|---|---|---|---|
| A1 | 200 | 70 (210 g) | 30 (90 g) |
| A2 | 200 | 60 (180 g) | 40 (120 g) |
| A3 | 200 | 50 (150 g) | 50 (150 g) |
| A4 | 200 | 40 (120 g) | 60 (180 g) |
| A5 | 200 | 0 (0 g) | 100 (300 g) |
| Sample Weight (%) | Decomposition Temperature (°C) | ||||
|---|---|---|---|---|---|
| PP 30 wt.% | PP 40 wt.% | PP 50 wt.% | PP 60 wt.% | PP 100 wt.% | |
| 95 | 199 | 195 | 202 | 249 | 275 |
| 90 | 242 | 245 | 260 | 300 | 346 |
| 80 | 286 | 323 | 339 | 351 | 417 |
| 50 | 356 | 429 | 441 | 442 | 450 |
| 20 | 443 | 480 | 471 | 500 | 474 |
| PP Composition (wt.%) | Tg (°C) | Tm (°C) | Td (°C) |
|---|---|---|---|
| 30 | 60 | 160 | 350 |
| 40 | 62 | 161 | 350 |
| 50 | 57 | 161 | 350 |
| 60 | 57 | 162 | 346 |
| 100 | - | 164 | 340 |
| Composition of PP | SEM | AFM |
|---|---|---|
| 30 wt.% |  |  |
| 40 wt.% |  |  |
| 50 wt.% |  |  |
| 60 wt.% |  |  |
| 100 wt.% |  |  |
| Duration of Milling | TEM | XRD Spectra | Crystallite Size (nm) |
|---|---|---|---|
| 0 h |  |  | 80 |
| 10 h |  |  | 48 |
| 20 h |  |  | 45 |
| 30 h |  |  | 42 |
| 40 h |  |  | 30 |
| Sample Weight (%) | Decomposition Temperature (°C) | ||||
|---|---|---|---|---|---|
| 0 h | 10 h | 20 h | 30 h | 40 h | |
| 95 | 199 | 225 | 205 | 226 | 243 |
| 90 | 242 | 275 | 253 | 267 | 281 |
| 80 | 286 | 323 | 321 | 318 | 325 |
| 50 | 356 | 396 | 439 | 435 | 438 |
| 20 | 443 | 489 | 600 | 544 | 547 |
| Milling Time | Tg (°C) | Tm (°C) | Td (°C) |
|---|---|---|---|
| 0 h | 60 | 160 | 350 |
| 10 h | 65 | 162 | 352 |
| 20 h | 70 | 165 | 359 |
| 30 h | 70 | 167 | - |
| 40 h | 75 | 172 | - |
| Duration of Milling | SEM | AFM |
|---|---|---|
| 0 h |  |  |
| 10 h |  |  |
| 20 h |  |  |
| 30 h |  |  |
| 40 h |  |  |
Publisher’s Note: MDPI stays neutral with regard to jurisdictional claims in published maps and institutional affiliations. |
© 2022 by the authors. Licensee MDPI, Basel, Switzerland. This article is an open access article distributed under the terms and conditions of the Creative Commons Attribution (CC BY) license (https://creativecommons.org/licenses/by/4.0/).
Share and Cite
Ismail, I.; Aini, Q.; Jalil, Z.; Olaiya, N.G.; Mursal, M.; Abdullah, C.K.; H.P.S., A.K. Properties Enhancement Nano Coconut Shell Filled in Packaging Plastic Waste Bionanocomposite. Polymers 2022, 14, 772. https://0-doi-org.brum.beds.ac.uk/10.3390/polym14040772
Ismail I, Aini Q, Jalil Z, Olaiya NG, Mursal M, Abdullah CK, H.P.S. AK. Properties Enhancement Nano Coconut Shell Filled in Packaging Plastic Waste Bionanocomposite. Polymers. 2022; 14(4):772. https://0-doi-org.brum.beds.ac.uk/10.3390/polym14040772
Chicago/Turabian StyleIsmail, Ismail, Quratul Aini, Zulkarnain Jalil, Niyi Gideon Olaiya, Mursal Mursal, C.K. Abdullah, and Abdul Khalil H.P.S. 2022. "Properties Enhancement Nano Coconut Shell Filled in Packaging Plastic Waste Bionanocomposite" Polymers 14, no. 4: 772. https://0-doi-org.brum.beds.ac.uk/10.3390/polym14040772