Article

Comparison of Biochemical, Anatomical, Morphological, and Physiological Responses to Salinity Stress in Wheat and Barley Genotypes Deferring in Salinity Tolerance

1
Institute of Crop Science, Department of Agronomy, College of Agriculture and Biotechnology, Zijingang Campus, Zhejiang University, Hangzhou 310058, China
2
Jiangsu Co-Innovation Center for Modern Production Technology of Grain Crops, Yangzhou University, Yangzhou 225009, China
3
Australian Grain Technologies, Narrabri, NSW 2390, Australia
4
School of Science and Health, Western Sydney University, Penrith, NSW 2751, Australia
*
Author to whom correspondence should be addressed.
Submission received: 27 November 2019 / Revised: 8 January 2020 / Accepted: 9 January 2020 / Published: 15 January 2020

Abstract

:
A greenhouse hydroponic experiment was performed using salt-tolerant (cv. Suntop) and -sensitive (Sunmate) wheat cultivars and a salt-tolerant barley cv. CM72 to evaluate how cultivar and species differ in response to salinity stress. Results showed that wheat cv. Suntop performed high tolerance to salinity, being similar tolerance to salinity with CM72, compared with cv. Sunmate. Similar to CM72, Suntop recorded less salinity induced increase in malondialdehyde (MDA) accumulation and less reduction in plant height, net photosynthetic rate (Pn), chlorophyll content, and biomass than in sensitive wheat cv. Sunmate. Significant time-course and cultivar-dependent changes were observed in the activities of antioxidant enzymes such as superoxide dismutase (SOD), peroxidase (POD), catalase (CAT), ascorbate peroxidase (APX), and glutathione reductase (GR) in roots and leaves after salinity treatment. Higher activities were found in CM72 and Suntop compared to Sunmate. Furthermore, a clear modification was observed in leaf and root ultrastructure after NaCl treatment with more obvious changes in the sensitive wheat cv. Sunmate, rather than in CM72 and Suntop. Although differences were observed between CM72 and Suntop in the growth and biochemical traits assessed and modified by salt stress, the differences were negligible in comparison with the general response to the salt stress of sensitive wheat cv. Sunmate. In addition, salinity stress induced an increase in the Na+ and Na+/K+ ratio but a reduction in K+ concentrations, most prominently in Sunmate and followed by Suntop and CM72.

1. Introduction

Saline soils are a major problem in many countries with the Environment Program of United Nations estimating that of the 9–34% of the world’s irrigated land is adversely affected by salinity [1]. Salinity can kill plants and other soil organisms and is referred to as a “silent killer” in some regions or as “white death” in others as it invokes images of a lifeless, shining land studded with dead trees. Approximately 32 million ha of dry lands [2] and 60 million ha of irrigated land [3] are affected by human-induced soil salinization, and it is well documented that salinity is one of the most severe environmental stresses hampering crop production [4,5]. At high electrical conductivity (EC) resulting from salinization, crop yields can decline drastically rendering crop cultivation no longer profitable and making soil amendments inevitable [6]. World agriculture needs to feed about 2.3 billion people globally by 2050 [7]; thus, it is imperative to understand the mechanisms associated with tolerance to salinity so that breeding programs and agronomic practices can be put in place that will allow production to meet this increasing demand [8].
Saline soils limit plant growth due to osmotic stress, ionic toxicity, and a reduced ability to take up essential minerals [9,10]. In extreme cases, root cells may lose water instead of absorbing it due to the hyperosmotic pressure of the soil solution. Water deficits affect a cascade of physical, signaling, gene expression, biochemical, and physiological pathways and processes, resulting in decreased cell elongation, wilting, and, ultimately, plant death; these harmful effects of salinity can be considered as water-deficit effects [3,11,12]. In saline soils, NaCl comprises 50–80% of the total soluble salts [13] causing elevated, and potentially toxic, concentrations of Na+ and/or Cl in the plant. These ions affect many enzymes or cellular functions such as photosynthesis signaling systems [14,15,16]. In addition, because of their physicochemical similarities and a shared transport system, the Na+ in the soil solution of saline soils competes for uptake with K+ [17] and can lead to K+ deficiency [18,19]. The induced K+ deficiency inhibits growth because it plays a critical role in maintaining cell turgor, membrane potentials, and enzyme activities.
As a consequence of the primary effects of salinity described above, secondary stresses such as oxidative stress often occurs due to an overproduction of reactive oxygen species (ROS) [20]. These ROS cause lipid peroxidation leading to increased membrane fluidity and permeability [21,22], the denaturation of functional and structural proteins [23], and can affect nucleic acids through base modifications, induce inter- and intra-strand crosslinks, crosslinks with proteins as well as creating strand breaks [24]. However, plants have developed comprehensive internal resistance systems to combat the outcomes of ROS that are comprised of enzymatic as well as non-enzymatic antioxidants [25]. ROS-scavenging enzymes include those that are playing a direct role in the processing of ROS such as superoxide dismutase (SOD), peroxidase (POD), and catalase (CAT), and those glutathione reductase (GR) and ascorbate peroxidases (APX) that mediate in the reaction cycle of antioxidant chemicals such as glutathione (GSH) and ascorbic acid (AsA) [26,27,28,29,30]. The other half of the antioxidant machinery includes nonenzymatic antioxidants comprising of ascorbic acid, phenolic compounds (flavonoids, anthocyanins), α-tocopherol, carotenoids, and amino acid cum osmolyte proline. Besides the synthesis and modulation of osmolytes some phytohormones and regulatory molecules also play prominent role in triggering salinity tolerance effector molecules [31].
Barley and wheat have different salt tolerances capacities and are grown as major grain crops in both saline and non-saline soils [32]. Previous studies have focused on salinity stress in either barley or wheat alone, with little inter-specific comparison. Thus, this study is the first to compare the mechanisms that confer salinity tolerance in these two species. We aimed to explore the similarities or differences in their physiological mechanisms upon exposure to salt stress. We also hypothesized that there may be species-specific mechanisms that can be co-related with the salt sensitivity of wheat or the tolerance of barley. Thus, this research can enhance our understanding of holistic salinity tolerance mechanisms and will aid in the breeding of salt-tolerant crops.

2. Material and Methods

2.1. Plant Material and Growth Conditions

A shade house hydroponic experiment was carried out on the Zijingang Campus, Zhejiang University, China. Two wheat (Triticum aestivum L.) cv. Suntop (salt-tolerant) and Sunmate (salt-sensitive) and a salt-tolerant barley (Hordeum vulgare L.) cv. CM72, were used in the experiment. Suntop and Sunmate are two high yielding Australian Prime Hard varieties bred by Australian Grain Technologies (AGT, Narrabri, Australia. Although they were derived from the same cross, Suntop and Sunmate differ significantly in salt tolerance. Seeds of each cultivar were disinfected in 2% (v/v) H2O2 then washed thoroughly using double distilled water (ddH2O). The seeds were germinated on filter paper in germination boxes in a plant growth chamber (23/18 °C, day/night) in darkness for 3 days and incubated for further 4 days in the light. The uniform 7-day-old seedlings of each cultivar were selected and transplanted into 5 L pots in a hydroponic solution containing 4.5 L basic nutrient solution (BNS) as described by [33,34], with continuous aeration using air pumps. Each container was covered with a polystyrene plate with 7 evenly spaced holes (2 plants per hole) and placed in a greenhouse with natural light and a temperature of 20 ± 2 °C/day and 15 ± 2 °C/night. At the two-leaf stage, plants were treated with 100 mM NaCl; non-NaCl treated plants were used as controls (BNS). The solution pH was adjusted to 5.8 with NaOH or HCl, as required. The experiment was arranged in a randomized block design with four replications. Plants were sampled at 1, 5, 10, and 15 days after treatment (DAT) for time-course analysis of the salt treatments. For morphological and physiological analyses, plants were harvested 25 DAT and either analyzed immediately or frozen in liquid nitrogen and stored at −80 °C for further analysis.

2.2. Measurement of Growth Traits and Mineral Concentrations

Shoot height, root length, and fresh weights were determined 25 DAT (days after treatment) and then the samples were separated into shoot and root and perfectly washed with ddH2O to eliminate any foreign material. Samples from each treatment with 4 biological replicates were oven dried at 75 °C for three days and subsequently, the dry weight of the roots and shoots were determined in gram. Later each dried sample was weighed (about 0.2 g), ground, and made into ashes by heating the samples at 550 °C for half a day. Before dilution with ddH2O, the ashes were digested in 30% HNO3 and then Na+ and K+ concentration were quantified using flame atomic absorption spectrometry (SHIMADZU AA-6300, Columbia, Maryland, USA) [35].

2.3. Measurement of Photosynthesis Parameters, Chlorophyll Contents, and Chlorophyll Fluorescence

Intact, second fully-expanded leaves from the apex were used to measure relative chlorophyll content with the help of a handheld chlorophyll meter (Minolta SPAD-502, Tokyo, Japan) according to Wu et al. [36]. Three measurements were recorded from each leaf and averaged. The gas exchange parameters (i.e., photosynthetic rates (Pn), intercellular CO2 concentrations (Ci), stomatal conductance (Gs), and transpiration rates (Tr)) were measured on a bright sunny day between 9 a.m. to 11 a.m. using a Li-Cor-6400 portable photosynthesis system (Li-Cor, Lincoln, NE, USA).
Chlorophyll fluorescence (Fv/Fm) was measured at 25 DAT according to Genty et al. [37]. Both treated and control plants were shifted to an experimental room, kept in the dark for 25 min, flag leaf were cut for the determination of chlorophyll fluorescence using a pulse-modulated chlorophyll fluorimeter using IMAGING-PAM (Walz; Effeltrich, Germany) image processing software. Fluorescence values observed comprised of Fo, initial/minimal fluorescence, Fm, the maximal fluorescence value, and Fv/Fm, the maximum quantum yield of PSII photochemistry. The data were noted at five different points at 40, 70, 120, 150, and 180 mm from leaf tips.

2.4. Lipid Peroxidation and Antioxidative Enzyme Activity Assay

The roots and second leaf from the apex were sampled at 1, 5, 10, and 15 DAT. Lipid peroxidation was measured in the tissues and expressed as malondialdehyde (MDA) content using the TBA (thiobarbituric acid) method according to the Wu et al. [34]. The activity-specific and non-specific absorbance was determined at 532 and 600 nm, respectively. Enzymatic antioxidants activity was determined as described by Leul and Zhou [38]. Briefly, 0.2 g of frozen leaf and root plant tissue were ground in a pre-chilled mortar and pestle and homogenized in 2 mL of 1 M Tris buffer (pH 8). Later, the samples were briefly centrifuged at 10,000× g at 4 °C for about 15 min and the supernatants were used for the following assays. The activity assay of superoxide dismutase (SOD, EC 1.15.1.1), peroxidase (POD, EC 1.11.1.7), and catalysis (CAT, EC 1.11.1.6) were recorded according to Wu et al. [34]. Ascorbate peroxidase (EC 1.11.1.11) activity was determined at 290 nm using ascorbate (AsA) as a substrate and 2.8 mM cm−1 as an extinction co-efficient [39], while Jiang and Zhang [40] methods were used to determine the activity of glutathione reductase (GR, EC. 1.6.4.2).

2.5. Cell Ultrastructure

For transmission electron-microscopy, fresh roots (about 2–3 mm in length) and leaf pieces (about 1 mm2) without veins were hand sectioned and treated with 100 mM sodium phosphate buffer (PBS; pH 7.0) containing 2.5% (v/v) glutaraldehyde and placed overnight at 4 °C, then briefly washed; this step was performed 3 times with the same buffer. Each sample was treated for 60 min with 1% osmium tetroxide OsO4 (v/v) followed by washing with PBS (sodium phosphate buffer) further 3 times. Thereafter, the leaf and root samples were dehydrated with a diluted series of ethanol (50%, 60%, 70%, 80%, 90%, 95%, and 100%) for about 20 min in each solution, later all the samples were dried for 20 min in concentrated acetone. Finally, ultrathin sections (80 nm) were cut and affixed to copper grids for study using transmission electron microscopy (TEM 1230EX, JEOL, Akishima, Tokyo, Japan) at 60 kV.

2.6. Statistical Analysis

Statistical analysis was performed with the Data Processing System statistical software package [41] using ANOVA followed by Duncan’s Multiple Range Tests (DMRT) to evaluate significant treatment effect at a significance level of p < 0.05. Origin Pro (Version 8.0, Origin lab corporation, Wellesley Hills, Wellesley, MA, USA) was used to prepare graphs.

3. Results

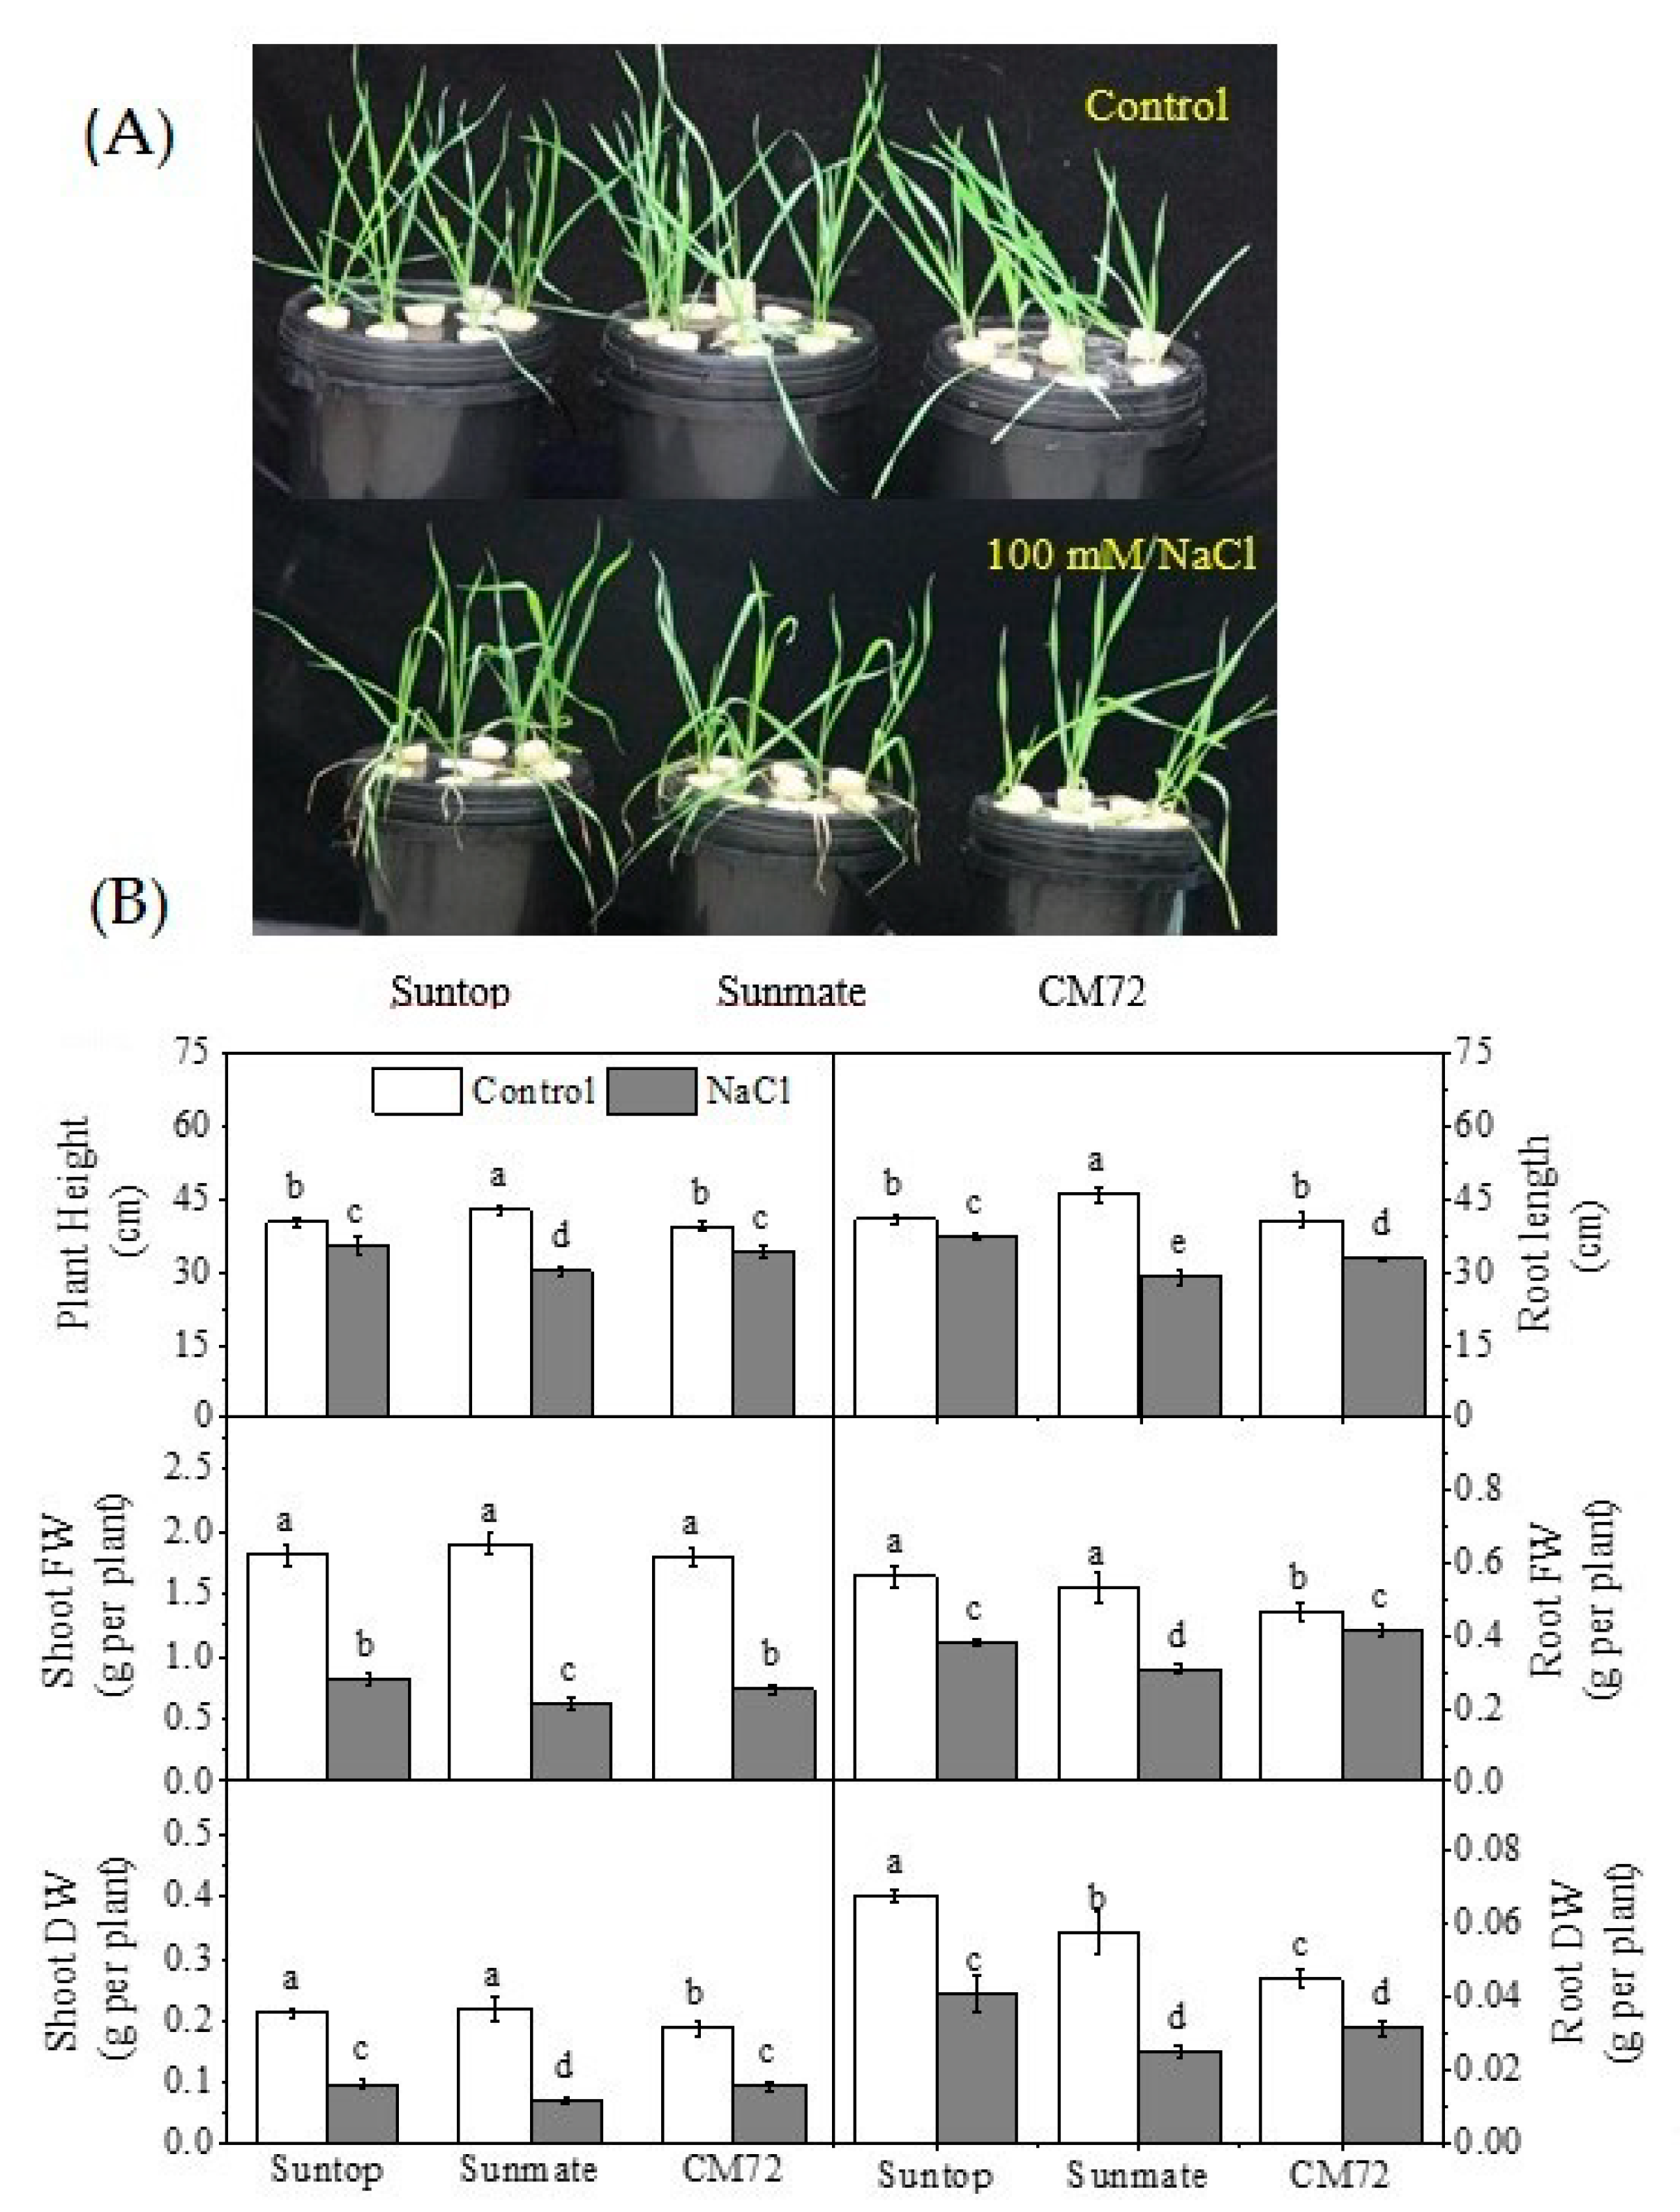
3.1. Plant Growth Parameters

Salt inhibited the growth of the barley and wheat plants, with the treated plants showing wilting, necrosis and chlorosis (Figure 1A). Salt damage was most severe in the wheat cv., Sunmate, while in the other cultivars, the damage was less pronounced. Salinity stress significantly (p < 0.05) reduced plant biomass in the wheat and barley cultivars (Figure 1B). In comparison to the other two cultivars, the effects of salt stress on plant growth was much more noticeable in Sunmate; it had the least effect on shoot height and the biggest effect on shoot weight. Shoot height was reduced under salinity stress by 29%, 12%, and 13% in the Sunmate, Suntop and CM72 cultivars, respectively. The fresh shoot weight was reduced by 68%, 55%, and 59%, while shoot dry weight was reduced 68%, 53%, and 49% in Sunmate, Suntop and CM72 in salinity stress plants respectively. Similarly, compared to the control plants, the root length was reduced under salinity stress by 37%, 8%, and 24% in Sunmate, Suntop, and CM72, respectively, while the reductions in fresh root weight were 42%, 33%, and 11% and dry root weight were 65%, 39%, and 30% in Sunmate, Suntop, and CM72, respectively in salinity treated plants (Table S1).

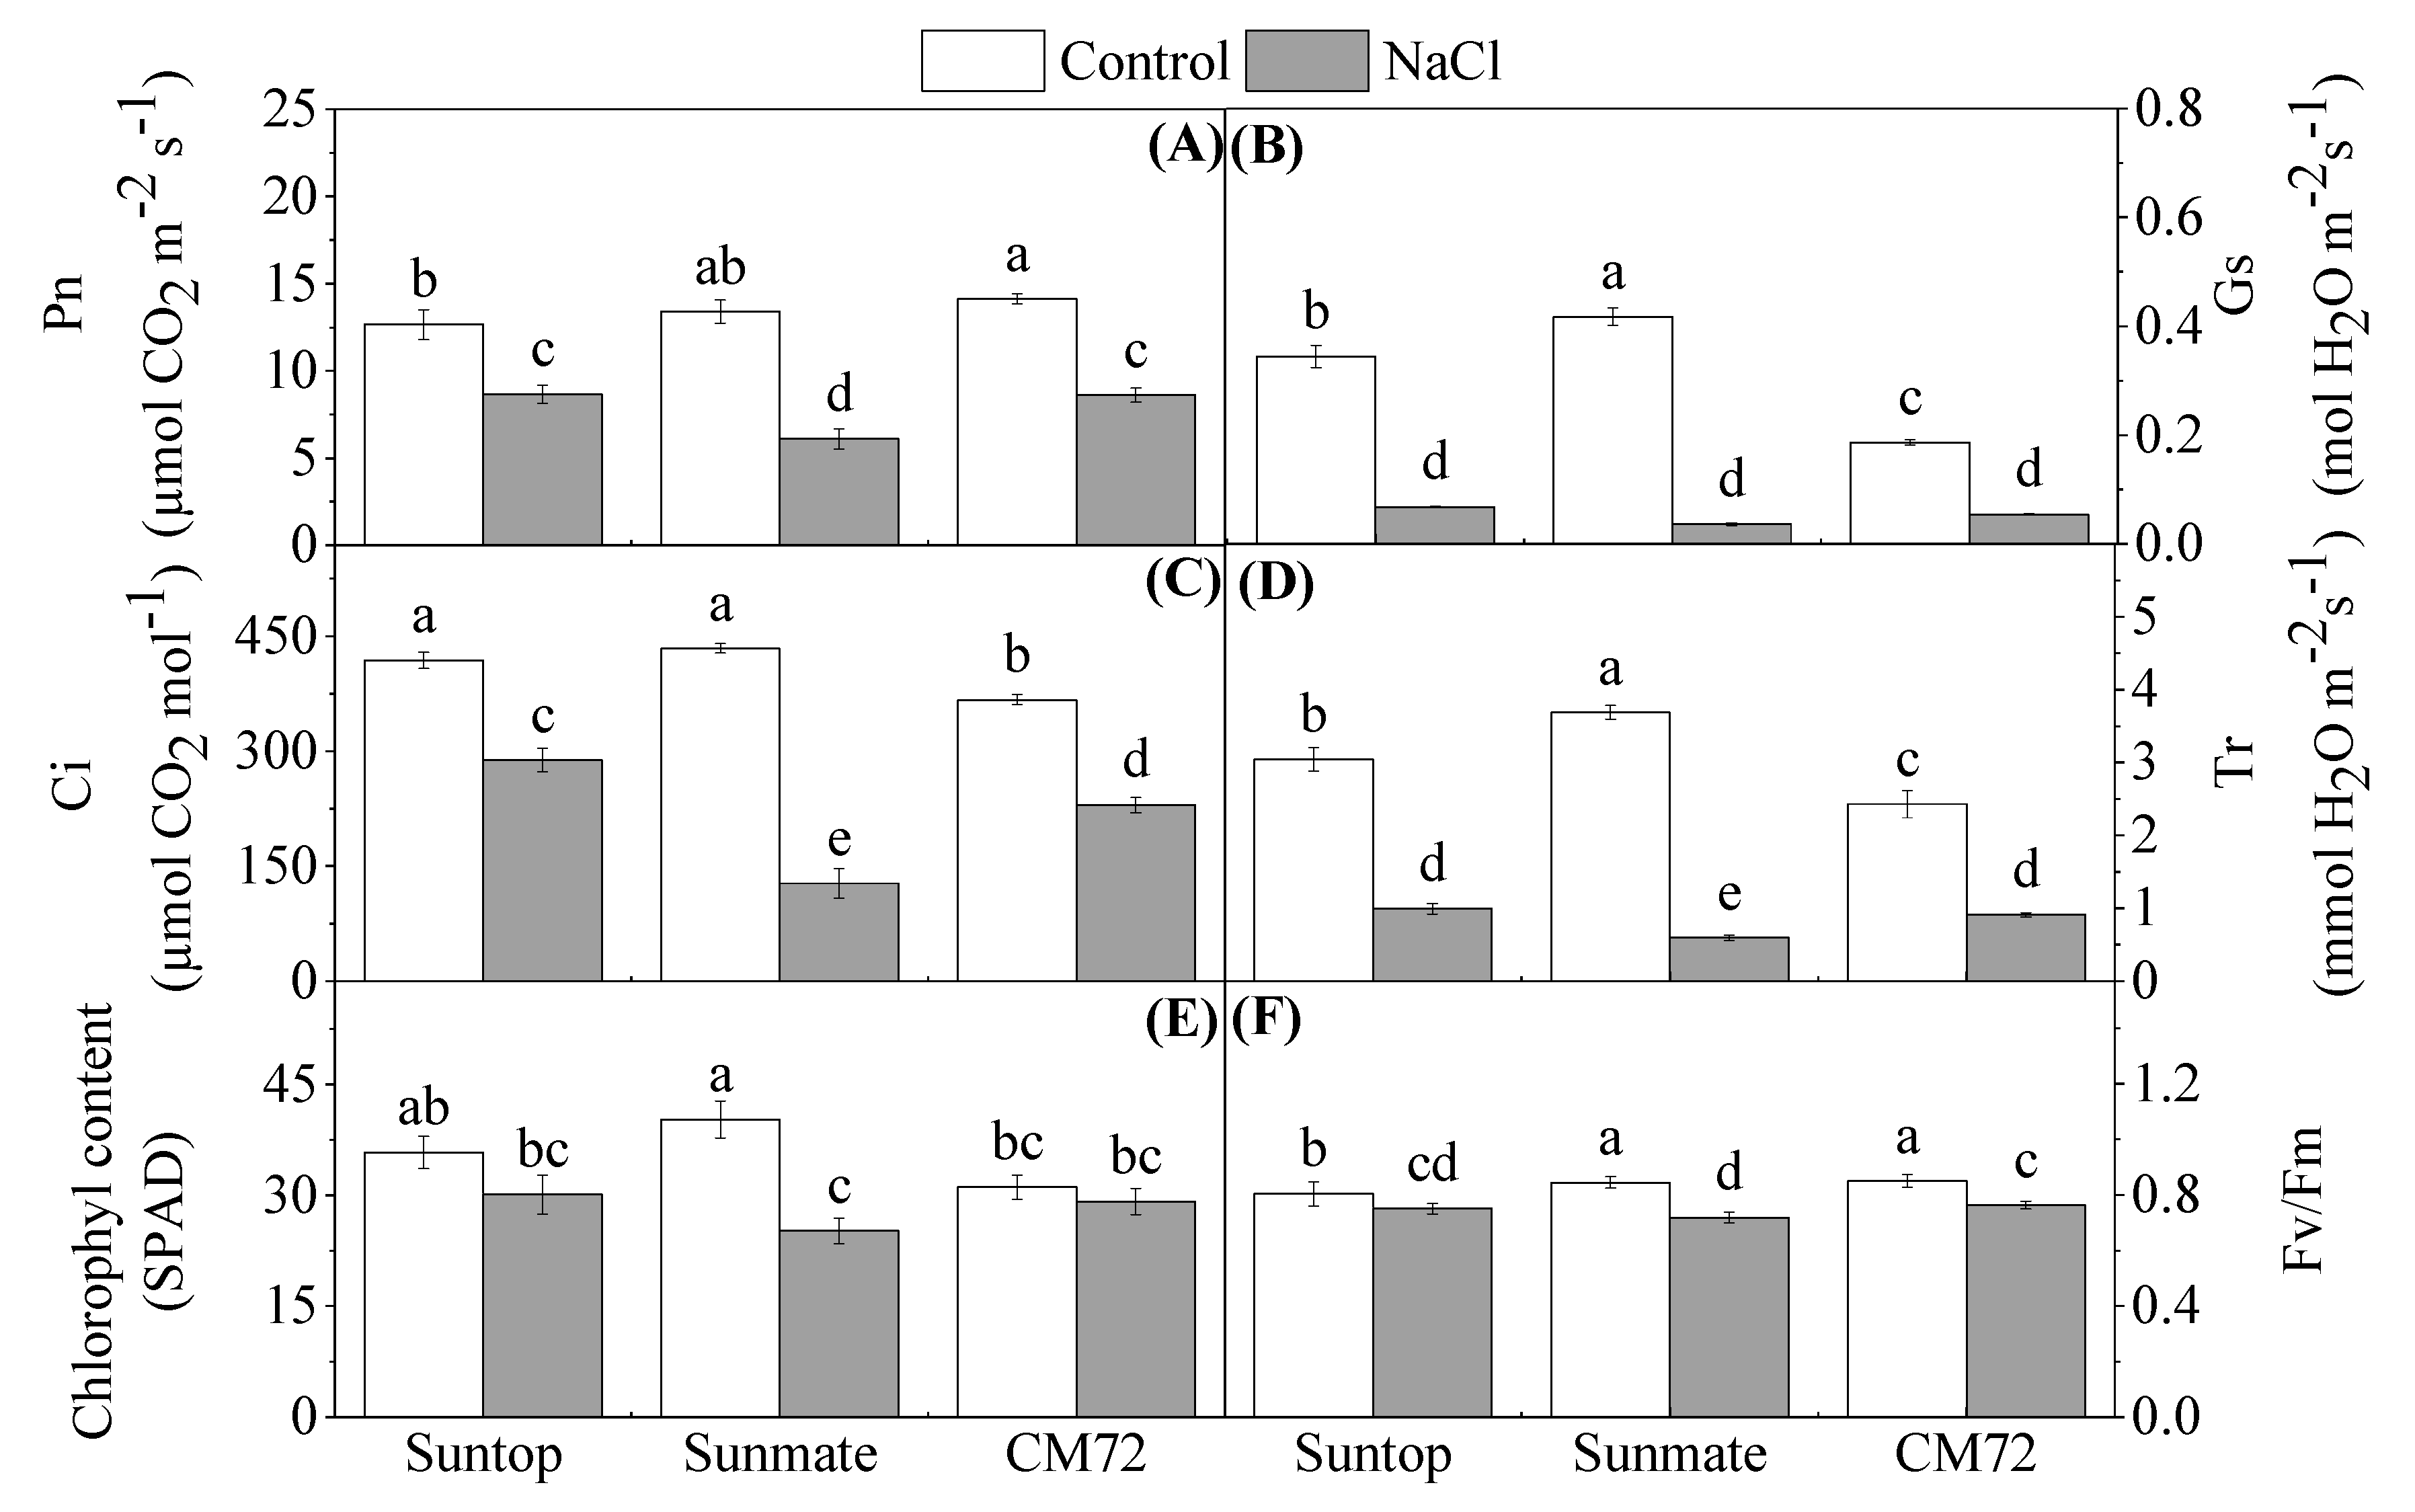
3.2. Chlorophyll and Photosynthetic Parameters

Gas exchange parameters were recorded 25 DAT (days after treatment) and significant (p < 0.05) decreases in net photosynthetic rate (Pn), stomatal conductance (Gs), intercellular CO2 concentration (Ci), and transpiration rate (Tr) were detected in both wheat and barley in comparison to their respective controls (Figure 2A–F). No significant changes were observed in Gs, chlorophyll contents and Fv to Fm ratios, however, significant differences were observed in Pn, Ci, and Tr among all the cultivars in the salinity treated plants. Interestingly, the two-salt tolerant cultivars, Suntop and CM72, showed no significant difference in regard to the photosynthetic parameters, but differences were noted in Sunmate, which is salt-sensitive.

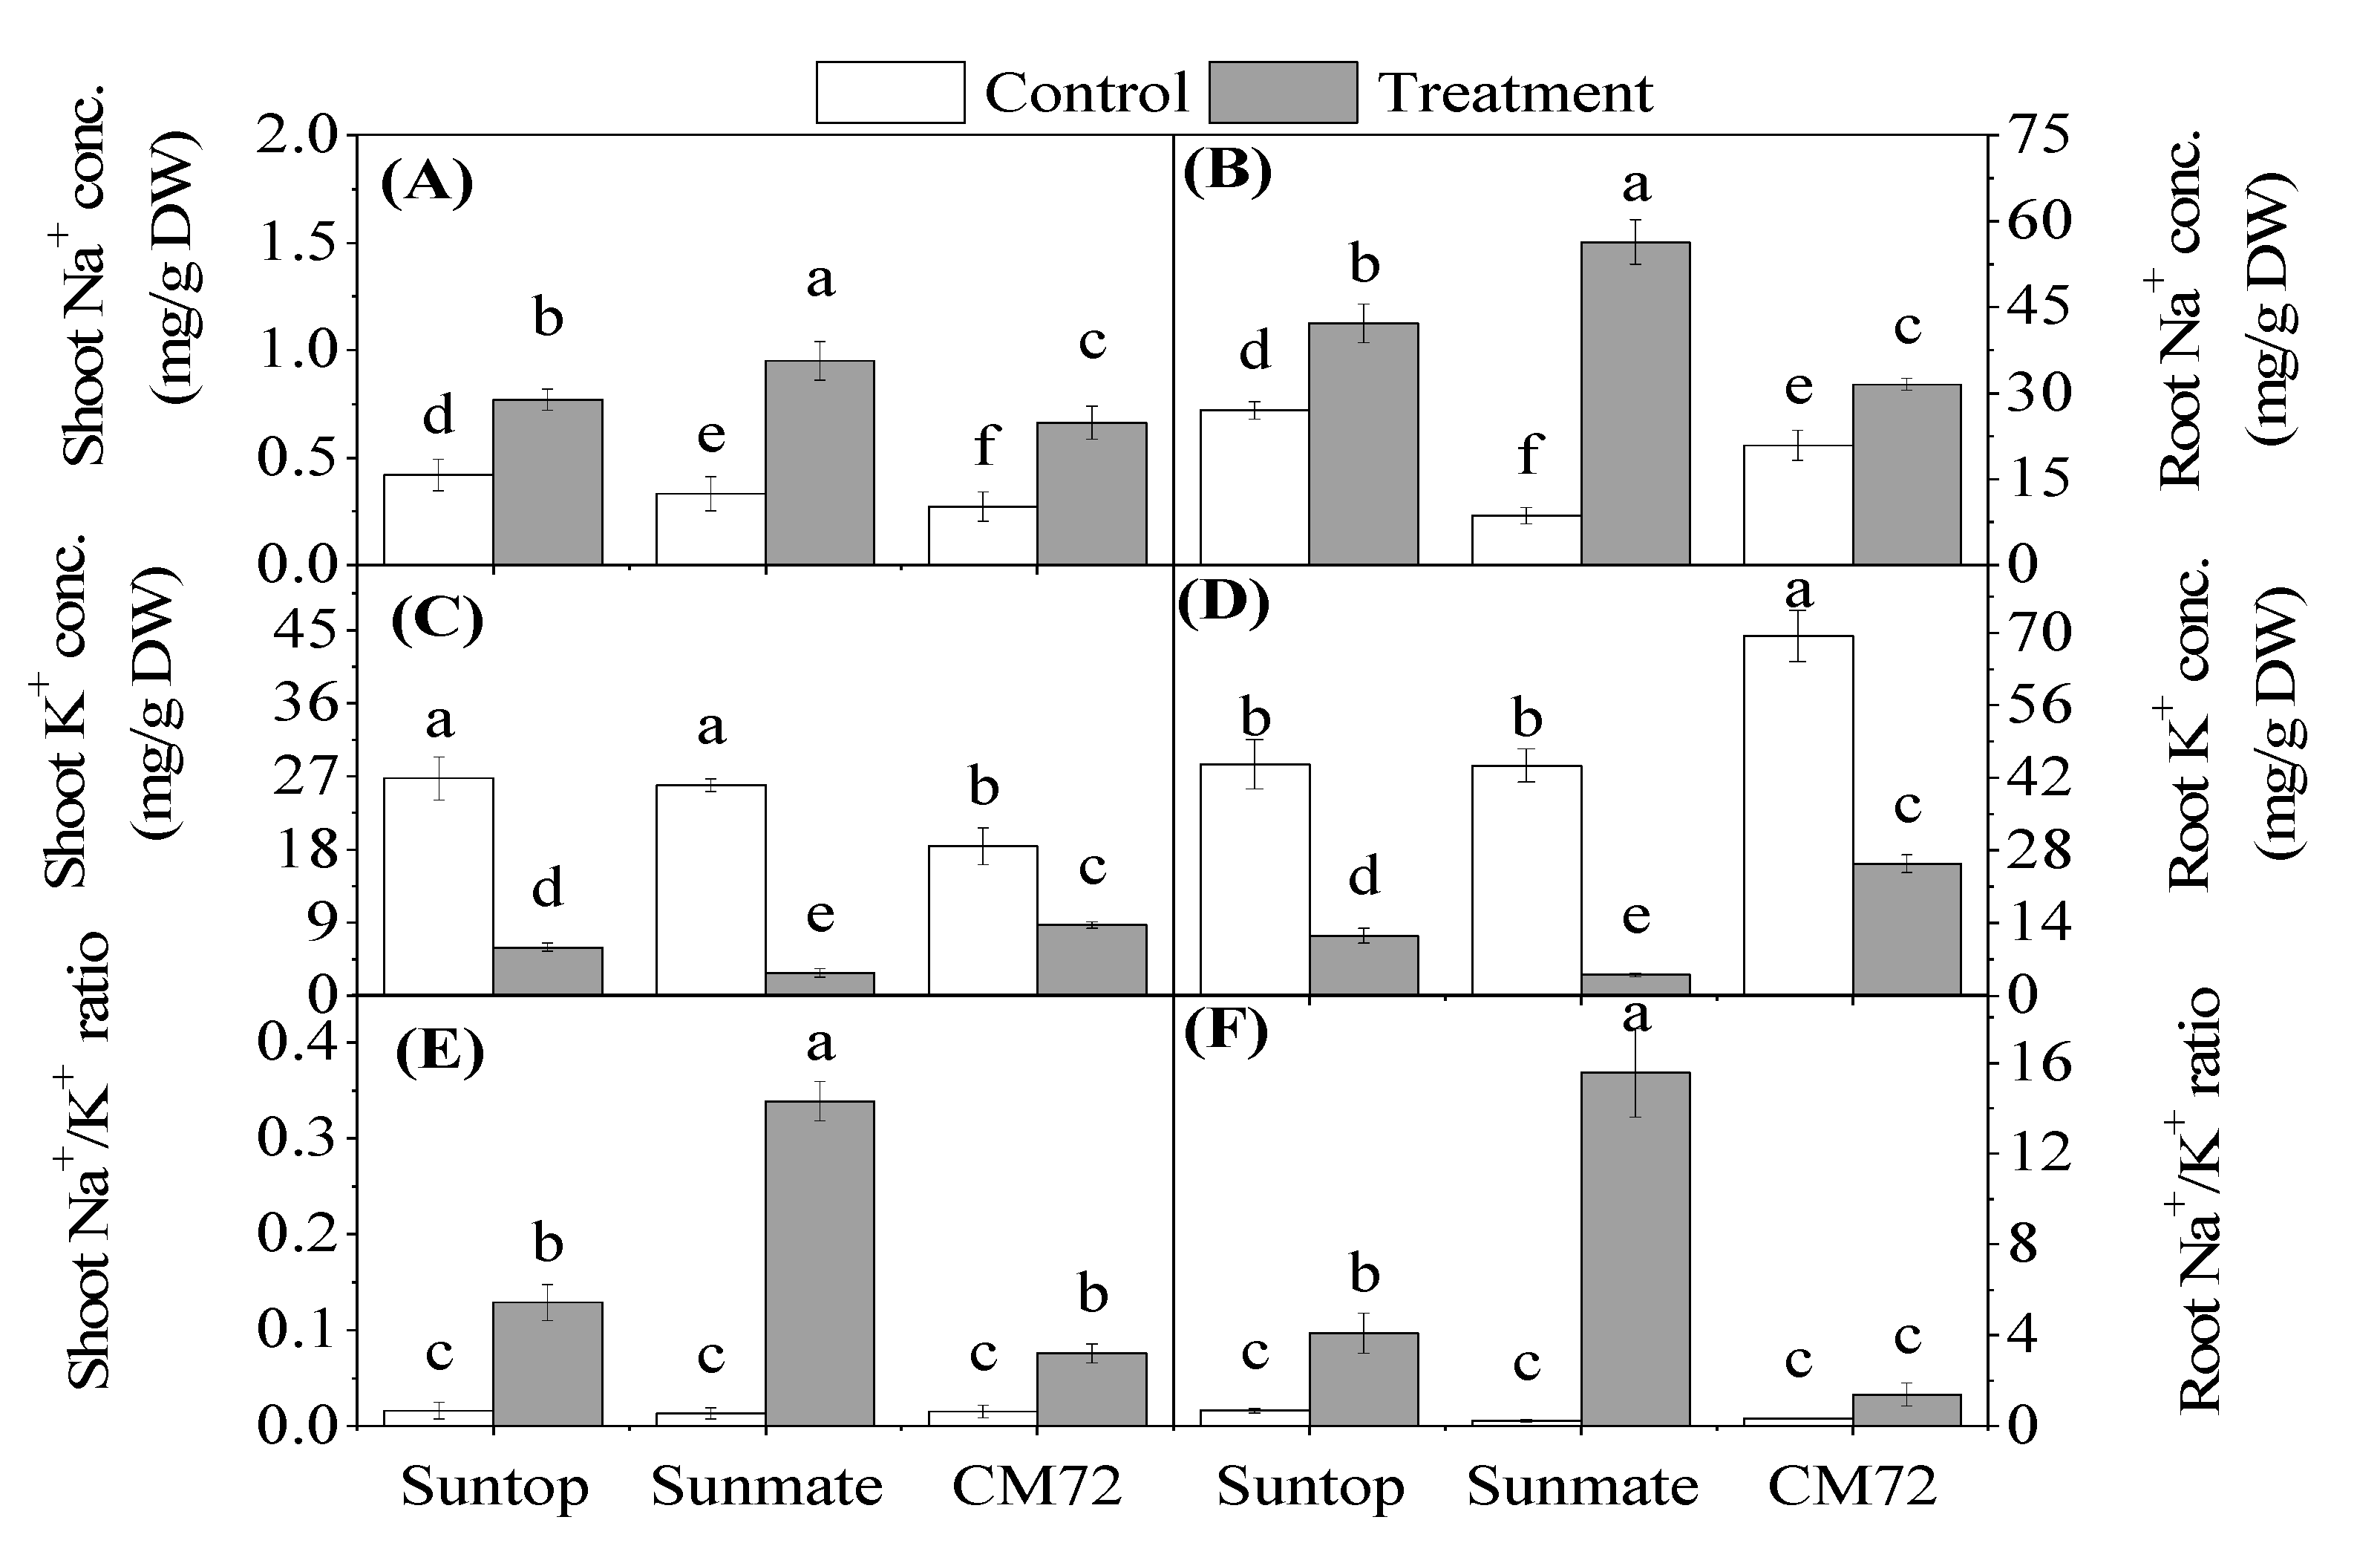
3.3. Shoots and Roots Na+, K+ Concentration, and Na+:K+ Ratio

Internal Na+ and K+ concentrations were determined, salinity significantly (p < 0.05) increased Na+, decreased K+ content, and increased Na+:K+ ratio in both shoots and roots of all cultivars in the saline-treated plants relative to the control plants (Figure 3A–F). In general, roots contained more Na+ and K+ compared to shoots, regardless of the cultivar or treatment. With regard to the plants given the salt treatment, in both shoots and roots, the increase in the Na+ content followed the trend CM72 < Suntop < Sunmate in both organs, while the K+ content decreased in the following trend CM72 > Suntop > Sunmate. Interestingly, the increase in Na+ content among the cultivars was inversely proportional to the decrease in K+ content. As a consequence of the changes in both minerals, the Na+:K+ ratio increased under salt stress. The greatest Na+:K+ ratios were observed in Sunmate (0.339) and Suntop (0.127), while the smallest were observed in CM72 (0.075) in shoots. The same trend in Na+:K+ values were also observed in the roots (Table S2).

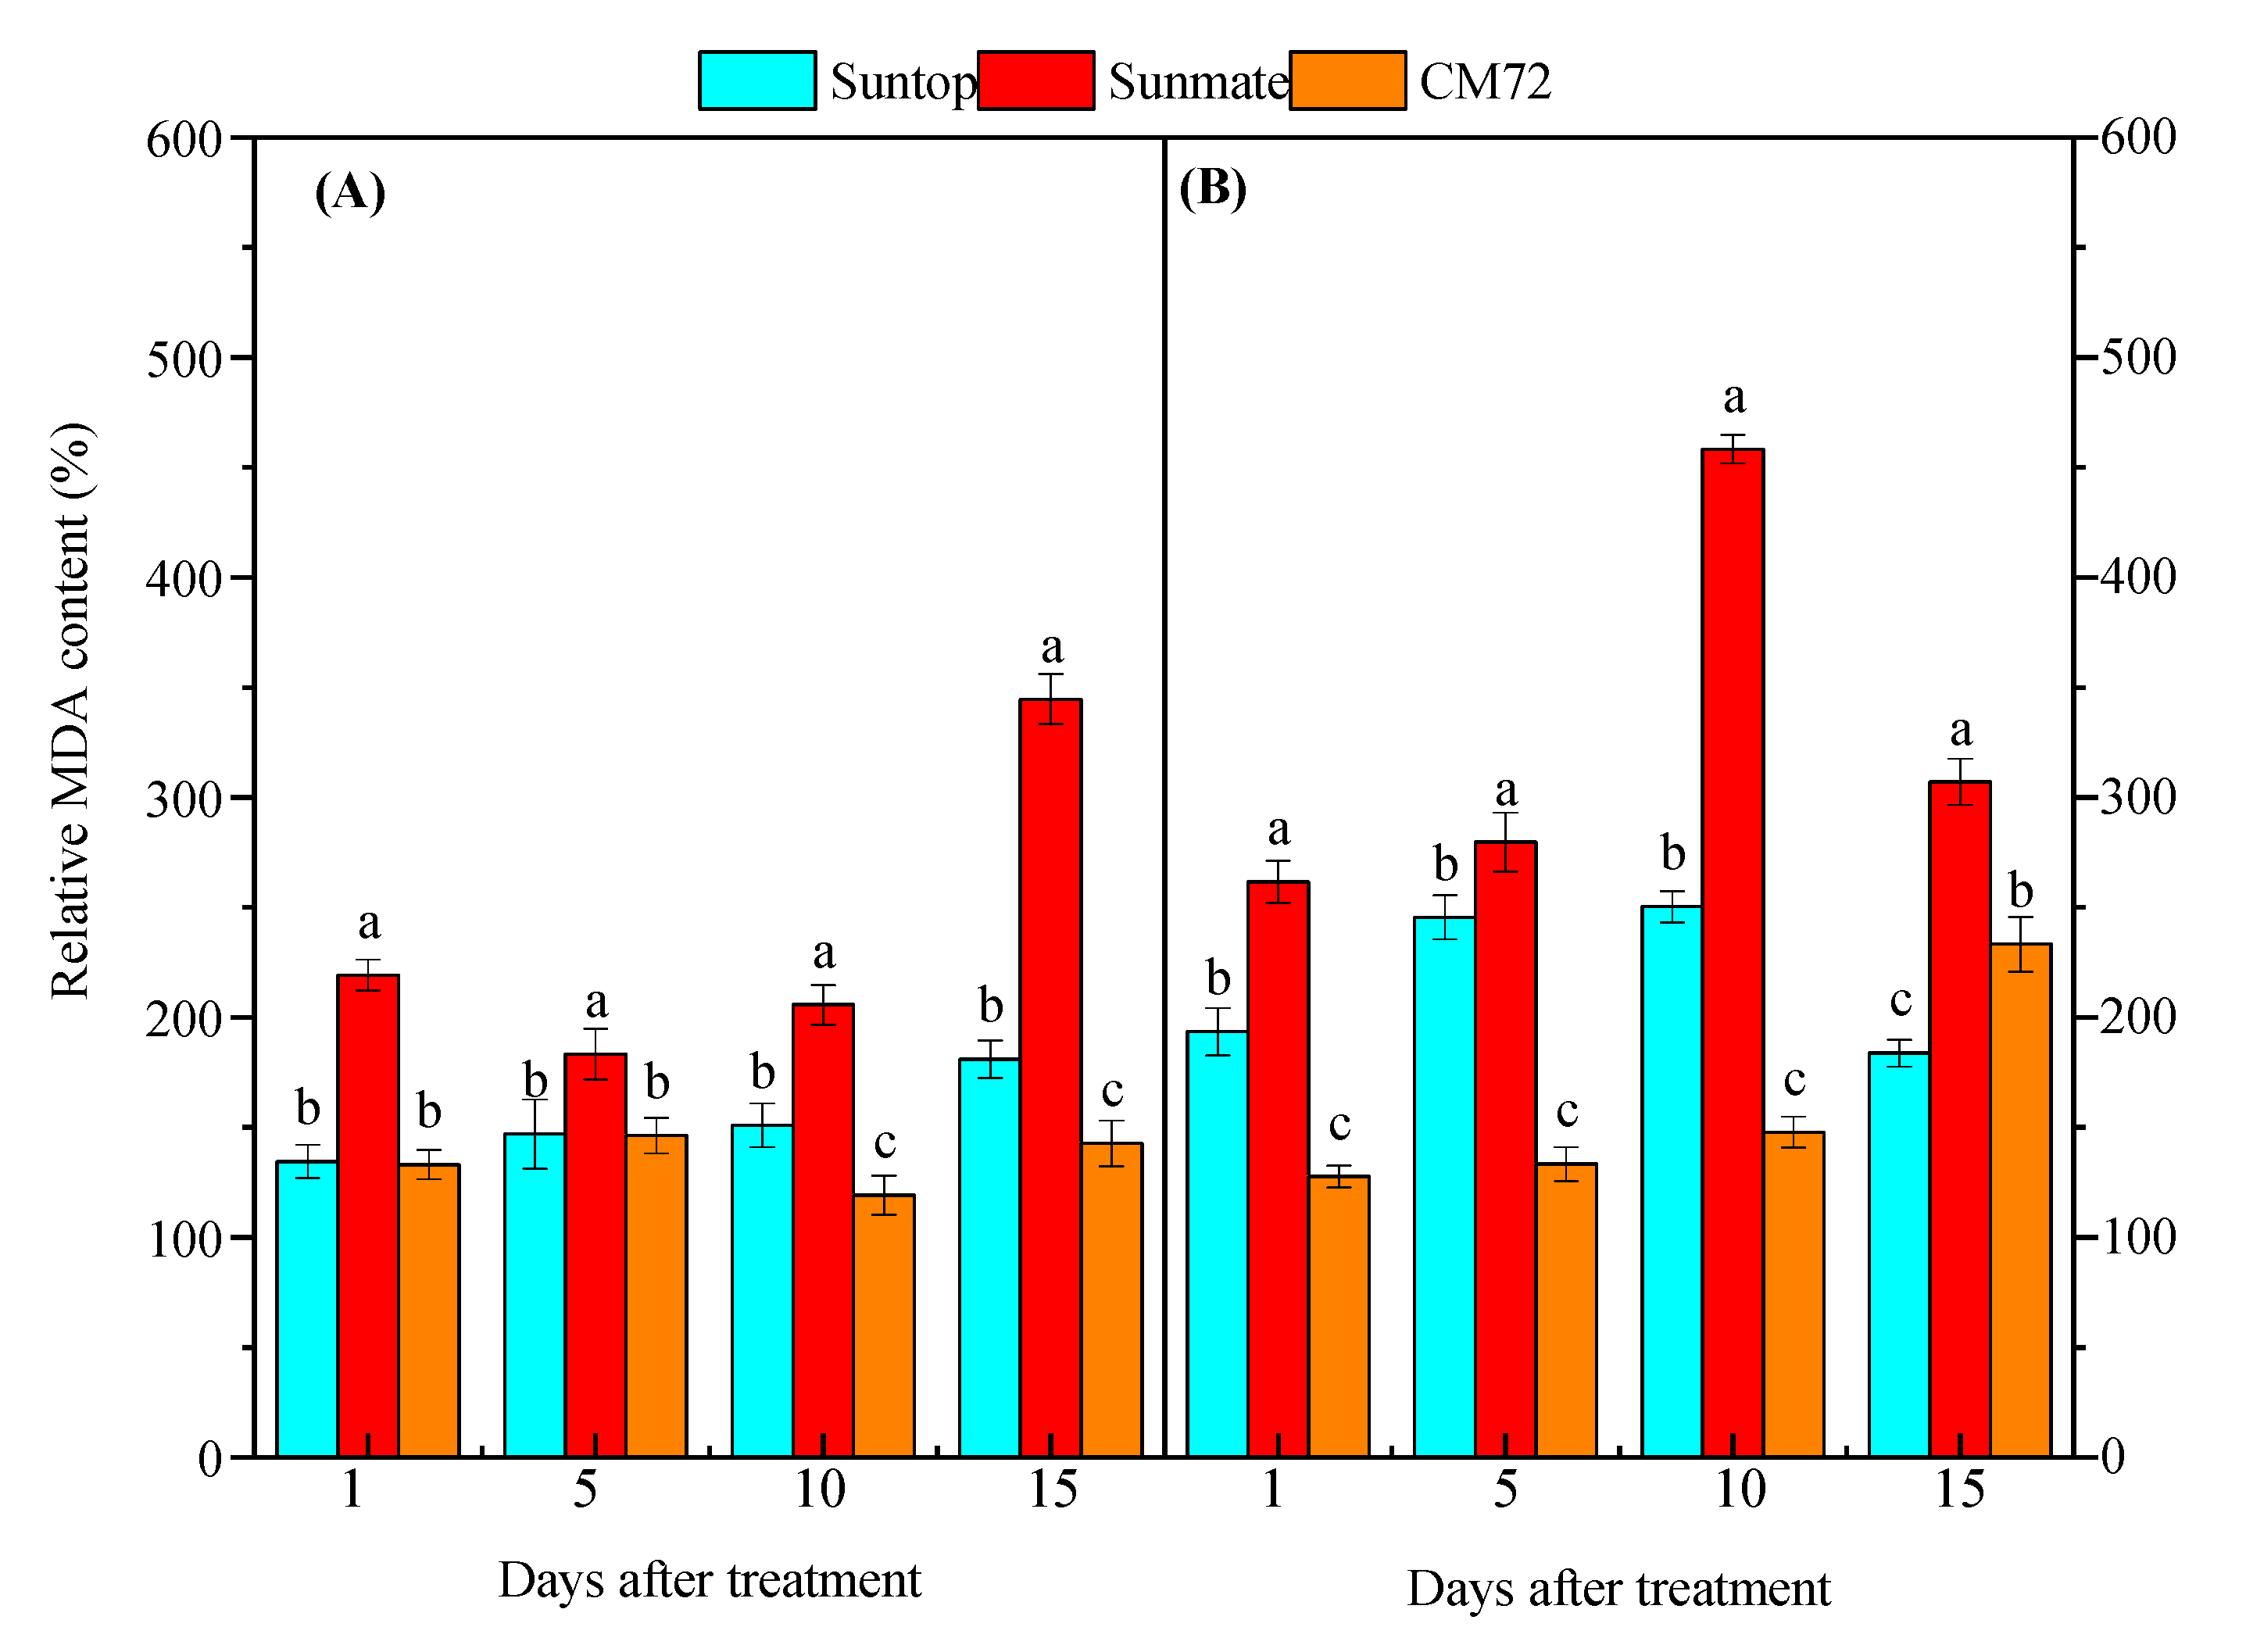
3.4. Lipid Peroxidation Assay and Antioxidative Enzyme Activities

Lipid peroxidation measurements at 1, 5, 10, and 15 DAT showed that salt stress induced significant changes among the cultivars and treatments (Figure 4A,B and Supplementary Tables S3 and S4). Regardless of the cultivar, MDA contents were significantly increased by the salt treatment in both leaves and roots, indicating enhanced lipid peroxidation. In general, in plants given salinity treatments, the MDA content was highest in Sunmate followed by Suntop then CM72, with the highest increase observed 15 and 10 d after treatment in leaves and roots, respectively.
Significant differences (p < 0.05) were detected among the cultivars and between the treatment in both roots and leaves for all measured antioxidant enzymes (Supplementary Tables S3 and S4, and expression relative to control activities in Figure 5A–J). In general, in the leaves, the relative activities of all enzymes were highest in Suntop, followed by CM72 and then Sunmate; however, in the roots, there was little difference between CM72 and Suntop. For SOD in the leaves, the activities of this enzyme were similar on Days 1 and 5, rose on Day 10, and then dropped below those measured on Day 1. In the roots, SOD activities rose on Day 10 and remained high on Day 15. For POD in the leaves, activities rose on Day 5 and then declined during the remainder of the assessment period, whilst in the roots POD activities did not rise until Day 10 and then declined. For APX in the leaves, activities started to rise on Day 10 and were highest on Day 15 whilst in the root’s activities rose on Day 10 and remained high. For CAT in leaves, activities were highest on Day 5 and then declined, except in Suntop, where a decline was observed on Day 10. In the roots, CAT activities tended to stay on similar levels throughout the treatment period. Finally, for GR for the two wheat cv., there was little change in activities in the leaves during the assessment period; however, for CM72, GR activities were highest on Days 5 and 10 and then declined. In the roots, for Suntop, GR activities increased on Day 5 and then remained high, for Sunmate, activities increased on Day 10, and then reduced and for CM72, GR activities were high throughout the experiment. Peaks of antioxidant enzyme activity were observed generally earlier in shoots than in roots, while the earliest peak was observed for CAT and the latest for APX.

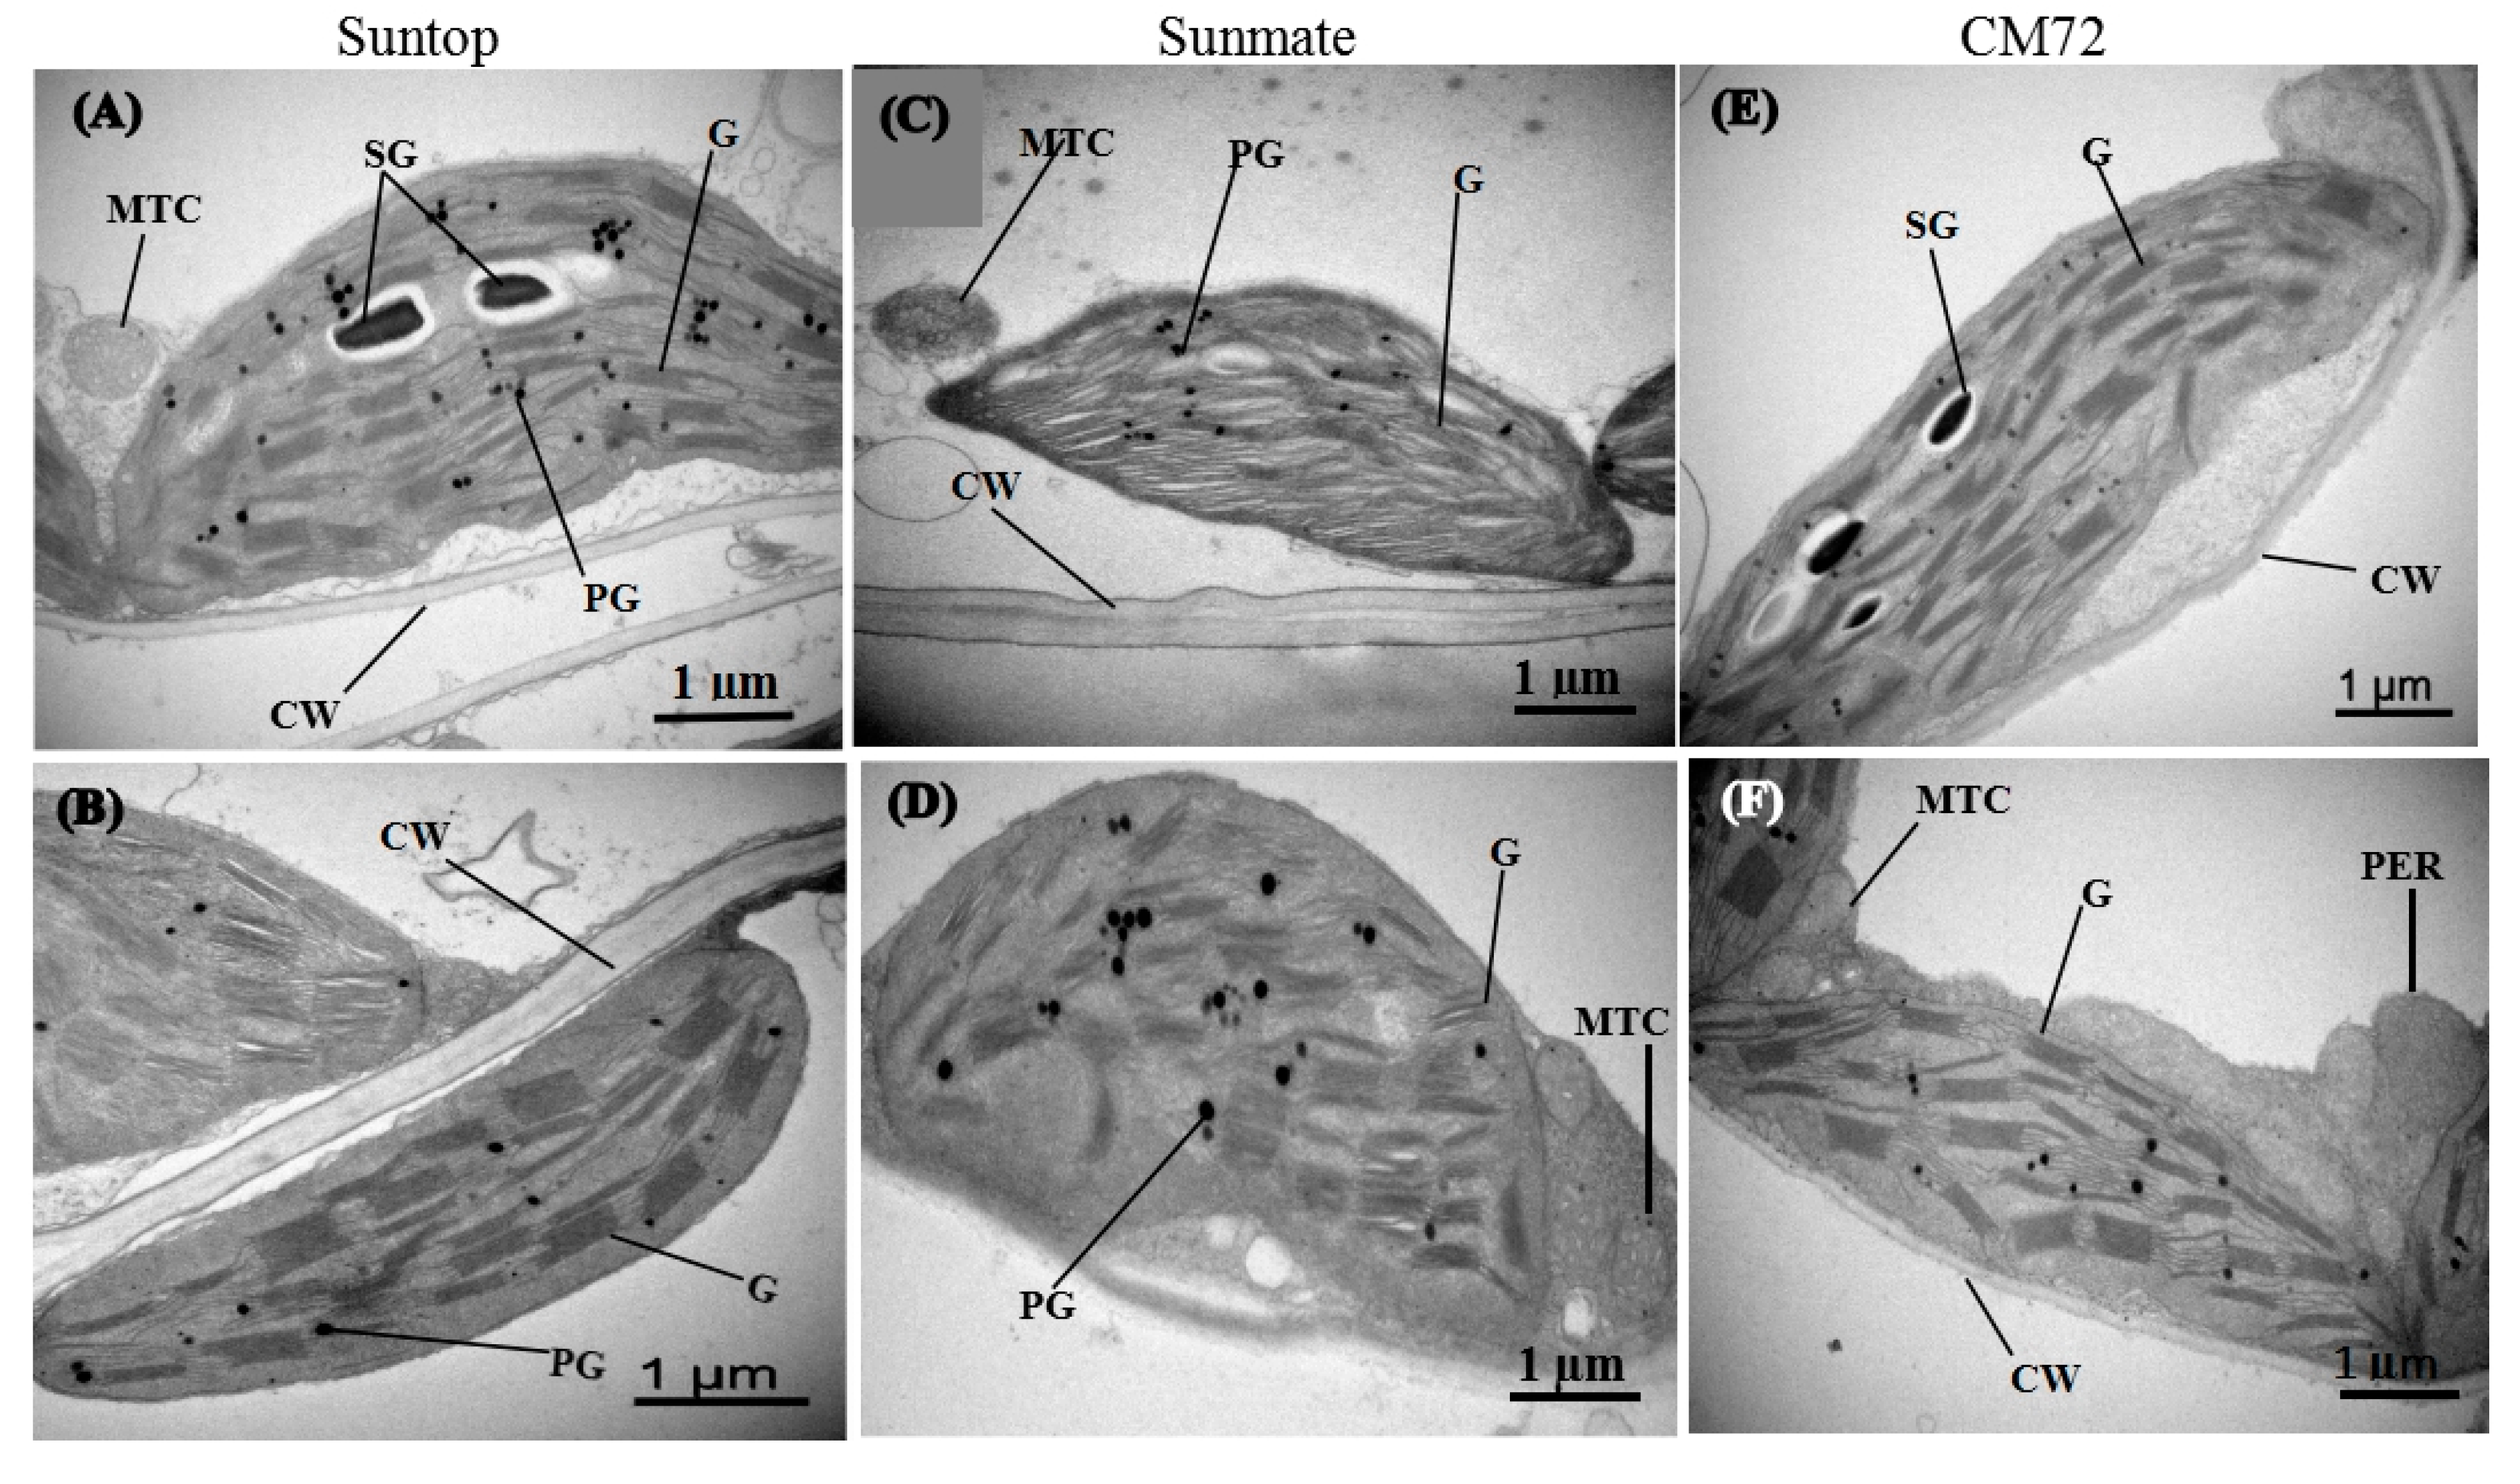
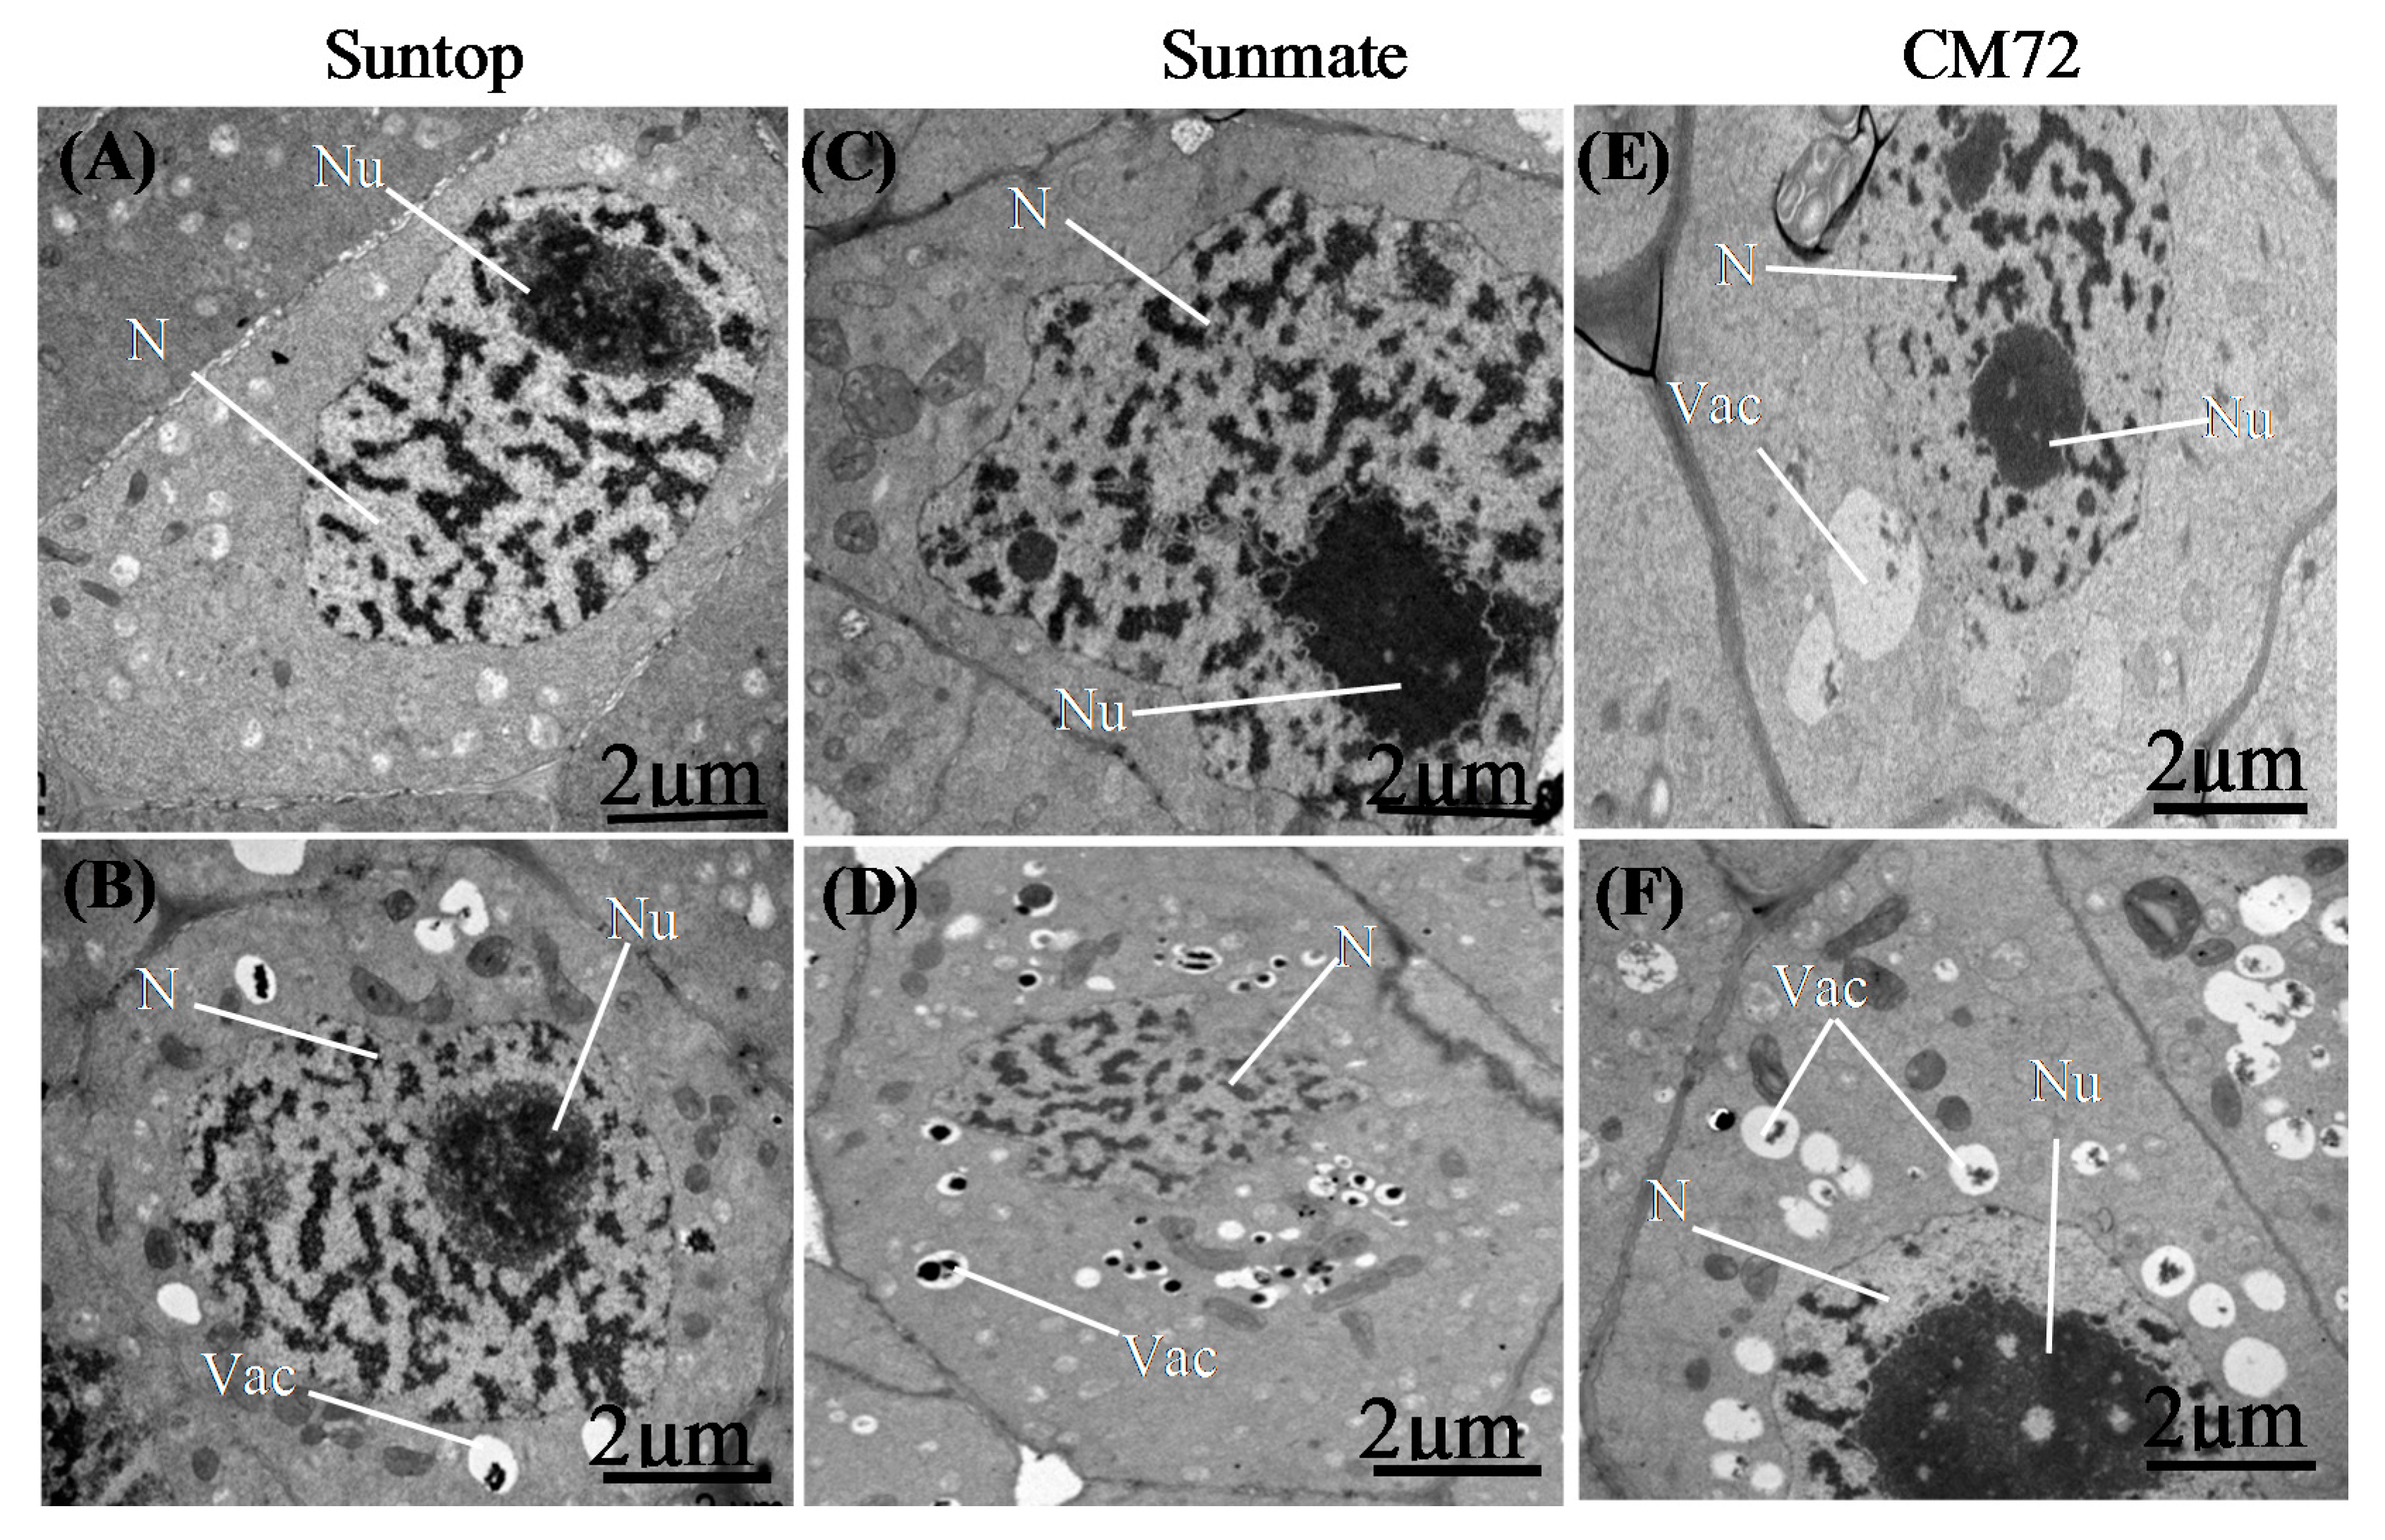
3.5. Leaf and Root Ultrastructure

The chloroplast ultrastructure of Sunmate was more severely affected by salt stress relative to controls and also to Suntop and CM72. Under control conditions, the chloroplasts of Suntop mesophyll cells usually had normal morphology with distinct grana and stroma lamellae, large starch grains with numerous plastoglobuli and well-organized, round mitochondria (Figure 6A); after the salt treatment, there were fewer plastoglobuli, no starch grains were apparent, and the grana and stroma lamellae were diffuse (Figure 6B). In contrast, chloroplasts of Sunmate were severely damaged by salinity stress, i.e., the chloroplast envelope showed disintegration with reduced grana stacks and less distinct thylakoids membranes, swollen oval-shaped mitochondria and larger osmophilic plastoglobuli (Figure 6C,D). As with Suntop, the chloroplasts of CM72 remained relatively normal in response to the salt treatment except for the disappearance of starch grains and thinner lamellae (Figure 6E,F).
When viewed using transmission electron microscopy, the root cells of all cultivars grown without salt treatment (control) had dense cytoplasm and organelles, and organized and large nuclei and nucleoli (Suntop, Figure 7A; Sunmate, Figure 7C; CM72, Figure 7E). Treatment with salt induced a number of ultrastructural changes from mild to severe, with the most visible alteration being the disappearance of nucleoli and vacuoles in Sunmate (Suntop, Figure 7B; Sunmate, Figure 7D; CM72, Figure 7F). Suntop and CM72 had clear nucleoli and larger and several vacuoles in comparison with Sunmate. However, the size of the nucleoli increased in CM72, and to a lesser extent in Suntop, upon exposure to salt.

4. Discussion

The effects of the treatments differed for different plant organs; therefore, the effects on shoots and roots of both species are considered separately.
Reduced biomass, a marked perturbation in photosynthetic parameters along with reduced chlorophyll contents resulting from salinity stress were observed in the wheat and barley cultivars. These effects are possibly due to either single or combined effects of reduced stomatal conductance, inhibition of metabolic phenomena, and increased ROS generation which can increase oxygen-induced cellular damage [42]. The reductions in stomatal conductance (Gs), photosynthesis rates (Pn), and leaf chlorophyll contents due to salinity were greater in Sunmate than in Suntop and CM72 (Figure 2). In a study conducted using sorghum, Netondo et al. [43] found that changes in stomatal conductance (Gs) and intercellular CO2 concentration (Ci) were positively correlated under salt stress, concluding that stomatal conductance (Gs) was the key factor arresting net photosynthesis rates (Pn) under saline stress. The lower stomatal conductance (Gs) accompanied by low chlorophyll contents in Sunmate could contribute to the higher inhibition of net photosynthesis rates (Pn). Usually, plants close their stomata upon the onset of stressful conditions to save water, consequently reducing stomatal conductance (Gs) and photosynthesis [44]. The effect of salinity might be a secondary influence, arbitrated by the lower partial pressure of CO2 in the green parts of the plant due to the stomata closure on the photosynthesis-related enzyme activities [45,46].
The Fv/Fm ratio reflects the photochemical efficiency of PSII [47]. Results in this study show that even a small but significant reduction in Fv/Fm with the greatest decline in Sunmate followed by CM72 then Suntop was recorded (Figure 2); these results are consistent with that presented by Ahmad et al. [48] and Ibrahim et al. [47]. NaCl stress can disturb the photosynthesis biochemistry, limiting the efficiency of two photosystems due to the disordering of chloroplast integrity [47]. In our study, salinity altered leaf chloroplast ultrastructure causing swelling of thylakoids, diffuse granular and stroma lamellae, a larger number of large-sized plastoglobuli and a reduction in leaf chlorophyll content in the sensitive wheat cultivar, Sunmate; these changes were not seen to the same extent in Suntop and CM72 (Figure 6). There may be several reasons for the disruptions to thylakoids and the chloroplast envelope. These include higher accumulation of lipids in chloroplasts, ion toxicity, or imbalance [49], and osmotic imbalance between chloroplast and stroma [50], which in turn cause a reduction of photosynthetic efficiency and the electron transport activity of chloroplasts [51].
Additionally, upon exposure to salinization, severe disruption of nuclei and nuclear membranes of roots were detected in Sunmate but to a lesser extent in Suntop and CM72 (Figure 7). Salinity largely affects roots because of their direct contact with the soil. Therefore, to protect the whole plant from the adverse effects of salinity, roots should better tolerate salinity stress [47]. Zhang and Blumwald [52] noted that in tolerant plants, Na+ is kept away from the cytosol by compartmentalizing it into the vacuole, and due to the lack of this ability in sensitive plants, dehydration and ionic imbalance disturbed the metabolic process in sensitive plants [53]. We observed that the nucleolus disappeared in Sunmate. A common consequence of this type of alteration inside the nucleus would be a loss of function and/or even cell death [53].
It is important to determine Na+ and K+ concentrations and Na+:K+ ratios in shoots and roots to understand mechanisms of salinity tolerance [54]. In our study, under the salinity stress, significant differences were found in shoot Na+ and K+ along with Na+:K+ ratios in both species relative to controls, with the most severe effect in Sunmate (Figure 3A–F, Table S2). In general, CM72 accumulated less Na+ and more K+ in shoots followed by Suntop and then Sunmate. Hence, the low Na+:K+ ratios in CM72 and Suntop may explain the tolerance of these cultivars. Root to shoot Na+ and K+ translocation is limited, as all genotypes accumulated more Na+ and K+ in roots than in shoots. These results are consistent with the idea of differences in translocation restricting Na+ movement to the shoot being one of the mechanisms of salinity tolerance. Na+ and K+ are interdependent under salinity stress. Previous studies have found a decrease in K+ content in several plant species resulting from high salinity [35,55]. Increased Na+ concentrations in root zones have an antagonistic effect on K+ uptake. Consequently, a deficiency of K+ has created stunting growth and reducing yields [56].
The most general consequence of salinization is the accumulation of hazardous substances in plant cells especially ROS such as singlet oxygen (O2), superoxide radicals (O2), and hydrogen peroxide (H2O2); these species cause damage to proteins, lipids, and nucleic acids thereby promoting rapid plant death [57]. Malondialdehyde (MDA), a product of polyunsaturated fatty acid peroxidation [58], is commonly considered as a sign of the extent of oxidation damage under stress [27,59]. The hostile influences of NaCl stress on lipid peroxidation have been reported in other plants, for example in Brassica juncea [60] and Vicia faba [61], and MDA has been widely recognized as a good salinity tolerance marker in plant species [62]. We found significantly lower MDA contents in the shoots and roots of CM72 and Suntop compared to the Sunmate (Figure 4A,B). These data suggest that CM72 and Suntop were better protected than Sunmate against oxidative damage under salinity stress.
After salt treatment, tolerant plants eventually develop an enhanced antioxidant enzyme system to handle the effects of ROS. In our study, significantly increased SOD, POD, APX, CAT, and GR activities were found in roots and leaf tissues of both species in the NaCl treated plants (Figure 5A–J). However, the relative activities of these enzymes were recorded higher in Suntop and CM72 than in cultivar Sunmate in both tissues. SOD provides the first line of defense against ROS and protects plants from severe damage generated by O2 and H2O2 in the presence of metal ions [63]. Many studies have found that salinity positively promotes SOD activity in tolerant cultivars in both roots [64] and leaves [65]. Subsequent reactions are required to convert the H2O2 produced by SOD to H2O because H2O2 is still toxic to plants and reactions involving POD, CAT, and APX are important. Our research corroborates previous studies [47,48] had measured an enhanced activity of SOD, POD, and CAT in plants treated with a high NaCl dose and the activities of these enzymes were again higher in the two tolerant genotypes. Feki et al. [66] and Koca et al. [67] also demonstrated that tolerance to salinity in wheat and sesame genotypes was associated with lower MDA contents and higher activities of antioxidant enzymes. Thus, it is evident from our results and the results of others [10,68] that the higher POD, CAT, and APX activities coordinate with SOD activity to deal with the undesirable effect of O2 and H2O2 and the activities of these enzymes are strongly correlated with tolerance to salt-induced oxidative stress in wheat and barley.
The activity of GR in the leaves and roots was higher in CM72 compared to Suntop and Sunmate (Figure 5I,J). Other studies working with salt-sensitive and tolerant genotypes suggested that higher GR activities relate to salt tolerance [46,65]. The higher GR activity might be able to elevate NADP+ concentrations to gain electrons from the photosynthetic electron transport chain thereby reducing the production of ROS [69]. Our results also suggest that the salt-tolerant cultivar may exhibit a more active ascorbate-glutathione cycle.

5. Conclusions

Although differences were observed between CM72 and Suntop in the growth and biochemical traits assessed and modified by salt stress, the differences are negligible in comparison with the response to the salt stress of sensitive wheat cv. Sunmate. The distinct differences between wheat and barley were lower MDA content, lower Na+/K+ ratio and a higher level of APX and GR content in the roots of barley cultivar CM72. These results lead us to infer that differences in response to salinity may be just as great within a species as between species. The most obvious mechanisms for salt tolerance in the tolerant barley and wheat cultivars are the increased activities of ROS-scavenging enzymes and a more balanced Na+:K+ ratio. Our results indicated that Suntop is highly tolerant against salinity, which is quite similar to barley CM72. Novel salt-tolerant related genes may be identified in Suntop for improving the salt tolerance of wheat cultivars, except for commercial application in saline-alkali soils.

Supplementary Materials

The following are available online at https://0-www-mdpi-com.brum.beds.ac.uk/2073-4395/10/1/127/s1, Table S1: Effect of salinity on plant growth and biomass of Suntop, Sunmate and CM72, 25 days after treatment with 100 mM NaCl, Table S2: Shoot and root Na+ and K+ concentration and Na+/K+ ratio of two wheat cv. Suntop and Sunmate, and one barley cv. CM72, 25 days after treatment with 100 mM NaCl, Table S3: Effect of salinity stress on SOD, POD, CAT, APX and GR activities and MDA contents in the shoots of Suntop, Sunmate and CM72, after 1, 5, 10 and 15 days 100 mM NaCl treatment, Table S4: Effect of salinity stress on SOD, POD, CAT, APX, and GR activities and MDA contents in the roots of Suntop, Sunmate, and CM72, after 1, 5, 10, and 15 days 100 mM NaCl treatment.

Author Contributions

Conceptualization, F.W. and M.L.; data curation, M.Z. and F.W.; formal analysis, M.Z.; funding acquisition, F.W.; investigation, M.Z. and S.S.; methodology, F.W. and M.Z.; project administration, F.W.; supervision, F.W.; validation, M.Z., S.S., P.H., and F.W.B.; writing—original draft, M.Z.; writing—review and editing, M.Z., F.W., and P.H. All authors have read and agreed to the published version of the manuscript.

Funding

This project was supported by the Key Research Foundation of Science and Technology Department of Zhejiang Province of China (2016C02050-9-7).

Conflicts of Interest

The authors declare no conflict of interest.

References

  1. Ghassemi, F.; Jakeman, A.J.; Nix, H.A. Salinisation of Land and Water Resources: Human Causes, Extent, Management and Case Studies; CAB International Publishing: Wallingford, UK, 1995; p. 526. [Google Scholar]
  2. FAO. Global Network on Integrated Soil Management for Sustainable Use of Salt-Affected Soils. 2000. Available online: http://www.fao.org/ag/AGL/agll/spush/intro.htm (accessed on 10 May 2004).
  3. Zhang, H.X.; Hodson, J.N.; Williams, J.P.; Blumwald, E. Engineering salt-tolerant Brassica plants: characterization of yield and seed oil quality in transgenic plants with increased vacuolar sodium accumulation. Proc. Natl. Acad. Sci. USA 2001, 98, 12832–12836. [Google Scholar] [CrossRef] [PubMed] [Green Version]
  4. Flowers, T.J. Improving crop salt tolerance. J. Exp. Bot. 2004, 55, 307–319. [Google Scholar] [CrossRef] [PubMed]
  5. Munns, R.; Tester, M. Mechanisms of salinity tolerance. Annu. Rev. Plant Biol. 2008, 59, 651–681. [Google Scholar] [CrossRef] [PubMed] [Green Version]
  6. Parida, A.K.; Das, A.B. Salt tolerance and salinity effects on plants: A review. Ecotoxicol. Environ. Saf. 2005, 60, 324–349. [Google Scholar] [CrossRef]
  7. FAO. The Special Challenge for Sub-Saharan Africa. How to Feed the World 2050; FAO: Rome, Italy, 2009.
  8. Ashraf, M.; Harris, P.J.C. Potential biochemical indicators of salinity tolerance in plants. Plant Sci. 2004, 166, 3–16. [Google Scholar] [CrossRef]
  9. Ferguson, L.; Grattan, S.R. How salinity damages citrus: osmotic effects and specific ion toxicities. Hort. Technol. 2005, 15, 95–99. [Google Scholar] [CrossRef] [Green Version]
  10. Munns, R.; James, R.A.; Lauchli, A. Approaches to increasing the salt tolerance of wheat and other cereals. J. Exp. Bot. 2006, 57, 1025–1043. [Google Scholar] [CrossRef] [Green Version]
  11. Apse, M.P.; Blumwald, E. Engineering salt tolerance in plants. Curr. Opin. Biotechol. 2002, 13, 146–150. [Google Scholar] [CrossRef]
  12. Machado, R.M.; Serralheiro, R.P. Soil salinity: effect on vegetable crop growth. Management practices to prevent and mitigate soil salinization. Horticulturae 2017, 3, 30. [Google Scholar] [CrossRef]
  13. Rengasamy, P. World salinization with emphasis on Australia. J. Exp. Bot. 2006, 57, 1017–1023. [Google Scholar] [CrossRef] [Green Version]
  14. Slabu, C.; Zörb, C.; Steffens, D.; Schubert, S. Is salt stress of faba bean (Vicia faba) caused by Na+ or Cl–toxicity? J. Plant Nutr. Soil Sci. 2009, 172, 644–651. [Google Scholar] [CrossRef]
  15. Tavakkoli, E.; Rengasamy, P.; McDonald, G.K. High concentrations of Na+ and Cl ions in soil solution have simultaneous detrimental effects on growth of faba bean under salinity stress. J. Exp. Bot. 2010, 61, 4449–4459. [Google Scholar] [CrossRef] [PubMed]
  16. Cheeseman, J.M. The integration of activity in saline environments: Problems and perspectives. Funct. Plant Biol. 2013, 40, 759–774. [Google Scholar] [CrossRef]
  17. Schachtman, D.P.; Liu, W.H. Molecular pieces to the puzzle of the interaction between potassium and sodium uptake in plants. Trends Plant Sci. 1999, 4, 281–287. [Google Scholar] [CrossRef]
  18. Ball, M.C.; Chow, W.S.; Anderson, J.M. Salinity-induced potassium deficiency causes loss of functional photosystem II in leaves of the grey mangrove, Avicennia marina, through depletion of the atrazine-binding polypeptide. Funct. Plant Biol. 1987, 14, 351–361. [Google Scholar] [CrossRef]
  19. Botella, M.A.; Martinez, V.; Pardines, J.; Cerda, A. Salinity induced potassium deficiency in maize plants. J. Plant Physiol. 1997, 150, 200–205. [Google Scholar] [CrossRef]
  20. Pang, C.H.; Wang, B.S. Oxidative stress and salt tolerance in plants. In Progress in Botany; Lüttge, U., Beyschlag, W., Murata, J., Eds.; Springer: Berlin/Heidelberg, Germany, 2008; Volume 69, pp. 231–245. [Google Scholar]
  21. Wong-Ekkabut, J.; Xu, Z.; Triampo, W.; Tang, I.M.; Tieleman, D.P.; Monticelli, L. Effect of lipid peroxidation on the properties of lipid bilayers: A molecular dynamics study. Biophys. J. 2007, 93, 4225–4236. [Google Scholar] [CrossRef] [Green Version]
  22. Sharma, P.; Jha, A.B.; Dubey, R.S.; Pessarakli, M. Reactive oxygen species, oxidative damage, and antioxidative defense mechanism in plants under stressful conditions. J. Bot. 2012, 2012, 1–26. [Google Scholar] [CrossRef] [Green Version]
  23. Smirnoff, N. Plant resistance to environmental stress. Curr. Opin. Biotech. 1998, 9, 214–219. [Google Scholar] [CrossRef]
  24. Jena, N.R. DNA damage by reactive species: Mechanisms, mutation and repair. J. Biosci. 2012, 37, 503–517. [Google Scholar] [CrossRef]
  25. Noctor, G.; Foyer, C.H. Ascorbate and glutathione: Keeping active oxygen under control. Annu. Rev. Plant Biol. 1998, 49, 249–279. [Google Scholar] [CrossRef] [PubMed]
  26. Takahashi, M.; Asada, K. Superoxide production in aprotic interior of chloroplast thylakoids. Arch. Biochem. Biophys. 1988, 267, 714–722. [Google Scholar] [CrossRef]
  27. Apel, K.; Hirt, H. Reactive oxygen species: Metabolism, oxidative stress, and signal transduction. Annu. Rev. Plant Biol. 2004, 55, 373–399. [Google Scholar] [CrossRef] [PubMed] [Green Version]
  28. Mittler, R.; Vanderauwera, S.; Gollery, M.; Van Breusegem, F. Reactive oxygen gene network of plants. Trends Plant Sci. 2004, 9, 490–498. [Google Scholar] [CrossRef] [PubMed]
  29. Dietz, K.J.; Jacob, S.; Oelze, M.L.; Laxa, M.; Tognetti, V.; de Miranda, S.M.; Baier, M.; Finkemeier, I. The function of peroxiredoxins in plant organelle redox metabolism. J. Exp. Bot. 2006, 57, 1697–1709. [Google Scholar] [CrossRef]
  30. Türkan, I.; Demiral, T. Recent developments in understanding salinity tolerance. Environ. Exp. Bot. 2009, 67, 2–9. [Google Scholar] [CrossRef]
  31. Gupta, B.; Huang, B. Mechanism of salinity tolerance in plants: Physiological, biochemical, and molecular characterization. Int. J. Genom. 2014, 2014, 1–18. [Google Scholar] [CrossRef]
  32. Pessarakli, M. Dry matter yield, nitrogen-15 absorption, and water uptake by green bean under sodium chloride stress. Crop Sci. 1991, 31, 1633–1640. [Google Scholar] [CrossRef]
  33. Wu, F.B.; Zhang, G.P.; Yu, J.S. Interaction of cadmium and four microelements for uptake and translocation in different barley genotypes. Comm. Soil Sci. Plant Analysis 2003, 34, 2003–2020. [Google Scholar] [CrossRef]
  34. Wu, F.B.; Zhang, G.P.; Dominy, P. Four barley genotypes respond differently to cadmium: Lipid peroxidation and activities of antioxidant capacity. Environ. Exp. Bot. 2003, 50, 67–78. [Google Scholar] [CrossRef]
  35. Chen, Z.; Zhou, M.; Newman, I.A.; Mendham, N.J.; Zhang, G.; Shabala, S. Potassium and sodium relations in salinized barley tissues as a basis of differential salt tolerance. Funct. Plant Biol. 2007, 34, 150–162. [Google Scholar] [CrossRef]
  36. Wu, F.B.; Lianghuan, W.; Fuhua, X. Chlorophyll meter to predict nitrogen sidedress requirements for short-season cotton (Gossypium hirsutum L.). Field Crop Res. 1998, 56, 309–314. [Google Scholar]
  37. Genty, B.; Briantais, J.M.; Baker, N.R. The relationship between the quantum yield of photosynthetic electron transport and quenching of chlorophyll fluorescence. Biochim. Biophys. Acta-Gen. Subj. 1989, 990, 87–92. [Google Scholar] [CrossRef]
  38. Leul, M.; Zhou, W.J. Alleviation of waterlogging damage in winter rape by uniconazole application: Effects on enzyme activity, lipid peroxidation, and membrane integrity. J. Plant Growth Regul. 1999, 18, 9–14. [Google Scholar] [CrossRef]
  39. Chen, F.; Wang, F.; Wu, F.B.; Mao, W.H.; Zhang, G.P.; Zhou, M.X. Modulation of exogenous glutathione in antioxidant defense system against Cd stress in the two barley genotypes differing in Cd tolerance. Plant Physiol. Biochem. 2010, 48, 663–672. [Google Scholar] [CrossRef]
  40. Jiang, M.; Zhang, J. Effect of abscisic acid on active oxygen species, antioxidative defence system and oxidative damage in leaves of maize seedlings. Plant Cell. Physiol. 2001, 42, 1265–1273. [Google Scholar] [CrossRef]
  41. Tang, Q.; Feng, M. Practical Statistics and Its DPS Statistics Software Package; China Agriculture Press: Beijing, China, 1997. [Google Scholar]
  42. Neill, S.J.; Desikan, R.; Clarke, A.; Hurst, R.D.; Hancock, J.T. Hydrogen peroxide and nitric oxide as signaling molecules in plants. J. Exp. Bot. 2002, 53, 1237–1247. [Google Scholar] [CrossRef]
  43. Netondo, G.W.; Onyango, J.C.; Beck, E. Sorghum and salinity. II. Gas exchange and chlorophyll fluorescence of sorghum under salt stress. Crop Sci. 2004, 44, 806–811. [Google Scholar]
  44. Taiz, L.; Zeiger, E. Plant Physiology; Sinauer Associates Inc.: Sunderland, MA, USA, 2002. [Google Scholar]
  45. Lawlor, D.W.; Cornic, G. Photosynthetic carbon assimilation and associated metabolism in relation to water deficits in higher plants. Plant Cell Environ. 2002, 25, 275–294. [Google Scholar] [CrossRef] [Green Version]
  46. Meloni, D.A.; Oliva, M.A.; Martinez, C.A.; Cambraia, J. Photosynthesis and activity of superoxide dismutase, peroxidase and glutathione reductase in cotton under salt stress. Environ. Exp. Bot. 2003, 49, 69–76. [Google Scholar] [CrossRef]
  47. Ibrahim, W.; Ahmed, I.M.; Chen, X.; Cao, F.; Zhu, S.; Wu, F. Genotypic differences in photosynthetic performance, antioxidant capacity, ultrastructure and nutrients in response to combined stress of salinity and Cd in cotton. BioMetals 2015, 28, 1063–1078. [Google Scholar] [CrossRef] [PubMed]
  48. Ahmed, I.M.; Cao, F.; Zhang, M.; Chen, X.; Zhang, G.; Wu, F. Difference in yield and physiological features in response to drought and salinity combined stress during anthesis in Tibetan wild and cultivated barleys. PLoS ONE 2013, 8, e77869. [Google Scholar] [CrossRef] [PubMed]
  49. Yamane, K.; Kawasaki, M.; Taniguchi, M.; Miyake, H. Differential effect of NaCl and polyethylene glycol on the ultrastructure of chloroplasts in rice seedlings. J. Plant Physiol. 2003, 160, 573–575. [Google Scholar] [CrossRef] [PubMed]
  50. Naeem, M.S.; Warusawitharana, H.; Liu, H.; Liu, D.; Ahmad, R.; Waraich, E.A.; Xua, L.; Zhou, W.J. 5-aminolevulinic acid alleviates the salinity-induced changes in Brassica napus as revealed by the ultrastructural study of chloroplast. Plant Physiol. Biochem. 2012, 57, 84–92. [Google Scholar] [CrossRef] [PubMed]
  51. Parida, A.K.; Das, A.B.; Mittra, B. Effects of NaCl stress on the structure, pigment complex composition, and photosynthetic activity of mangrove Bruguiera parviflora chloroplasts. Photosynthetica 2003, 41, 191–200. [Google Scholar] [CrossRef]
  52. Zhang, H.X.; Blumwald, E. Transgenic salt-tolerant tomato plants accumulate salt in foliage but not in fruit. Nat. Biotechnol. 2001, 19, 765–768. [Google Scholar] [CrossRef] [PubMed]
  53. Katsuhara, M.; Kawasaki, T. Salt stress induced nuclear and DNA degradation in meristematic cells of barley roots. Plant Cell Physiol. 1996, l37, 169–173. [Google Scholar] [CrossRef] [Green Version]
  54. Kader, M.A.; Lindberg, S. Uptake of sodium in protoplasts of salt-sensitive and salt-tolerant cultivars of rice, Oryza sativa L. determined by the fluorescent dye SBFI. J. Exp. Bot. 2005, 56, 3149–3158. [Google Scholar] [CrossRef] [Green Version]
  55. Genc, Y.; McDonald, G.K.; Tester, M. Reassessment of tissue Na+ concentration as a criterion for salinity tolerance in bread wheat. Plant Cell. Environ. 2007, 30, 1486–1498. [Google Scholar] [CrossRef]
  56. Reuter, D.; Robinson, J.B. Plant Analysis: An Interpretation Manual, 2nd ed.; CSIRO Publishing: Melbourne, Australia, 1997. [Google Scholar]
  57. Ozfidan-Konakci, C.; Yildiztugay, E.; Kucukoduk, M. Upregulation of antioxidant enzymes by exogenous gallic acid contributes to the amelioration in Oryza sativa roots exposed to salt and osmotic stress. Environ. Sci. Pollut. Res. Int. 2015, 22, 1487–1498. [Google Scholar] [CrossRef]
  58. Del, R.D.; Stewart, A.J.; Pellegrini, N. A review of recent studies on malondialdehyde as toxic molecule and biological marker of oxidative stress. Nutr. Metab. Cardiovasc Dis. 2005, 15, 316–328. [Google Scholar] [CrossRef] [PubMed]
  59. Davey, M.W.; Stals, E.; Panis, B.; Keulemans, J.; Swennen, R.L. High-throughput determination of malondialdehyde in plant tissues. Anal. Biochem. 2005, 347, 201–207. [Google Scholar] [CrossRef] [PubMed]
  60. Ahmad, P.; Hakeem, K.R.; Kumar, A.; Ashraf, M.; Akram, N.A. Salt-induced changes in photosynthetic activity and oxidative defense system of three cultivars of mustard (Brassica juncea L.). African J. Biotechnol. 2012, 11, 2694–2703. [Google Scholar]
  61. Azooz, M.M.; Youssef, A.M.; Ahmad, P. Evaluation of salicylic acid (SA) application on growth, osmotic solutes and antioxidant enzyme activities on broad bean seedlings grown under diluted seawater. Int. J. Plant Physiol. Biochem. 2011, 3, 253–264. [Google Scholar]
  62. Katsuhara, M.; Otsuka, T.; Ezaki, B. Salt stress-induced lipid peroxidation is reduced by glutathione S-transferase, but this reduction of lipid peroxides is not enough for a recovery of root growth in Arabidopsis. Plant Sci. 2005, 169, 369–373. [Google Scholar] [CrossRef]
  63. Bowler, C.; Montagu, M.V.; Inze, D. Superoxide dismutase and stress tolerance. Annu. Rev. Plant Physiol. Plant Mol. Biol. 1992, 43, 83–116. [Google Scholar] [CrossRef]
  64. Shalata, A.; Mittova, V.; Volokita, M.; Guy, M.; Tal, M. Response of the cultivated tomato and its wild salt-tolerant relative Lycopersicon pennellii to salt-dependent oxidative stress: The root antioxidative system. Physiol. Plant 2001, 112, 487–494. [Google Scholar] [CrossRef]
  65. Hernandez, J.A.; Jimenez, A.; Mullineaux, P.; Sevilla, F. Tolerance of pea (Pisum sativum L.) to long-term salt stress is associated with induction of antioxidant defences. Plant Cell Environ. 2000, 23, 853–862. [Google Scholar] [CrossRef]
  66. Feki, K.; Tounsi, S.; Brini, F. Comparison of an antioxidant system in tolerant and susceptible wheat seedlings in response to salt stress. Spanish J. Agric. Res. 2017, 15, e0805. [Google Scholar] [CrossRef] [Green Version]
  67. Koca, H.; Bor, M.; Özdemir, F.; Türkan, I. The effect of salt stress on lipid peroxidation, antioxidative enzymes and proline content of sesame cultivars. Environ. Exp. Bot. 2007, 60, 344–351. [Google Scholar] [CrossRef]
  68. Temel, A.; Gozukirmizi, N. Physiological and molecular changes in barley and wheat under salinity. Appl. Biochem. Biotechol. 2015, 175, 2950–2960. [Google Scholar] [CrossRef] [PubMed]
  69. Reddy, R.A.; Chaitanya, K.V.; Vivekanandan, M. Drought-induced responses of photosynthesis and antioxidant metabolism in higher plants. J. Plant Physiol. 2004, 161, 1189–1202. [Google Scholar] [CrossRef] [PubMed]
Figure 1. Morphology (A) and growth parameters (B) of seedlings of two wheat cv., Suntop and Sunmate, and one barley cv., CM72, 25 days after treatment with NaCl. Control and NaCl represent 0 and 100 mM NaCl, respectively. Values are means + SE (n = 4). For each parameter, means annotated with the same letter are not significantly different from each other according to Duncan’s Multiple Range Tests at p ≤ 0.05.
Agronomy 10 00127 g001
Figure 2. Effect of salinity stress on photosynthetic traits in two wheat cv., Suntop and Sunmate, and the barley cv., CM72, 25 days after treatment with 100 mM NaCl. Pn (A), Gs (B), Ci (C), Tr (D) and Fv/Fm (F), represent net photosynthetic rate, stomatal conductance, intercellular CO2 concentration, transpiration rate, and a maximum quantum yield of photosystem II photochemistry of the second fully expanded leaves, respectively. The chlorophyll content was measured as SPAD (E) (Soil Plant analysis Development). Values are means + SE (n = 4). For each parameter, means annotated with the same letter are not significantly different from each other according to Duncan’s Multiple Range Tests at p ≤ 0.05.
Agronomy 10 00127 g002
Figure 3. Effect of salinity stress on Na+ and K+ concentrations and Na+:K+ ratio in shoots (A,C,E) and roots (B,D,F) of two wheat cv., Suntop and Sunmate, and the barley cv., CM72, 25 days after treatment with 100 mM NaCl. Error bars represent SE (n = 4). Different letters indicate significant differences (p ≤ 0.05) among the 3 cultivars.
Agronomy 10 00127 g003
Figure 4. Effect of salinity stress on malondialdehyde contents (MDA, nmol-1 FW) in leaves (A) and roots (B) of Suntop (Aqua), Sunmate (Red), and CM72 (Orange) 1, 5, 10, and 15 days after treatment with 100 mM NaCl. The data are expressed as a percentage of control content. Different letters indicate significant differences (p ≤ 0.05) among the 3 cultivars within each sampling day. Error bars represent SE (n = 4).
Agronomy 10 00127 g004
Figure 5. Effect of salinity stress on (A,B) superoxide dismutase (SOD) (U g−1 FW); (C,D) peroxidase (POD) (OD 470 g−1 min−1); (E,F) ascorbate peroxidases (APX) (mmol g−1 FW min−1); (G,H) catalase (CAT) (mmol-1 FW min-1; (I,J) glutathione reductase (GR) (mmol g-1 FW min−1) activities in leaves (A,C,E,G,I) and roots (B,D,F,H,J) of Suntop (Aqua), Sunmate (Red), and CM72 (Orange) 1, 5, 10, and 15 days after treatment with 100 mM NaCl. The data are expressed as a percentage of control activities. Different letters indicate significant differences (p ≤ 0.05) among the 3 cultivars within each sampling day. Error bars represent SE (n = 4).
Agronomy 10 00127 g005
Figure 6. Transmission electron micrographs of chloroplasts of leaves of Suntop (A,B), Sunmate (C,D), and CM72 (E,F) under control (top panel) and 100 mM NaCl (bottom panel). CW, cell wall; G, grana; MTC, mitochondria; PG, plastoglobuli; SG, starch grains.
Agronomy 10 00127 g006
Figure 7. Electron micrographs of roots of Suntop (A,B), Sunmate (C,D), and CM72 (E,F) under control (top panel) and 100 mM NaCl (bottom panel). CW, cell wall; Nu, nucleolus; N, nucleus; Vac, vacuole.
Agronomy 10 00127 g007

