Article

Genetic Diversity and Inter-Trait Relationships among Maize Inbreds Containing Genes from Zea diploperennis and Hybrid Performance under Contrasting Environments

by
Ijeoma Chinyere Akaogu
1,2,3,
Baffour Badu-Apraku
2,*,
Vernon Gracen
3,
Pangirayi Tongoona
3,
Melaku Gedil
1,
Nnanna Unachukwu
2,
Samuel Kwame Offei
3,
Daniel Kwadjo Dzidzienyo
3,
Sarah Hearne
4 and
Ana Luisa Garcia-Oliveira
5
1
Department of Agricultural Biotechnology, National Biotechnology Development Agency, Umaru Musa Yar’adua Expressway Airport Road, Lugbe, FCT, 900001 Abuja, Nigeria
2
International Institute of Tropical Agriculture (IITA), c/o Lambourn (UK) Limited, Carolyn House, 26 Dingwall Road, Croydon CR9 3EE, UK
3
West Africa Center for Crop Improvement, University of Ghana, Legon, PMB LG 30 Legon-Accra, Ghana
4
International Centre for Maize and Wheat Improvement, (CIMMYT), Km 45 El Batan, 56237 Texcoco, Mexico
5
International Maize and Wheat Improvement Center (CIMMYT), ICRAF House, UN Avenue, Nairobi PO Box 1041-00621, Kenya
*
Author to whom correspondence should be addressed.
Submission received: 29 August 2020 / Revised: 21 September 2020 / Accepted: 23 September 2020 / Published: 27 September 2020
(This article belongs to the Special Issue Use of Wild Crop Relatives as Genetic Resources in Crop Breeding)

Abstract

:
Accurate estimation of genetic variability present in tropical maize inbreds with varying reactions to Striga hermonthica infestation is essential for efficient and sustainable utilization to ensure increased genetic gain in a breeding program. Thirty-six early maturing maize inbred lines and 156 single cross hybrids were evaluated under Striga-infested and non-infested conditions in Nigeria during the 2014 and 2015 cropping seasons. Under Striga infestation, grain yield ranged from 1134 kg ha−1 for TZEI 26 × TZEI 5 to 5362 kg ha−1 for TZdEI 173 × TZdEI 280. The average yield reduction of the hybrids under Striga infestation was 44% relative to the performance under non-infested environments. Using 4440 high-quality DArT markers, clustering and population structure analyses separated the inbred lines into three distinct groups based on the genetic distance indicating high level of genetic variability among the lines. The base index of the International Institute of Tropical Agriculture (IITA) identified 50% of the inbred lines as Striga resistant. The genetic diversity study provided an opportunity for selecting divergent parents for tagging candidate genes and quantitative trait loci for marker-assisted introgression of Striga resistance genes into early maturing tropical maize breeding populations. The most reliable secondary trait for indirect selection for grain yield under Striga infestation was the ear aspect.

1. Introduction

The introgression of novel genes for Striga resistance from the wild relative of maize, Zea diploperennis L., into the background of cultivated maize is a resourceful approach for genetic and physiological studies [1,2,3]. Moreover, it has tremendous potential in breeding that could be utilized to develop novel cultivars and for broadening the genetic base of tropical maize breeding populations. However, a thorough understanding of the genetic diversity in the maize inbred lines and assessment of their reactions to Striga are essential for systematic exploitation, to provide the capacity to meet changing environments and market requirements [4]. Furthermore, the information on the genetic diversity and relatedness within a germplasm collection could be an invaluable aid in deciding the best breeding strategies to be employed [5]. Additionally, the combination of pedigree information and genetic distance (GD) estimates could be useful for assigning inbred lines to distinct heterotic groups that could help to prevent crosses between closely related lines [6].
Deoxyribonucleic acid (DNA) markers are invaluable in determining the level of genetic diversity present within genetic materials because these markers are not influenced by the different processes of plant physiology or the environmental conditions [7]. In the past, genetic diversity in maize has been assessed using several types of DNA markers including restriction fragment length polymorphism (RFLP), randomly amplified polymorphism DNA (RAPD), simple sequence repeat (SSR) and single nucleotide polymorphism (SNP) markers. These markers have provided effective genotyping and are not affected by the different processes of plant physiology or the environment [8,9,10,11]. The high level of polymorphism together with cost effectiveness associated with SNP markers have resulted in this marker system being considered as the “markers of choice” in plant science including maize improvement [12]. At the International Institute of Tropical Agriculture (IITA), maize breeders have also focused on the genetic diversity of tropical maize inbred lines at the molecular level [13,14]. However, such information is rather limited in the extra-early (80–85 days to physiological maturity) and early (90–95 days to physiological maturity) maturing inbred lines compared to the medium-late maturing (100–120 days to physiological maturity) maize inbreds in the IITA’s maize improvement program [15].
Besides high grain yield, IITA’s early and extra-early maize program is focusing on breeding for combined resistance to Striga and drought stress. Although direct selection for grain yield alone is not reliable due to the complex genetic nature of the trait, low heritability of grain yield under stress and the significant genotype by environment interaction (GEI), particularly under different stress conditions, make selection a daunting task for breeders. Thus, plant breeders do not only continuously try to identify reliable secondary traits that have significant effects on economic yield, but also make efforts to develop multiple trait base indices for selection for improved stress tolerance [3,15,16]. Recently, we have also developed multiple trait base indices integrating grain yield and other important secondary traits in early and extra-early maize groups under different abiotic stresses [17], but their inclusion in the breeding program of the extra- early maize needs to be further verified.
The (IITA) maize program has used resistance genes from diverse germplasm sources, including temperate and tropical materials identified following several years of extensive testing in the savanna of West and Central Africa (WCA). However, the Striga resistance genes have not been as effective as desirable in the control of Striga, because they allow the flowering and seed production of Striga plants, thereby increasing the Striga seed bank in the soil. Consequently, there has been a search for novel genes for resistance to Striga hermonthica in the wild relative of maize, Zea diploperennis [3,18]. Several early maturing inbred lines have been developed containing the novel Striga resistance genes from Z. diploperennis in IITA. However, the combining ability of the inbreds have not been determined. Development of hybrid varieties, their promotion and adoption are promising strategies for an appreciable increase in maize production and to transform agriculture in WCA. Several seed companies have sprung up in the sub-region during the past two decades, setting the stage for commercial hybrid seed production. However, there are no commercial early maturing hybrids with high levels of Striga resistance available to these companies to produce for the farmers in the savanna, which is a Striga hotspot [15].
Information on the general and specific combining abilities of inbred lines is crucial in identifying productive hybrids for commercial hybrid production without making all possible crosses among the parental inbred lines. A major challenge presently confronting the IITA maize improvement program is to test the numerous inbred lines, developed from several source germplasms in hybrid combinations, to identify and promote commercialization of productive hybrids with high levels of Striga resistance genes in WCA. However, limited information is available on the combining ability, repeatability, heritability and performance of the early maturing white maize inbreds in hybrid combinations under Striga infestation and non-infested conditions. In the present study, we characterize a set of early maturing maize inbred lines selected for resistance to Striga from different source populations, including those containing genes for Striga resistance from the wild maize, Zea diploperennis, and assess genetic diversity at the molecular level using SNP markers. Additionally, we determine the combining abilities of the maize inbreds under Striga-infested environments and identify the most productive and stable hybrids under Striga-infested and non-infested conditions. Lastly, we examine the performance of the inbreds in hybrid combinations, heritability and repeatability, and investigate the associations among measured traits under Striga infestation and non-infested conditions using sequential path analysis.

2. Materials and Methods

2.1. Development of Genetic Materials

An extra-early maize population, TZEE-W Pop STR C4, with tolerance to drought and Striga resistance was crossed to four IITA intermediate maturing white inbred lines, namely TZSTRI 104, TZSTRI 105, TZSTRI 107 and TZSTRI 108, containing genes for Striga resistance from the wild maize, Zea diploperennis, in an effort to transfer Striga resistance genes into the population. In order to recover extra-earliness, the resulting F1s were backcrossed for two consecutive generations to TZEE-W Pop STR C4 population, followed by selfing for six generations under Striga and drought conditions to develop several early maturing white inbred lines with resistance to Striga hermonthica and tolerance to low soil nitrogen and drought. A total of thirty-six early maturing inbreds derived from the diverse germplasm sources was selected for the present study (Table S1).
Twenty-nine out of the 36 inbreds used in the study shared common Striga resistance genes from the wild relative of maize, Zea diploperennis, and were designated as TZdEI lines, while the remaining seven lines, without the genes from the wild maize, were designated as TZEI. The 30 inbred lines used for the genetic study were selected from the 36 lines used for the diversity study based on their performance under Striga infestation. The 30 inbred lines were crossed using the North Carolina II mating design [19] with six sets, each containing five inbred lines. The five inbred lines in one set were used as females and crossed to five inbred lines in another set used as males. Each inbred line was used as a female parent in one set and a male parent in another set. A total of 150 crosses (six sets × 25 hybrids) were made.

2.2. Field Evaluation

2.2.1. Experimental Locations and Field Layout

Two field experiments were conducted between 2014 and 2015. In the first experiment, the 36 inbred lines were assessed under Striga-infested conditions in Mokwa (9°18′ N and 5°4′ E, 457 m altitude, 1100 mm annual rainfall) in 2014 and 2015 and Abuja (9°15′N and 7°20′E, 300 m altitude, 1700 mm annual rainfall) in 2015, while the 150 early maturing single cross hybrids plus six commercial hybrid checks were evaluated at Abuja and Mokwa in 2014 and 2015. The second field experiment was conducted under non-infested conditions at Mokwa and Abuja in 2014 and 2015, at the same time with the Striga-infested experiments. The inbred experiment at each location was laid out as 6 × 6 lattice square design, while the hybrid trials at each location was laid out as 12 × 13 randomized incomplete block design, replicated twice. Four-meter single row plots spaced 0.75 m apart with 0.4 m between plants in each row were used. In all the field experiments, three maize seeds per hole were sown, and 10 days after planting, thinning was performed, resulting in two plants per hole, giving a final plant stand of 66,667 plants ha−1.
In the Striga experiment, the artificial Striga-infestation procedure recommended by the IITA Maize Improvement Program was adopted [20]. In order to ensure uniform infestation, ethylene gas was injected into the soil at a depth of 12 cm one week before planting and repeated at intervals of 1 m. Striga seeds collected from Striga plants in Sorghum bicolor (L.) Moench fields at end of the growing season, and stored for at least six months to break seed dormancy, were used for infestation. The Striga seeds were mixed thoroughly with sand in the proportion of 1:99 by weight. The Striga seed–sand mixture was applied using calibrated scoops, which provided about 5000 germinable seeds to each planting hole. An amount of 20 kg ha−1 each of N, P and K in the form of 15-15-15 NPK and 10 kg ha−1 N as urea was applied at three and five weeks after planting (WAP) instead of the normal two and four WAP, respectively. The delayed and reduced fertilizer rates were necessary to stimulate the production of strigolactones and enhance both Striga emergence and attack because high levels of nitrogenous fertilizer suppress Striga emergence and growth [20]. Weeds other than Striga were controlled manually.

2.2.2. Data Collection

In all experiments, data for measured traits were recorded on individual plot basis. Data on number of days to 50% anthesis (DA) and 50% silking (DS) were recorded when half of the plants in a plot had started to shed pollen and produce silks, respectively. The difference between DA and DS was considered as anthesis-silking interval (ASI). The plant height (PH) and ear height (EH) were measured on ten plants per plot as the distance from the base of the plant to the first tassel branch and to the node carrying the upper ear, respectively. Ears per plant (EPP) were calculated as the total number of harvested ears per plot divided by the number of plants in the plot. Plant aspect (PASP) was estimated as an overall architecture of the plants in a plot using a scale of 1 to 9, where 1 = excellent (uniform and free from foliar diseases) and 9 = very poor (non-uniform plants with diseases). Husk cover was also scored on a scale of 1 (very tightly arranged husks, extended beyond the ear tip) to 9 (ear tips loose with kernels exposed). Ear aspect (EASP), which is the general appearance of the ears/cobs, was also recorded on a scale of 1 to 9, where 1 = clean ears with no insect and disease symptoms, large, uniform and tightly filled ears and 9 = ears with about 90–100% disease and insect damage. At physiological maturity, stalk and root lodging were measured on plot basis as percent of plants broken below the highest ear node and those that had lodged at the root level in a plot, respectively. Grain yield of the Striga experiments at Mokwa and Abuja was computed based on 80% shelling percentage and adjusted to 15% moisture content. The grain moisture was determined using a moisture meter on a sample of ten ears randomly picked per plot.
In the Striga experiments, additional data such as number of emerged Striga plants and Striga damage were also recorded on the plot basis at both 8 and 10 WAP. Striga damage was rated on individual plots on a scale of 1 to 9, where 1 = highly resistant plants with no Striga damage, and 9 = highly susceptible plants with no ears [21,22].

2.3. Statistical Analyses

Analysis of variance (ANOVA) was done for Striga-infested and non-infested conditions with PROC general linear model in SAS using a RANDOM statement with the TEST option [23]. Prior to data analysis, the number of emerged Striga plants were subjected to logarithm transformation using log (y + 1), before analysis of variance, to ensure the data conforms to normality. At physiological maturity, stalk lodging (number of plants broken below the highest ear node) and root lodging (number of plants that fell from the root) were counted and converted into percentages, followed by square root transformation, to ensure the data conforms to normality. Similarly, ANOVA was conducted for measured traits across research conditions. In the ANOVA, the location–year combination was considered as the environments, replicates and blocks were random factors, while inbred lines (genotypes) were considered as fixed factors and the adjusted means and standard errors were estimated. The hybrid component of the variation was divided into variation due to male sets, female sets and female–male interactions sets. The F-test for male, female and female–male mean squares was calculated using the mean squares for the respective interactions with the environments. The mean squares attributable to environment × female–male sets were tested using the pooled error mean squares. The main effects of the male sets and female sets was the general combining ability (GCA) effects, while the female–male sets interactions represented the specific combining ability (SCA) effects [24].
The outstanding single-cross hybrids for commercial production under Striga infestation were identified using a selection base index [25], which integrated standardized data for selected variables. Under Striga infestation, the selection index values were calculated as:
SI = [(2 * GY) + EPP − (SRD8 + SRD10) − 0.5 (NESP8 + NESP10)]
where GY is the grain yield under Striga infestation, EPP is number of ears per plant, SRD8 and SRD10 are host plant damage by Striga at 8 and 10 WAP, respectively, and NESP8 and NESP10 are number of emerged Striga plants at 8 and 10 WAP, respectively. The yield data of the selected 35 early hybrids (top-yielding 25 and lowest 10 yielding hybrids) were subjected to the additive main effects and multiplicative interaction (AMMI) analysis to examine the relationships among hybrids (G), environments (E) and G–E interaction. The AMMI model described by [26,27,28] was adopted.
The mid-parent heterosis (MPH) and better parent heterosis (BPH) for grain yield and other agronomic traits were calculated as follows:
MPH = ( F 1 MP ) MP   × 100   BPH = ( F 1 BP ) BP   ×   100
where BP = the mean of the better parent, F1 = mean of the hybrid performance and MP = (P1 + P2)/2, where P1 and P2 are the means of the inbred parents, respectively. The relative importance of GCA and SCA effects was determined as the ratio of GCA effects to the total genetic effects using the sum of squares. The closer the ratio was to unity, the greater the predictability based on GCA [29]. Repeatability of the traits [30] under Striga-infested and non-infested environments were computed on genotype-mean basis using the following formula:
R = σ g 2 σ g 2 + σ g e 2 e + σ 2 r e
where r is the number of replicates per environment; e is the number of environments; σg2 is variance due to genotypes; σ2ge is variance due to genotype–environment interactions; σ2 represents the estimate of experimental error variance. The restricted maximum likelihood (REML) method in the SAS MIXED procedure was used to estimate variances.
Broad-sense heritability (H2) of grain yield and other traits were estimated as
H 2 = σ g 2 σ g 2 + σ 2 e r
where σ2g is genotypic variance of a trait, σ2e is the variance due to environment and r is the number of replications. Mokwa 2015 environment had heritability of grain yield less than 0.30 and was removed from all analyses (Table not shown). Sequential path co-efficient analyses were performed to explain the relationships among traits of the inbreds under each and across research conditions using the method described by [16]. The stepwise regression was used to place the predictor traits into first, second and third order based on their individual contributions to the total differences in grain yield with minimized multicollinearity [31,32]. At first, all the traits were regressed on grain yield and those with significant contributions to grain yield at p < 0.05 were identified as first order traits. Subsequently, traits that were not identified as first-order traits were regressed on each of the first order traits to identify those with significant contributions to grain yield through the first-order traits and were categorized as second-order traits. The procedure was repeated to identify traits in subsequent orders. The path coefficients were the standardized b-values obtained from the regression analysis [16,31,32,33]. The stepwise multiple regression analysis tested the significance of the path coefficients using t-test at 0.05 level of probability and retained only traits with significant values and indicated the percentage of the variation contributed to the dependent variable.

2.4. Molecular Analysis

2.4.1. DNA Extraction and Genotyping with SNP Markers

The 36 inbred lines, screened for field reactions to S. hermonthica (Table S1), were planted in the IITA greenhouse in Ibadan for genetic diversity assessment. Fresh leaves samples were collected from two-week-old seedlings of each inbred line and stored at −80 °C. The leaf samples were lyophilized at −50 °C, 1–22 pascals pressure for 48 h in a console dry system from Labconco (Labconco Inc., Kansas City, MO, USA). DNA was extracted from the lyophilized leaves using a modified CTAB (Cetyl Trimethyl Ammonium Bromide) protocol [34]. The quantity and quality of the DNA in each sample was tested on 1% agarose gel using standard λ-DNA and were dispatched to CIMMYT, Mexico for genotyping using the Diversity Arrays Technology (DArT) sequence platform (www.diversityarrays.com/dart-application-dartseq). Two inbred lines (TZdEI 268 and TZEI 26) had low quality genomic DNA and were removed from the molecular analysis.

2.4.2. Data Cleaning and Genetic Diversity Analysis

A total of 51,009 single nucleotide polymorphism (SNP) markers were obtained. The raw DArT file was transformed using the PowerMarker software version 3.25 format and was used to compute the major allele frequency, heterozygosity, polymorphic information content (PIC) and allele diversity value for all markers [35]. Filtering of data let out markers with more than 10% missing data, heterozygosity >20% and a minor allele frequency (MAF) < 0.05 [11], leaving a total of 4440 high-quality SNP markers for further analysis. Cluster analysis was performed using DARwin software [36] based on the genetic distance (GD) matrix, using neighbor joining (NJ) trees for the SNP marker data and drawn with FigTree software (http://tree.bio.ed.ac.uk/software/figtree/).

2.4.3. Population Structure Analysis

The data from 4440 SNP markers were subjected to population structure analysis based on the admixture model-based clustering method using the software package STRUCTURE 2.3.4 [37]. The model was run by varying the number of clusters (K) from 1 to 15 with 10–20 simulations for each K. A burn-in period of 10,000 for each K and Markov Chain Monte Carlo (MCMC) replications of 10,000 after each burn-in was used. The best k was identified by inputting the results obtained by the Evanno method on the STRUCTURE HARVESTER software [38,39]. Individual lines with membership probability ≥0.70 were placed in the same group while lines with membership probability <0.70 were placed in a mixed group [6,40].

3. Results

3.1. Inbred and Hybrid Performance and Reactions under Striga Infestation

For the inbred experiment, the combined analysis of variance across Striga infestation in 2014 and 2015 revealed that the two main effects, inbreds (G) and environment (E) and their interactions (GEI), were significant for all measured traits except E for ear aspect, GEI for grain yield, days to anthesis, number of EPP and number of emerged Striga plants at eight WAP (Table 1). The combined ANOVA of the 156 early maturing single cross hybrids evaluated across locations (Mokwa and Abuja) under artificial Striga infestation in 2014 and 2015, showed highly significant (p < 0.01) hybrids (G), environments (E) and hybrid–environment interaction (GEI) mean squares for all measured traits (Table 1). Furthermore, significant (p < 0.01) sets and environment–sets interaction effects were obtained for most measured traits except sets mean squares for Striga damage at eight WAP; environments–sets interactions mean squares for ASI and EPP. Similarly, the variation among male (GCA-male) and female (GCA-female) in sets and the male–female interactions (SCA) were highly significant (p < 0.01) for all measured traits except SCA for ASI, and EPP. Furthermore, interactions of the GCA-male and GCA-female with the environment were highly significant for grain yield and other agronomic traits, except E–GCA-male for Striga damage at eight WAP. Additionally, the SCA–environment interactions were significant (p < 0.05) for most measured traits except ASI, and EPP. The variation due to GCA-male and GCA-female were larger than those of SCA for all measured traits under Striga infestation.
Under non-infested environments, highly significant differences were observed among hybrids, environment, G–E interaction, GCA-male, GCA-female, and GCA-male–E interaction effects for all traits (Table 1). However, the SCA effect, GCA-female–E interaction and SCA–E interaction mean squares were significant for all traits except SCA and GCA-female–E interaction mean squares for ASI and SCA–E interaction effects for ASI, EPP and root lodging. The GCA-male and GCA-female effects were substantially larger than SCA effects for all traits.
The heritability values of the inbred experiment ranged from 0.33 for the anthesis-silking interval and Striga damage at eight WAP to 0.81 for days to anthesis under Striga infestation while the heritability estimates of the hybrid trials ranged from 0.30 for grain yield to 0.67 for days to anthesis, Striga damage at 10 WAP and number of emerged Striga plants at eight WAP (Table 1). Under non-infested conditions, the heritability estimates ranged from 0.35 for husk cover to 0.76 for grain yield and days to silking (Table 1).
Under Striga infestation, grain yield of the inbred lines varied from 909 kg ha−1 for TZdEI 84 to 2879 kg ha−1 for TZdEI 283, with a mean of 1547 kg ha−1 (Table 2), while the mean grain yield of hybrids ranged from 1134 kg ha−1 for the Striga susceptible check, TZEI 26 × TZEI 5, to 5362 kg ha−1 for TZdEI 173 × TZdEI 280, with a mean of 3146 kg ha−1 (Table 3). Under non-infested environments, grain yield ranged from 2376 kg ha−1 for TZdEI 82 × TZdEI 71 to 7769 kg ha−1 for TZdEI 260 × TZdEI 396, with a mean of 5601 kg ha−1 (Table 3).
The highest yielding Striga-resistant hybrid, TZdEI 173 × TZdEI 280, out-yielded the commercial hybrid check TZEI 60 × TZEI 86 by 3234 kg ha−1. The average yield reduction of the hybrids under Striga infestation was 44%. The reduction in grain yield of the hybrids was accompanied by increased days to silking, ASI, bareness and poor ear aspect. There were no significant differences among the top 25 hybrids under Striga-infested environments using the IITA selection index. Striga damage of the inbred lines at eight WAP ranged from 3.0 to 5.17, with a mean of 4.09; while at 10 WAP, it ranged from 3.50 to 6.33, with a mean of 4.83. The number of emerged Striga plants of the inbred lines ranged from 0.14 to 2.75 and 1.0 to 3.1 at eight and 10 WAP, respectively. Only 18 inbred lines, out of the 36 evaluated, had positive base indices under Striga infestation. The base index is an indication of response of the inbred lines to Striga infestation. A positive base index meant resistance/tolerance to Striga, while a negative base index meant susceptibility to Striga.
The yield performance and stability of the selected 35 early maturing maize hybrids (best 25 and worst 10 hybrids using the base index) evaluated under Striga infestation are presented in the AMMI biplot (Figure 1). The vertical dotted line of the AMMI biplot represents the grand mean for grain yield, while the horizontal dotted line (x ordinate) represents the interaction principal component axes 1 (IPCA1) value of zero. Hybrids located close to the horizontal line have small interactions with the environment and are more stable than those farther from it. The farther a cultivar is to the right side of the grand mean line, the higher the grain yield.
Under Striga infestation, E (environment), G (hybrids), and the IPCA1 accounted for 6.76, 51.47, and 30.9% of the total variation in the sum of squares for grain yield, respectively, giving a total sum of 89.1%. This indicated that the biplots were effective in explaining both the main effects as well as decomposing the G–E interaction under Striga environments (Figure 1). The hybrids 2 (TZdEI 173 × TZdEI 280), 5 (TZdEI 82 × TZdEI 260), 7 (TZdEI 357 × TZdEI 82), 8 (TZdEI 314 × TZdEI 105), 11 (TZdEI 280 × TZdEI 485), 13 (TZdEI 105 × TZdEI 173), 15 (TZdEI 98 × TZdEI 352), 16 (TZdEI 441 × TZdEI 260), 17 (TZdEI 268 × TZdEI 120) and 20 (TZdEI 492 × TZdEI 441) produced yields greater than the grand mean and had near zero IPCA1 score, indicating that they were the most stable under Striga-infested environments. The hybrids 1 (TZdEI 173 × TZdEI 352), 3 (TZdEI 352 × TZdEI 315), 7 (TZdEI 357 × TZdEI 82), 9 (TZdEI 378 × TZdEI 173), 10 (TZdEI 268 × TZdEI 105), 12 (TZdEI 268 × TZdEI 131), 19 (TZdEI 120 × TZdEI 173), 20 (TZdEI 492 × TZdEI 441), 23 (TZdEI 82 × TZdEI 399) and 25 (TZdEI 352 × TZdEI 82) produced yields greater than the grand mean but had positive interactions with IPCA1, indicating that they were adapted to high yield environments (E2), while hybrids 4 (TZdEI 71 × TZdEI 268), 6 (TZdEI 260 × TZdEI 268), 14 (TZdEI 352 × TZdEI 485), 21 (TZdEI 485 × TZdEI 260) and 24 (TZdEI 479 × TZdEI 124) yielded higher than the grand mean but showed strong negative interaction with IPCA1, indicating that they were adapted to low yield environments (E3).

3.2. Relative Contributions of Combining Ability Effects

Under Striga-infested environments, the overall contributions of GCA (GCAm plus GCAf) sum of squares to the total variation among hybrids varied from 49% for stalk lodging to 78% for ear height, while SCA varied from 21% for ear height to 51% for stalk lodging (Table 4). The percentage contribution of the GCA-male sum of squares were larger than that of GCA-female for grain yield, ASI and number of emerged Striga plants at eight WAP, while the contribution of GCA-female was greater than the GCA-male for days to 50% anthesis and silking, plant and ear heights, stalk lodging, husk cover, ear aspect, ears per plant, Striga damage at eight and 10 WAP and number of emerged Striga plants at 10 WAP. GCA accounted for about 65% of the sum of squares for grain yield, 67 and 73% for Striga damage at eight and 10 WAP and 62% each for number of emerged Striga plants at eight and 10 WAP, respectively.

3.3. General Combining Ability Effects

The significant GCA-male effects for grain yield under Striga infestation ranged from −18 for TZdEI 315 to 996 for TZdEI 173, while significant GCA-female effects ranged from −20 for TZdEI 399 to 893 for TZdEI 268 (Table 5). Inbred lines TZdEI 173 had positive and significant GCA-male and GCA-female effects for grain yield; TZdEI 260 had only positive and significant GCA-male effect, while TZdEI 352 had only positive and significant GCA-female effect for grain yield. Contrarily, Inbreds TZEI 31 and TZdEI 84 had both negative and significant GCA-male and GCA-female effects for grain yield, while TZdEI 202 and TZdEI 378 had only negative and significant GCA-male effect for grain yield (Table 5). Inbreds TZEI 31, TZdEI 84, TZEI 18 and TZdEI 202 had both positive and significant GCA-male and GCA-female effects for Striga damage at eight and 10 WAP, while Inbreds TZdEI 173 and TZdEI 352 had both negative and significant GCA-male and GCA-female effects for Striga damage at eight and 10 WAP. The inbreds TZdEI 124 and TZdEI 131 had negative and significant GCA-male effects for Striga damage at both eight and 10 WAP. The inbred TZdEI 268 showed negative and significant GCA-female effects for Striga damage at eight WAP, but negative and significant GCA-female and GCA-male effects for Striga damage at 10 WAP. However, TZdEI 441 had negative and significant GCA-female and GCA-male effects for Striga damage at eight WAP, but only the GCA-male effects were significant for Striga damage at 10 WAP. Contrarily, inbreds TZdEI 268, TZdEI 479 and TZdEI 485 had negative and significant GCA-male and GCA-female effects for number of emerged Striga plants at eight and 10 WAP, while TZdEI 71, TZdEI 84 and TZdEI 120 had negative and significant GCA-male effect for anumber of emerged Striga plants at eight and 10 WAP. Contrarily, TZdEI 173 had negative and significant GCA-female effects for number of emerged Striga plants at eight and 10WAP. Days to 50% silking showed significant and positive GCA-male and GCA-female effects for TZdEI 399, TZdEI 441 and TZdEI 264. Additionally, TZdEI 396, TZdEI 357 and TZdEI 283 had positive and significant GCA-male effects, while TZdEI 124, TZdEI 260, and TZdEI 105 had only negative and significant GCA-male effects for days to silking. Contrarily, TZdEI 202, TZdEI 485, TZdEI 352, TZEI 18 and TZdEI 157 had only positive and significant GCA-female effects for days to silking, while TZdEI 71 and TZdEI 268 had only negative and significant GCA-female effects for days to silking (Table 5).

3.4. Relationship between Performance of Parental Inbred Lines and Their Hybrids

The average mid and high parent heterosis for grain yield were 96 and 73% under Striga-infestation (Table 6). Negative mid and high parent heterosis were recorded for days to 50% anthesis and silking under Striga infestation. On the other hand, positive mid and high parent heterosis was observed for Striga damage and number of emerged Striga plants at eight and 10 WAP and ear aspect under Striga-infestation (Table 6).

3.5. Genetic Diversity Analysis Using DArT-Seq Markers

A total of 4440 high-quality SNP markers obtained after data filtering were used for the genetic diversity analysis. Heterozygosity varied from 0.00 to 0.19 with a mean of 0.10 (Table S2). The major allele frequencies of the 4440 markers averaged 0.72 with a range from 0.50 to 0.94. The polymorphic information content (PIC) ranged from 0.00 to 0.38 with an average of 0.10.
The neighbor-joining tree plotted on the basis of genetic distance matrix according to [41], divided all the inbred lines into three major clusters (Figure 2). All the 28 inbred lines designated as TZdEI sharing common Striga resistance genes from the wild relative of maize, Z. diploperennis, were equally divided in two clusters: C-II and C-III. On the other hand, cluster C-I forming the smallest group contained the remaining six lines namely, TZEI 65, TZEI 7, TZEI 18, TZEI 3B, TZEI 2 and TZEI 31, that did not contain Striga resistance genes from Z. diploperennis introgression.
Interestingly, the clusters C-II and C-III had two sub-clusters, each with six and eight inbred lines, respectively (Figure 2). All the inbred lines belonging to sub-cluster C-IIa exhibited the resistance/tolerance to Striga stress, except inbred line TZdEI 551, which showed susceptibility to Striga. On the other hand, most of the inbred lines belonging to sub-cluster C-IIb were found to be susceptible to S. hermonthica. In sub-cluster C-IIb, only one inbred line, TZdEI 357, and two inbred lines, TZdEI 202 and TZdEI 396, were resistant to S. hermonthica. None of the inbred lines in cluster C-I were found to be resistant or tolerant to S. hermonthica. On the other hand, the inbred lines in the third cluster (C-III) had varying levels of reaction to Striga infestation, such as susceptibility or resistance.

3.6. Population Structure

The best “K” for the inbred lines estimated by the Evanno’s method was found to be 3, and the admixture model-based STRUCTURE analysis grouped the inbred lines into three sub-populations (Figure 3). The membership of each sub-population was assigned to the inbred lines based on their association probability to these sub-populations. Inbred lines in the same sub-population had probabilities of association ≥70%. Only 50% of the inbred lines studied were assigned to the specific sub-populations, whereas the remaining lines were considered as admixture (Figure 3). Sub-population 1 (red color) consisted of 14.7% of the inbred lines, whereas sub-population 2 (green color) and 3 (blue color) had 5.9 and 29.4% of the inbred lines, respectively.

3.7. Relative Importance of Secondary Traits to Grain Yield under Striga Infestation

The stepwise multiple regression results identified ear aspect (EASP) as the most important trait with significant direct contribution to grain yield, explaining about 51% of the variation under Striga infestation (Figure 4). Four traits, namely anthesis-silking interval, Striga damage score at eight and 10 WAP, and number of emerged Striga plants at eight WAP were identified for the second-order traits, with indirect contributions to grain yield. Among the four second-order traits, Striga damage at 10 WAP (0.657) and ASI (0.278) had positive indirect contributions to grain yield, whereas the number of emerged Striga plants (−0.302) and Striga damage (−0.494) at eight WAP had negative indirect contribution to grain yield. Seven traits, namely husk cover, number of emerged Striga plants at 10 WAP, root lodging, ear height, days to silking, days to anthesis and stalk lodging, were identified in the third-order, but only husk cover made a contribution through two of the second-order traits (Striga damage score at eight and 10 WAP). All the third-order traits had positive indirect effects (0.156 to 0.919), except ear height and days to anthesis, which showed negative indirect effects through the second-order traits. Ears per plant and plant height constituted the fourth-order traits.

4. Discussion

The genotypic mean squares of the inbred lines and derived hybrids were highly significant for all the measured traits under Striga infestation, indicating that substantial genetic variation existed among the inbred lines, which should facilitate selection for Striga resistance and increased grain yield and other measured traits under the research conditions. Moreover, the significant environment mean squares observed under Striga infestation indicated that the test locations were unique in discriminating among the inbred lines, and that testing of the inbred lines in a wide array of locations over years will be required to identify the most stable lines for hybrid production [21]. The significant genotype by environment interaction (GEI) mean squares for Striga damage at eight and 10 WAP and number of emerged Striga plants at 10 WAP indicated that the inbred lines varied in their responses to infestation at the different locations, and that such variations in genotypic response could be due to the presence of different biotypes of S. hermonthica at the experimental locations. This provided a justification for evaluating the hybrids across the two distinct environments to identify those with consistent performance across the environments. This finding corroborates the results of [15,21]. The average yield reduction of the hybrids under Striga infestation was 44% relative to performance under non-infested conditions. This is consistent with the results of [42,43] who reported yield reduction of 42 and 44%, respectively, under Striga infestation. However, it is lower than the 53.7% reported by [44], 68% by [45], 65% by [46] and 55% by [15]. It is; however, higher than the yield reduction of 23% reported by [25]. The yield reduction of 44% suggested that the intensity of infestation in this study was high enough to allow the identification of hybrids that possessed genes for Striga resistance/tolerance.
Despite the high severity of infestation in this study, the novel Striga resistance genes from the wild relatives of maize, Z. diploperennis, in the genotypes allowed them to suppress the emergence of the Striga plants and produced high yields. In Striga research, resistance to Striga refers to the capability of the host plant to induce the germination of Striga seeds but prevent the parasite from attaching to the roots of the maize plants or kills the attached parasitic plants. Under Striga infestation, the resistant genotype supports significantly fewer Striga plants and produces a greater yield than the susceptible genotype. Contrarily, a Striga tolerant genotype supports as many Striga plants as the sensitive or susceptible genotype but produces more dry matter and shows fewer damage symptoms. S. hermonthica damage in maize is used as the indicator of tolerance, while emerged Striga plants is the indicator of resistance. Identification of maize genotypes that combine outstanding levels of resistance and tolerance is a promising breeding strategy and has been recommended for Striga resistance breeding in several studies [47,48,49]. The increased in grain yield of the hybrids under Striga infestation was accompanied by reduced number of emerged Striga plants as well as reduced Striga damage. The moderately high heritability (> 60%) obtained for days to 50% silking, Striga damage, number of emerged Striga plants and ear aspect under Striga infestation; grain yield, days to silking, plant and ear aspects under non-infested conditions indicated that the traits could be easily transmitted from the parental lines to their offspring. The significant GCA-male, GCA-female and SCA for grain yield and other agronomic traits except for ASI under Striga infestation suggested that the performance of the inbreds differed when used as either male or female parents in hybrid combinations. The preponderance of GCA variances over SCA for grain yield, and most measured traits under Striga infestation and non-infested conditions, implied that additive gene action largely controlled the inheritance of these traits. The implication is that selected inbred lines could be intercrossed to form heterotic populations, which could be improved through recurrent selection methods, such as the S1 family and the full-sib family selection schemes. Inbred lines tolerant to Striga infestation with high GCA effects could then be extracted from improved cycles of selection of derived populations for hybrid development. The high GCA over SCA mean squares for Striga damage and number of emerged Striga plants under Striga infestation indicated that additive gene action was more important in controlling both host plant damage and number of emerged Striga plants. The results of this study are, in part, contradictory to the findings of [47,48], who showed that non-additive gene action was more important than additive gene action in controlling the inheritance of host plant damage, while additive gene action was more important in governing the inheritance of the number of emerged Striga plants under Striga infestation. Furthermore, the findings of this study are contradictory to the results of [49,50,51], who reported that additive gene action controlled Striga damage, while non-additive gene action modulated the number of emerged Striga plants. The discrepancy in the results of the present study and those of the earlier researchers may be attributed to the differences in germplasm sources or the severity of the Striga infestation.
In this study, the percentage contributions of GCA-male and GCA-female effects did not significantly vary for grain yield and other traits under Striga-infested and non-infested conditions, implying that maternal or cytoplasmic genes did not have any influence on the measured traits. This finding is contrary to the results of [43], who reported maternal effects for days to silking and paternal effects for EPP in early maturing maize hybrids under Striga-infested environments.
Inbred lines TZdEI 268, TZdEI 352 and TZdEI 173 had positive and significant GCA (GCA-male and/or GCA-female) effects for grain yield under Striga infestation, indicating that the inbred lines may have contributed to higher grain yield in their hybrids under Striga infestation. Contrarily, TZdEI 260, TZdEI 396, TZdEI 479 and TZdEI 173 had positive and significant GCA effects for grain yield under non-infested conditions and are expected to contribute higher grain yield to their hybrids. The inbred lines with positive and significant GCA effects for grain yields could be used as parents to form a synthetic population that could be improved for Striga resistance based on the heterotic orientations of the inbred lines. Subsequently, new inbred lines with improved levels of Striga resistance could be extracted from the improved populations.
The selection index for Striga resistance/tolerance which integrated grain yield, ears per plant, Striga damage and number of emerged Striga plants revealed that only 50% of the inbred lines had positive base indices and; therefore, had good levels of resistance/tolerance to Striga. Using the base indices, TZdEI 173 × TZdEI 352 showed good performance under Striga infestation This result is interesting and encouraging, as Striga is a menace in the savannas of WCA, which is the maize belt of the region, and farmers in the sub-region are abandoning their heavily infested fields due to S. hermonthica. The superior yielding hybrids identified in the present study should be evaluated extensively in contrasting environments in multi-location trials to confirm the superior performance and commercialized in sub-Saharan Africa (SSA).
The average mid- and high-parent heterosis for grain yield observed under Striga infestation indicated that the hybrids produced more grain yield than their inbred parents. Negative mid- and high-parent heterosis values obtained for days to 50% anthesis and silking indicated that the hybrids flowered earlier than their corresponding inbred parents under Striga-infested environments. Additionally, the positive mid- and high-parent heterosis observed for Striga damage and number of emerged Striga plants at eight and 10 WAP indicated that the hybrids suffered severe Striga damage and allowed the emergence of more Striga plants than their susceptible parental lines.
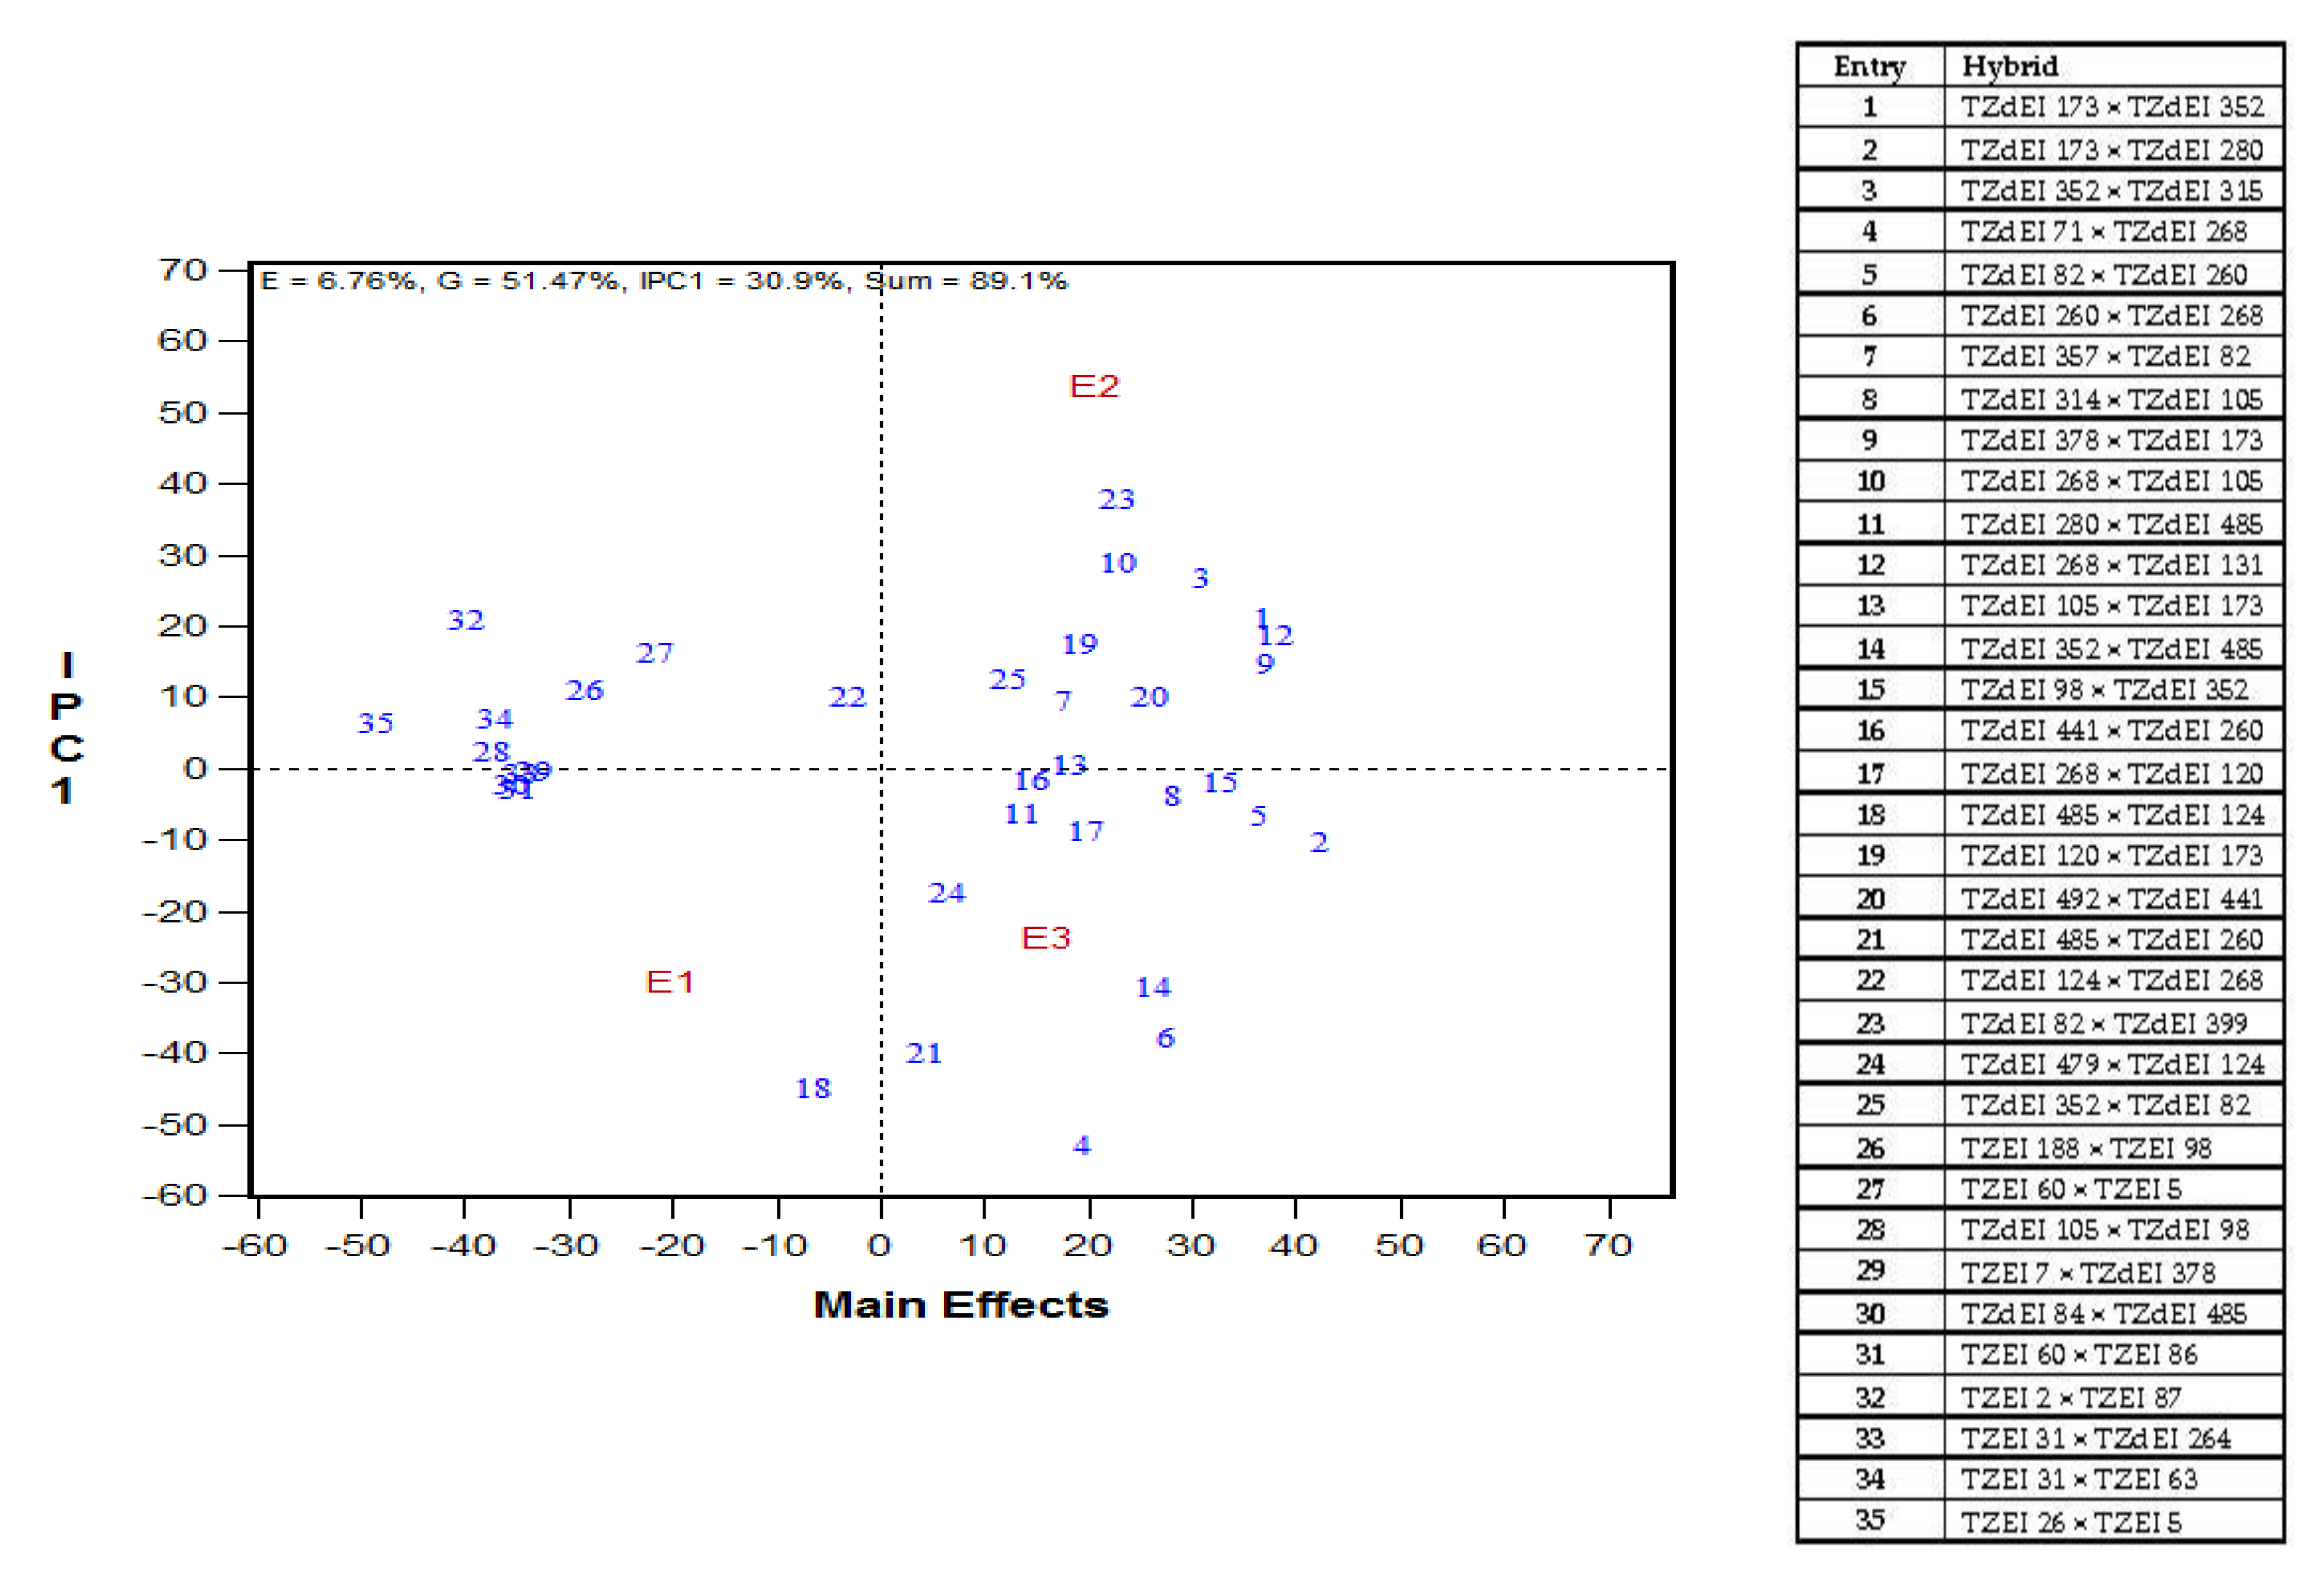
It is striking to note that five hybrids (TZdEI 173 × TZdEI 280, TZdEI 82 × TZdEI 260, TZdEI 98 × TZdEI 352, TZdEI 441 × TZdEI 260, TZdEI 492 × TZdEI 441) were identified by AMMI biplots as high yielding and stable under Striga infestation. These hybrids should be extensively tested in on-farm trials in SSA to confirm the consistency in performance, and vigorously promoted for commercialization, to contribute to food security and improved livelihoods of resource poor farmers in the sub-region.
Although maize is native of the tropical region, its global germplasm naturally forms two major groups—temperate and tropical (including subtropical)—which is further sub-grouped based on either trait or region in the world. In maize, several researchers have investigated marker-based diversity focusing on specific germplasm with limited sample sizes, including tropical and subtropical lines [52,53]. These studies have shown that there is much more diversity in tropical lines, giving huge opportunities for continuous long-term genetic gain. The average polymorphic information content (PIC) value of 0.10, in the present set of maize inbreds revealed by SNP markers, was lower than what was reported in previous studies of maize [53,54,55]. The differences in the results of the various authors may be attributed to the composition of germplasm, population size and type and number of molecular markers examined.
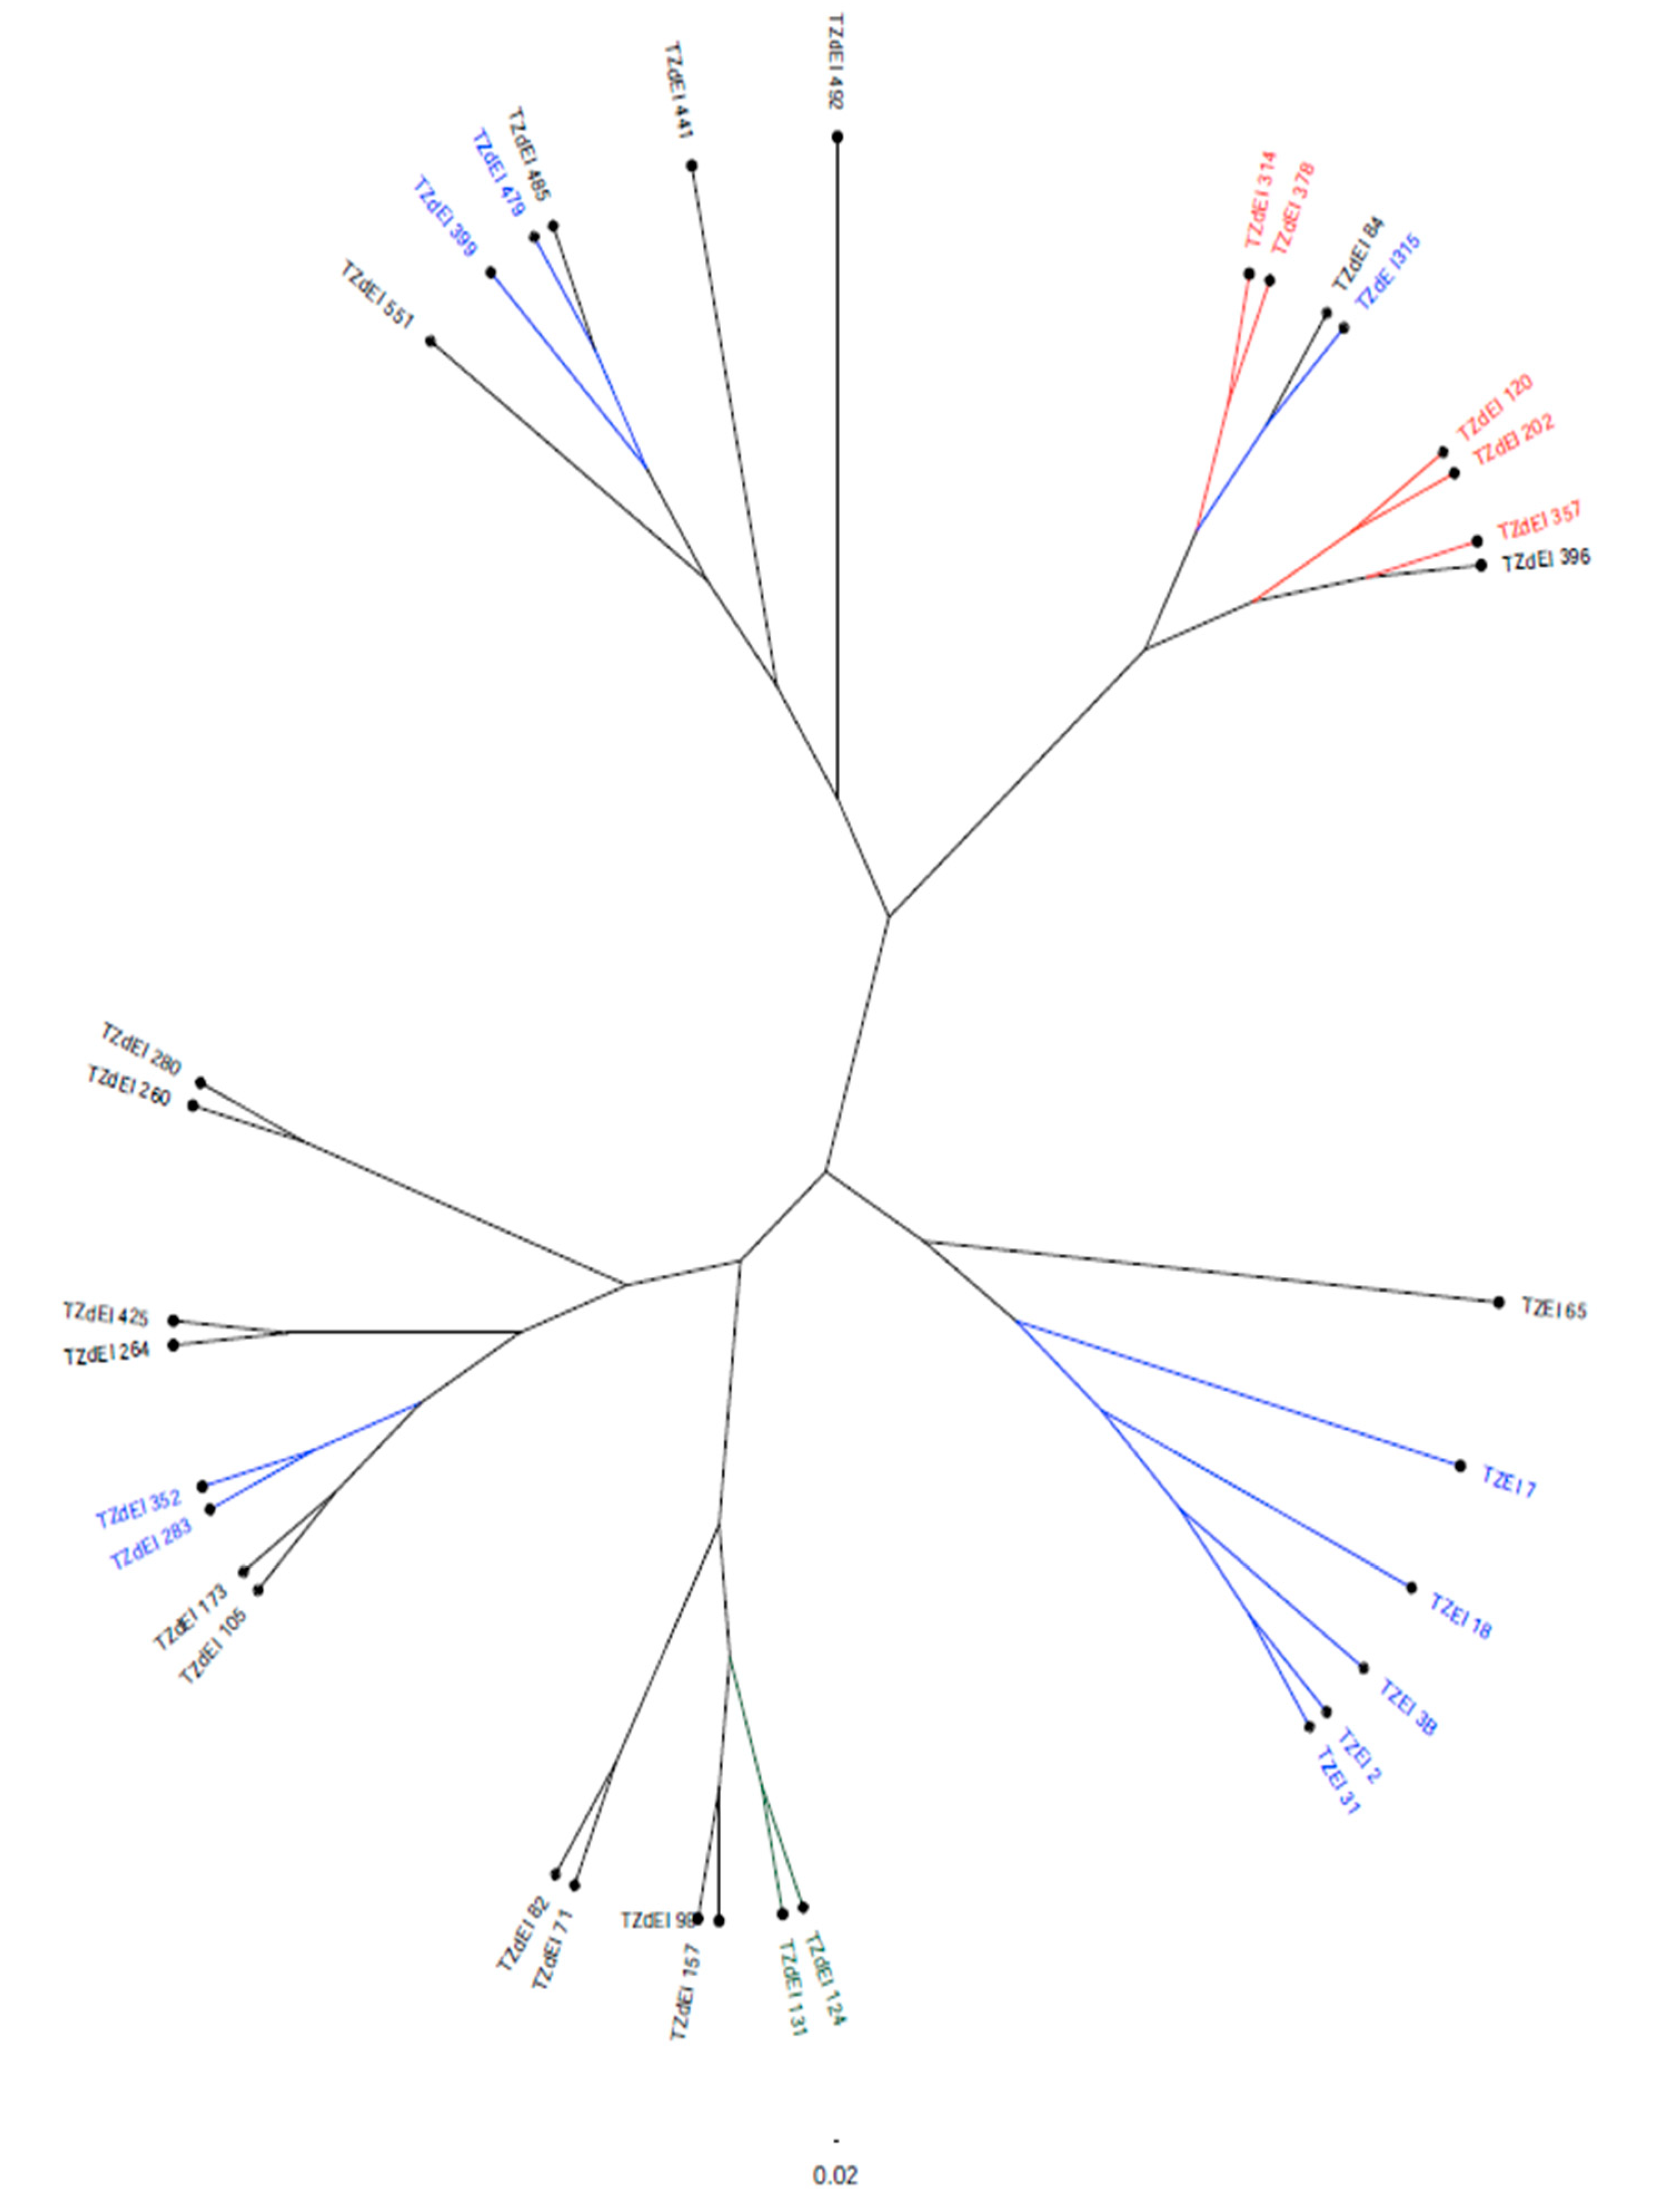
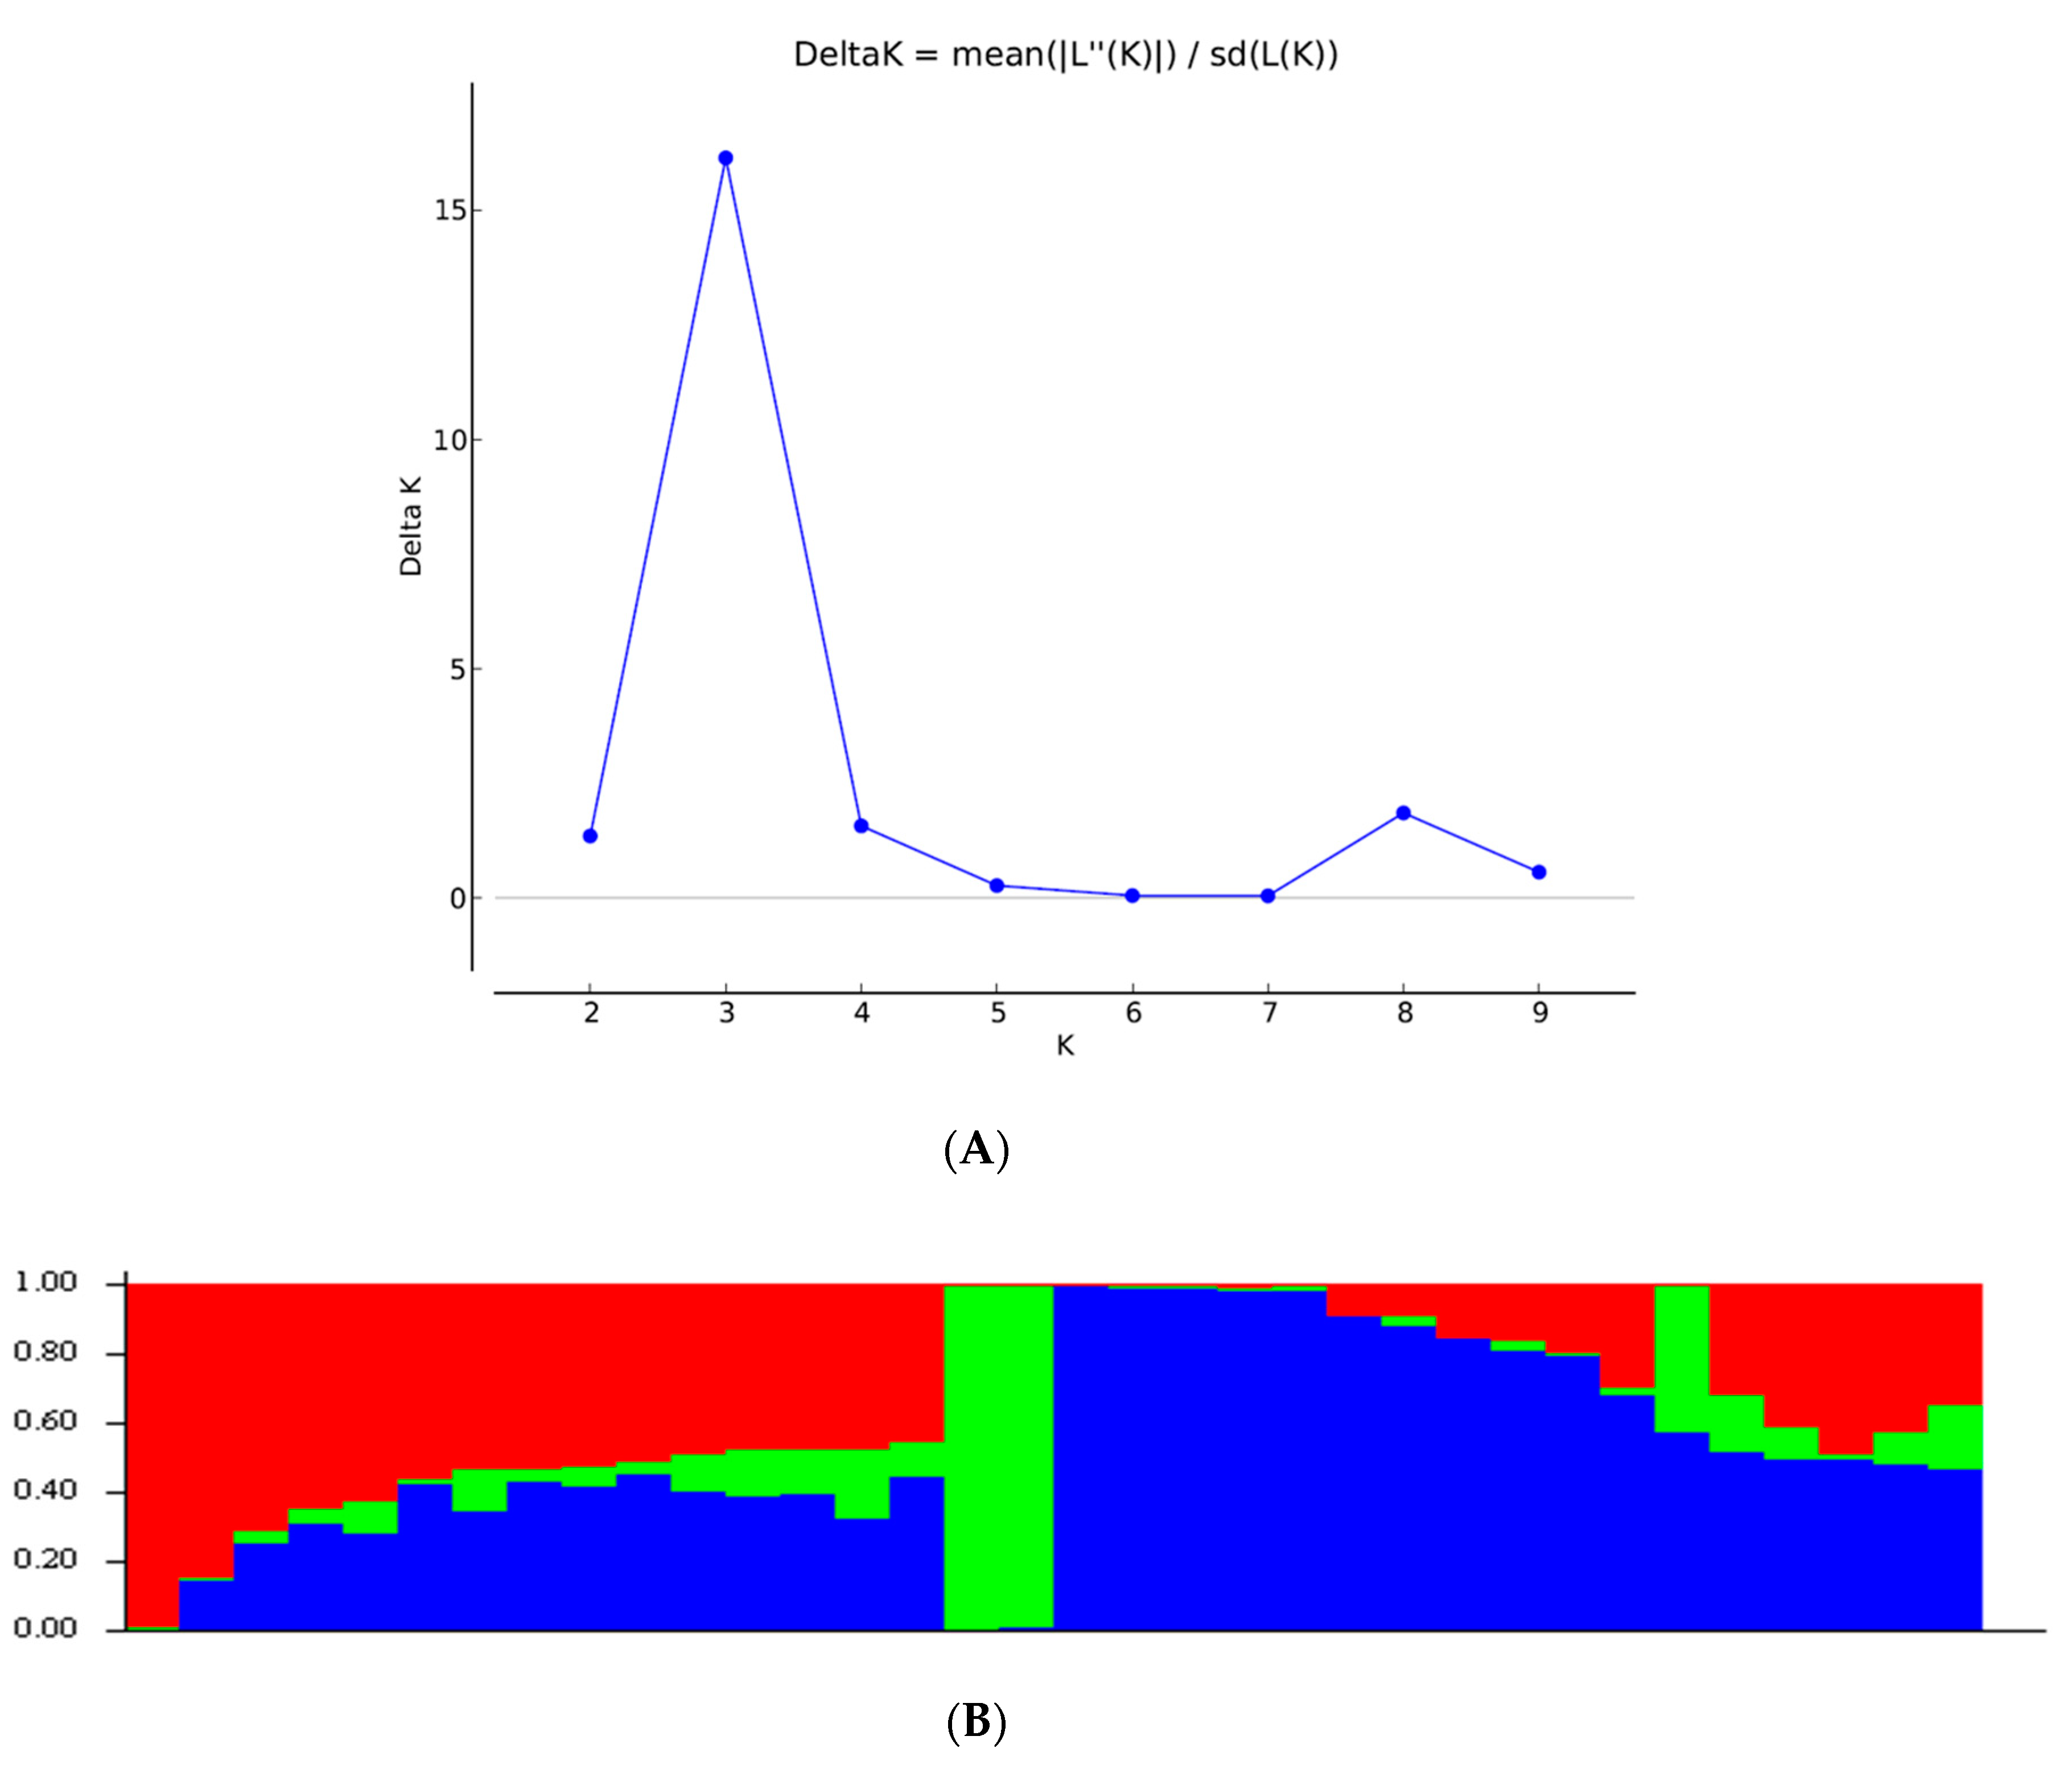
The SNP markers clearly grouped all the inbred lines into three clusters. The six TZEI lines without introgression from Z. diploperennis clustered closely together (C-I), whereas the remaining inbred lines having genes introgressed from the wild relative of maize, Z. diploperennis (designated as TZdEI), were grouped into two different clusters (C-II and C-III), each corresponding to two sub-clusters. Similarly, the STRUCTURE analysis differentiated the population into three sub-population groups. However, a large proportion of the inbred lines (50%) appeared as admixture at a probability >70%, as these inbred lines did not fit in any of the sub-population groups. Such large admixture is expected since these inbred lines were selected under Striga-infested conditions that may possibly favor the retention of higher proportion of introgression from the wild relatives of maize, Z. diploperennis L, for Striga resistance into the background of these inbred lines. For example, all the members of cluster I (C-I) also belonged to sub-population III (blue colour), except TZEI 65, which was considered as admixture genotype by STRUCTURE analysis. The second cluster (C-II) was subdivided in two sub-clusters (C-IIa and C-IIb), but the sub-cluster C-IIb, which contained most of lines susceptible to Striga stress, also contained all the five inbreds belonging to sub-population I (red colour) based on STRUCTURE analysis. The third cluster (C-III) contained 14 individuals, the majority being in the admixture sub-population, but the two inbred lines forming sub-population II (green color) via STRUCTURE analysis were clustered together in sub-cluster C-IIIa, representing resistance to Striga infestation. This is consistent with the results of the previous study of [53] with CIMMYT maize inbred lines, which suggested that it was much more difficult to find a clear clustering based on the traits for which lines were bred. Because of their similar origin, they are not genetically distinct.
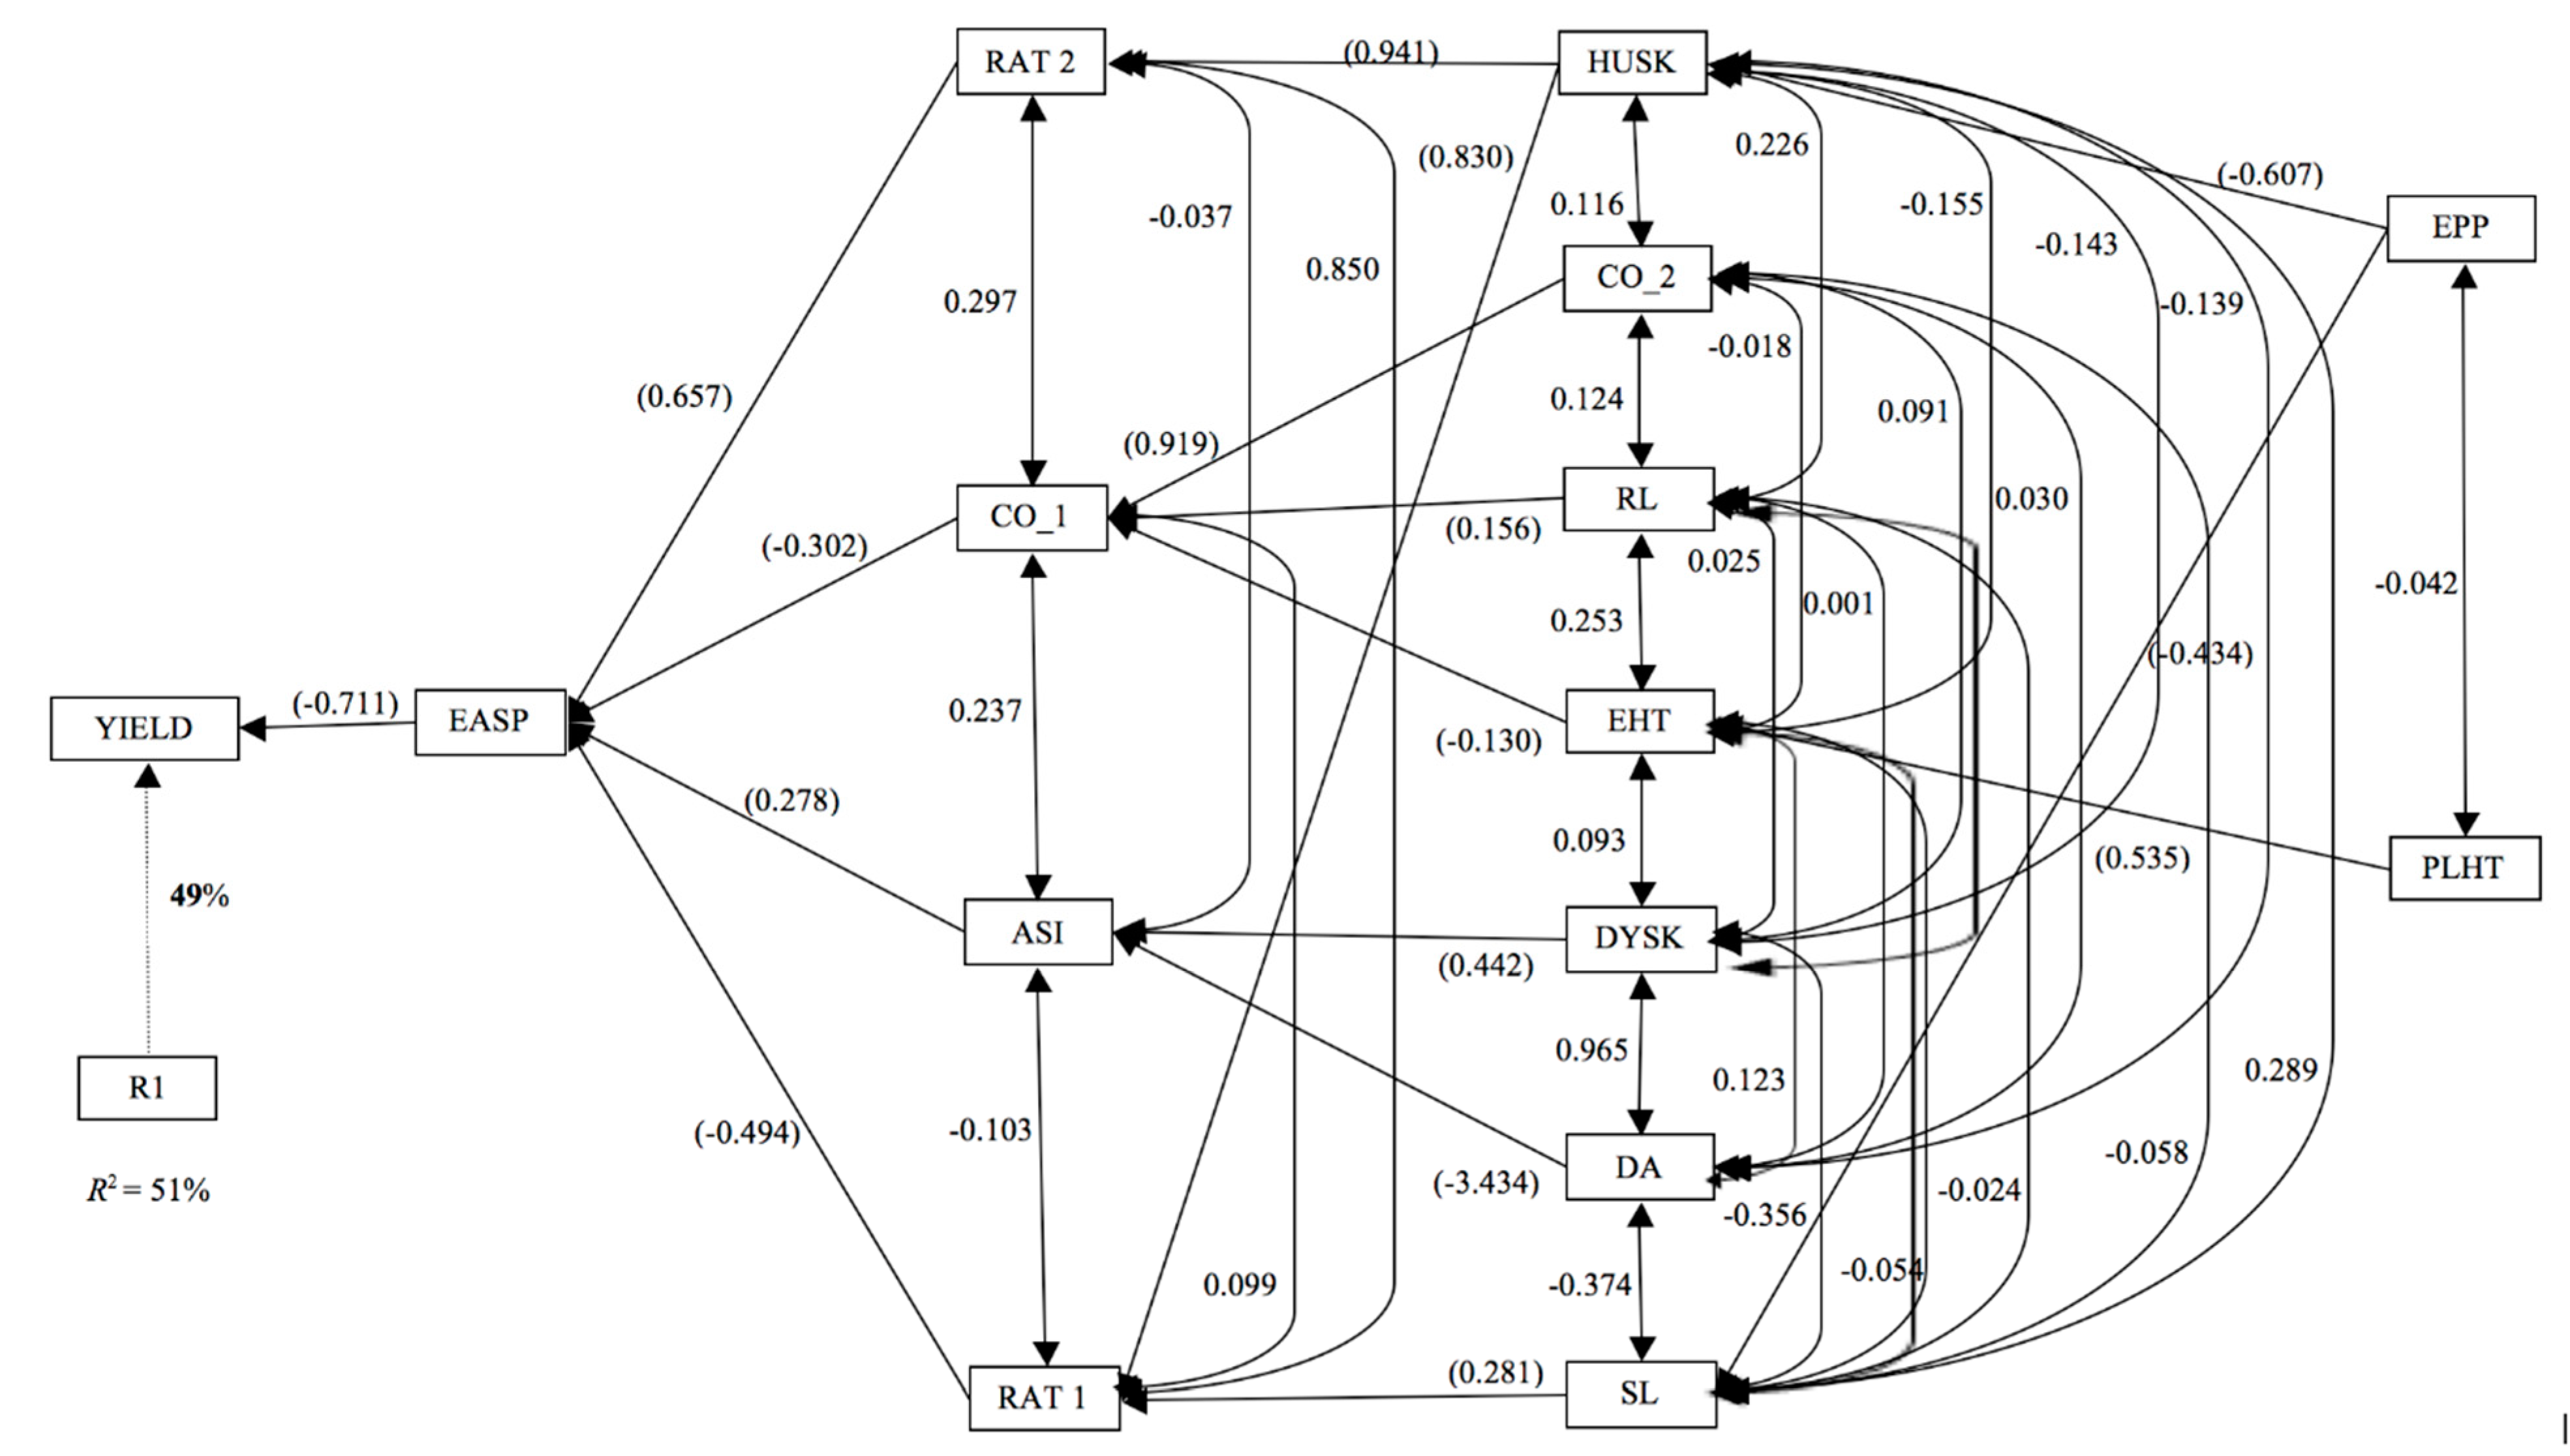
The ear aspect identified as the most important trait contributing to the variation in grain yield under Striga infestation in the present study is concordant with previous studies suggesting the ear aspect as most reliable secondary trait for selecting Striga tolerant/resistant maize inbred lines [31,33]. For instance, Striga damage at eight and 10 WAP, number of emerged Striga plants at eight WAP and ASI were identified as the second-order traits contributing to variation in grain yield under Striga infestation. Obviously, reliable secondary traits in selecting outstanding Striga-resistant/tolerant genotypes may vary depending on the nature of the genetic material used, prevailing climatic conditions and location of the experiment [31,33]. Finally, the results of the cluster analysis were consistent with the genetic background of the inbred lines and revealed valuable information that might be useful in resolving the heterotic groups of early-maturing inbred lines bred at IITA that are yet to be field-tested in hybrid combinations.

5. Conclusions

A total of 156 single cross hybrids were screened under Striga-infested and non-infested environments in an effort to determine their combining abilities and the mode of gene action conditioning Striga resistance, identify outstanding hybrids with consistent performance across the research environments and examine the trait relationships. Significant genotypic variation existed among the inbred lines for grain yield component traits and resistance to Striga, indicating that substantial progress could be achieved in the IITA early maize program. The preponderance of GCA over SCA mean squares for most of the traits under Striga-infested and non-infested conditions implied that additive gene action was more important than non-additive gene action for the measured traits, although both GCA and SCA effects accounted for the differences among the 156 hybrids evaluated in this study. The maternal or cytoplasmic genes did not have any influence on the inheritance of grain yield and other agronomic traits under Striga infestation.
Three inbred lines (TZdEI 268, TZdEI 479 and TZdEI 485) with significant negative GCA (GCA-male and GCA-female) effects for number of emerged Striga plants under Striga infestation would be useful in contributing favorable alleles for breeding for Striga resistance in tropical germplasm. Inbreds TZdEI 173 and TZdEI 352 had significant positive GCA effects for grain yield and produced one of the highest yielding hybrids under Striga infestation, indicating they would contribute favorable alleles for breeding for improved grain yield under Striga.
Grouping based on cluster analysis was broadly concordant with genetic background information. The contrasting pair of inbred lines from different clusters could be used as potential parents to create mapping populations to tag genes influencing Striga and drought resistance in maize. Moreover, the present genetic diversity information will be very helpful for more effective utilization of these inbred lines in tropical breeding programs for the development of open-pollinated varieties and/or hybrids, and for maintaining broad genetic base that could be further used to develop promising drought and Striga-resistant inbred lines. Finally, the identification of ear aspect, under both Striga infestation and drought stress environments, as the most important secondary trait contributing to the variation in grain yield suggested that ear aspect should be included in the selection index under both stresses.

Supplementary Materials

The following are available online at https://0-www-mdpi-com.brum.beds.ac.uk/2073-4395/10/10/1478/s1, Table S1: Pedigree of the 36 white early maturing maize inbred lines used in the diversity study. Table S2. Statistics summary for the 4440 SNP DArT markers.

Author Contributions

Conceptualization, I.C.A. and B.B.-A.; Methodology, I.C.A., N.U. and B.B.-A.; Formal analysis, I.C.A. and A.L.G.-O.; Resources, B.B.-A., M.G., S.H.; Data curation, I.C.A. and A.L.G.-O.; Writing—original draft preparation, I.C.A.; Writing—review and editing, I.C.A., B.B.-A., A.L.G.-O., S.H.; Supervision, B.B.-A., V.G., P.T., S.K.O., D.K.D.; Project administration, B.B.-A.; Funding acquisition, B.B.-A., and I.C.A. All authors have read and agreed to the published version of the manuscript.

Funding

This research was supported by the Bill and Melinda Gates Foundation [OPP1134248] under the Drought Tolerant Maize for Africa Project of IITA and the Stress Tolerant Maize for Africa Project. Additionally, the research was supported by the Alliance for a Green Revolution in Africa [2012PASS023] under the West Africa Center for Crop Improvement of University of Ghana, Legon-Accra and co-funding from United States Agency for International Development under Norman E. Borlaug Leadership Enhancement in Agriculture Program Fellowship.

Acknowledgments

We appreciate the IITA Maize Program and Bioscience Center staff for technical assistance during the field and laboratory experiments.

Conflicts of Interest

The authors declare that there are no conflicts of interest.

References

  1. Kling, J.G.; Fajemisin, J.M.; Badu-Apraku, B.; Diallo, A.; Menkir, A.; Melake-Berhan, A. Striga Resistance Breeding in Maize. In Breeding for Striga Resistance in Cereals, Proceedings of a Workshop held at IITA, Ibadan, Nigeria, 18–20 August 1999; Haussmann, B.I.G., Hess, D.E., Koyama, M.L., Grivet, L., Rattunde, H.F.W., Geiger, H.H., Eds.; Margraf Publishers: Weikersheim, Germany, 2000; pp. 103–118. [Google Scholar]
  2. Menkir, A.; Kling, J.G.; Badu-Apraku, B.; Ibikunle, O. Registration of 26 tropical maize germplasm lines with resistance to Striga hermonthica. Crop Sci. 2006, 46, 1007–1009. [Google Scholar] [CrossRef]
  3. Amegbor, I.K.; Badu-Apraku, B.; Annor, B. Combining ability and heterotic patterns of extra-early maturing white maize inbreds with genes from Zea diploperennis under multiple environments. Euphytica 2017, 213, 24. [Google Scholar] [CrossRef]
  4. Dao, A.; Sanou, J.; Mitchell, S.E.; Gracen, V.; Danquah, E.Y. Genetic diversity among INERA maize inbred lines with single nucleotide polymorphism (SNP) markers and their relationship with CIMMYT, IITA, and temperate lines. BMC Genet. 2014, 15, 127. [Google Scholar] [CrossRef] [PubMed] [Green Version]
  5. Semagn, K.; Magorokosho, C.; Vivek, B.S.; Makumbi, D.; Beyene, Y.; Mugo, S.; Prasanna, B.M.; Warburton, M.L. Molecular characterization of diverse CIMMYT maize inbred lines from eastern and southern Africa using single nucleotide polymorphic markers. Genomics 2012, 13, 113–123. [Google Scholar] [CrossRef] [Green Version]
  6. Lu, Y.; Yan, J.; Guimarães, C.T.; Taba, S.; Hao, Z.; Gao, S.; Chen, S.; Li, J.; Zhang, S.; Vivek, B.S.; et al. Molecular characterization of global maize breeding germplasm based on genome-wide single nucleotide polymorphisms. Theor. Appl. Genet. 2009, 120, 93–115. [Google Scholar] [CrossRef]
  7. Senior, M.L.; Murphy, J.P.; Goodman, M.M.; Stuber, C.W. Utility of SSRs for determining genetic similarities and relationships in maize using an agarose gel system. Crop Sci. 1998, 38, 1088–1098. [Google Scholar] [CrossRef]
  8. Yan, J.; Shah, T.; Warburton, M.L.; Buckler, E.S.; McMullen, M.D.; Crouch, J. Genetic characterization and linkage disequilibrium estimation of a global maize collection using SNP markers. PLoS ONE 2009, 4, e8451. [Google Scholar] [CrossRef] [Green Version]
  9. Van-Inghelandt, D.V.; Melchinger, A.E.; Lebreton, C.; Stich, B. Population structure and genetic diversity in a commercial maize breeding program assessed with SSR and SNP markers. Theor. Appl. Genet. 2010, 120, 1289–1299. [Google Scholar] [CrossRef] [Green Version]
  10. Dos-Santos, J.P.R.; Pires, L.P.M.; Pires, M.; Vasconcellos, R.C.C.; Pereira, G.S.; Pinho, R.G.V.; Balestre, M. Genomic selection to resistance to Stenocarpella maydis in maize lines using DArTseq markers. BMC Genet. 2016, 17, 86. [Google Scholar] [CrossRef] [Green Version]
  11. Zhang, X.; Zhang, H.; Li, L.; Lan, H.; Ren, Z.; Liu, D.; Wu, L.; Liu, H.; Jaqueth, J.; Li, B.; et al. Characterizing the population structure and genetic diversity of maize breeding germplasm in Southwest China using genome-wide SNP markers. BMC Genom. 2016, 17, 697. [Google Scholar] [CrossRef] [Green Version]
  12. Prasanna, B.M. Diversity in global maize germplasm: Characterization and utilization. J. Biosci. 2012, 37, 843–855. [Google Scholar] [CrossRef] [PubMed]
  13. Menkir, A.; Kling, J.G.; Badu-Apraku, B.; Ingelbrecht, I. Molecular marker-based genetic diversity assessment of Striga-resistant maize inbred lines. Theor. Appl. Genet. 2005, 110, 1145–1153. [Google Scholar] [CrossRef] [PubMed]
  14. Gebremeskel, S.; Garcia-Oliveira, A.L.; Menkir, A.; Adetimirin, V.O.; Gedil, M. Effectiveness of predictive markers for marker assisted selection of pro-vitamin A carotenoids in medium-late maturing maize (Zea mays L.) inbred lines. J. Cereal. Sci. 2018, 79, 27–34. [Google Scholar] [CrossRef]
  15. Akaogu, I.C.; Badu-Apraku, B.; Adetimirin, V.O.; VROH-BI, I.; Oyekunle, M.; Akinwale, R.O. Genetic diversity assessment of extra-early maturing yellow maize inbreds and hybrid performance in Striga-infested and Striga-free environments. J. Agric. Sci. 2012, 151, 519–537. [Google Scholar] [CrossRef]
  16. Mohammadi, S.A.; Prasanna, B.M.; Singh, N.N. Sequential path model for determining interrelationships among grain yield and related characters in maize. Crop Sci. 2003, 43, 1690–1697. [Google Scholar] [CrossRef]
  17. Badu-Apraku, B.; Fakorede, M.A.B.; Talabi, A.O.; Oyekunle, M.; Akaogu, I.C.; Akinwale, R.O.; Annor, B.; Melaku, G.; Fasanmade, Y.; Aderounmu, M. Gene action and heterotic groups of early white quality protein maize inbreds under multiple stress environments. Crop Sci. 2015, 56, 183–199. [Google Scholar] [CrossRef]
  18. Lane, J.A.; Child, D.V.; Moore, T.H.M.; Arnold, G.M.; Bailey, J.A. Phenotypic characterization of resistance in Zea diploperennis to Striga hermonthica. Maydica 1997, 42, 45–51. [Google Scholar]
  19. Comstock, R.E.; Robinson, H.F. The components of genetic variance in populations of bi-parental progenies and their use in estimating the average degree of dominance. Biometrics 1948, 4, 254–266. [Google Scholar] [CrossRef]
  20. Kim, S.K. Breeding maize for Striga tolerance and the development of a field technique. In Combating Striga in Africa, Proceedings of the International Workshop organized by IITA, ICRISAT and IDRC at, IITA, Ibadan, Nigeria, 22-24 August, 1988; Kim, S.K., Ed.; International Institute of Tropical Agriculture: Ibadan, Nigeria, 1991; pp. 96–108. [Google Scholar]
  21. Badu-Apraku, B.; Akinwale, R.O. Cultivar evaluation and trait analysis of tropical early maturing maize under Striga-infested and Striga-free environments. Field Crops Res. 2011, 121, 186–194. [Google Scholar] [CrossRef]
  22. DeVries, J. The Inheritance of Striga Reactions in Maize. In Breeding for Striga Resistance in Cereals; Margraf: Weikersheim, Germany, 2000; pp. 73–84. [Google Scholar]
  23. SAS Institute Inc. Base SAS 9.3 Procedures Guide; SAS Institute Inc.: Cary, NC, USA, 2011. [Google Scholar]
  24. Hallauer, A.R.; Miranda, J.B. Quantitative Genetics in Maize Breeding, 2nd ed.; Iowa State University Press: Ames, IA, USA, 1988. [Google Scholar]
  25. Badu-Apraku, B.; Lum, A.F.; Akinwale, R.O.; Oyekunle, M. Biplot analysis of diallel crosses of early maturing tropical yellow maize inbreds in stress and nonstress environments. Crop Sci. 2011, 51, 173–188. [Google Scholar] [CrossRef]
  26. Zobel, R.W.; Wright, M.J.; Gauch, H.G. Statistical analysis of a yield trial. Agron. J. 1988, 80, 388–393. [Google Scholar] [CrossRef]
  27. Gauch, H.G.; Zobel, R.W. Predictive and postdictive success of statistical analyses of 14 yield trials. Theor. App. Genet. 1988, 76, 1–10. [Google Scholar] [CrossRef] [PubMed]
  28. Crossa, J. Statistical analyses of multilocation trials. Adv. Agron. 1990, 44, 55–85. [Google Scholar]
  29. Baker, R.J. Issues in diallel analysis. Crop Sci. 1978, 18, 533–536. [Google Scholar] [CrossRef]
  30. Falconer, D.S.; Mackay, T.F.C. Introduction to Quantitative Genetics, 4th ed.; Longman Technical: Harlow, UK, 1996. [Google Scholar]
  31. Badu-Apraku, B.; Akinwale, R.O.; Fakorede, M.A.B.; Oyekunle, M.; Franco, J. Relative changes in genetic variability and correlations in an early-maturing maize population during recurrent selection. Theor. App. Genet. 2012, 125, 1289–1301. [Google Scholar] [CrossRef] [PubMed]
  32. Badu-Apraku, B.; Akinwale, R.O.; Oyekunle, M. Efficiency of secondary traits in selecting for improved grain yield in extra-early maize under Striga-infested and Striga-free environments. Plant Breed. 2014, 133, 373–380. [Google Scholar] [CrossRef]
  33. Talabi, A.O.; Badu-Apraku, B.; Fakorede, M.A.B. Genetic variances and relationship among traits of an early-maturing maize population under drought-stress and low-N environments. Crop Sci. 2016, 57, 681–692. [Google Scholar] [CrossRef]
  34. Doyle, J.J.; Doyle, J.L. A rapid DNA isolation procedure for small quantities of fresh leaf tissue. Phytochem. Bull. 1987, 19, 11–15. [Google Scholar]
  35. Liu, K.J.; Muse, S.V. PowerMarker: An integrated analysis environment for genetic marker analysis. Bioinformatics 2005, 21, 2128–2129. [Google Scholar] [CrossRef] [Green Version]
  36. Perrier, X.; Jacquemoud-Collet, J.P. DARwin Software. Available online: http://darwin.cirad.fr/2006 (accessed on 27 May 2020).
  37. Falush, D.; Stephens, M.; Pritchard, J.K. Inference of population structure using multilocus genotype data: Dominant markers and null alleles. Mol. Ecol. Notes 2007, 7, 574–578. [Google Scholar] [CrossRef]
  38. Evanno, G.; Regnaut, S.; Goudet, J. Detecting the number of clusters of individuals using the software STRUCTURE: A simulation study. Mol. Ecol. 2005, 14, 2611–2620. [Google Scholar] [CrossRef] [PubMed] [Green Version]
  39. Earl, D.A. STRUCTURE HARVESTER: A website and program for visualizing STRUCTURE output and implementing the Evanno method. Conserv. Genet. Resour. 2012, 4, 359–361. [Google Scholar] [CrossRef]
  40. Yang, X.; Xu, Y.; Shah, T.; Li, H.; Han, Z.; Li, J.; Yan, J. Comparison of SSRs and SNPs in assessment of genetic relatedness in maize. Genetica 2011, 139, 1045–1054. [Google Scholar] [CrossRef] [PubMed]
  41. Nei, M. Genetic distance between populations. Am. Nat. 1972, 106, 283–292. [Google Scholar] [CrossRef]
  42. Badu-Apraku, B.; Fakorede, M.A.B.; Menkir, A.; Kamara, A.Y.; Akanvou, L.; Chabi, Y. Response of early maturing maize to multiple stresses in the Guinea savanna of West and Central Africa. J. Genet. Breed. 2004, 58, 119–130. [Google Scholar]
  43. Ifie, B.E.; Badu-Apraku, B.; Gracen, V.; Danquah, E.Y. Genetic analysis of grain yield of IITA and CIMMYT early maturing maize inbreds under Striga-infested and low-soil nitrogen environments. Crop Sci. 2015, 55, 610–623. [Google Scholar] [CrossRef]
  44. Adetimirin, V.O.; Aken’Ova, M.E.; Kim, S.K. Effects of Striga hermonthica on yield components in maize. J. Agric. Sci. 2000, 135, 185–191. [Google Scholar] [CrossRef] [Green Version]
  45. Kim, S.K.; Adetimirin, V.O.; The, C.; Dossou, R. Yield losses in maize due to Striga hermonthica in West and Central Africa. Int. J. Pest Manag. 2002, 48, 211–217. [Google Scholar] [CrossRef]
  46. Badu-Apraku, B.; Menkir, A.; Ajala, S.O.; Akinwale, R.O.; Oyekunle, M.; Obeng-Antwi, K. Performance of tropical early maturing maize cultivars in multiple stress environments. Can. J. Plant Sci. 2010, 90, 831–852. [Google Scholar] [CrossRef] [Green Version]
  47. Gethi, J.G.; Smith, M.E. Genetic responses of single crosses of maize to Striga hermonthica (Del.) Benth. and Striga asiatica (L.) kuntze. Crop Sci. 2004, 44, 2068–2077. [Google Scholar] [CrossRef]
  48. Badu-Apraku, B.; Fakorede, M.A.B.; Lum, A.F. Evaluation of experimental varieties from recurrent selection for Striga resistance in two extra-early maize populations in the savannas of West and Central Africa. Exp. Agric. 2007, 43, 183–200. [Google Scholar] [CrossRef]
  49. Kim, S.K. Genetics of maize tolerance to Striga hermonthica. Crop Sci. 1994, 34, 900–907. [Google Scholar] [CrossRef]
  50. Akanvou, L.; Doku, E.V.; Kling, J.G. Estimates of genetic variances and interrelationships of traits associated with Striga resistance in maize. Afr. Crop Sci. J. 1997, 5, 1–8. [Google Scholar] [CrossRef]
  51. Badu-Apraku, B.; Menkir, A.; & Lum, A.F. Genetic variability for grain yield and components in an early tropical yellow maize population under Striga hermonthica infestation. Crop Improv. 2007, 20, 107–122. [Google Scholar] [CrossRef]
  52. Laborda, P.R.; Oliveira, K.M.; Garcia, A.A.F.; Paterniani, M.E.A.; deSouza, A.P. Tropical maize germplasm: What can we say about its genetic diversity in the light of molecular markers. Theor. Appl. Genet. 2005, 111, 1288–1299. [Google Scholar] [CrossRef]
  53. Xia, X.C.; Reif, J.C.; Melchinger, A.E.; Frisch, M.; Hoisington, D.A.; Beck, D.; Pixley, K.; Warburton, M.L. Genetic diversity among CIMMYT maize inbred lines investigated with SSR markers: II. Subtropical, tropical midaltitude, and highland maize inbred lines and their relationships with elite U.S. and European maize. Crop Sci. 2005, 45, 2573–2582. [Google Scholar] [CrossRef]
  54. Hamblin, M.T.; Warburton, M.L.; Buckler, E.S. Empirical comparison of simple sequence repeats and single nucleotide polymorphisms in assessment of maize diversity and relatedness. PLoS ONE 2007, 2, 1367. [Google Scholar] [CrossRef] [Green Version]
  55. Yan, J.; Yang, X.; Shah, T.; Sánchez-Villeda, H.; Li, J.; Warburton, M.; Zhou, Y.; Crouch, J.H.; Xu, Y. High-throughput SNP genotyping with the Golden Gate assay in maize. Mol. Breed. 2010, 25, 441–451. [Google Scholar] [CrossRef] [Green Version]
Figure 1. AMMI biplot of mean performance and stability of selected early maturing maize hybrids in terms of grain yield as measured by principal components across three Striga-infested environments in Nigeria between 2013 and 2015. E1 = Abuja, 2013; E2 = Mokwa, 2013; E3 = Abuja, 2015. The y axis represents the grand mean of the grain yield, while the x axis represents the principal component axes 1 (IPCA1) value of zero.
Agronomy 10 01478 g001
Figure 2. Phylogenetic tree of the 34 inbred lines based on Nei’s genetic distance estimated from 4440 SNP markers. The sub-populations I, II and III obtained by STRUCTURE are represented by red, green and blue colours, respectively. Black color represents admixture inbreds.
Agronomy 10 01478 g002
Figure 3. Population structure of the 34 inbred lines estimated using 4440 SNP markers. (A) Delta K for varying number of sub-populations from 1 to 10 and (B) estimated population structure of the 34 tropical inbred lines as revealed by 4440 SNP for K = 3. Red, green and blue colors indicate sub-population I, II and III, respectively. Individuals with the three colors and <70% of specific colour are considered as a mixture.
Agronomy 10 01478 g003
Figure 4. Path analysis diagram displaying the relationship of traits under Striga infestation. Note: Values written in bold are the error effects; the direct path coefficients are values in parenthesis and other values are correlation coefficients. R1 is error effects; YIELD: grain yield; DA: Days to 50% anthesis; DYSK: Days to 50% silking; ASI: Anthesis-silking interval; PLHT: Plant height; EASP: Ear aspect; EPP: Ears per plant; HUSK: Husk cover; PASP: Plant aspect; EHT: Ear height, RAT 1 and RAT 2: Striga damage score at eight and 10 WAP, respectively; CO_1 and CO_2: Number of emerged Striga plants at eight and 10 WAP, respectively; RL: Root lodging; SL: Stalk lodging.
Agronomy 10 01478 g004
Table 1. Mean squares of grain yield and other agronomically important traits of 36 early maturing white maize inbred lines and 156 hybrids screened under artificial Striga infestation and non-infested environments in Nigeria during 2014 and 2015 crop season.
SourceDegree of FreedomGrain Yield (kg ha−1)Days to SilkingAnthesis-Silking IntervalEar Aspect (Scale 1–9)Ears per PlantStriga Damage Rating (Scale 1–9)No. of Emerged Striga Plants
Striga Infestation 8 WAP10 WAP8 WAP10 WAP
Environment (E)26,641,695 **750.56 **5.08 **0.31ns0.14 **3.49 **5.91 **9.03 **12.10 **
Genotype (G)35998,643 **20.85 **1.76 *1.24 **0.07 **1.22 **2.18 **1.43 **1.80 **
BLOCK (E–REP)30290,682ns5.25ns1.30ns0.37ns0.03ns0.40ns0.35ns0.45ns0.42ns
Replication/(E)3360,056ns15.48 **7.17 **1.99 **0.11 **0.22ns0.70ns1.17ns0.46ns
G–E67310,475ns5.62 *1.81 *0.77 **0.04ns0.66 **0.84 **0.63ns0.62 *
Error72221,6043.431.130.320.030.330.320.50.39
Heritability 0.70.740.330.390.480.470.630.330.51
HYBRID
Environment (E)287,669,271.9 **2769.24 **45.18 **4.33 **1.46 **10.56 **2.82 *62.30 **22.92 **
SET53,590,873.0 **83.89 **9.80 **2.23 **0.08 **1.22ns1.89 *17.77 **8.95 **
E–SET105,133,848.0 **17.07 **1.03ns1.39 **0.03ns2.26 **1.26 *1.61 **1.74 **
HYBRID (G)1552,895,635.2 **18.79 **3.25 **1.68 **0.04 **3.08 **3.19 **2.56 **1.65 **
GCAm/SET244,989,075.8 **23.03 **5.52 **2.13 **0.04 **5.12 **5.02 **3.88 **2..42 **
GCAf/SET244,731,992.5 **33.47 **4.40 **3.80 **0.06 **5.69 **6.66 **3.36 **2.52 **
SCA/SET961,320,972.3 **7.78 **1.60ns0.82 **0.02ns1.35 **1.06 **1.10 **0.75 **
G–E3101,951,558.3 **7.01 **2.18 **0.81 **0.03 **1.10 **1.07 **0.76 **0.64 **
E–GCAm/SET482,729,848.9 **7.10 **2.56 **0.86 **0.04 **0.97ns1.02 **0.90 **0.85 **
E–GCAf/SET482,374,399.6 **7.85 **2.66 **1.01 **0.03 **1.26 **1.66 **1.10 **0.99 **
E–CA/SET1921,404,975.6 *5.63 **1.87ns0.67 **0.02ns0.93 *0.87 *0.58 **0.45 **
Error359622,1393.671.60.430.020.720.670.430.33
Heritability 0.30.640.60.540.380.650.670.670.64
Non-Infested HCRLPASP (scale 1–9)
Environment (E)3263,742,713.0 **157.20 **9.51 **116.51 **0.34 **227.90 **331.83 *177.54 **
SET518,872,443.0 **98.40 **1.33 **2.40 **0.02ns1.91 **9.94 *12.91 **
E–SET154,791,105.0 **13.82 **0.74 **2.10 **0.01ns1.08 **3.69 **1.38 **
HYBRID (G)1556,541,812.0 **14.56 **0.79 **1.45 **0.02 **0.61 **2.23 **2.36 **
GCAm/SET2410,693,735.0 **21.53 **1.42 **1.83 **0.03 **0.59 **1.89 *3.44 **
GCAf/SET2411,581,716.0 **22.55 **1.14 **1.89 **0.03 **1.31 **2.98 **3.16 **
SCA/SET963,032,926.0 **6.10 **0.47ns0.98 **0.02 **0.36 **1.55 *1.06 **
G*E4651,664,380.0 **3.54 **0.45 **0.68 **0.01 *0.40 **1.58 **0.77 **
E*GCAm/SET722,141,306.0 **3.86 **0.68 **0.92 **0.02 **0.51 **1.64 **0.78 **
E* GCAf/SET722,410,645.0 **4.31 **0.42ns0.89 **0.02 **0.58 **1.68 **0.77 **
E*SCA/SET2881,108,390.0 *2.67 **0.39ns0.45 **0.01ns0.30 *1.36ns0.73 **
Error480859,5351.850.370.30.010.241.180.42
Heritability 0.760.76 0.540.440.470.340.64
Note: * and ** represent significant at 0.05 and 0.01 probability levels, respectively, whereas ns denote not significant. WAP: Weeks after planting; HC: Husk cover; RL: Root lodging; PASP: Plant aspect.
Table 2. Mean performance of 36 early maturing white inbred lines evaluated under Striga infestation (at Mokwa in 2014 and 2015, and Abuja in 2015) in Nigeria.
GenotypesGrain YieldASIEPPEASPSDRNESPSelection Index
8 WAP10 WAP8 WAP10 WAP
TZEI 1817782.330.744.174.334.832.423.1−2.48
TZdEI 7120091.670.645.674.675.831.241.81−2.43
TZdEI 8213620.60.8354.450.140.550.31
TZdEI 849091.830.755.6755.50.411.2−5.33
TZdEI 9824140.50.8643.834.171.31.965.51
TZdEI 10514251.830.854.834.174.51.421.9−0.26
TZdEI 12013320.830.754.54.675.171.041.6−3.07
TZdEI 12419710.670.944.673.3341.271.65.93
TZdEI 13119211.50.934.53.54.671.532.383.38
TZdEI 15714460.670.924.3344.671.542.230.18
TZdEI 17312731.671.034.6744.331.171.921.5
TZdEI 20210851.670.754.674.551.011.65−3.62
TZdEI 26014060.830.954.834.174.830.461.121.61
TZdEI 26412551.670.915.1745.672.042.75−3.21
TZdEI 26813290.330.945.1744.831.492.15−0.27
TZdEI 28018151.830.854.834.1751.792.120.16
TZdEI 28328791.50.983.53.333.671.62.569.78
TZdEI 314123910.844.834.335.332.242.92−4.41
TZdEI 315118110.94.834.55.331.282.01−2.84
TZdEI 35216282.51.154.533.51.331.947.49
TZdEI 35719621.670.954.53.673.831.432.314.81
TZdEI 37815931.170.994.54.334.831.752.410.19
TZdEI 39617910.830.994.674.1751.812.610.92
TZdEI 399154120.864.673.674.672.172.74−0.26
TZdEI 42510111.50.925.54.255.51.62.4−3.81
TZdEI 441131920.984.833.54.171.191.82.73
TZdEI 47916071.330.954.6744.671.242.041.6
TZdEI 48510281.170.8453.8350.971.01−1.07
TZdEI 49217061.170.844.54.335.172.12.69−1.76
TZdEI 5519452.50.695.834.335.51.662.26−6.32
TZEI 222911.330.934.174.174.51.121.934.61
TZEI 3B15671.170.924.674.55.171.091.68−0.19
TZEI 269481.170.735.335.176.332.752.99−10.52
TZEI 65178910.934.833.53.670.681.485.36
Overall mean15481.360.884.774.094.831.422.09
Note: ASI: Anthesis-silking interval; EPP: Ears per plant; EASP: Ear aspect; SDR: Striga damage rating; NESP: Number of emerged Striga plants; WAP: Weeks after planting.
Table 3. Grain yield and other agronomic traits of selected hybrids evaluated under artificial Striga infestation (STR) at Mokwa and Abuja and under non-infested conditions (OPT) at Abuja and Mokwa in 2014 and 2015.
HybridsGrain Yield (kg ha−1)Days to 50% SilkingSDR ‡ (WAP)NESP (WAP)Ear Aspect (Scale 1–9)Ears per PlantBI
STROPTSTROPT810810STROPTSTROPT
TZdEI 173 × TZdEI 3524676434758531.672.332.642.793.6740.870.9611.05
TZdEI 173 × TZdEI 2805362681657512.673.502.803.163.833.80.970.9610.82
TZdEI 352 × TZdEI 3154821596960522.503.173.263.364.174.051.050.9410.31
TZdEI 71 × TZdEI 2684432706857523.674.001.702.444.674.71.000.978.05
TZdEI 82 × TZdEI 2604946685655503.334.672.243.043.8340.960.997.61
TZdEI 260 × TZdEI 2684193637056503.674.671.192.134.674.41.040.997.59
TZdEI 357 × TZdEI 824230624658513.003.502.403.094.674.10.970.997.58
TZdEI 314 × TZdEI 1054385510958513.003.672.883.263.834.550.980.987.42
TZdEI 378 × TZdEI 1734688627258522.503.503.383.744.334.050.900.977.34
TZdEI 268 × TZdEI 1054215497158542.833.502.633.063.834.250.910.976.88
TZdEI 280 × TZdEI 4853510588062523.334.171.201.935.334.61.020.966.77
TZdEI 268 × TZdEI 1314681538357513.004.002.863.354.174.50.870.936.41
TZdEI 105 × TZdEI 1733993544857512.833.332.943.194.504.450.930.986.39
TZdEI 352 × TZdEI 4853814630560533.334.332.092.534.674.81.031.016.26
TZdEI 98 × TZdEI 3524368586861542.673.672.813.174.174.30.830.976.15
TZdEI 441 × TZdEI 2603821703358522.334.002.433.244.503.50.941.016.14
TZdEI 268 × TZdEI 1204023558158513.174.332.692.984.504.351.021.086.12
TZdEI 485 × TZdEI 1243415511158513.174.171.802.235.175.30.990.915.66
TZdEI 120 × TZdEI 1734264538859523.834.002.903.104.504.20.980.955.57
TZdEI 492 × TZdEI 4413963624562554.004.832.282.744.834.11.080.995.43
TZdEI 485 × TZdEI 2603589644259513.835.001.332.234.834.91.070.935.39
TZdEI 124 × TZdEI 2683440396759533.604.002.833.124.204.551.130.955.36
TZdEI 82 × TZdEI 3993745591057512.673.832.783.314.334.150.920.985.13
TZdEI 479 × TZdEI 1243482645558513.004.831.672.954.674.11.031.005.05
TZdEI 352 × TZdEI 824215588161523.174.003.063.314.834.050.881.014.90
Check 2 − TZEI 188 × TZEI 982681560559524.175.502.803.415.504.550.710.91−4.53
Check 3 − TZEI 60 × TZEI 53143687664544.835.672.943.335.503.30.680.97−4.73
TZdEI 105 × TZdEI 982151430861534.676.002.933.316.334.850.730.84−7.09
TZEI 7 × TZdEI 3782033592162515.176.003.313.735.834.450.810.93−7.79
TZdEI 84 × TZdEI 4851816573159525.676.332.252.715.834.80.750.98−8.52
Check 1 − TZEI 60 × TZEI 862128533362535.006.173.013.585.674.650.670.98−8.76
Check 5 − TZEI 2 × TZEI 871838416761525.176.173.243.646.005.1750.740.91−9.23
TZEI 31 × TZdEI 2642108535662525.506.503.863.946.174.60.820.97−9.24
Check 4 − TZEI 31 × TZEI 631961482361535.506.333.393.745.334.40.660.96−10.73
Check 6 − TZEI 26 × TZEI 51134417663536.007.332.783.416.674.90.670.84−14.14
Means3146560160523.974.912.823.295.124.450.890.97
Standard Error (SE)±3433120.860.460.370.360.300.250.290.190.060.04
SDR: Striga damage rating at weeks after planting (WAP); NESP: Number of emerged Striga plants; BI: Selection Index; STR: Striga infestation; OPT: non-infested.
Table 4. Proportion (%) of the sums of squares for crosses attributable to general (GCA), specific combining ability (SCA) for grain yield and other agronomic traits of early white maize inbred lines.
TraitsStriga-InfestedNon-Infested
GCASCAGCASCA
MaleFemale MaleFemale
Grain yield33.2531.5435.2131.0833.6635.26
Days to anthesis25.831.0543.1531.0930.1738.74
Days to silking26.2938.235.5131.4332.9235.64
Anthesis-silking interval33.8126.9239.2732.1625.7742.07
Plant height35.5537.8126.6428.7234.2237.06
Ear height33.9844.4221.631.1636.6432.2
Stalk lodging22.9425.6851.3816.1430.8653
Root lodging---17.0626.8856.06
Husk cover30.7631.9137.3317.7639.2343
Ear aspect23.1241.3135.5823.924.7951.32
Plant aspect---31.7129.239.09
Ears per plant21.1129.2649.6321.0324.8554.13
Striga damage rating at eight WAP31.635.1133.29---
Striga damage rating at 10 WAP31.541.7926.71---
Number of emerged Striga plants at eight WAP *33.3528.8837.77---
Number of emerged Striga plants at 10 WAP30.4231.7437.84---
* WAP: Weeks after planting.
Table 5. General combining ability effects of early maturing inbred lines evaluated under Striga-infested environments.
Inbred LineGrain YieldDays to SilkingStriga Damage at 8 WAPStriga Damage at 10 WAPNumber of Emerged Striga Plants 8 WAPNumber of Emerged Striga Plants 10 WAP
GCAMGCAFGCAMGCAFGCAMGCAFGCAMGCAFGCAMGCAFGCAMGCAF
TZdEI 71−443.53197.110.21−1.16 *0.55 **−0.030.49 *−0.07−0.37 *−0.06−0.32 *−0.1
TZdEI 124325.7040.81−0.99 *−0.65−0.41 **−0.21−0.55 **−0.170.020.59 **0.000.37 *
TZdEI 202−711.23 *−422.780.781.12 *0.42 **0.60 **0.45 *0.390.00−0.20−0.12−0.26
TZdEI 39943.71−20.201.08 *1.14 *−0.25−0.63 **−0.31−0.51 *0.54 **0.210.45 **0.30
TZdEI 260785.34 *205.06−1.09 *−0.53−03140.27−0.080.36−0.19−0.53 **−0.00−0.30
TZdEI 268449.57893.59 **−0.55−0.91 *−0.28−0.71 **−0.54 **−0.62 **−0.67 **−0.35 *−0.56 **−0.32 *
TZdEI 31446.9810.35−0.79−0.380.16−0.34003−0.420.200.110.09−0.13
TZdEI 396212.6877.920.87 *0.35−0.46 **−0.31−0.24−0.22−0.040.310.030.24
TZEI 7−171.96−481.62−0.230.790.240.49 *0.160.58 *0.09−0.120.07−0.05
TZEI 31−537.28 *−500.25 *0.710.150.67 **0.86 **0.59 **0.68 **0.42 *0.270.37 *0.25
TZdEI 315−18.09−152.17−1.59 **−1.39 **0.130.250.21−0.080.99 **0.65 **0.70 **0.49 **
TZdEI 479−369.27−91.220.25−1.020.130.120.270.52 *−0.85 **−0.54 **−0.53 *−0.32 *
TZdEI 82480.30351.36−0.62−0.850.09−0.01−0.19−0.250.04−0.08−0.10−0.05
TZdEI 485−246.67−157.880.681.35 *−0.010.090.110.09−0.51 **−0.63 **−0.37 *−0.57 **
TZdEI 441153.7249.911.28 *1.91 **−0.34 *−0.45 *−0.39 *−0.280.41 *0.60 *0.310.45 *
TZdEI 352410.03632.85 *0.491.28 *−0.75 **−0.64 **−0.59 **−0.89 **−0.050.14−0.15−0.06
TZdEI 84−759.90 *−949.04 **−0.91 *−1.42 **0.45 *0.63*0.47 *1.07 **−0.44 *−0.19−0.32 *−0.22
TZdEI 280358.73−152.47−0.71−0.85−0.050.060.040.14−0.010.14−0.060.16
TZdEI 357−145.54137.600.92*0.41−0.05−0.41 *−0.13−0.59 *0.250.160.220.39 *
TZdEI 492136.67331.060.220.580.41 *0.36 *0.210.270.25−0.250.30 *−0.27
TZdEI 98−91.65181.42−0.01−0.85−0.29−0.150.05−0.13−0.24−0.07−0.21−0.18
TZdEI 157−408.50−163.550.331.45 **0.24−0.190.210.110.460.240.42*0.28
TZdEI 173996.70 **671.98 *−1.941 **−1.78 **−0.83 **−0.62 **−0.99 **−0.76 **−0.06−0.47 *−0.12−0.38
TZdEI 283−221.39−233.950.89*0.150.54 **0.210.350.24−0.050.10−0.040.06
TZEI 18−275.16−455.900.731.02 *0.34 *0.75 **0.38 *0.54 *−0.120.20−0.050.22
TZdEI 105194.83−189.63−0.88 *−0.74−034 *−0.03−0.32 *0.01−0.03−0.030.070.00
TZdEI 120−57.93134.39−0.580.13 *0.160.270.08−0.05−0.30−0.20−0.35−0.24
TZdEI 131461.84−315.13−0.750.06−0.64 **0.07−0.55 **−0.050.030.090.120.02
TZdEI 264−50.63−21.881.391 **1.49 **0.33 *0.010.41 *0.310.12−0.38−0.04−0.24
TZdEI 378−548.11 *348.50−0.94−0.40.49 **−0.330.38 *−0.320.180.52 *0.190.46 *
SE ±269.81251..630.460.460.160.180.170.210.150.170.150.16
GCAm: GCA effects of the inbreds used as a male parents; GCAf: GCA effects of the inbreds used as female parents; WAP: Weeks after planting; *, **, significant at 0.05 and 0.01 probability levels, respectively.
Table 6. Average mid and better parent heterosis for grain yield and other agronomic traits under Striga-infested conditions.
TraitsMid-Parent HeterosisBetter Parent Heterosis
Striga InfestedStriga Infested
Grain yield96.273.07
Days to anthesis−2.95−4.27
Days to silking−2.28−3.76
Ear aspect9.3515.26
Ears per plant3.97−2.59
Striga damage rating at eight WAP1.628.94
Striga damage rating at 10 WAP5.2213.45
Number of emerged Striga plants at eight WAP *93.21238.39
Number of emerged Striga plants at 10 WAP48.994.23
* WAP: Weeks after planting.

