Article

Comparative Study on Protein Quality and Rheological Behavior of Different Wheat Species

by
Khoa Dang Tran
1,2,
Petr Konvalina
1,*,
Ivana Capouchova
3,
Dagmar Janovska
4,
Magdalena Lacko-Bartosova
5,
Marek Kopecky
1 and
Phuong Xuan Thi Tran
2
1
Faculty of Agriculture, University of South Bohemia in Ceske Budejovice, Studentska 1668, 37005 Ceske Budejovice, Czech Republic
2
Faculty of Agronomy, University of Agriculture and Forestry, Hue University, 102 Phung Hung street, Hue City 530000, Vietnam
3
Faculty of Agrobiology, Food and Natural Resources, Czech University of Life Sciences, Kamycka 129, 16500 Praha 6 Suchdol, Czech Republic
4
Crop Research Institute, Drnovska 507/73, 16106 Praha 6 Ruzyně, Czech Republic
5
Faculty of Agrobiology and Food Resources, Slovak University of Agriculture in Nitra, Tr A. Hlinku 2, 94976 Nitra, Slovakia
*
Author to whom correspondence should be addressed.
Submission received: 15 October 2020 / Revised: 4 November 2020 / Accepted: 9 November 2020 / Published: 12 November 2020
(This article belongs to the Special Issue Use of Wild Crop Relatives as Genetic Resources in Crop Breeding)

Abstract

:
The quantity and quality of protein and the rheological traits of wheat are crucial for processing flour in the baking industry, but there are few comparisons in the literature between old and modern wheat species. To help fill this gap, the baking quality characterization, gluten content, protein fraction composition, high molecular weight glutenin subunits, and rheological properties of ancient and modern wheat were determined and compared. These varieties were collected by the gene bank of the Crop Research Institute in Prague-Ruzyne and were grown in organically certified research areas in the Czech Republic. Results revealed differences in protein content and composition between varieties with different ploidy levels, as well as differences in development time and stability between einkorn and bread wheat varieties. Based on the proximity of their positions to the parameter quality in the principal components analysis, such as gluten content, gluten index (GI), Zeleny test, stability, dough development time (C1) and gliadin, the baking performances of cultivars were identified.

1. Introduction

Originating in the Fertile Crescent, known as “the cradle of civilization”, wheat initially migrated to North Africa and then spread to Europe and Asia. Parts of Western Europe cultivated wheat in the early 15th century. The wheat-cultivating regions continuously expanded to other continents from the 17th to 19th centuries, apart from Antarctica.
The Fertile Crescent, which includes 10 countries, is surrounded by the Syrio-Arabian desert in the south, the Mediterranean in the west, and chains of large and high mountain ranges in the east and north. Located between mountains, the desert, and the sea, this area is influenced by several different climates. The Fertile Crescent is known as one of the most diversified regions. Archaeological evidence substantiates that the Fertile Crescent is the hometown of the wild taxa of four species of wheat, and it is most likely the area where wheat was first domesticated [1].
Einkorn wheat (Triticum monococcum L.) is the oldest domesticated wheat species. It is a diploid (2n = 2x = 14 chromosomes; AA genome) wheat [2]. Diploid wheat domestication occurred in the northeastern part of the Levantine Corridor (ca. 10,000 BP) [1]. In the 20th century, einkorn was mainly cultivated on marginal lands and under low input conditions. The production of einkorn wheat was limited to local areas.
Triticum dicoccum (Schrank) Schuebl is a tetraploid wheat (2n = 4x = 28 chromosomes; AABB genome). The earliest archeological evidence of wild emmer is from the first half of the 10th millennium BP in the Jordan Valley and Damascus basin [3]. Other evidence indicated that wild emmer originated from the second half of the 10th millennium in Cayonu, East Anatolia, Alikos, and Southwestern Iran [3]. Emmer was cultivated from the beginning of agriculture until it was replaced by free-threshing wheat in Graeco-Roman times [4]. In recent years, emmer was reestablished in several countries in Europe such as Austria, Germany, and Switzerland [2].
Spelt wheat (Triticum spelta L., hexaploid: 2n = 6x = 42 chromosomes; AABBDD genome) has been well-documented by archeologists in Europe. Spelt was discovered at Neolithic sites (from 2500 to 1700 BC) in Germany, Poland, and Denmark [2], and has been cultivated until modern times in Central Europe. In German-speaking countries (Switzerland, Southern Germany, and Austria), spelt was the dominant cereal until the end of the 19th century. After World War II, spelt cultivation areas diminished to a few thousand hectares.
Einkorn, emmer, and spelt are hulled wheat. The disadvantage of this group is its low yield and difficulties with threshing because the hulls remain attached upon threshing [5]. This is why it has been superseded by bread wheat (Triticum aestivum L. hexaploid: 2n = 6x = 42 chromosomes; AABBDD genome).
In wheat, both the quantity and quality of protein are crucial. The major types of protein can be divided into three categories: simple, conjugated and derived. However, only simple protein is found in wheat plants, consisting of four major types: albumins (soluble in water and dilute buffers), globulins, prolamins, and glutelins. Gluten, the remainder of wheat flour after removing starch, non-starchy polysaccharides, and water-soluble constituents, comprises alcohol-soluble gliadins and alcohol-insoluble glutenins [6].
Wheat storage proteins have two basic fraction groups: gliadins and glutenins. Glutenins are known as being the larger polymers in nature and are measured as high molecular weight glutenin subunits (HMW-GS) and low molecular weight glutenin subunits (LMW-GS). These are used as protein markers for predicting the quality of bread and identifying wheat varieties [7,8].
Rheological traits are important for processing flour in the baking industry. This index is used for predicting dough-processing parameters and the quality of the end product. To investigate flour and dough characteristics, such as elasticity, viscosity, and extensibility, traditional rheological instruments such as farinograph, extensograph, and alveograph can be used. However, with Mixolab II (Chopin Technologies, Paris, France), a new rheological device, researchers are able to measure the physico-chemical behavior of dough during heating and cooling processes [9]. During five stages in the process, Mixolab parameters are measured as the change of torque when mixing and heating wheat flour and water. They provide information about maximum torque, protein quality, starch characteristics, enzyme activity, and starch retrogradation [10].
The aim of our research was to evaluate the differences in proteins and their technological quality between Triticum aestivum L. varieties and other less common species, such as diploid Triticum monococcum L., tetraploid Triticum diccocum Schrank (Schuebl), and hexaploid Triticum spelta (L.).

2. Materials and Methods

2.1. Field Trial and Sampling

All varieties used in this study originated from the gene bank of the Crop Research Institute in Prague-Ruzyne, Czech Republic. Four Triticum monococcum L. (einkorn), eight Triticum diccocum Schrank (Schuebl) (emmer), seven Triticum spelta L. (spelt), and seven Triticum aestivum L. varieties were chosen (Table S1). Crops were cultivated in a random complete block design trial with four field replications (subplots) under certified organic management. The field trials were conducted in three locations at the University of South Bohemia in Ceske Budejovice (USB), Czech University of Life Sciences in Uhrineves (CULS), and Crop Research Institute in Prague, the Czech Republic (CRIP) during vegetation seasons 2012–2015. The seeding rate was adjusted to a density of 350 grains per m2. The samples were grown in four replicates. The harvested plot size was 10 m2. All varieties were spring forms. The crop stands were treated in compliance with European legislation (European Council (EC) Regulation No. 834/2007, the EC Regulation No. 889/2008).
Characteristics of the conditions at the University of South Bohemia in the Ceske Budejovice research area were as follows: mild warm climate, pseudo gley cambisols soil, with loamy sand soil, and an altitude of 388 m. The conditions at the Czech University of Life Sciences in Prague were as follows: warm and mid-dry climate, brown soil, loamy clay soil, and altitude of 295 m. The Crop Research Institute in Prague-Ruzyne has a warm mid-dry climate, degraded chernozem soil, clay and loamy soil, and an altitude of 340 m.

2.2. Baking Quality Characterization

2.2.1. Wheat Flour Samples

In this study, 26 wheat varieties were assessed. Each variety was determined in four replicates. The wheat samples were milled in to white flours using a PSY MP 20 (Mezos, Hradec Kralove, Czech Republic) and Quadrumat Junior machine (Brabender, Duisburg, Germany). Protein content (PC) was determined by the Kjeltec 1002 System (Tecator AB, Hoganas, Sweden), based upon N * 5.7 (in dry matter). Gluten content and gluten index (GI) were estimated by Glutomatic 2200 and Centrifuge 2015 (Perten Instruments, Hägersten, Sweden according to ICC (International Association for Cereal Chemistry) 155 (ICC, 1994a)). Sodium dodecyl sulphate (SDS) was analyzed in flour samples according to the method of Axford et al. [11]. Zeleny index (ZI) was measured by using a SDZT4 apparatus (Santec, Vydrany, Slovakia) according to the ICC 116/1 (ICC, 1994b).

2.2.2. Protein Fractions

Hulled grains were used for the analysis. Albumins + globulins were determined by extraction with 10% NaCl, prolamins by extraction with 70% ethanol, and glutelins by extraction with 0.2% NaOH. All samples were analyzed during 45 min at 20 °C and repeated three times [12].

2.2.3. High Molecular Weight Glutenin Subunits (HMW-GS) Analysis

Glutenins were extracted from single crushed wheat kernels using a 0.25 M Tris-HCl buffer (pH: 6.8) containing 5% (v/v) β-mercaptoethanol, 2% (w/v) SDS, 10% (v/v) glycerol, and 0.02 (w/v) bromophenol blue. The extract was heated at 100 °C for 2 min and centrifuged for 2 min at 15,000 rpm. The electrophoretic patterns of HMW-GSs were determined by using one-dimensional sodium dodecyl sulfate polyacrylamide gel electrophoresis (SDS-PAGE), using the Laemmli buffer system [13]. The OWL Separation System P9DS (Thermo Scientific, Waltham, MA, USA) was used to run gels. The acrylamide/bisacrylamide concentration (T) and the cross linker (C) used were as follows: T = 10% and C = 2.60%. Electrophoresis was performed at a constant current (30 mA/gel), at 10 °C for the time required for the tracking marker dye to migrate off the gel. Proteins in the gels were fixed for 1 h with 10% (w/v) trichloroacetic acid solution and subsequently stained with 0.5% (w/v) Coomassie Brilliant Blue R-250 solution, 25% (v/v) methanol, and 10% (v/v) acetic acid. Destaining was conducted with running water. Particular alleles of HMW-GSs were identified according to the catalog published by Payne and Lawrence [14,15].

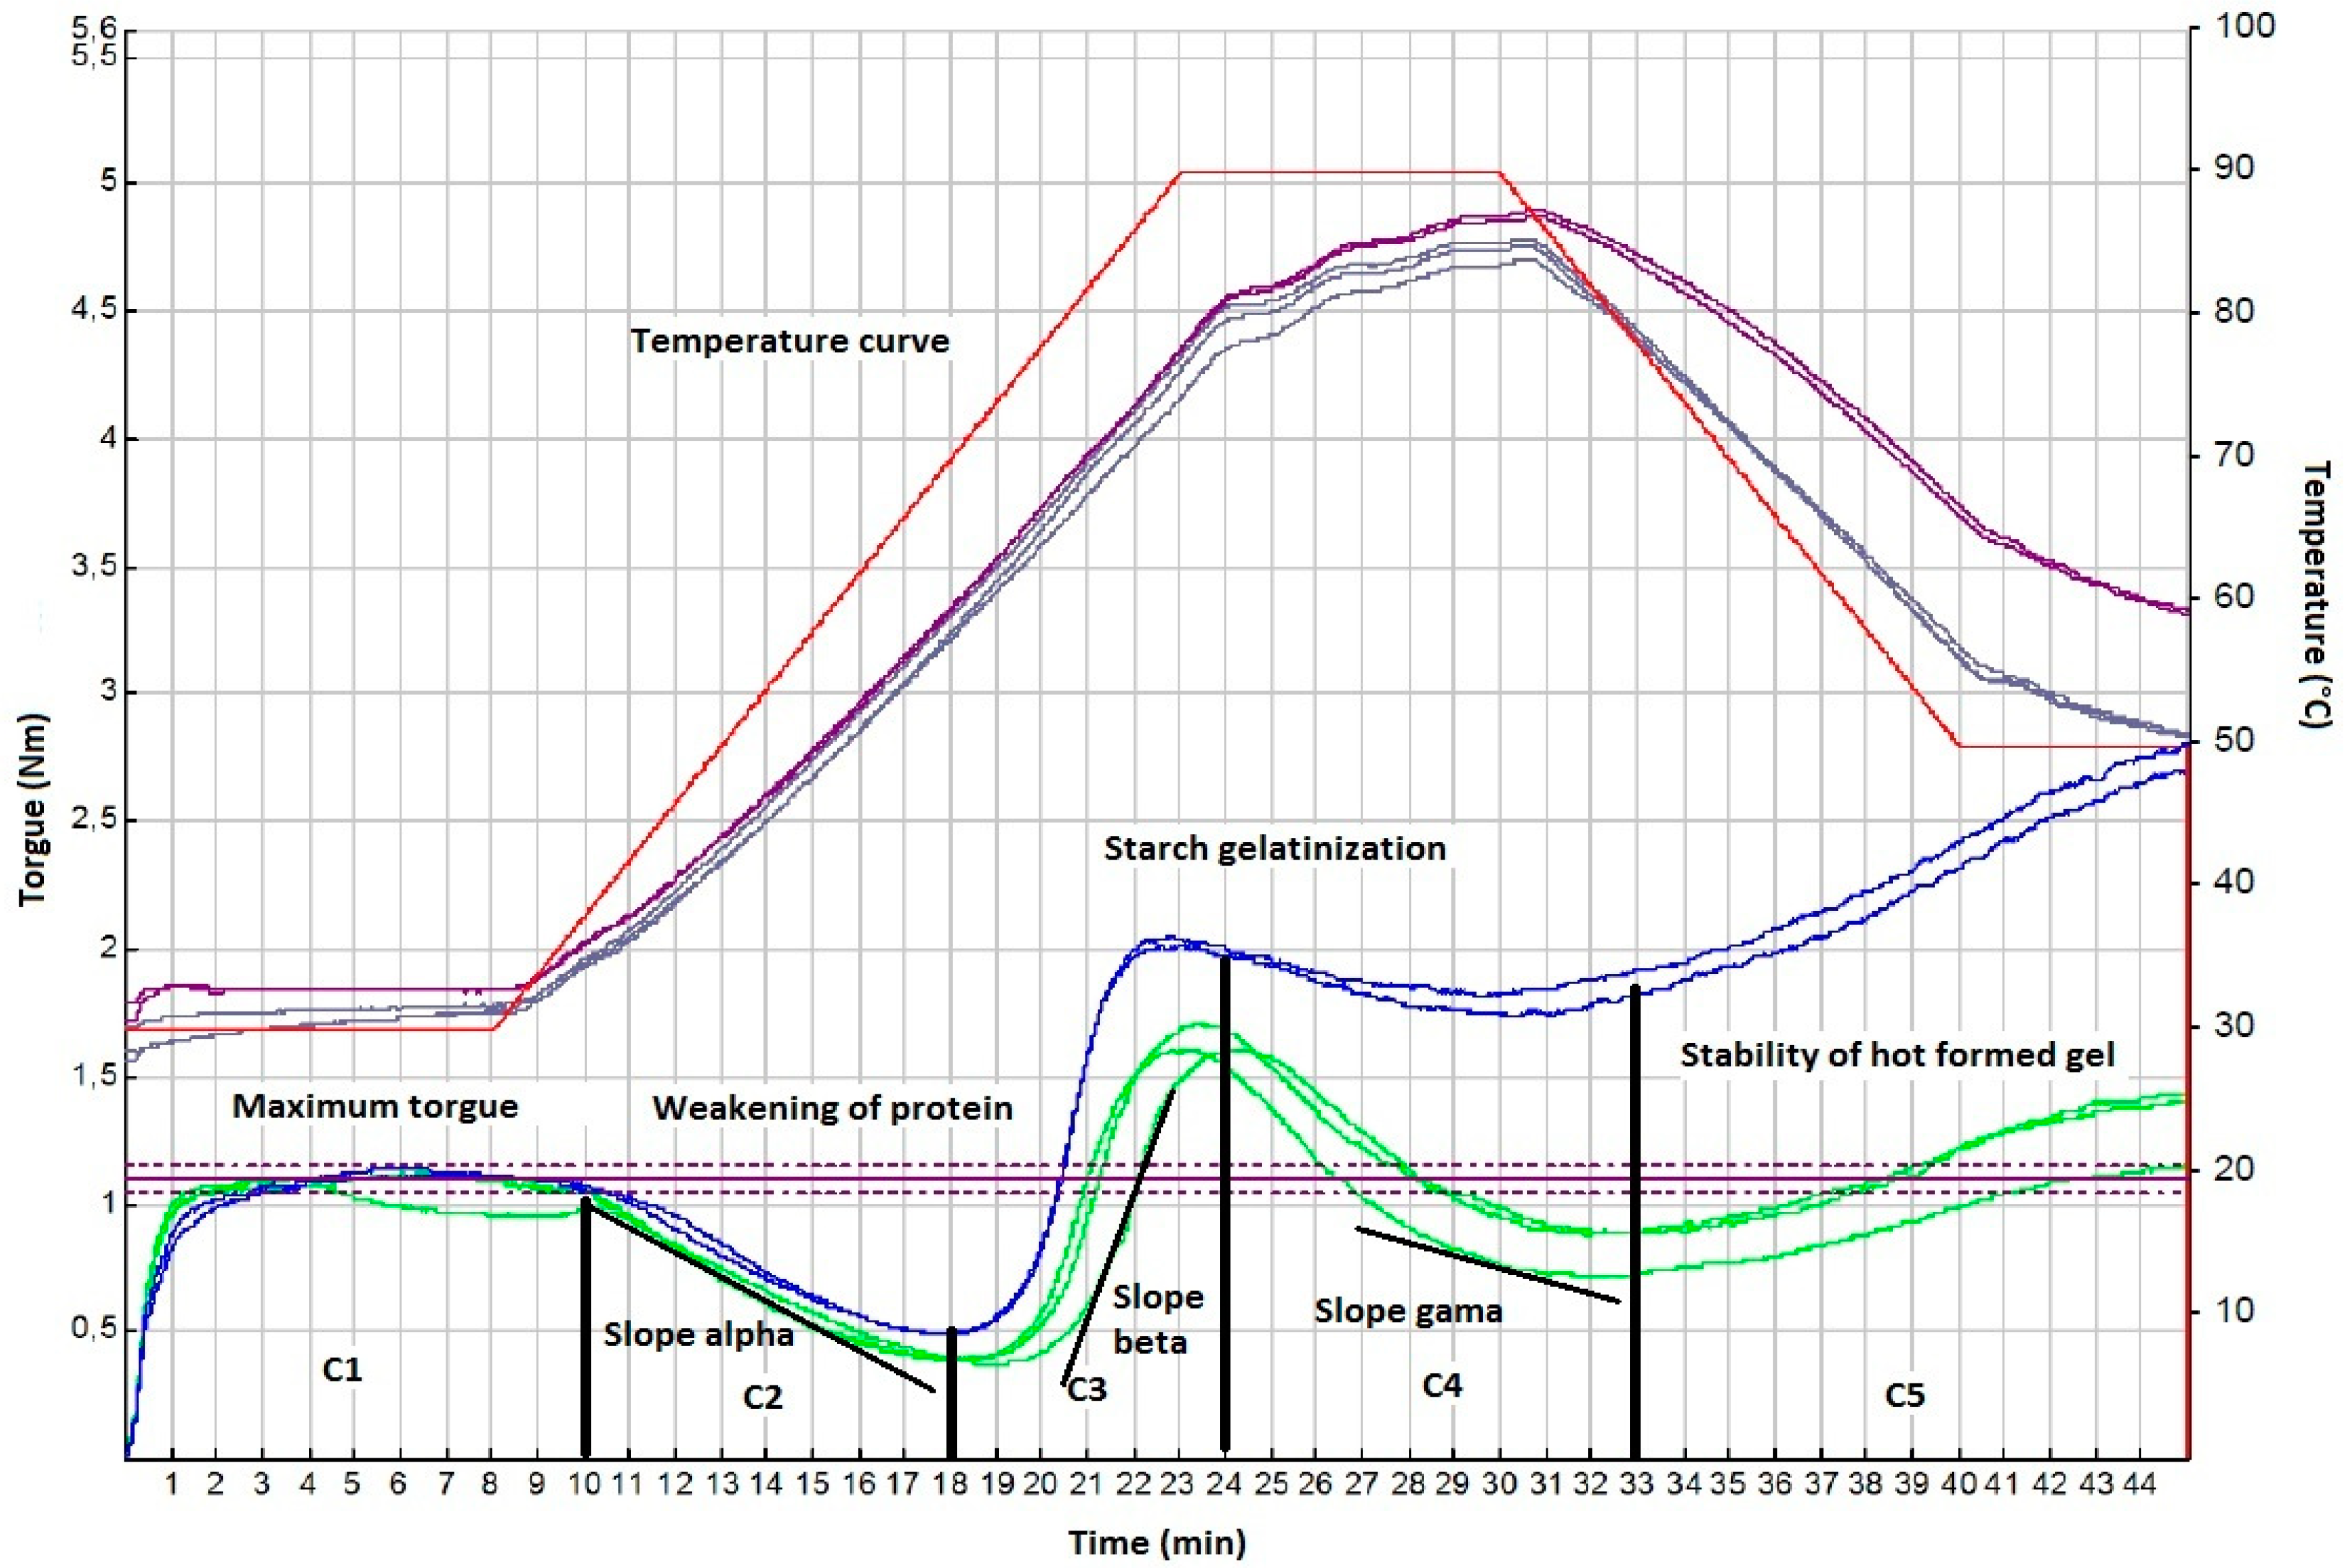
2.3. Mixolab Analysis

Mixolab II was used to evaluate baking quality according to the ICC standard method No. 173-ICC 2006, which allowed us to evaluate physical dough properties, such as dough stability or weakening, and starch characteristics in one measurement. For the rheological test, only selected varieties with three replications from three years and three locations were analyzed. The evaluated parameters in Mixolab are illustrated in Figure 1, in which five stages can be distinguished.
In the first stage, hydration of the flour compounds occurs at 30 °C together with the stretching and alignment of the proteins, which leads to formation of the viscoelastic structure. An increase in the torque was observed during this stage until it reached the maximum value (1.10 Nm). The torque decreased to a minimum value in the second stage, which was attributed to the weakening of the protein network for mechanical shear stress and protein destabilization [17,18]. The third stage demonstrates an increased temperature and gelatinization of starch. The granules absorb the water available in the medium and they swell, so the viscosity increases. In the fourth stage, the amylase activity and the physical breakdown of the granules are associated with a reduction in the viscosity. A decrease in the temperature resulted in an increase in torque, which is referred to as setback and corresponds to the gelation process. The last stage is related to retrogradation [17]. Temperature regime in Mixolab was as follows: 8 min at 30 °C, heating at a rate of 4 °C min−1 for 15 min, holding at 90 °C for 7 min, cooling to 50 °C at a rate of 4 °C min−1 for 10 min, and holding at 50 °C for 5 min [19].

2.4. Statistical Analysis

Data were analyzed using the Statistica 9.0 program (StatSoft. Inc., Palo Alto, CA, USA). Comparisons of mean varieties and their division into statistically different categories were conducted using the Tukey’s honest significant difference (HSD) test with p-values <0.01 and <0.05 considered statistically significant. One-way analysis of variance (ANOVA) and combined ANOVA were applied for variance analysis. Principal component analysis was used to assess the association between groups of variables and the differences between ancient and modern wheat varieties.

3. Results

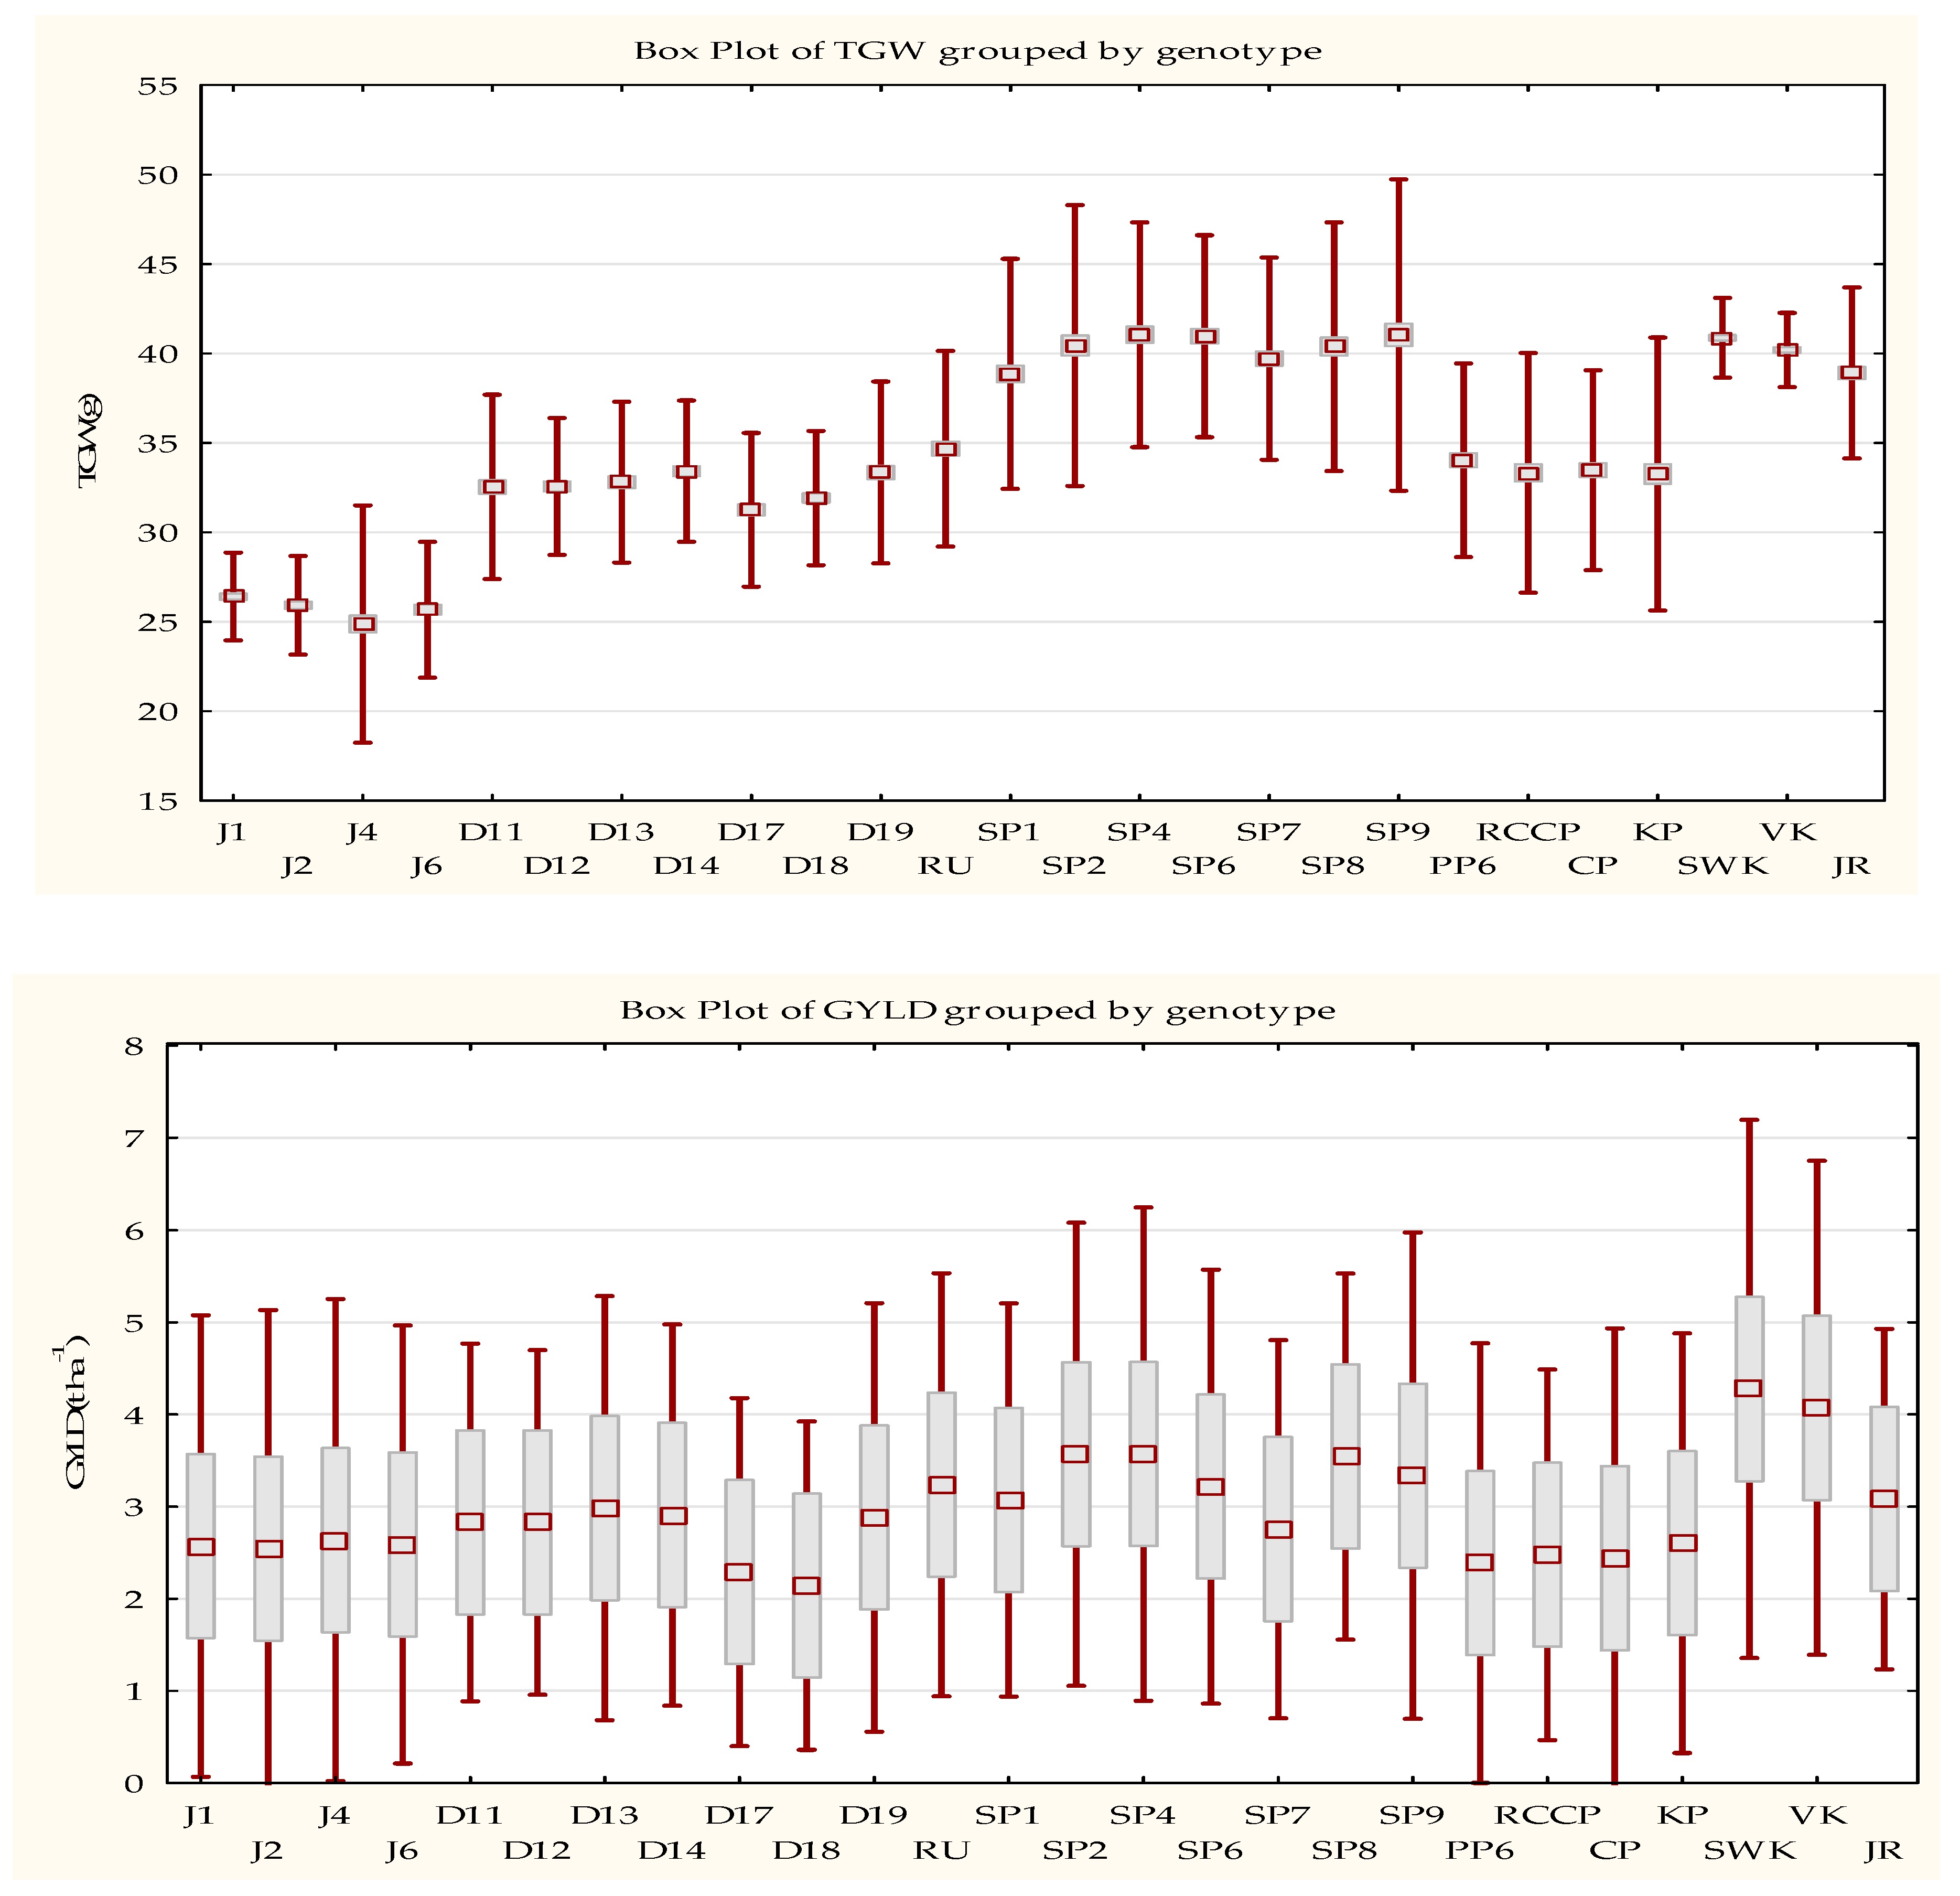
3.1. Thousand Grain Weight and Grain Yield of Wheat Varieties

Thousand grain weight (TGW) is a crucial component of grain yield, which defines not only the improvement of grain yield but also the improvement in milling yield. The data in Figure 2 indicate that the SP4 variety had the maximum TGW (41.05 g), while the minimum value (24.87 g) was observed for variety J4. Analysis of variance (Table S2) shows that the groups with the highest TGW (from 39.71 g to 41.05 g) belong to the spelt species and common wheat, whereas the einkorn species had the lowest TGW at approximately 25.5 g.
Grain yield of all wheat varieties was recorded and summarized in Figure 1 and Table S2. As expected, common wheat had the highest yield (from 4.07 t ha−1 to 4.28 t ha−1), with the exception of Jara variety (3.08 t ha−1), compared to the other four wheat species. Einkorn, emmer, and bread wheat landraces fell into the lowest yield group. Interestingly, SP8, SP2 and SP4 had the highest yields (3.54 t ha−1, 3.57 t ha−1, and 3.58 t ha−1, respectively) and were not significantly different from the VK and SWK cultivars in organic farming conditions.

3.2. Basic Baking Quality

Baking Quality Characterization

Analysis of variance for protein content, wet gluten content, gluten index, SDS test, and Zeleny test was performed in four replicates per sample with 26 varieties each of five wheat species cultivated in three locations, (n = 1248). The results were significant at p-value <0.05 for the environments (four years cultivated and three locations) for all indexes and indicated highly significant variance among the species with regard to the protein content, wet gluten content, gluten index, SDS text, and Zeleny test. From Figure 3, Tables S3 and S4, it is apparent that common wheat and bread wheat landraces had the lowest protein content (12.76%, 13.15%, respectively) compared to the other three wheat species. The bread wheat varieties SWK and VK had the lowest protein content at 12.13% and 12.87%, respectively, whereas emmer variety D17 had the highest at 17.50%. In general, all varieties of einkorn, emmer, and spelt were not statistically different. A remarkable increase was seen for gluten in the five wheat species. Spelt species had the highest gluten content (42.19%) and common wheat the lowest (30.87%), with bread wheat landraces (33.07%), emmer wheat (37.96%), and einkorn (36.35%) in between. The SP9 genotype had the highest gluten content (45.29%), whilst the SWK had the lowest gluten content (27.52%). In contrast, common wheat had the highest gluten index (mean 68.78), followed by bread wheat landraces (mean 41.46) and spelt (mean 35.68). The gluten index of einkorn wheat and emmer wheat ranked at the bottom of the table with 14.4 and 15.4, respectively. SDS and Zeleny tests showed similar trends for the five species, with the highest value for common wheat, the second highest value for bread wheat landraces and spelt, and the lowest for the rest of the species. The highest values from SDS and Zeleny tests were seen for the SWK variety with 71.83 mL and 46.89 mL, respectively. J4, on the other hand, had the lowest values (21.67 mL and 9.59 mL, respectively).
Regarding two-way interactions, the entire index of protein fractions was significantly different for year × location, year × species, and location × species. This was also true for the analysis of three-way interactions.

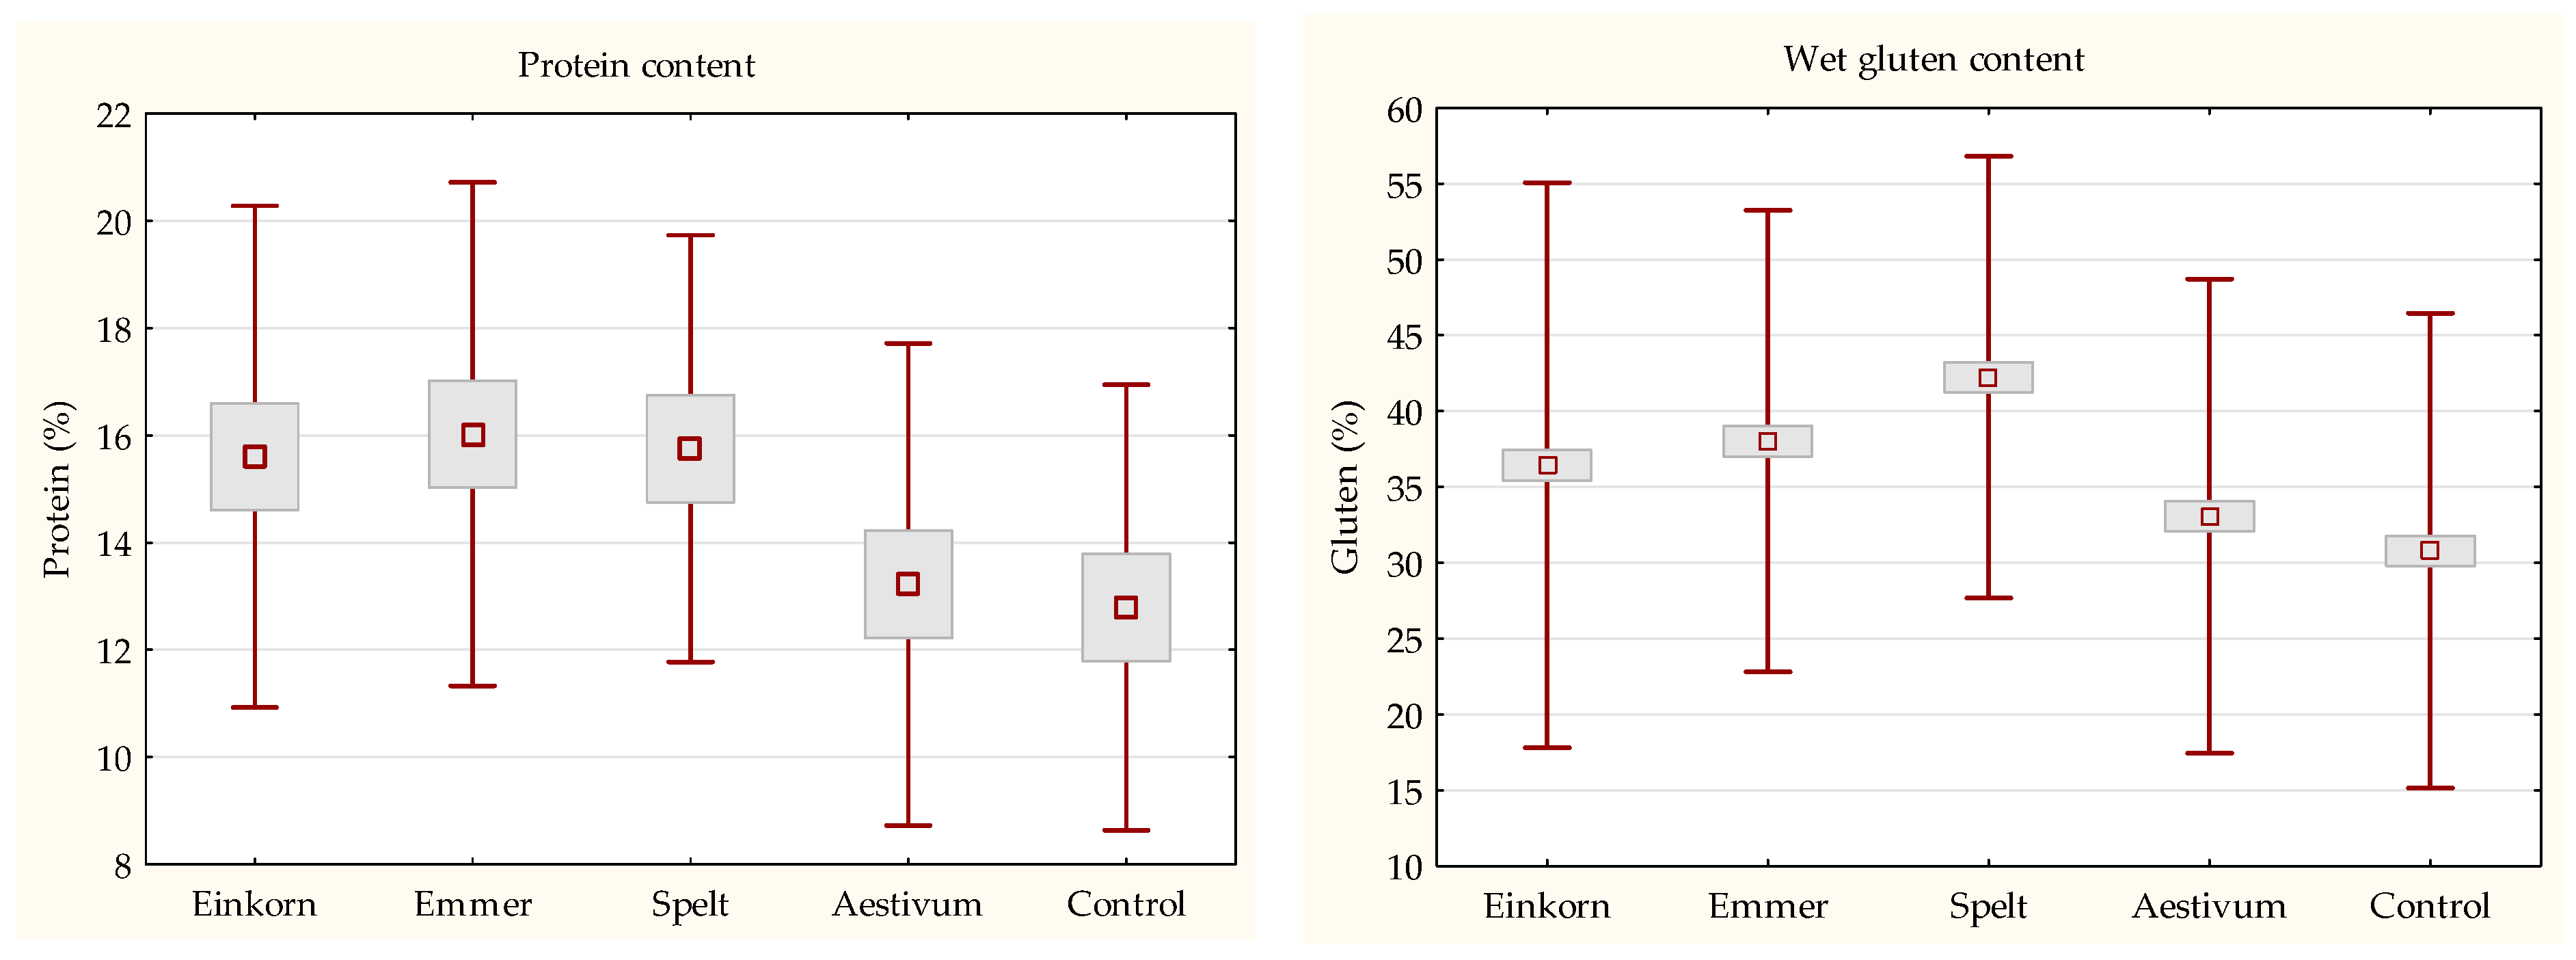
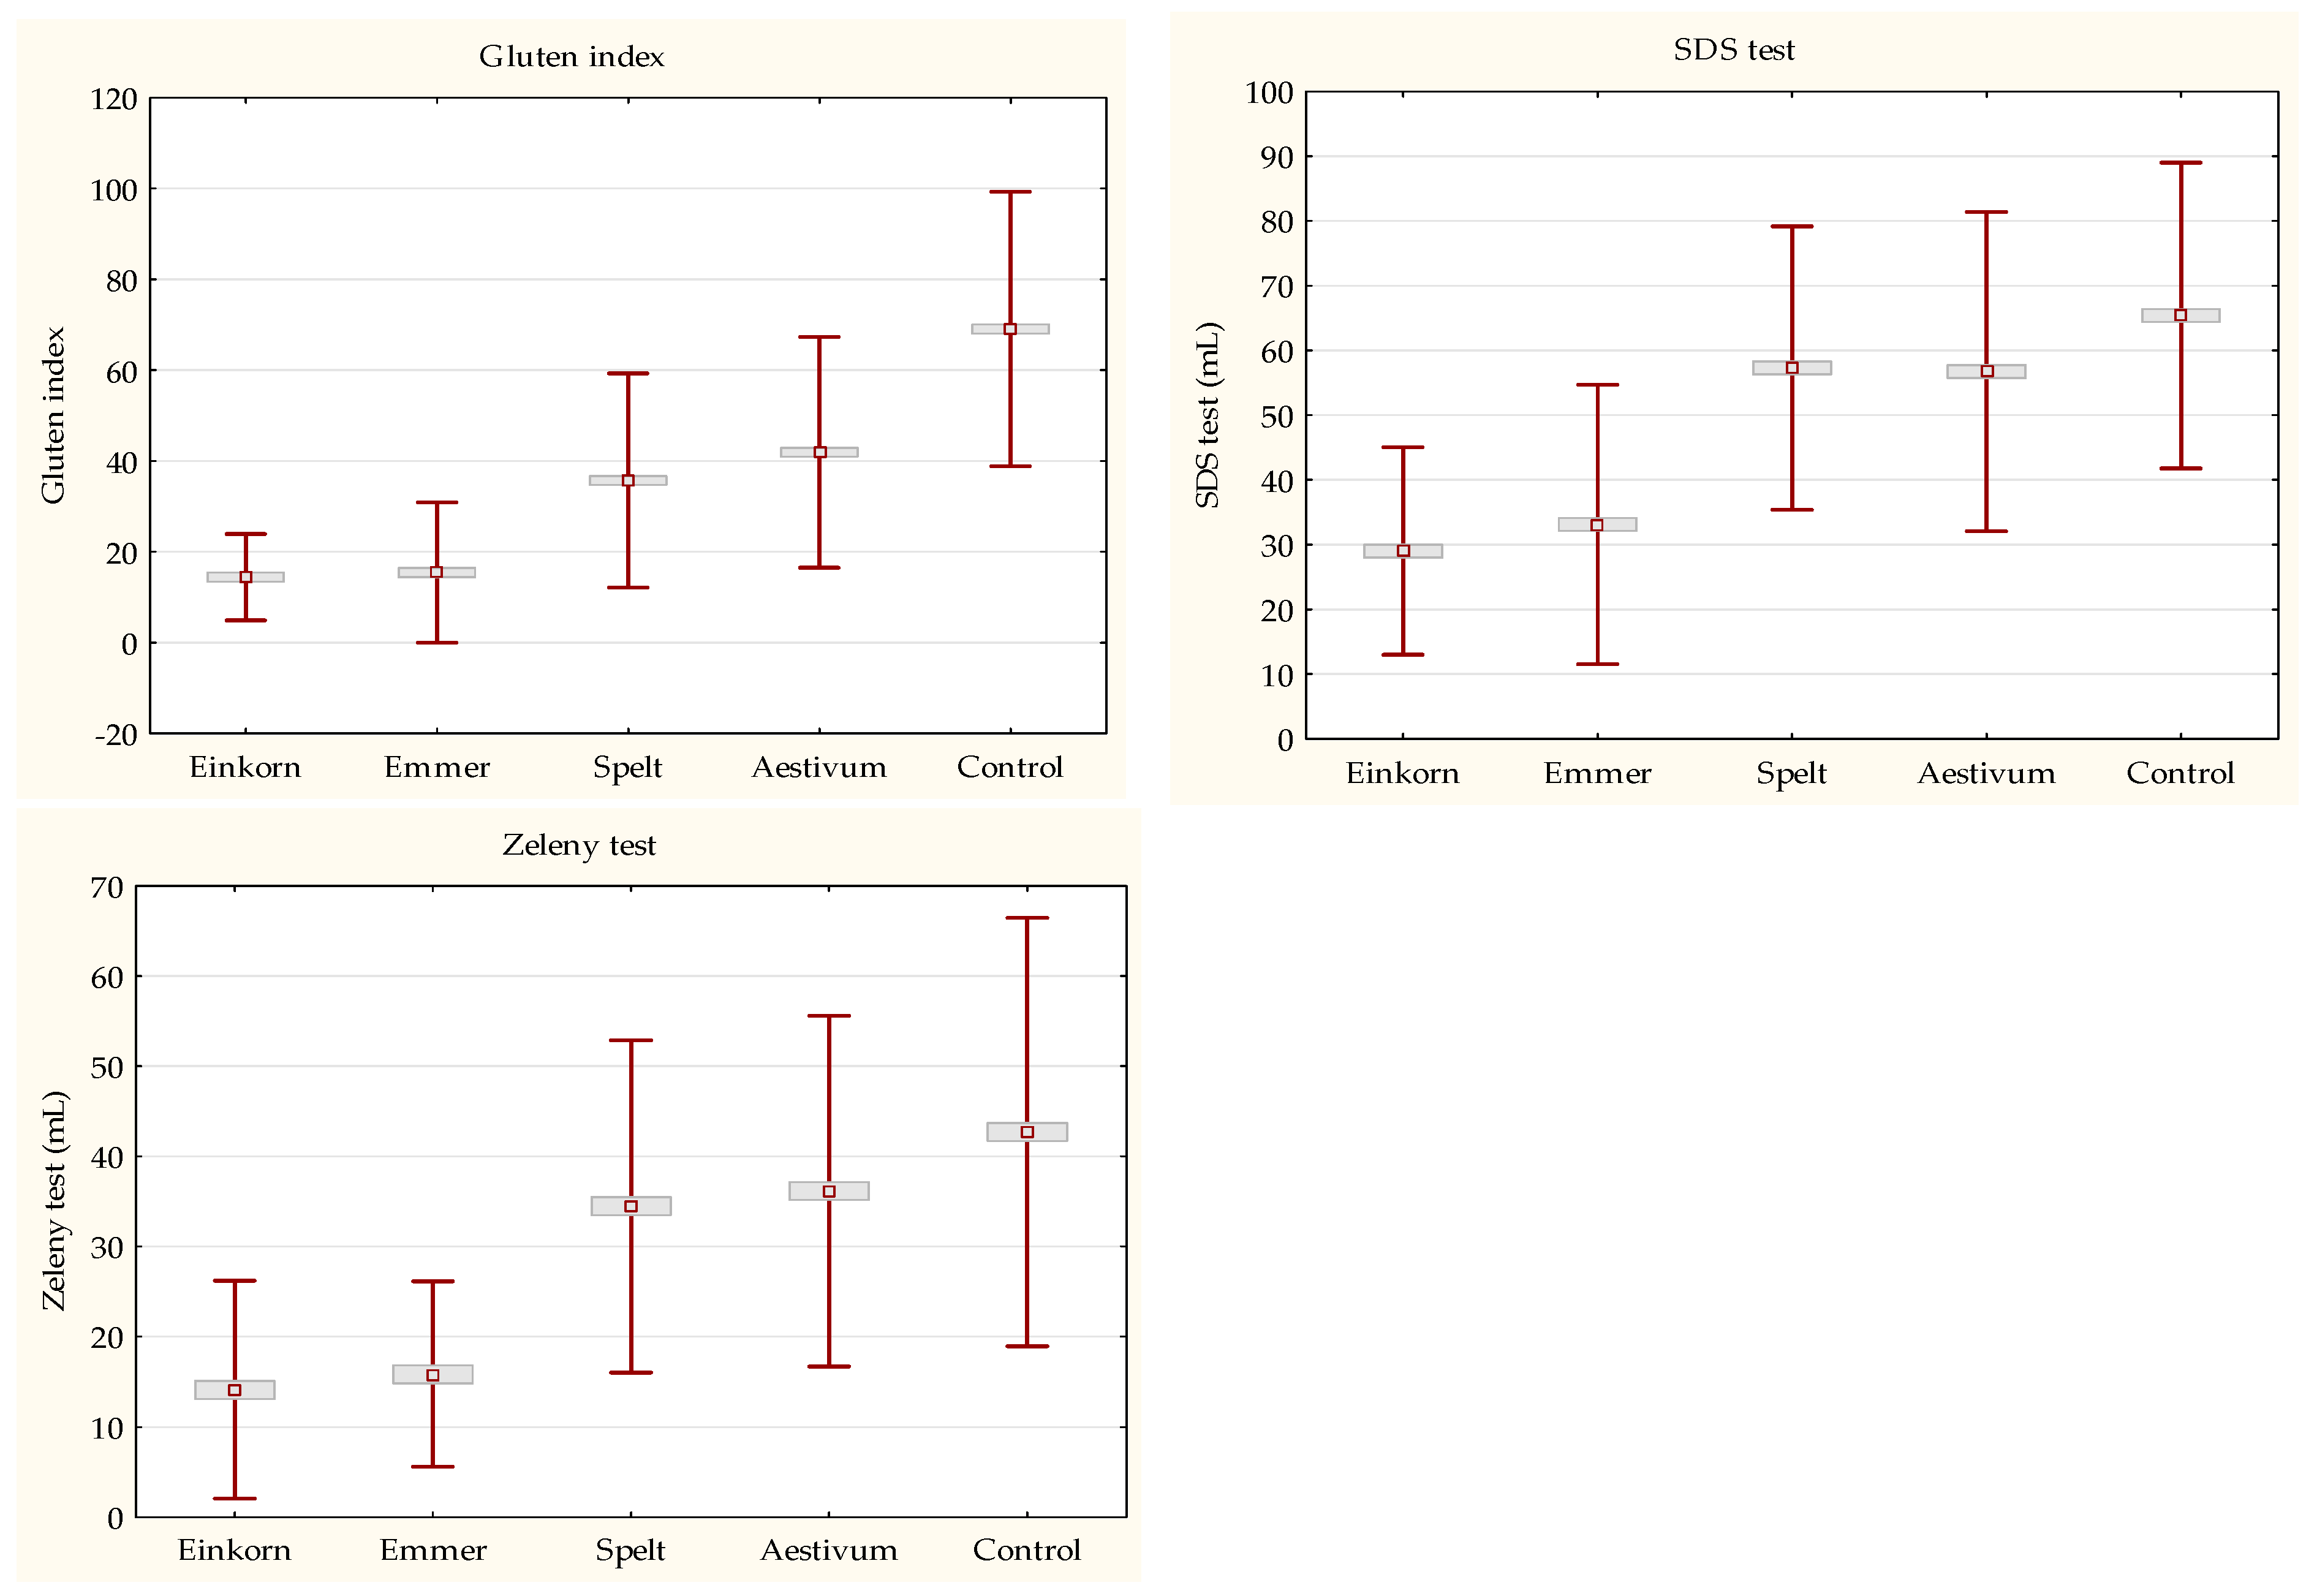
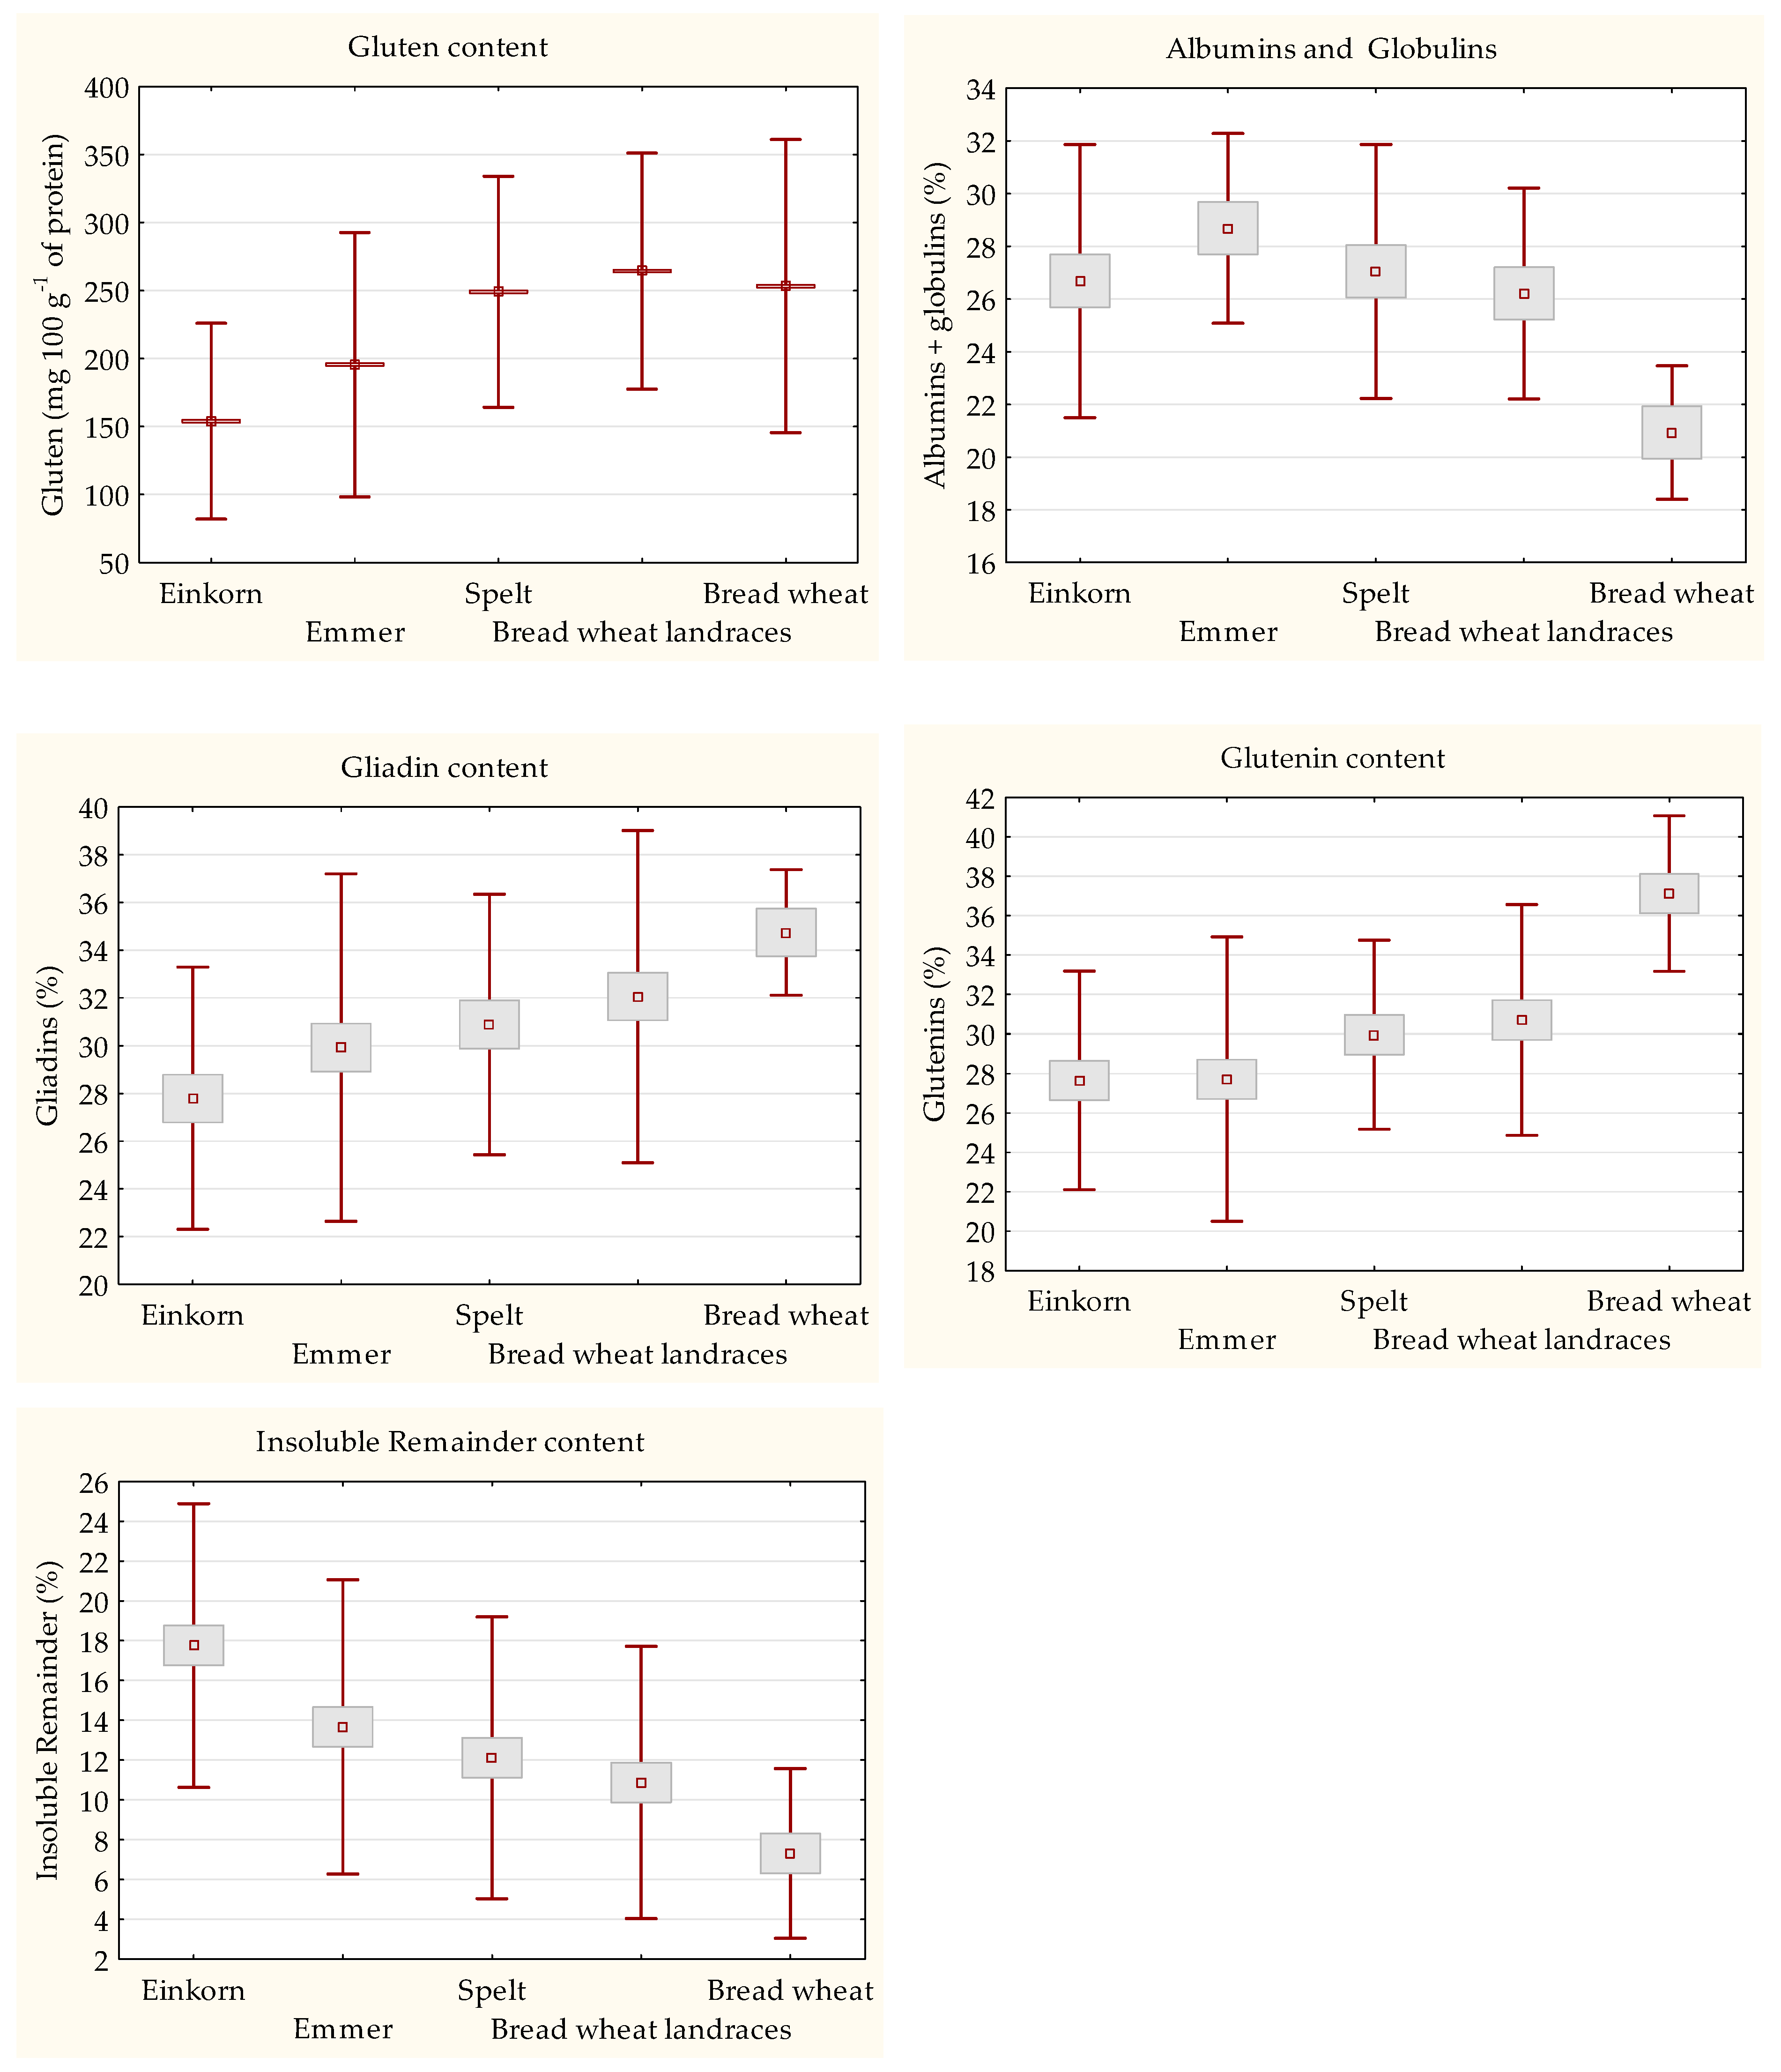
3.3. Quantitaion of Gluten Content and Protein Fractions Composition

The analysis of variance for gluten content, albumins + globulins, gliadins, glutenins, and insoluble remainder is presented in Figure 4, Tables S5–S7. The results reveal a highly significant effect with a p-value < 0.01 for the environments and varieties for all traits. Similarly, the data revealed a highly remarkable effect on all characteristics, with a p-value <0.01 for the interaction between two and three factors.
Gluten content was the highest in the control varieties and landraces of Triticum aestivum L., followed by spelt with no statistical difference. The lowest value was found in einkorn wheat and emmer wheat (confirmed also as statistically different using Tukey’s HSD test). The values for gluten content ranged from 146.41 to 273.78 mg 100 g–1. The highest amount of gluten content was found in bread wheat landraces of wheat variety CP, whereas the lowest one was found in the J2 variety. Globulins were highest in hulled wheat (26.67–28.68%), while the control wheat lagged considerably in this parameter (20.93%). The mean values of albumins and globulins ranged from 20.12 to 30.02%, with the lowest value for the VK variety and highest one for the RU variety. Einkorn had nearly three times as much insoluble remainder as bread wheat. In contrast, for gliadins and glutenins, the control variant of common wheat showed the highest values. Highly significant differences were reported with respect to gliadins and glutenins among species as well as varieties. The highest gliadin amount was observed in wheat variety KP (35.53%), whereas the J1 variety showed the lowest amount (27.01%). The mean values of glutenins ranged from 20.43% to 38.67%. Wheat variety D14 exhibited the lowest glutenin amount (20.43%); conversely, wheat variety SWK had the highest glutenin (38.67%). The highest amount of insoluble remainder was found in the J1 variety (20.48%), whereas the lowest was found in the JR variety (6.91%).

3.4. Characterization of HMW-GSs from the Technological Viewpoint

Although HMW-GS constitutes approximately 10% of total flour protein, it is the most essential determinant of bread-making quality [20]. Two classes of glutenin subunits, HMW-GS and LMW-GS, are present in wheat, and they are released during the reduction of disulfide bonds with reducing agents and determined when analyzed by electrophoresis. The released glutenin subunits were further classified into four subgroups (A–D) by electrophoretic mobility on SDS-PAGE. Subgroup A was determined to be HMW-GS, and subgroups B, C, and D were referred to as LMW-GS [21,22,23,24]. It was also observed that once reduced and separated by SDS-PAGE, high molecular weight gliadins had a mobility similar to those of the B and C subunits of LMW-GS [25]. Having molecular weights between 65 and 90 kDa, based on derived amino acid sequences, and 80–130 kDa on SDS-PAGE, HMW-GS are encoded at complex loci on the long arms of chromosomes 1A, 1B, and 1D of hexaploid wheat, which are the Glu-A1, Glu-B1, and Glu-D1 loci, respectively [23].
HMW-GSs are usually used to indicate the genetic potential of bread wheat varieties, from the baking quality perspective using the Glu-1 score reported by Payne et al. [26], which allocates scores for the subunits (alleles) in each of the wheat’s three genomes (Glu-A1, Glu-B1, and Glu-D1). This is mainly associated with the HMW glutenin subunits encoded at the Glu-D1 locus. The absence of the D genome in emmer wheat and einkorn wheat might be one reason for the lower bread making quality compared to spelt, bread wheat landraces, and bread wheat. The results from Table 1 showed that the spelt wheat varieties differed from the bread wheat varieties in HMW-GSs polymorphism. Different HMW-GS alleles for Glu-B1 and Glu-D1 were found in the studied spelt wheat varieties. Glu-D1 subunit 2 + 12 predominated instead of 5 + 10 at the HMW-GS alleles of Triticum aestivum L.

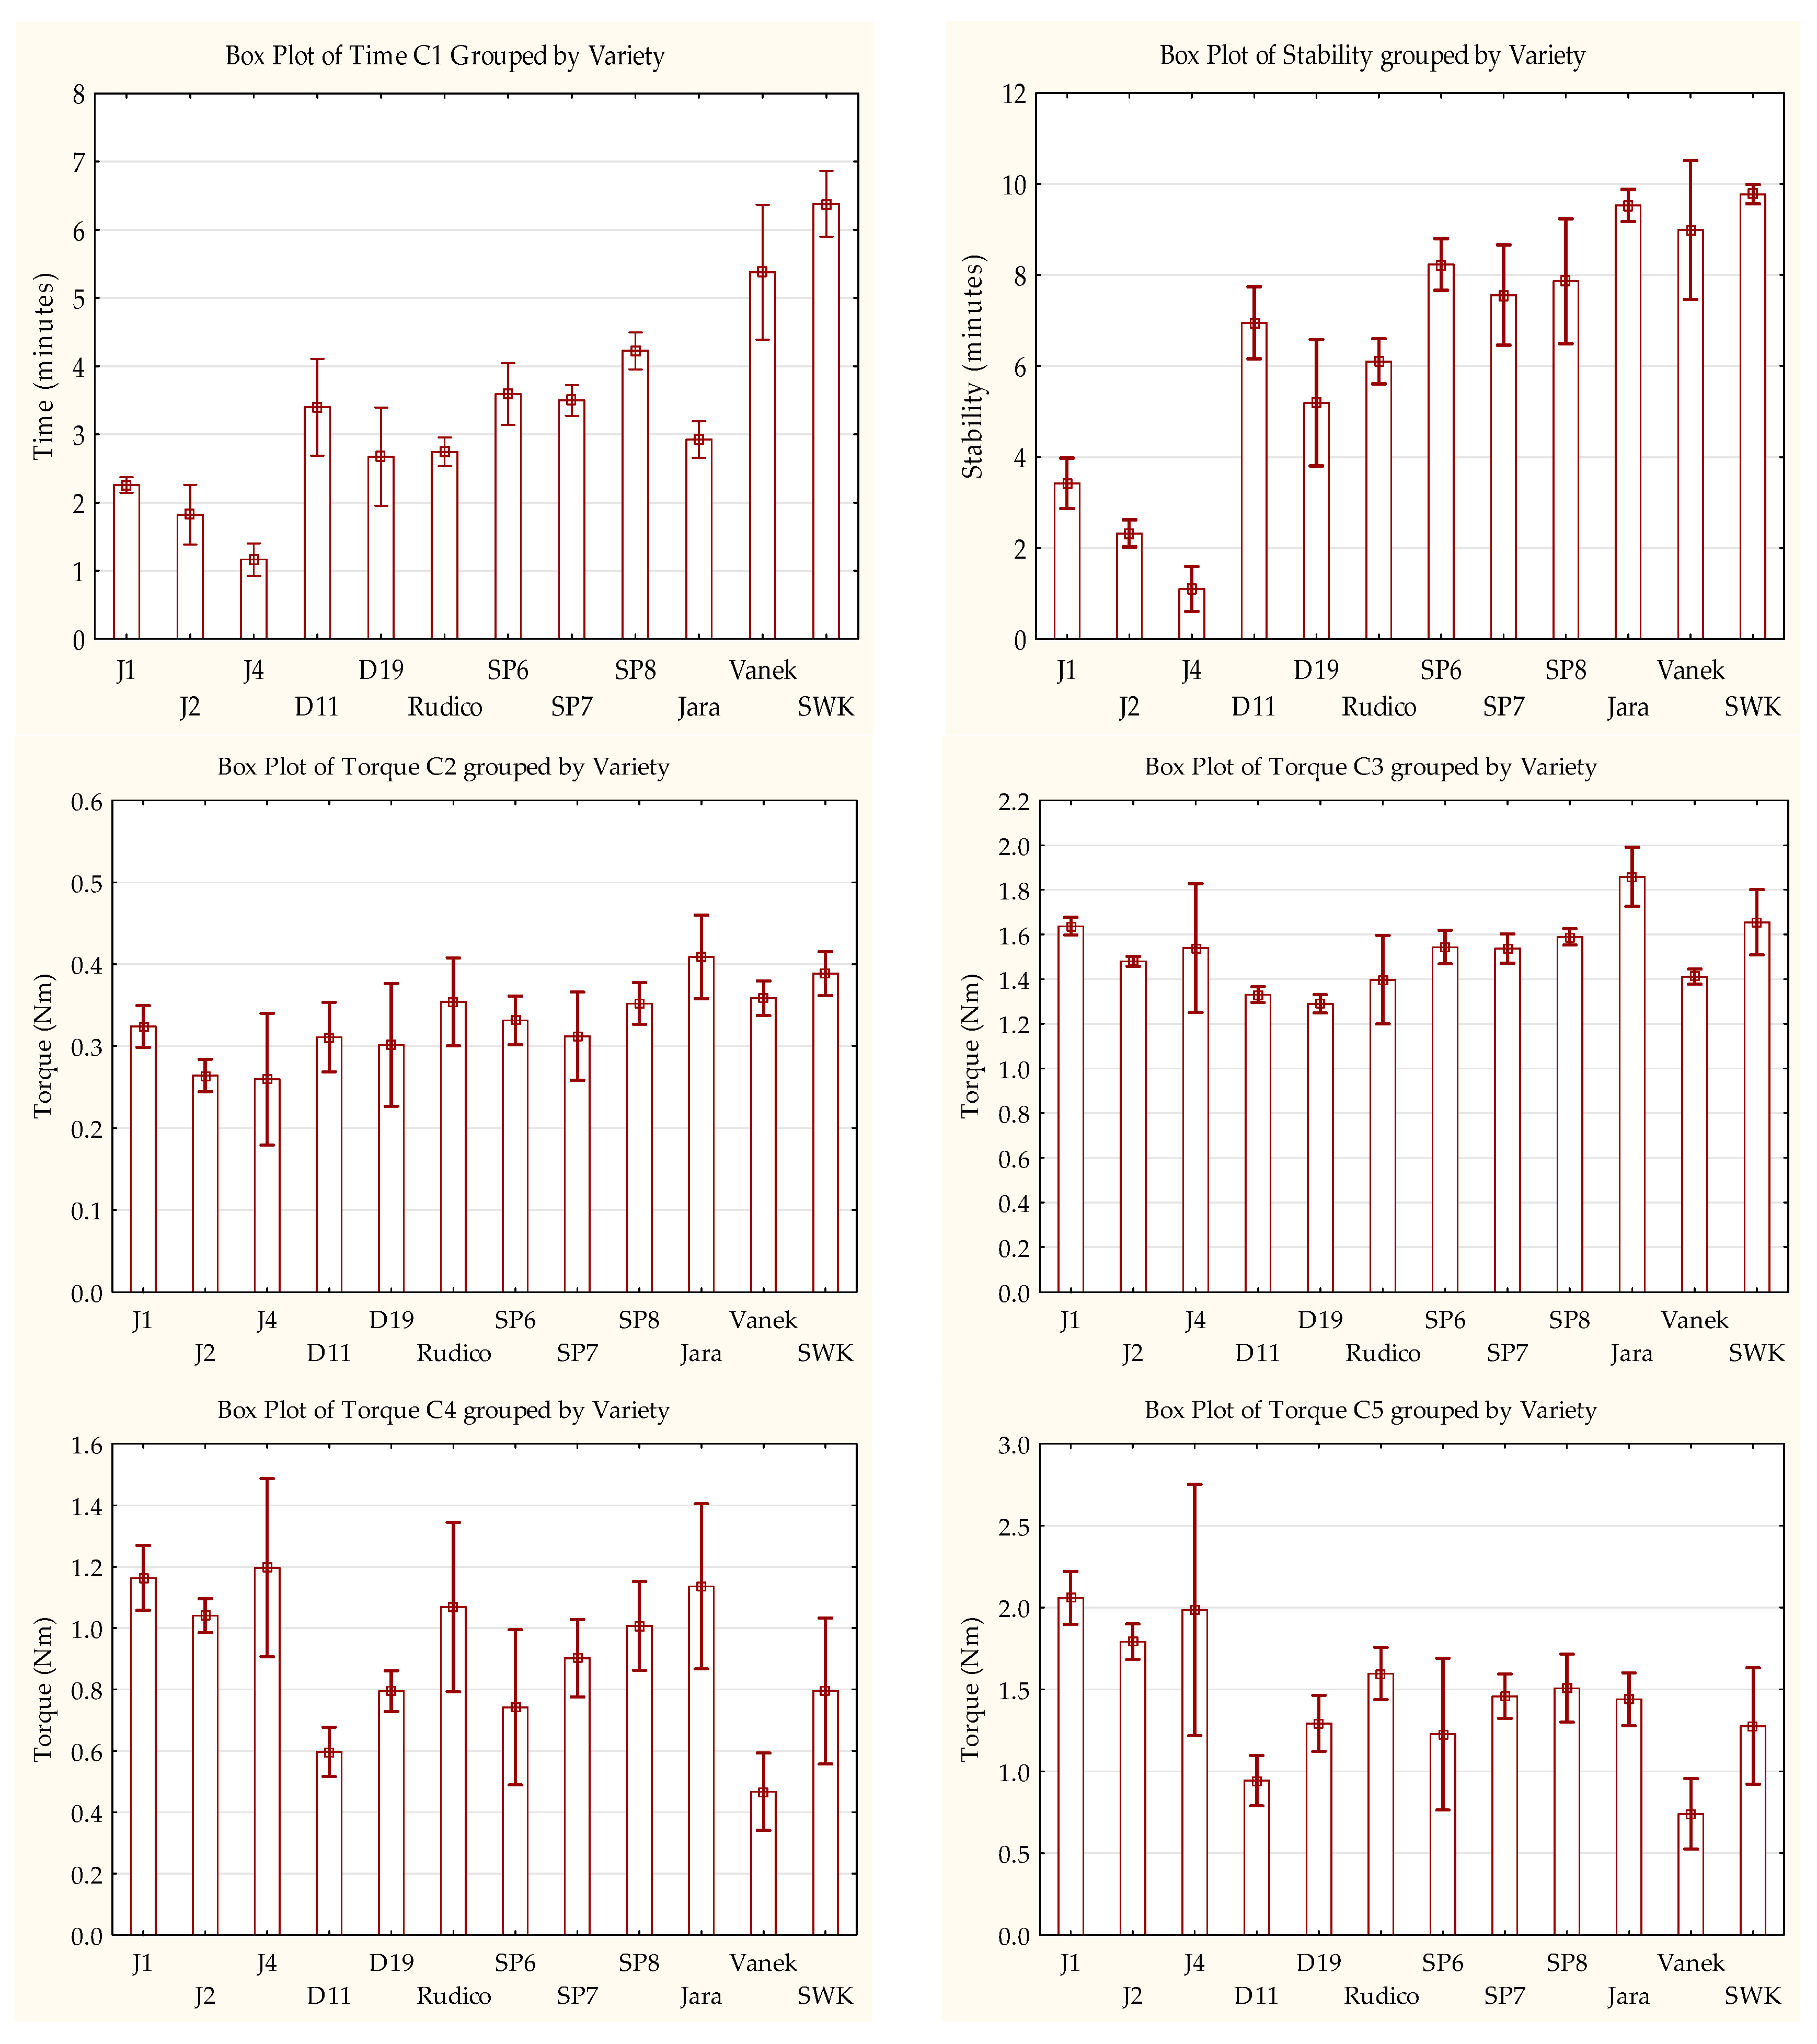
3.5. Rheological Properties of Einkorn, Emmer, Spelt, and Bread Wheat

Mixolab parameters were represented in triplicate per sample (12 varieties in three years at three locations, n = 324). The mean values of each variety for Time C1, The stability, Torque C1, Torque C2, Torque C3, Torque C4, Torque C5, and slope α, β, and γ are displayed in Figure 5, Tables S8 and S9.
In the first stage of Mixolab analysis, dough development time (Time C1) is an essential index, known as the dough development or the gluten development time. For wheat, this period is usually a long time from 0.99 to 7.36 min. Better flour has a longer dough development time. C1 is influenced mainly by the quality of protein, the size of starch granules, and level of starch degradation.
In general, bread wheat had the longest dough development time (from 5.37 min to 6.38 min), with the exception of the Jara variety (2.53 min), compared to the other three wheat species, and variety J4 had the shortest time (1.66 min). The SP8 variety had quite a long development time (4.23 min). In more detail, from Table S8, it is clear that the SW Kadrilj variety (Triticum aestivum) had the longest dough development time (DDT). The development time was short for einkorn. Emmer (tetraploid species) seemed to be better, and no significant differences from spelt (hexaploid) were found. The torque of all varieties reached 1.1 ± 0.05; however, the data from Table S8 do not support statistical differences among the varieties studied. Amplitude is responsible for dough elasticity: the more elastic the dough is, the higher the amplitude. Similarly to Torque C1 values, the findings indicated no differences between varieties and species.
One of the vital parameters in phase C1 of Mixolab is stability, which is the resistance of dough against intensive mixing. This parameter and DDT are frequently associated with better gluten quality [27]. Usually, this value ranges between 4.69 and 11.42 min. Figure 5 and Table S8 show that einkorn had a low stability and needed from 1.11 min to 3.43 min to form a dough structure, while those most resistant to intensive mechanical processing were hexaploid spelt wheat and bread wheat. Additionally, the group of spelt and T. aestivum had a higher stability than the other ones, with the time fluctuating from 7.56 to 9.76 min. According to Bonet et al., 2006 [28], slope α is related to attenuating protein, recorded when heating reaches 52–57 °C at the beginning of the second stage. This was significantly different among species, with lower values for Einkorn species (0.04–0.05 Nm.min−1) than for spelt and bread wheat (0.08–0.12 Nm.min−1). In the second phase, protein attenuation occurs by the change of temperature and mechanical work. The C2 parameter indicates the weakening of proteins during mechanical processing and temperature. The longer the processing time, the higher the value. The values of torque C2 usually range between 0.37 and 0.63 Nm. In this experiment, the small differences between varieties in the torque C2 parameter were found, apart from J1 (Triticum monococum 38), RU, SP6 (VIR St. Petersburg, Russian Federation), and SP8 in comparison to T. aestivum. The third phase of the Mixolab II curve was evaluated via the C3 and slope β parameters. Maximum torque C3 of hot dough at 90 °C, ranged from 1.29 to 1.86 Nm and was significantly different between varieties. However, the same species did not show differences. Slope β, an indicator of pasting speed, was statistically different for four species. In the einkorn group, the data of the J2 variety were significantly different from the tetraploid emmer varieties D19 (Triticum dicoccum—Tabor) and RU. D19 and RU also had the lowest of slope β (0.32 Nm.min−1–0.34 Nm.min−1) compared to other cultivars such as J1, SP6, SP7, JR, and SWK. The stability of hot gel in the starch evaluation phase characterizes the C4 stage. This phase relates to the resistance of starch against the enzymatic hydrolysis by amylase [27] and provides similar information as the falling number [29]. Figure 3 shows that diploid einkorn had a high value of C4. Low C4 values were also found for two tetraploid emmer wheat varieties: D11 (Weisser Sommer) and D19 (Triticum dicoccum—Tabor). In the group of common wheat there was a significant difference between the Vanek (0.47 Nm) with Jara varieties (1.14 Nm), and vice versa was true for spelt varieties. Slope γ is used to determine the speed of enzymatic degradation of starch and heat stability of the starch gel at temperatures over 80 °C. The γ indexes ranged from 0.05 Nm.min−1 to 0.11 Nm.min−1 and were not significantly different in the data. In the final stage, the C5 parameters were assessed by characterizing the retrogradation of starch granules during the cooling phase. Higher C5 torque, in general, was usually associated with higher amylose content, which indicates that wheat flour has strong starch gels [27]. The values varied from 0.74 Nm to 2.06 Nm. All the evaluated values fell within the aforementioned range.

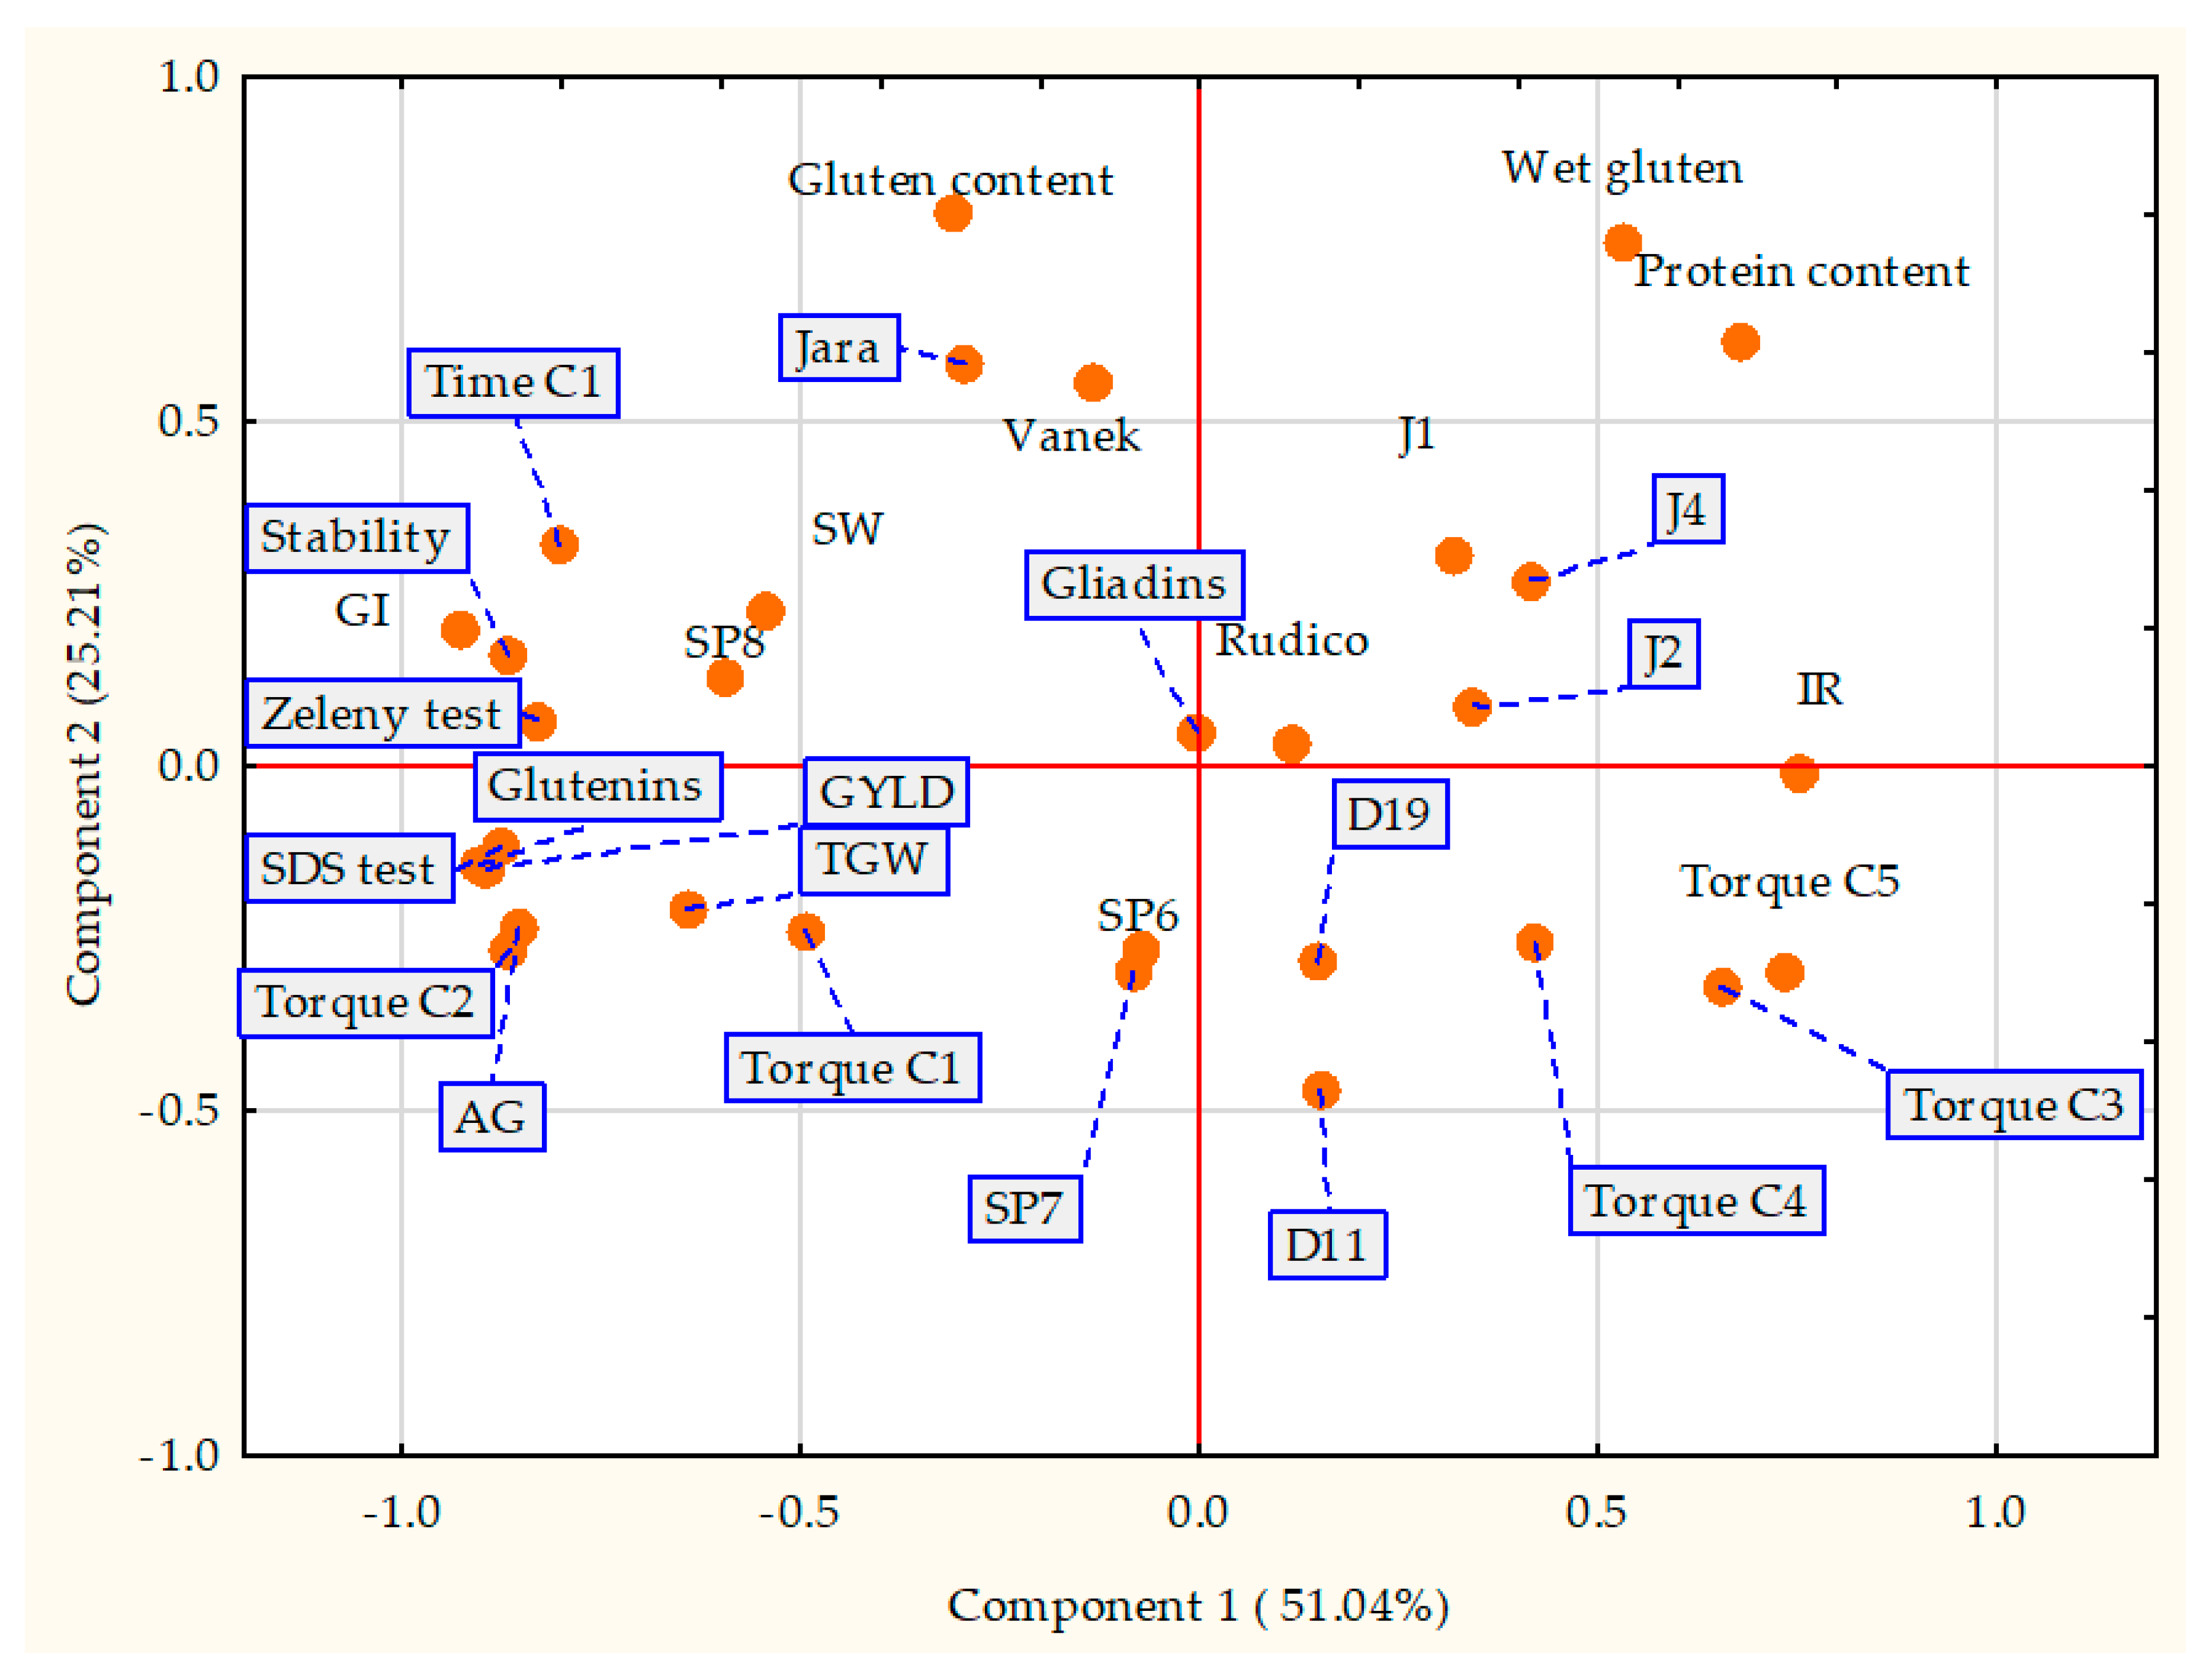
3.6. Principal Component Analysis

The relationships among the quality and quantity parameters of 12 wheat varieties are shown in Figure 6 by principal component analysis (PCA). The first two principals account for 76.25% of the variation. Accounting for 51.04% of the variability, the first principal component was positively related to protein content, insoluble remainder (IR), torque C5, TGW, and wet gluten with loading factors 0.68, 0.75, 0.73, 0.65, and 0.53, respectively. The second principal component constituted 25.21% of the variability with quite high loading factors for gluten content (0.79). Biplots of quantitative traits and quality traits are also presented in Figure 6. In Figure 6, all einkorn and emmer varieties were located in the area of the loading of wet gluten, protein content, Torque C3, Torque C4, and Torque C5, due to their high protein and Nm, compared to bread wheat and spelt wheat. In contrast, common wheat and spelt wheat were located in the area of the loading of quantity traits (GYLD, TGW) and quality traits (gluten content, gliadins, time C1, stability, GI, Zeleny test, SDS test, glutenins, AG, torque C1, and torque C2). The data point of SP8 variety was positioned among gluten content, time C1, stability, GI, and Zeleny test. This means that SP8 could be a good baking performance cultivar and is a suitable candidate for breeders in the future.

4. Discussion

Protein content plays an important role in both the nutritional and technological values of wheat. The protein contents at the diploid level and tetraploid levels were higher than those of hexaploids. In our study, the protein content of the diploid level was 15.59% and that of tetraploid was 16.04%. These results are higher than those reported by Hidalgo and Brandolini [30] by roughly 2% of protein. With our findings confirmed by the data reported by Grausgruber [31], the protein content of the diploid group can exceed 20%. These values were higher than our results indicated. The indexes for the baking quality of einkorn were lower than those of hexaploids. Hence, although the diploid group protein values were superior to those of the rest of the group, the diploid storage proteins might contribute to poor bread manufacturing properties.
Through domestication and modern breeding, the protein content and protein composition of wheat have been changed [32]. The composition of protein fractions can be described by analysis. A good example is einkorn wheat, a diploid species that has a higher protein content but a very different protein fraction composition in comparison to hexaploid wheat [33]. Protein content and total (grain and straw) yield are strongly correlated. The old varieties had a higher protein content but lower yield [34]. In the case of modern varieties, the nutritionally important protein is replaced by starch. Similarly, the protein fractions, nutritionally important albumins and globulins and the insoluble remainder were present in smaller quantities. This comparison is relative, because albumin and globulin are mostly present in the outer layer of einkorn and emmer varieties; therefore, they are relatively low in the endosperm of wheat kernels [35]. In contrast, common wheat cultivars used in this study had lower protein contents, which could be less interesting from a nutritional point of view.
HMW-GSs generally play a major role in determining the viscoelastic properties of dough, according to Sramkova et al. [36]. The content, presence, and variation of HMW-GSs affect the baking quality, notably high bread volume, as well as crumb structure [37]. Favorable effects on dough properties are created by the HMW-GS alleles Glu-A1 (subunits 1, 2*) [38] and Glu-B1, (subunits 7 + 8, 7 + 9) [22]. Subunit 2*, encoded at Glu-A1, which is common in modern common wheat, was found in the case of one landrace, Postoloprtska presivka (P1 variety), and one control variety (Jara variety). This subunit can be used in breeding to increase the glutenin diversity of common wheat and is usually connected with better baking quality [39]. The composition of HMW-GS in other species is typical and is connected to ploidy level. Diploid einkorn has no bands of the Glu-A1 locus while tetraploid emmer wheat has a high variability of subunits on Glu-A1 and Glu-B1, which is related to inferior bread-making quality [36]. Generally, the cultivars in our study having HMG-GS, 5 + 10, 2*, and 7 + 9 positively impacted bread-making quality, which is in agreement with the study of Dhana et al. and Khatkar et al. [40,41]. The subunit 2 + 12 (Glu-1D), present in all spelt wheat cultivars is not as good as the subunit 5 + 10 and is associated with poor baking quality. This was confirmed in the study of Shewry et al. [20]. Although the SP8 variety has the subunit 2 + 12, it has good bread-making qualities because of the long C1 time and stability. The HMW-GS results showed a considerable change in the composition during wheat domestication and intensive breeding.
In order to measure the rheological properties of dough, we used Mixolab to analyze the two stressors of mixing and temperature changes. Mixolab characterizes torque (in Nm) produced by the dough during two-blade mixing. Our results indicated that the torques during mixing in the C1 stage were not significantly different for these varieties. The reverse was true for the dough development time and stability. SWK, VK, and SP8 varieties had longer dough development times, indicating that they produce stronger flours. This relates to the high gluten and glutenin content of their cultivars. In the second and third stages, we found statistically significant differences in the data of the different varieties. However, the differences between groups were unclear. Some of our findings were confusing, especially when the majority of torque C2 and C3 parameters were lower than the usual limits of the range (C2: 0.37–0.63 Nm; C3 1.59–2.27 Nm), apart from Jara and SWK at C2 and J1, Jara and SWK at C3. In the phase of starch evaluation, the lower the torque, the lower the Falling number. The α-amylase complex could be broken in the control variety of the hexaploid wheat Vanek. This explains why Vanek had the lowest torque. Generally, based on our previous results, the less common varieties usually do not meet the falling number criteria. In the last phase, starch retrogradation in the cooling phase, the lowest value was measured for the bread wheat variety Vanek. The starch granules of this hexaploid variety were of low quality, whereas the diploid einkorn wheat had a higher quality of starch measured at the C5 parameter. As reported by Svec and Hruskova [9], wheat flour used as a standard sample during the Mixolab test has torques from C1 to C5 of 1.10, 0.05, 2.06, 1.69, and 2.54 Nm, respectively. Similarly, wheat flour standard torques ranging from C1 to C5 are 1.10, 0.60, 1.98, 1.90, and 2.97 Nm, respectively, according to Schmiele et al. [19]. In comparison, the figures in our research were lower than the two findings quoted above. Only the rheological behaviors of wheat flour dough of Jara and SWK were nearly equivalent to the standard sample, apart from torque C4 and torque C5. This showed that the stability of starch gel formed and the retrogradation stage of starch for Jara and SWK were not as good as those of the wheat flour standard.
PCA was presented with all data in Figure 4, and the corresponding biplot is indicated for component scores and variable loadings. This is a useful tool to choose varieties from other wheat species that have similar characteristics as bread wheat. For instance, in this study it is understood that SWK, VK, and SP8 varieties have good baking performances. This conclusion is based upon the proximity of their positions to the parameters quality such as gluten content, GI, Zeleny test, stability, time C1 and gliadin. J1, J2, and J4 cultivars had the highest protein contents.

5. Conclusions

The objective of this paper was to compare the protein composition and rheological characterization of einkorn, emmer, spelt, bread wheat landraces and common wheat species.
In this study, differences between the diploid level group and hexaploid level groups of wheat were found, not only in terms of the basic baking quality but also from a nutritional point of view. Domestication and modern breeding processes have changed the composition of the grain. The less common and older forms of wheat contain more protein compared to modern varieties. In the less common species, the share of nutritionally important protein fractions is higher, including albumins, globulins, and the insoluble remainder. However, this higher possible nutritional value is compensated for by the lower technological quality for baking, as demonstrated by the high molecular weight of glutenin subunits of protein. The same results were provided via the rheological analysis in Mixolab. Some of the varieties from the group of genetic resources have the potential to be used during the breeding process. To our knowledge, this is the first study comparing the protein fractions and rheological characterization of five wheat species grown at three locations. However, further work is required to expand the information obtained in the present study using a large number of wheat varieties when analyzing protein composition and Mixolab. PCA with all parameters was suitable to determine the good baking performance of cultivars. Ancient wheat species, such as diploid einkorn and tetraploid emmer, had high possible nutritional value, but their technological quality was lower. Therefore, to improve the dough and baking properties of einkorn and emmer, a mixture of einkorn, emmer and common wheat should be created.

Supplementary Materials

The following are available online at https://0-www-mdpi-com.brum.beds.ac.uk/2073-4395/10/11/1763/s1. Table S1: List of all 26 wheat varieties used in this study and their abbreviations, Table S2: Thousand grain weight and grain yield of wheat varieties, Table S3: Means ± standard error (SE) and ANOVA F-value (p-value) for the effects of harvest year, location, and wheat species on protein content, gluten content, gluten index (GI), sedimentation index (SDS test), and Zeleny test (ZT), Table S4: Quality characteristics of varieties of different wheat species. Table S5: Analysis of variance for protein fractions under three locations, four years, and different varieties, Table S6: Contents of gluten, albumins + globulins, gliadins, glutenins, and insoluble remainder of different wheat species, Table S7: Contents of gluten, albumins + globulins, gliadins, glutenins, and insoluble remainder of different wheat cultivars, Table S8: Gluten development time at the C1 in Mixolab, Table S9: Flour quality parameters of wheat varieties at C2, C3, C4, and C5 stage.

Author Contributions

Conceptualization, K.D.T. and P.K.; Formal Analysis, K.D.T., P.X.T.T. and P.K.; Methodology, K.D.T. and P.K., Writing original draft, K.D.T.; Funding acquisition, P.K. and D.J.; Resources, P.K. and D.J.; Writing review and editing, P.K., I.C., and M.L.-B., Supervision, P.K.; Validation; K.D.T., Visualization, M.K. and P.X.T.T. All authors have read and agreed to the published version of the manuscript.

Funding

This research was funded by the University of South Bohemia in Ceske Budejovice, research project GAJU 059/2019/Z and by the Ministry of Agriculture of the Czech Republic, research project NAZV QK1910046. The National Program for the Conservation and Use of Plant Genetic Resources and Agrobiodiversity, Ministry of Agriculture of the Czech Republic, 6.2.5/51834/2017-MZE-17253.

Conflicts of Interest

The authors declare no conflict of interest.

References

  1. The World Wheat Book a History of Wheat Breeding, 1st ed.; William, J.; Angus, A.P.B. (Eds.) Lavoisier: Cachan, France, 2001; ISBN 1-898298-72-6. [Google Scholar]
  2. Zrcková, M.; Capouchová, I.; Paznocht, L.; Eliášová, M.; Dvořák, P.; Konvalina, P.; Janovská, D.; Orsák, M.; Bečková, L. Variation of the total content of polyphenols and phenolic acids in einkorn, emmer, spelt and common wheat grain as a function of genotype, wheat species and crop year. Plant Soil Environ. 2019, 65, 260–266. [Google Scholar] [CrossRef] [Green Version]
  3. Van Zeist, W.; Bakker-Heeres, J.A.H. Archaeobotanical studies in the Levant: I. Neolithic sites in the Damascus basin: Aswad, Ghoraife, Ramad. Palaeohistoria 2015, 24, 165–256. [Google Scholar]
  4. Crawford, D.J. Food: Tradition and change in Hellenistic Egypt. World Archaeol. 1979, 11, 136–146. [Google Scholar] [CrossRef]
  5. Arzani, A.; Ashraf, M. Cultivated Ancient Wheats (Triticum spp.): A Potential Source of Health-Beneficial Food Products. Compr. Rev. Food Sci. Food Saf. 2017, 16, 477–488. [Google Scholar] [CrossRef] [Green Version]
  6. Shewry, P.R.; Halford, N.G. Cereal seed storage proteins: Structures, properties and role in grain utilization. J. Exp. Bot. 2002, 53, 947–958. [Google Scholar] [CrossRef] [PubMed] [Green Version]
  7. Branlard, G.; Dardevet, M.; Saccomano, R.; Lagoutte, F.; Gourdon, J. Genetic diversity of wheat storage proteins and bread wheat quality. Euphytica 2001, 119, 59–67. [Google Scholar] [CrossRef]
  8. Bradová, J.; Šašek, A. Diversity of gliadins and HMW glutenin subunits in Czech registered wheat varieties. Czech J. Genet. Plant Breed. 2012, 41, 160–163. [Google Scholar] [CrossRef] [Green Version]
  9. Švec, I.; Hrušková, M. The Mixolab parameters of composite wheat/hemp flour and their relation to quality features. LWT Food Sci. Technol. 2015, 60, 623–629. [Google Scholar] [CrossRef]
  10. Harati, H.; Bekes, F.; Howell, K.; Noonan, S.; Florides, C.; Beasley, J.; Diepeveen, D.; Appels, R. Signatures for torque variation in wheat dough structure are affected by enzymatic treatments and heating. Food Chem. 2020, 316, 126357. [Google Scholar] [CrossRef]
  11. Axford, D.; Mcdermott, E.; Redman, D. Small-Scale Tests of Bread-Making Quality. Milling Feed Fertil. 1978, 161, 18–20. [Google Scholar]
  12. Capouchová, I.; Petr, J.; Tlaskalová-Hogenová, H.; Michalík, I.; Faměra, O.; Urminská, D.; Tučková, L.; Knoblochová, H.; Borovská, D. Protein fractions of oats and possibilities of oat utilisation for patients with coeliac disease. Czech J. Food Sci. 2011, 22, 151–162. [Google Scholar] [CrossRef] [Green Version]
  13. Laemmli, U.K. Cleavage of Structural Proteins during the Assembly of the Head of Bacteriophage T4. Nature 1970, 227, 680–685. [Google Scholar] [CrossRef] [PubMed]
  14. Payne, P.I.; Lawrence, G.J. Catalogue of alleles for the complex gene loci, Glu-A1, Glu-B1, and Glu-D1 which code for high-molecular-weight subunits of glutenin in hexaploid wheat. Cereal Res. Commun. 1983, 11, 29–35. [Google Scholar]
  15. Bradová, J.; Matějová, E. Comparison of the Results of SDS PAGE and Chip Electrophoresis of Wheat Storage Proteins. Chroma 2008, 67, 83–88. [Google Scholar] [CrossRef]
  16. Konvalina, P.; Grausgruber, H.; Tran Dang, K.; Vlasek, O.; Capouchova, I.; Sterba, Z.; Suchy, K.; Stolickova, M.; Kyptova, M.; Bernas, J.; et al. Rheological and Technological Quality of Minor Wheat Species and Common Wheat. In Wheat Improvement, Management and Utilization; Wanyera, R., Owuoche, J., Eds.; BoD–Books on Demand: Norderstedt, Germany, 2017; ISBN 978-953-51-3151-9. [Google Scholar]
  17. Rosell, C.M.; Collar, C.; Haros, M. Assessment of hydrocolloid effects on the thermo-mechanical properties of wheat using the Mixolab. Food Hydrocoll. 2007, 21, 452–462. [Google Scholar] [CrossRef]
  18. Ferrer, A.; Rosell, C.M. Rheological Behaviour of Whole Wheat Flour. In Proceedings of the IUFOST—13th World Congress of Food Science & Technology: Food Is Life, Nantes, France, 17–21 September 2006. [Google Scholar] [CrossRef]
  19. Schmiele, M.; Ferrari Felisberto, M.H.; Pedrosa Silva Clerici, M.T.; Chang, Y.K. MixolabTM for rheological evaluation of wheat flour partially replaced by soy protein hydrolysate and fructooligosaccharides for bread production. LWT Food Sci. Technol. 2017, 76, 259–269. [Google Scholar] [CrossRef]
  20. Shewry, P.R.; Halford, N.G.; Tatham, A.S. High molecular weight subunits of wheat glutenin. J. Cereal Sci. 1992, 15, 105–120. [Google Scholar] [CrossRef]
  21. Shewry, P.R.; Tatham, A.S. The prolamin storage proteins of cereal seeds: Structure and evolution. Biochem. J. 1990, 267, 1–12. [Google Scholar] [CrossRef] [Green Version]
  22. Gliadin and Glutenin: The Unique Balance of Wheat Quality; Wrigley, C.W.; Békés, F.; Bushuk, W. (Eds.) AACC International: St. Paul, MN, USA, 2006; ISBN 978-1-891127-51-9. [Google Scholar]
  23. Gianibelli, M.C.; Larroque, O.R.; MacRitchie, F.; Wrigley, C.W. Biochemical, Genetic, and Molecular Characterization of Wheat Glutenin and Its Component Subunits. Cereal Chem. 2001, 78, 635–646. [Google Scholar] [CrossRef]
  24. Wang, Y.G.; Khan, K.; Hareland, G.; Nygard, G. Quantitative Glutenin Composition from Gel Electrophoresis of Flour Mill Streams and Relationship to Breadmaking Quality. Cereal Chem. 2006, 83, 293–299. [Google Scholar] [CrossRef]
  25. Payne, P.I.; Corfield, K.G. Subunit composition of wheat glutenin proteins, isolated by gel filtration in a dissociating medium. Planta 1979, 145, 83–88. [Google Scholar] [CrossRef] [PubMed]
  26. Payne, P.I.; Nightingale, M.A.; Krattiger, A.F.; Holt, L.M. The relationship between HMW glutenin subunit composition and the bread-making quality of British-grown wheat varieties. J. Sci. Food Agric. 1987, 40, 51–56. [Google Scholar] [CrossRef]
  27. Banfalvi, A.; Nemeth, R.; Bagdi, A.; Gergely, S.; Rakszegi, M.; Bedo, Z.; Lang, L.; Vida, G.; Tomoskozi, S. A novel approach to the characterization of old wheat (Triticum aestivum L.) varieties by complex rheological analysis. J. Sci. Food Agric. 2020, 100, 4409–4417. [Google Scholar] [CrossRef] [PubMed]
  28. Koksel, H.; Kahraman, K.; Sanal, T.; Ozay, D.S.; Dubat, A. Potential Utilization of Mixolab for Quality Evaluation of Bread Wheat Genotypes. Cereal Chem. 2009, 86, 522–526. [Google Scholar] [CrossRef]
  29. Codina, G.G.; Mironeasa, S.; Bordei, D.; Leahu, A. Mixolab versus Alveograph and Falling Number. Czech J. Food Sci. 2010, 28, 185–191. [Google Scholar] [CrossRef] [Green Version]
  30. McKevith, B. Nutritional aspects of cereals. Nutr. Bull. 2004, 29, 111–142. [Google Scholar] [CrossRef]
  31. Grausgruber, H.; Sailer, C.; Ghambashidze, G.; Bolyos, L.; Ruckenbauer, P. Genetic variation in agronomic and qualitative traits of ancient wheats. In Proceedings of the 17th EUCARPIA General Congress, Tulln, Austria, 8–11 September 2004; pp. 19–22. [Google Scholar]
  32. Kiszonas, A.; Morris, C.F. Wheat Breeding for Quality: A Historical Review. Cereal Chem. J. 2017, 95, 17–34. [Google Scholar] [CrossRef] [Green Version]
  33. Konvalina, P.; Capouchova, I.; Stehno, Z.; Moudry, J., Jr.; Moudry, J. Fusarium Identification by PCR and DON Content in Grain of Ancient Wheat. J. Food Agric. Environ. 2009, 9, 321–325. Available online: http://orgprints.org/20762/ (accessed on 3 May 2012).
  34. Konvalina, P.; Stehno, Z.; Capouchová, I.; Zechner, E.; Berger, S.; Grausgruber, H.; Janovská, D.; Moudrý, J. Differences in grain/straw ratio, protein content and yield in landraces and modern varieties of different wheat species under organic farming. Euphytica 2014, 199, 31–40. [Google Scholar] [CrossRef]
  35. Goesaert, H.; Brijs, K.; Veraverbeke, W.S.; Courtin, C.M.; Gebruers, K.; Delcour, J.A. Wheat flour constituents: How they impact bread quality, and how to impact their functionality. Trends Food Sci. Technol. 2005, 16, 12–30. [Google Scholar] [CrossRef]
  36. Šramková, Z.; Gregová, E.; Šturdík, E. Genetic improvement of wheat—A review. Nova Biotechnol. 2009, 9, 27–51. [Google Scholar]
  37. Jiang, P.; Xue, J.; Duan, L.; Gu, Y.; Mu, J.; Han, S.; Chen, L.; Li, Y.; Ma, W.; Yan, Y.; et al. Effects of high-molecular-weight glutenin subunit combination in common wheat on the quality of crumb structure. J. Sci. Food Agric. 2019, 99, 1501–1508. [Google Scholar] [CrossRef] [PubMed]
  38. Vasil, I.K.; Anderson, O.D. Genetic engineering of wheat gluten. Trends Plant Sci. 1997, 2, 292–297. [Google Scholar] [CrossRef]
  39. Stehno, Z.; Bradová, J.; Dotlačil, L.; Konvalina, P. Landraces and obsolete cultivars of minor wheat species in the Czech collection of wheat genetic resources. Czech J. Genet. Plant Breed. 2010, 46, 100–105. [Google Scholar] [CrossRef] [Green Version]
  40. Dhaka, V.; Gulia, N. Application of Mixolab to Assess the Bread Making Quality of Wheat Varieties. J. Food Process. Technol. 2012, 1. [Google Scholar] [CrossRef]
  41. Khatkar, B. Effects of high Mr glutenin subunits on dynamic rheological properties and bread making qualities of wheat gluten. J. Food Sci. Technol. 2006, 43, 382–387. [Google Scholar]
Figure 1. The Mixolab curves from wheat flour. Time for C1: The time evolution of the dough. The stronger the flour, the longer the time evolution (time to reach C1); Amplitude: The elasticity of the dough. The higher the value, the more flexible the flour; Stability: Resistance against kneaded dough. The longer the duration, the stronger the flour; C2: Attenuation of protein due to mechanical work and temperature; C3: The gelling starch; C4: The stability of the hot gel; C5: Measured starch retrogradation in the cooling phase; Guideline α (C1–C2): Attenuation rate of protein in warming; Guideline β (C3–C4): Speed starch gelatinization; Guideline γ (C5–C4): The rate of enzymatic degradation. [16].
Agronomy 10 01763 g001
Figure 2. The data show the box plots of thousand grain weight (TGW) and grain yield GYLD, grouped by genotype. The figures are presented as means of 26 wheat varieties grown at three locations, four replications, in four years (n = 48). Box plots represent the interquartile range; the rectangles in the box symbolize the mean value ± 1, and whiskers designate the minimum and maximum of the box plot.
Agronomy 10 01763 g002
Figure 3. Contents of protein and gluten, gluten index, sodium dodecyl sulphate (SDS) test, and Zeleny test in einkorn, emmer, spelt, aestivum, and control varieties. Figures are presented as the mean of five wheat species grown at three locations, four replications, in four years (n = 1248). Bbox plots represent the interquartile range, the rectangles in the box symbolize the mean value ±1, and whiskers designate minimum and maximum of the box plot.
Agronomy 10 01763 g003aAgronomy 10 01763 g003b
Figure 4. Contents of gluten, albumins and globulins, gliadins, glutenins, and insoluble remainder. The figures are presented as means of five wheat species grown at three locations, three replications, in four years (n = 936). Box plots represent the interquartile range, the rectangles in the box symbolize the mean value ± 1, and whiskers designate the minimum and maximum of the box plot.
Agronomy 10 01763 g004
Figure 5. Parameters of Time C1, Stability, Torque C2, Torque C3, Torque 4, and Torque C5 in the measured Mixolab. Data are the means of 12 wheat varieties at three locations, three replicates, in three years (n = 36). Box plots represent the interquartile range, the columns in the box symbolize the mean value, and whiskers designate the minimum and maximum of the box plot.
Agronomy 10 01763 g005
Figure 6. Principal component analysis biplot based on various physicochemical parameters of wheat varieties using mean value of three locations. AG: Albumins and globulins; IR: Insoluble remainder; FN: Falling number.
Agronomy 10 01763 g006
Table 1. Allelic frequency for Glu-A1, Glu-B1, and Glu-D1 loci of the evaluated varieties.
SpeciesVarietyHMW-GSs
Glu-A1Glu-B1Glu-1D
Einkorn J1 0
J2 0
J4 0
J6 0
Emmer D111(7 + 8)
D121(7 + 8)
D132 *6 (21)
D1400
D1716 (21)
D181(7 + unk)
D191(7+8)
RU1(7+8)
Spelt SP117+82+12
SP216 + 82 + 12
SP416 + 82 + 12
SP617 + 82 + 12
SP717 + 82 + 12
SP817 + 82 + 12
SP916 + 82 + 12
Landraces of bread wheatP12 *72 + 12
P207 + 95 + 10
P307 + 95 + 10
P407 + 95 + 10
Bread wheatJR2 *7 + 95 + 10
VK17 + 95 + 10
SWK114 + 155 + 10
Note: unk = unknown; * is used to discriminate between 2* and 2.
Publisher’s Note: MDPI stays neutral with regard to jurisdictional claims in published maps and institutional affiliations.

