Article

Genetic Diversity and Population Structure of Algerian Endemic Plant Species Avena macrostachya Bal. ex Cross. et Durieu

National Centre for Plant Genetic Resources, Plant Breeding and Acclimatization Institute (IHAR)—National Research Institute, Radzików, 05-870 Błonie, Poland
*
Author to whom correspondence should be addressed.
Submission received: 23 November 2020 / Revised: 10 December 2020 / Accepted: 15 December 2020 / Published: 17 December 2020
(This article belongs to the Special Issue Use of Wild Crop Relatives as Genetic Resources in Crop Breeding)

Abstract

:
Avena macrostachya is still a relatively unknown species. Using sequence-related amplified polymorphism (SRAP) markers, a simple and inexpensive technique, allowed us to conduct experiments on genetic differentiation and to study the population structure of this Algerian endemic oat. The results obtained showed lower than expected genetic diversity within the A. macrostachya species. The cause may be endemism of the species as well as genetic drift possible during collection, and maintenance of the accessions in gene bank and seed reproduction. No clear genetic structure was found in the examined collection, which indicates a close relationship between the populations collected in the Djurdjura National Park in Algeria. Considering the endemism of the species, its breeding potential and the small-scale ex situ collection, careful monitoring of natural sites and repeating of the collection mission are, therefore, absolutely crucial.

1. Introduction

Avena macrostachya Bal. ex Cross. et Durieu was discovered in 1853 by Benjamin Balans. The specimen no. 718 collected on 30 June 1853 at “Djebel Tougour prope Batna” at Bellezma Mountains is the holotype of the species [1]. It is a wild African oat species, classified as a relict endemic to the Atlas Mountains in north-east Algeria [1,2]. Its occurrence is limited to altitudes 1500–2200 m above sea level. It is typical of the alpine lawns of the Djurdjura mountains (locus classicus) [3]. It is the only perennial and allogamous species within the Avena genus [2]. A. macrostachya has 28 median or sub-median chromosomes, which are similar in size. Baum and Rajhathy [2] classified it as an autotetraploid, however, the most frequent meiotic configuration of four tetravalents and six bivalents indicates a level of homoeology developed in the course of the evolutionary process of diploidization. More recent studies have supported the hypothesis of an autopolyploid origin of this species [3]. According to Stebbins [4], the symmetry in karyotype, higher than in other Avena species, together with the perennial growth habit and cross-breeding system make the species most close to the ancestral forms of the genus. The morphological and karyological distinctness of A. macrostachya inspired even the question of assignment to another related genus Helictotrichon (as H. macrostachyum). However, cladistic analysis carried out by Baum has shown that A. macrostachya belongs to the genus Avena [2]. Further studies on hybridization of A. macrostachya with the diploid species of Avena indicated the C-genome group as the closest relatives [5,6]. Further molecular studies confirmed it [7,8,9] despite remarkable differences in chromosome symmetry level and localization of heterochromatic bands, and the lack of C-genome specific probe pattern [10]. Therefore, Rodionov et al. [8] assigned to A. macrostachya a new genome symbol Cm.
The general appearance of the A. macrostachya panicle is reminiscent of a laxed Avena clauda Dur. because of the long pedicels, the unequal glumes, and the florets which disarticulate at maturity (Figure 1). The epicuticular wax pattern of the glumes is a mixture of knobs and filaments rare in the genus. Sometimes, the uppermost florets may not disarticulate. Often, the lodicules vary in type even within the same floret, one may be of A. sativa type and the other of A. fatua type [11]. Spikelets comprising three to six fertile florets with diminished florets at the apex are 20–30 mm long. Florets disarticulate at maturity. A. macrostachya has short rhizomes, culms erect or geniculately ascending. Culms are 40–100 cm long, 2–3-noded. The ligule is 1–2 mm long, leaf-blades are 10–16 cm long and 3–6 mm wide and their surface is scaberulous, rough on both sides. A. macrostachya has apical sterile florets resembling those fertile though underdeveloped. Flowers have three anthers 8–9 mm long and ovary pubescent on apex. The fruit is a caryopsis with adherent pericarp, hairy at the apex [12].
The Mediterranean basin is considered a global biodiversity hotspot primarily because of the size and diversity of its flora. About 10% of the world’s vascular plants inhabit 1.6% of the world’s terrestrial area [13]. In northern Algeria, 22 sites have been identified as Important Plant Areas (IPAs) for endemic plant species. The Atlas Mountains in Algeria include many valuable nature parks and reserves, the Bellezma National Park and the Djurdjura National Park contain the natural sites of A. macrostachya [14].
The Atlas Mountains are located in northern Africa extending over three countries: Morocco, Algeria, and Tunisia, and cover a total area of about 800,000 km2. A characteristic feature of the Atlas Mountains are extensive cedar forests with unique species of trees and shrubs, including Cedrus atlantica, Festuca algeriensis Trab., Lonicera kabylica (Batt.) Rehder [15]. Besides, the ecoregion is rich in juniper Juniperus africana (Maire) H. del Villar and evergreen oak forests, Quercus afares Pomel [14]. The region of northern Algeria is rich in over 300 endemic taxa and the total number of taxa of elementary rank is 4000 [16]. A significant factor contributing to endemism is the climate in the Mediterranean basin: Altitude, large thermal amplitudes, west-east rainfall gradient. The geographical configuration, diverse topography and geology of this ecoregion enabled the creation of many microclimates and diverse habitats [17].
Plants of A. macrostachya were found only in two mountain ranges of the Atlas Mountains: The Aures and the Djurdjura Mountains (Table S1). The first region of the occurrence is the whole area of the Aures and Bellezma Mountains and the area of Djebel Chenntgouma, west of Kenchala. Eleven sites where A. macrostachya was found were located at an altitude of 1350–1800 m above sea level, with a strongly moist climate, where grasses and spiny cushion shrubs (e.g., Buplerum spinosum Gouan, Cytisus pungens Spreng.) dominated. The second region was the Djurdjura Mountains, where this oat grew on the meadows of Festuca sp. 15 sites where this species occurred were found at an altitude of 1350–1650 m above sea level. The distribution of A. macrostachya covered a much larger area than in Aureus and Bellezma [18]. In the Djurdjura Mountains, there is a large population of A. macrostachya within the national park. It seems that this species prefers open spaces, such as screes and rocky places, with precipitation >500 mm of annual rainfall and mean minimum temperature of the coldest month of −0.8 °C or lower [1].
Our knowledge of the species, its distribution and variability is very limited. There are 150 records in the Global Biodiversity Information Facility (GBIF) database on the biological resources of A. macrostachya [19]. It includes 82 herbarium specimens and 37 living accessions. A critical analysis of these data narrows the knowledge about the presence of A. macrostachya to around 30 sites (Table S1). The information on A. macrostachya accessions in the other databases is very limited. The FAO database has in its collection only 13 accessions, the majority of which are the accessions preserved in the long-term storage of the Plant Breeding and Acclimatization Institute in Poland (acquisition year 2003). Apart from that, the database contains single accessions of A. macrostachya from Hungary (1995 acquisition year), Canada (1990 acquisition year), and Great Britain (1985 acquisition year) [20].
A. macrostachya is a species attracting special interest of oat breeders as a distinct source of new genes for building resistance to biotic and abiotic stresses [21]. It has been used in some oat breeding programs in UK, USA, and Poland. A. macrostachya accessions survived even severe winters in Canada [2]. The results of Santos et al. [22] confirmed the expected influence of the species variation on improvement of the cultivated oat resistance to low temperatures and the SBMV virus. Transfer of winterhardiness from A. macrostachya is the main objective of the Polish interspecific crossing program aimed at increasing the area of winter oat cultivation [23]. Yu and Herrmann [24] reported introgression of powdery mildew resistance to A. sativa. Loskutov [25] listed other resistances potentially useful for breeders: To crown and stem rust, septoria blotch, helminthosporium blotch, myrothecium blotch, frit fly. Weibull [26] announced resistance to the aphid Rhopalosiphum padi L. Only a small part of the species variation has been applied in oat improvement and the interest of breeders in this source of new genes is increasing. Therefore, better recognition in the level of individuality and population structure of the accessions kept in gene bank collections is important for the future of oat breeding.
The main aim of this work was to determine genetic diversity and population structure of a unique collection of A. macrostachya preserved in the Polish gene bank of the Plant Breeding and Acclimatization Institute (IHAR)—National Research Institute, Radzików.

2. Materials and Methods
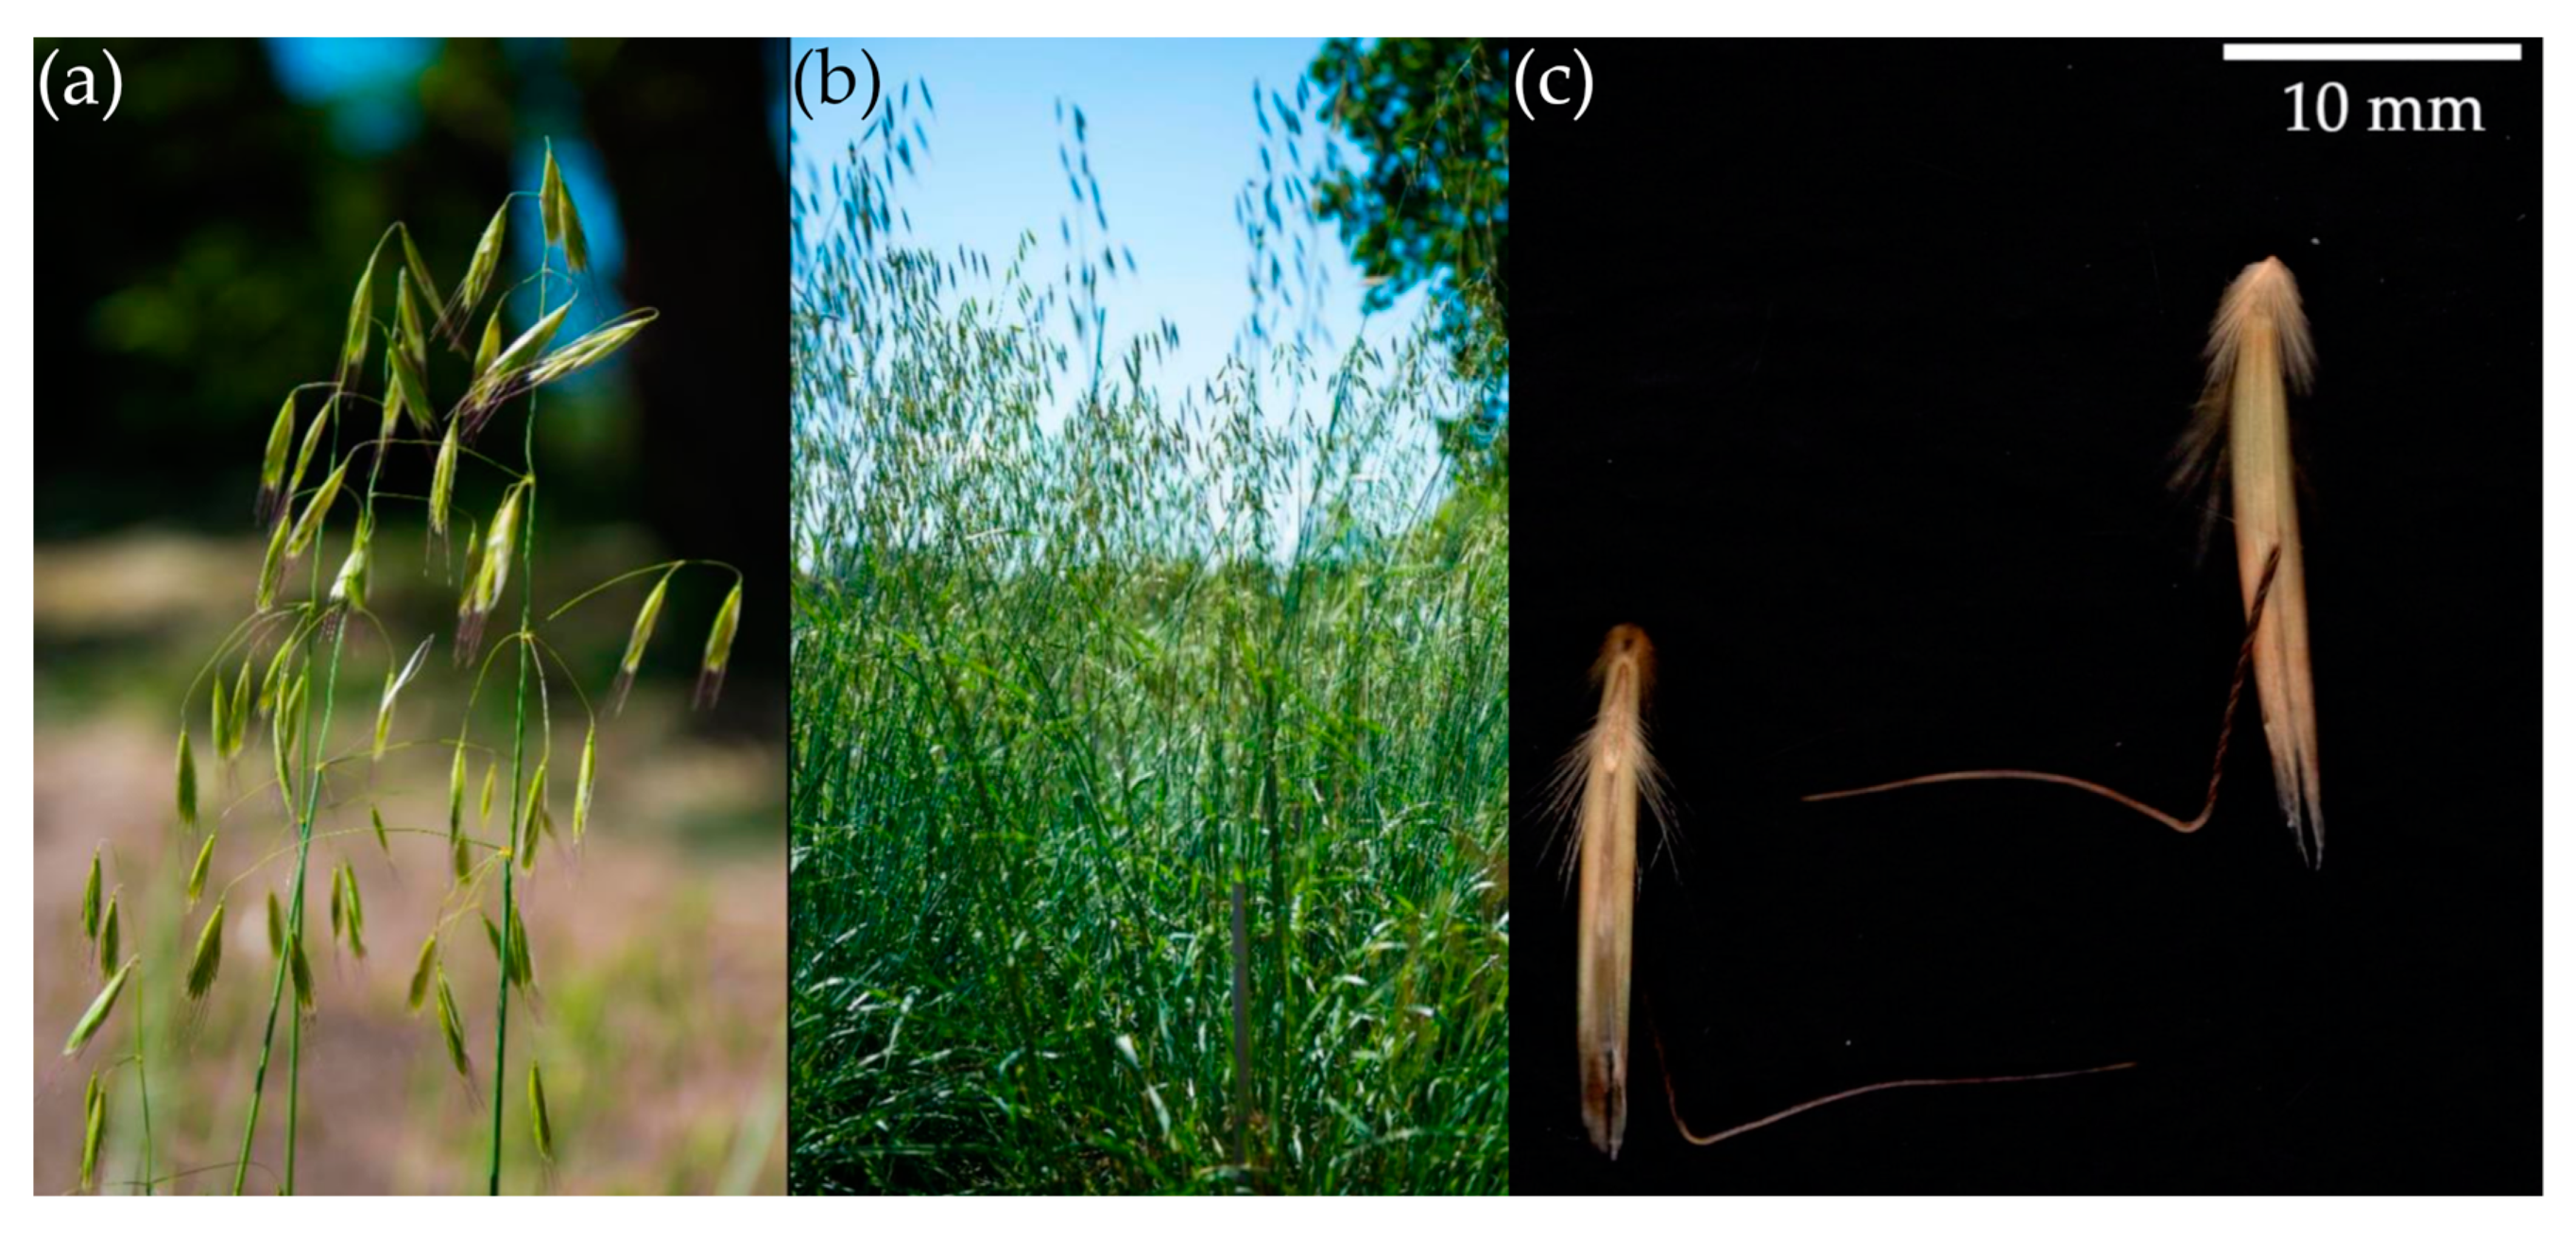
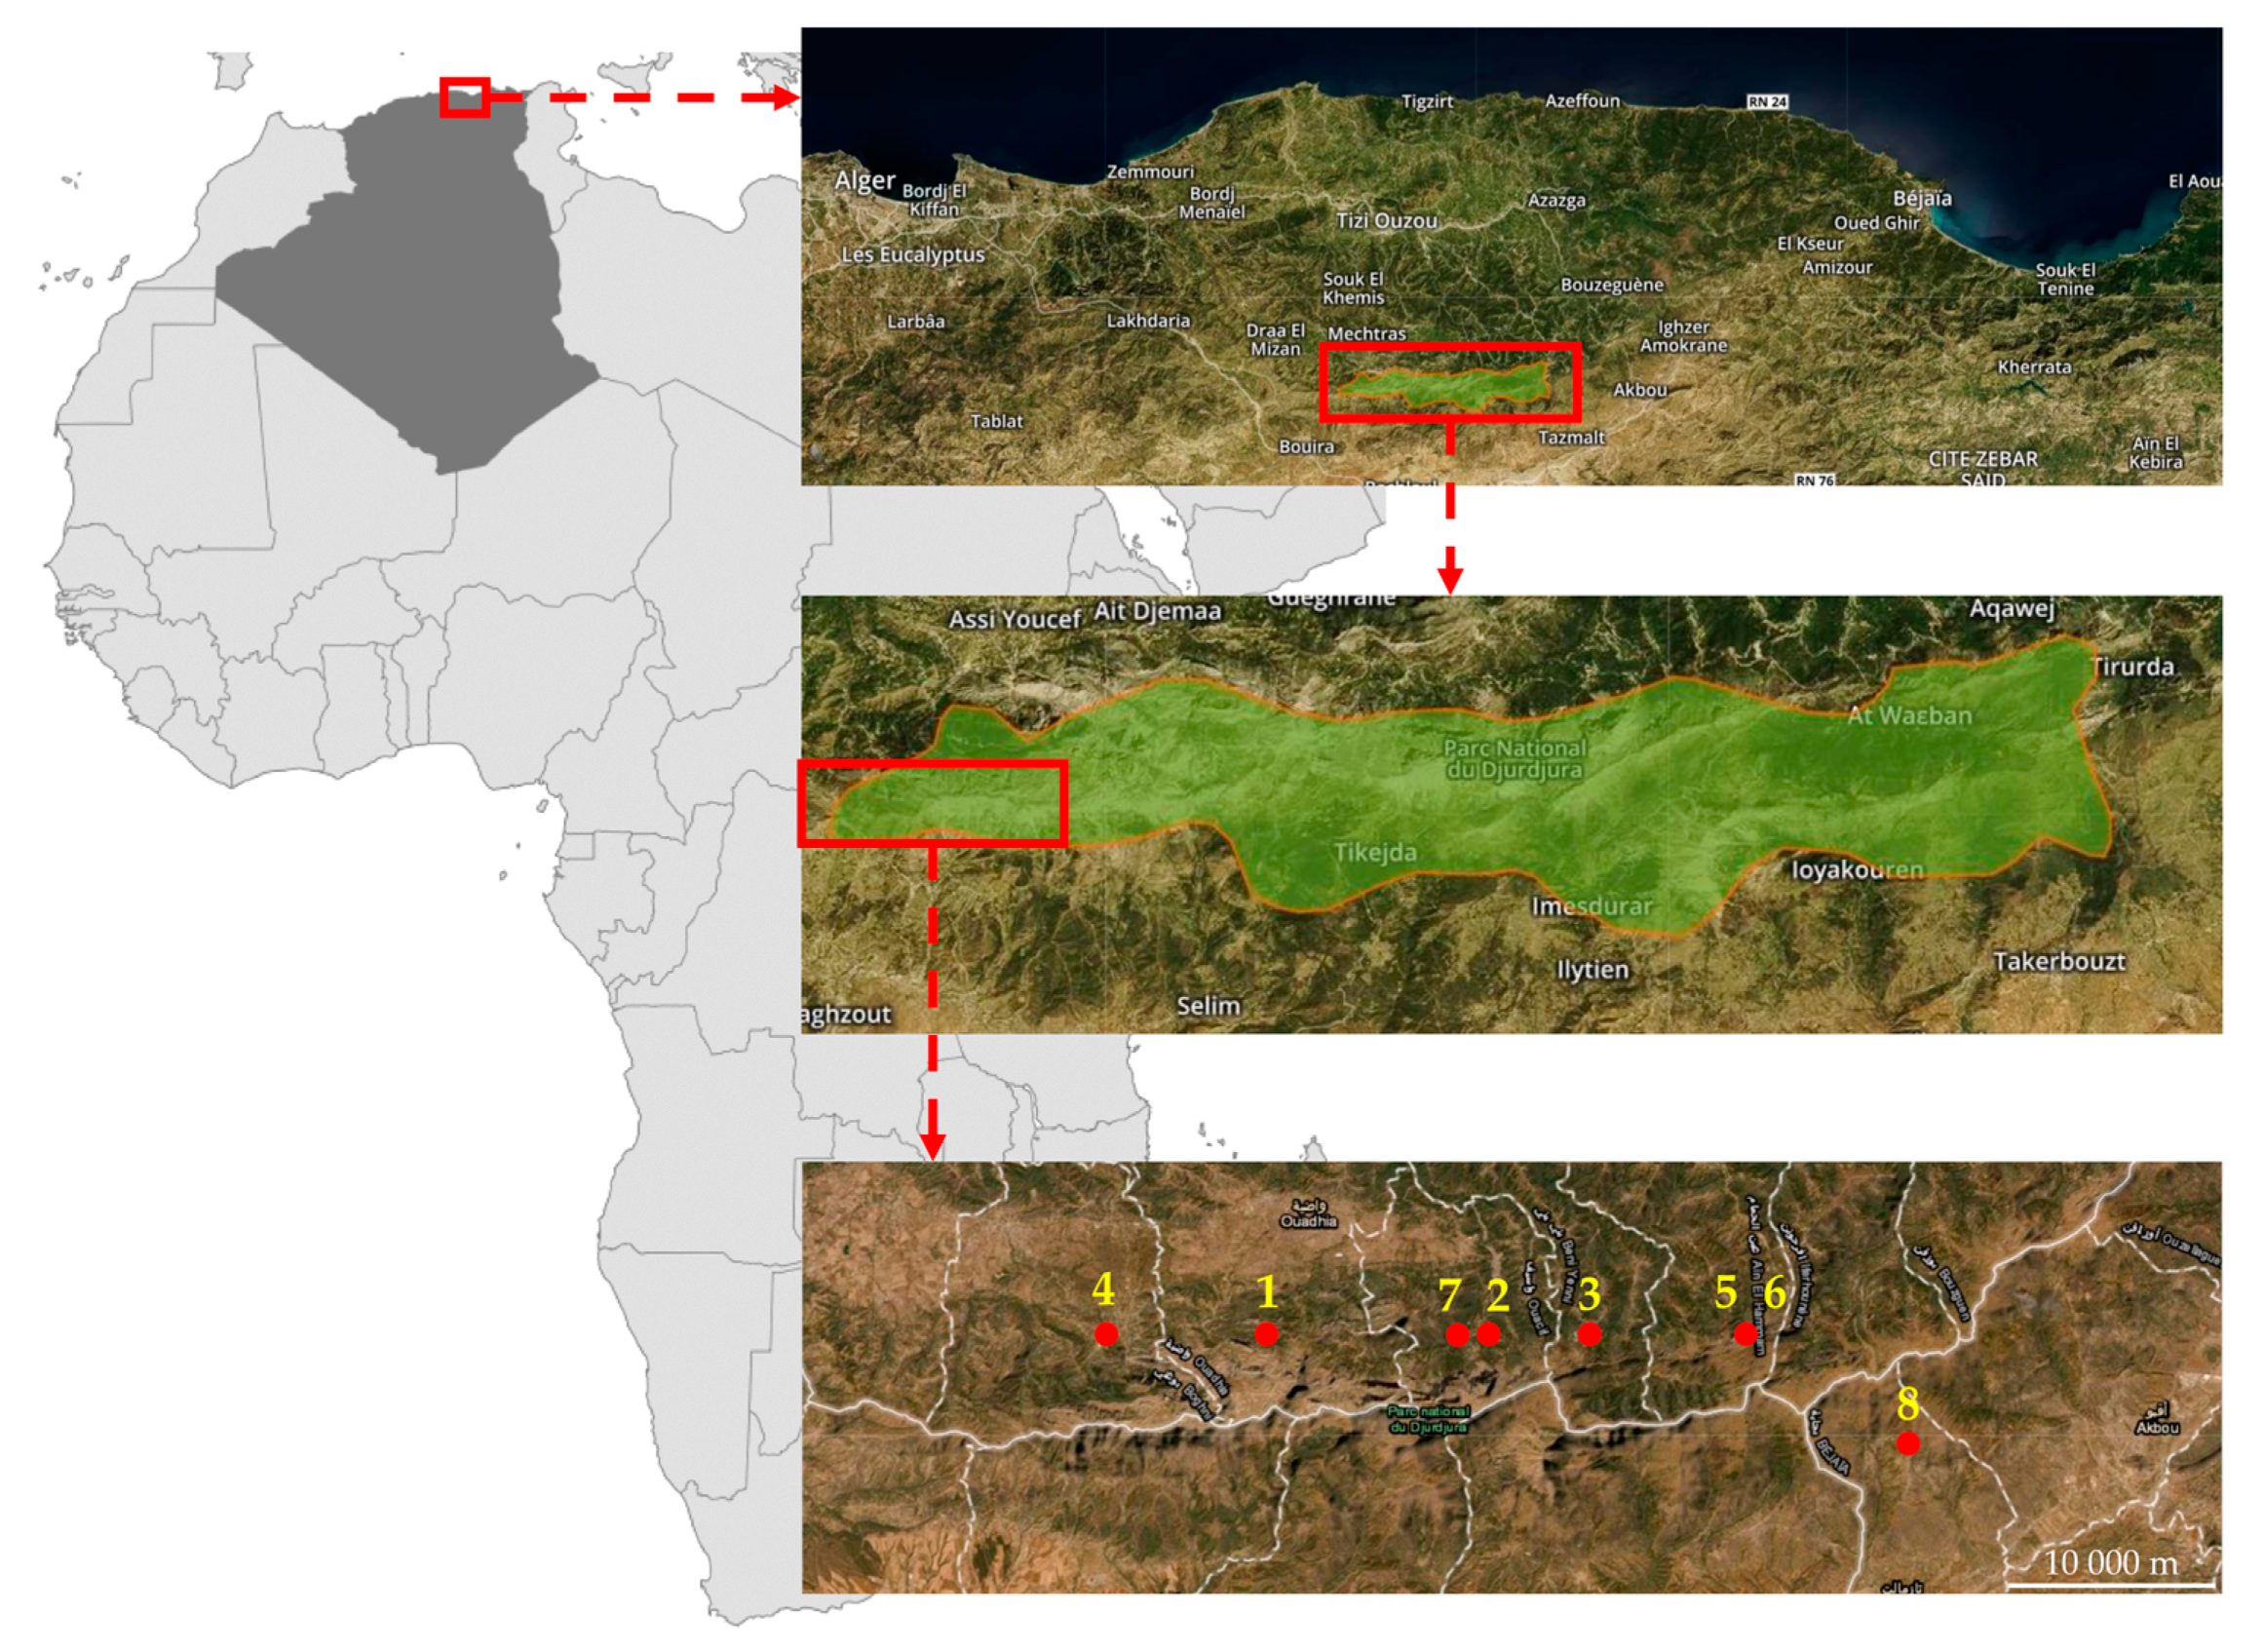
2.1. Plant Material

The plant material used for the study consisted of nine accessions of A. macrostachya preserved by the National Centre for Plant Genetic Resources (NCPGR) in Radzików (Polish gene bank) (Table 1). Six accessions were acquired by germplasm-collecting expedition carried out by The International Board for Plant Genetic Resources (IBPGR) and Institut National de la Recherche Agronomique de l’Algerie (INRAA) in 1988. One accession (PL 52409) was collected through the NCPGR expedition to Algeria in the year 1989. Another accession (PL 52410) was obtained from the Plant Gene Resources of Canada. The last accession (PL 52412) resulted from open-pollination of PL 52411 and PL 52409. Locations of collection sites of the tested accessions are indicated in Figure 2.
The history of maintenance of the accessions is well known, i.e., PL 52403–PL 52409 are first generation of originally collected seed material. PL 52410 is a descendant of seven clumps survived where 30 clones were established. Fifty seeds were received from Plant Gene Resources of Canada (PGRC). Other samples were small and a low number of seedlings were produced in the laboratory. All examined accessions have been preserved in long-term storage and multiplied on multiyear plots with spatial isolation. Morphologically and phenologically all accessions are very uniform.
According to Table 1 and geographical coordinates of collection sites distribution area of evaluated accessions covers 257 km2 (5.55 km SN; 46.25 km WE) (Figure 2).

2.2. DNA Isolation

Genetic analysis was performed on 64 individuals representing nine accessions. The plant material was collected as young, healthy leaves picked separately from 64 plants. The tissue, immediately after collection, was frozen in liquid nitrogen and further stored in a deep freezer at −80 °C. Before isolation, the tissue was freeze-dried and ground in a bead mill. DNA isolation was carried out using the Genomic Mini Ax Plant kit (A&A Biotechnology, Gdynia, Poland) according to the manufacturer’s protocol. A pellet was resuspended in 100 µL of 10 mM Tris-HCl. DNA quality was evaluated using electrophoresis on 1.5% (w/v) agarose gel. Concentration and purity were determined spectrometrically (NanoDrop Spectrophotometer ND-1000, NanoDrop Technologies, Willmington, DA, USA). DNA was diluted in 10 mM Tris-HCl to a working concentration of 25 ng/µL.

2.3. SRAP Analysis

A total of 64 combinations of sequence-related amplified polymorphism (SRAP) primer pairs published by Budak et al. [27] were tested in preliminary studies. The eight best combinations were selected for further analysis (Table 2). PCR amplification was carried out in 25 μL volume of a mixture containing 50 ng DNA, 0.2 u Walk DNA Polymerase (A&A Biotechnology, Gdynia, Poland), 1× reaction buffer (containing 100 mM KCl, 100 mM (NH4)2SO4, 200 mM Tris-HCl pH 8.5, 20 mM MgSO4, 1% Triton X-100), 120 μM of each dNTP and 0.5 μM of each primer (Table 3). Forward primers were labeled with fluorescent dyes on the 5′ end (Thermo Fisher, Waltham, MA, USA). The reaction was performed using Verity 96 Thermal Cycler (Applied Biosystems, Foster City, CA, USA under the following temperature profile: 3 min. at 94 °C of initial denaturation, followed by five cycles each one including 1 min at 94 °C, 1 min at 35 °C and 1 min at 72 °C, followed by 35 cycles each one including 1 min at 94 °C, 1 min at 55 °C and 2 min at 72 °C, and the final extension for 10 min at 72 °C. PCR products were separated using capillary sequencer Genetic Analyzer 3130XL (Applied Biosystems, Foster City, CA, USA). The 36 cm capillary array field with NanoPOP7 (Nimagen, Nijmegen, The Netherlands) was used. The length of fragments was assessed against the GeneScan 1200 LIZ Size Standard (Applied Biosystem, Foster City, CA, USA). Each PCR reaction and fragment analysis were tripled. Only repeatable fragments were scored.

2.4. Data Analysis

Raw data were transformed into a binary matrix where 0 indicated absence and 1 presence of fragment using GeneMapper™ Software v4.1 (Applied Biosystem).
The polymorphism information content (PIC) coefficient for each marker was estimated using the following formula:
PIC = 1 i = 1 n p i 2
where i is the ith allele of the jth marker, n is the number of alleles of the jth marker and p is an allele frequency. Unbiased genetic diversity (uHe) between accessions was estimated as follows:
uH e = n n 1 ( 1 i = 1 n p i 2 )
where n is the sample size and pi is the frequency of the ith marker. The significance of differences was tested using ANOVA and post-hoc Tukey’s HSD test.
XLSTAT Ecology (Addinsoft, Inc., Brooklyn, NY, USA) software was used to calculate the genetic distance based on the Jaccard coefficient and to perform the Principal Coordinate Analysis (PCoA). GenAlEx 6.501 software was used to perform a hierarchical analysis of molecular variance (AMOVA) [28,29]. STRUCTURE 2.3.4 software was used to determine population structure [30]. The number of group (K) values was set from 1 to 10, with ten independent runs for each K (50,000 burn-ins and 250,000 Markov Chain Monte Carlo generations) and an admixture model with correlated allele frequencies was used. The CLUMPAK software was used to identify the number of real groups in data (K). The optimal value of K was determined based on the a posteriori probability of data for a given K and ΔK using the full search algorithm to obtain the best alignment of the cluster analysis [31,32]. The raw supplementary data are available at https://osf.io/h3erq/.

3. Results

3.1. Marker Informativeness

The results of marker informativeness analysis showed an average number of obtained fragments about 100. The highest number, i.e., 113, was observed for the Me1/Em4 primers combination. The average polymorphism oscillated at the level of almost 70%, the highest, i.e., 81%, was observed for the pair of Me2/Em3 primers. PIC value oscillated on average at the level of 0.227, the highest value was also found for the pair of Me2/Em3 primers (0.270). More details are shown in Table 4.

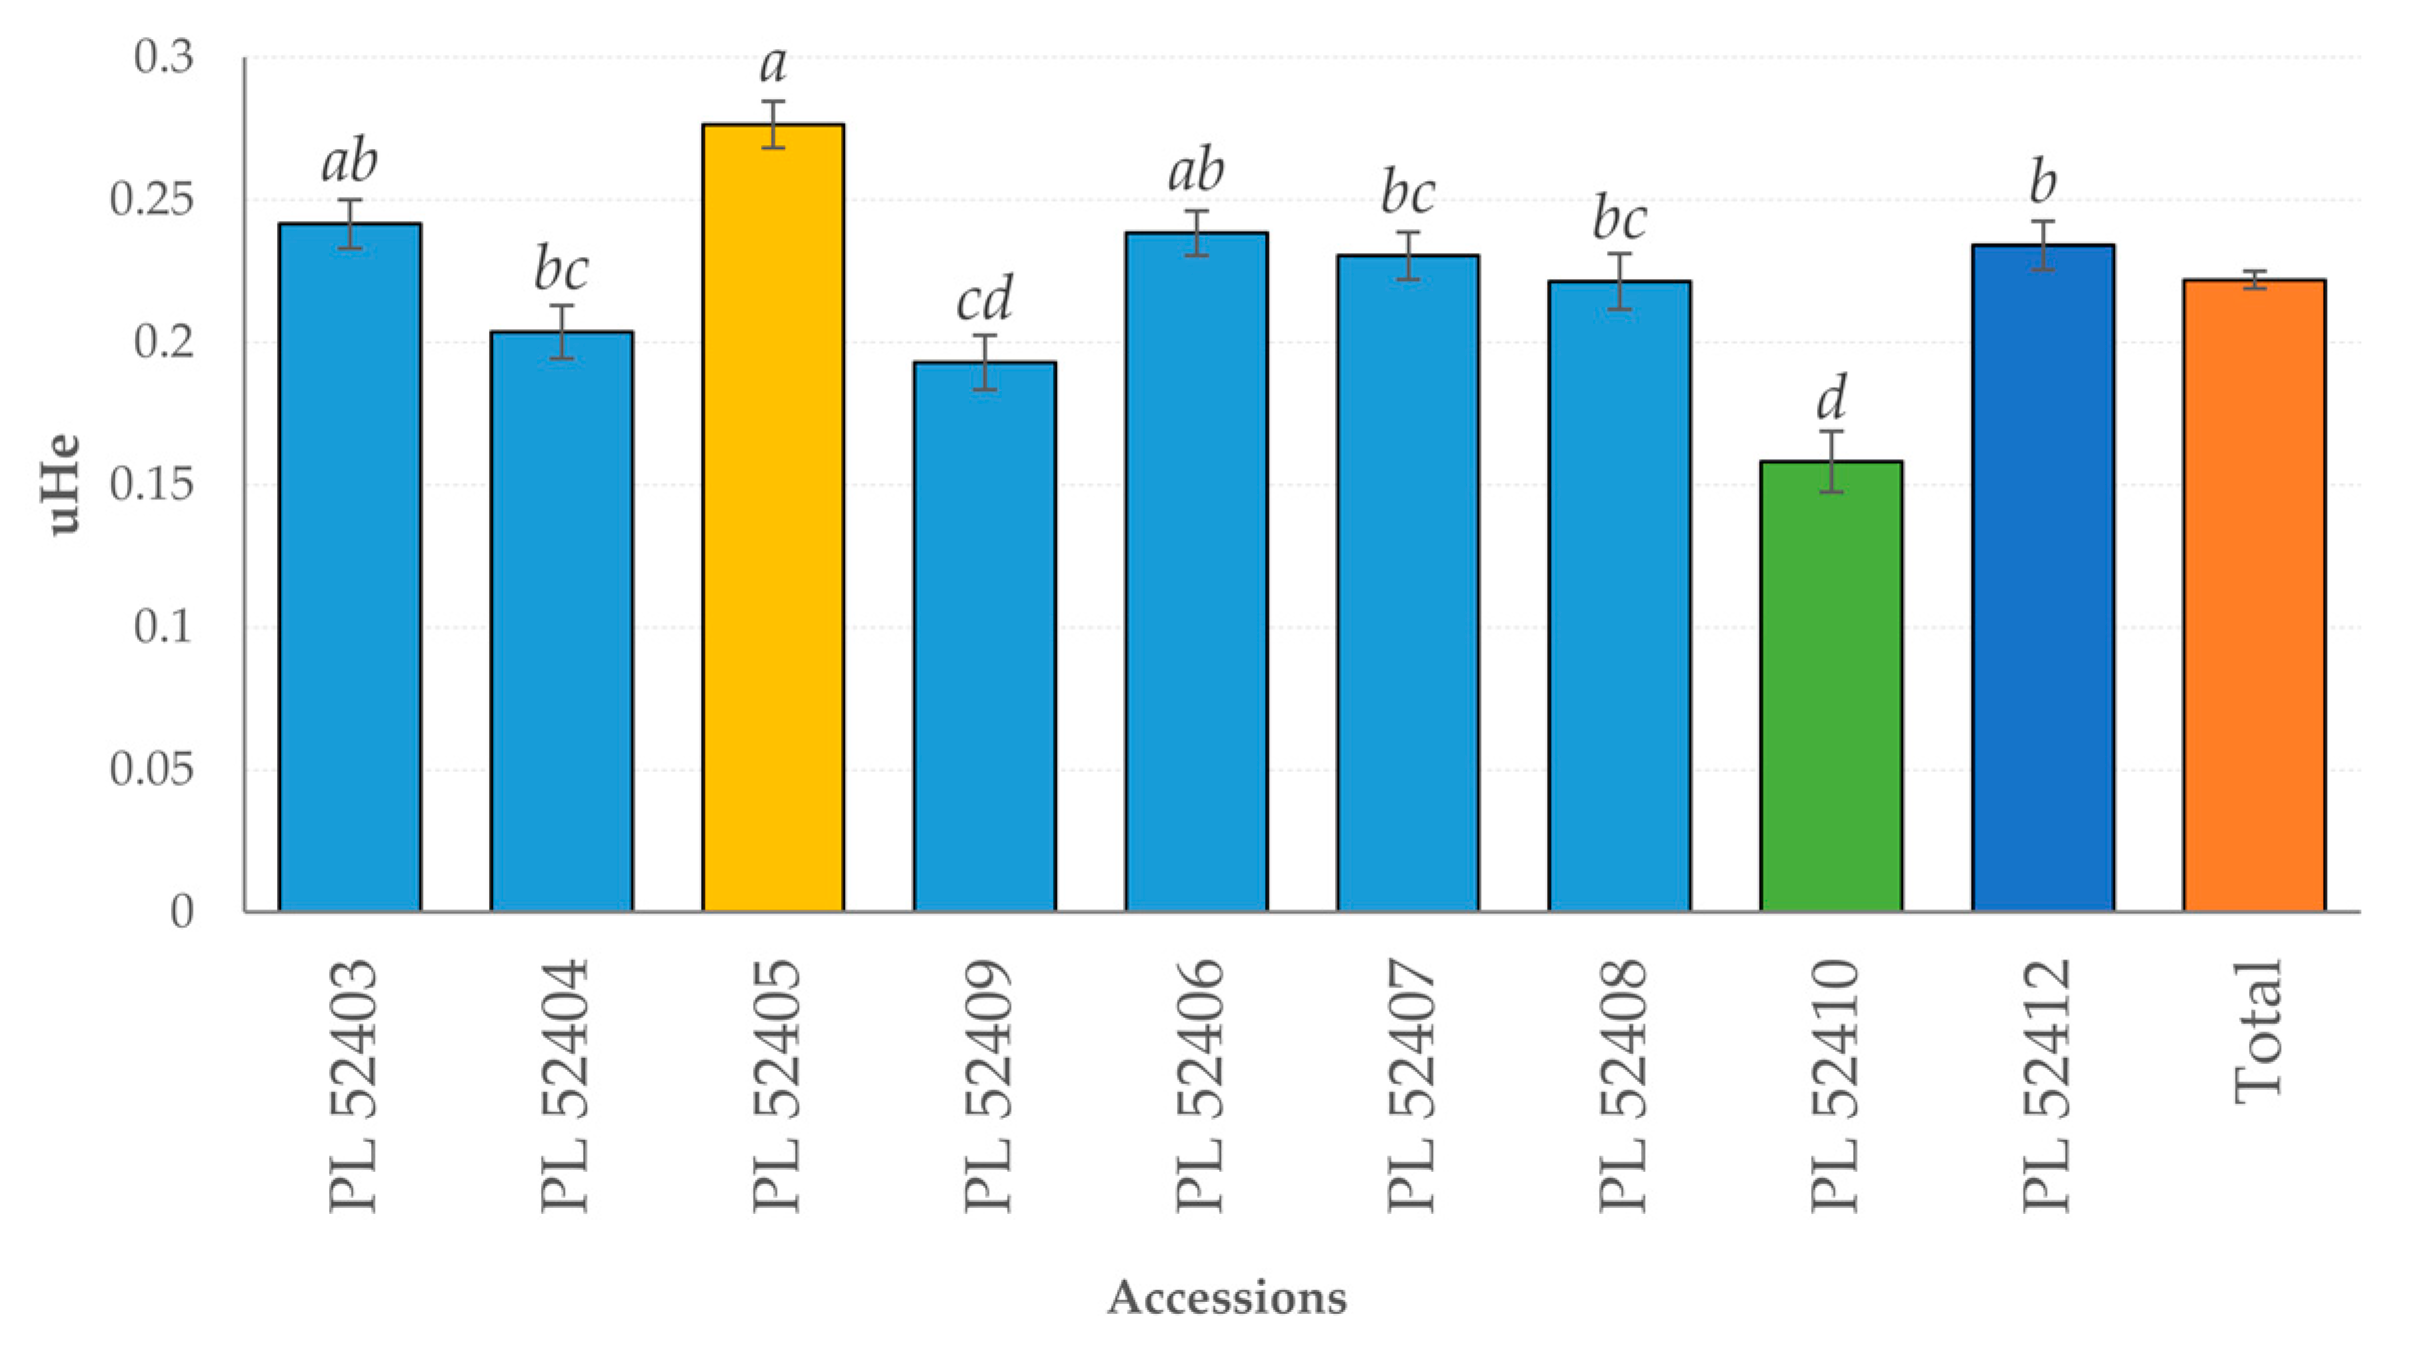
3.2. Genetic Diversity

The value of the genetic diversity coefficient (uHe) within the studied collection was 0.227. The highest diversity appeared in PL 52405 (0.276) and the lowest in PL 52410 (0.158) (Figure 3).

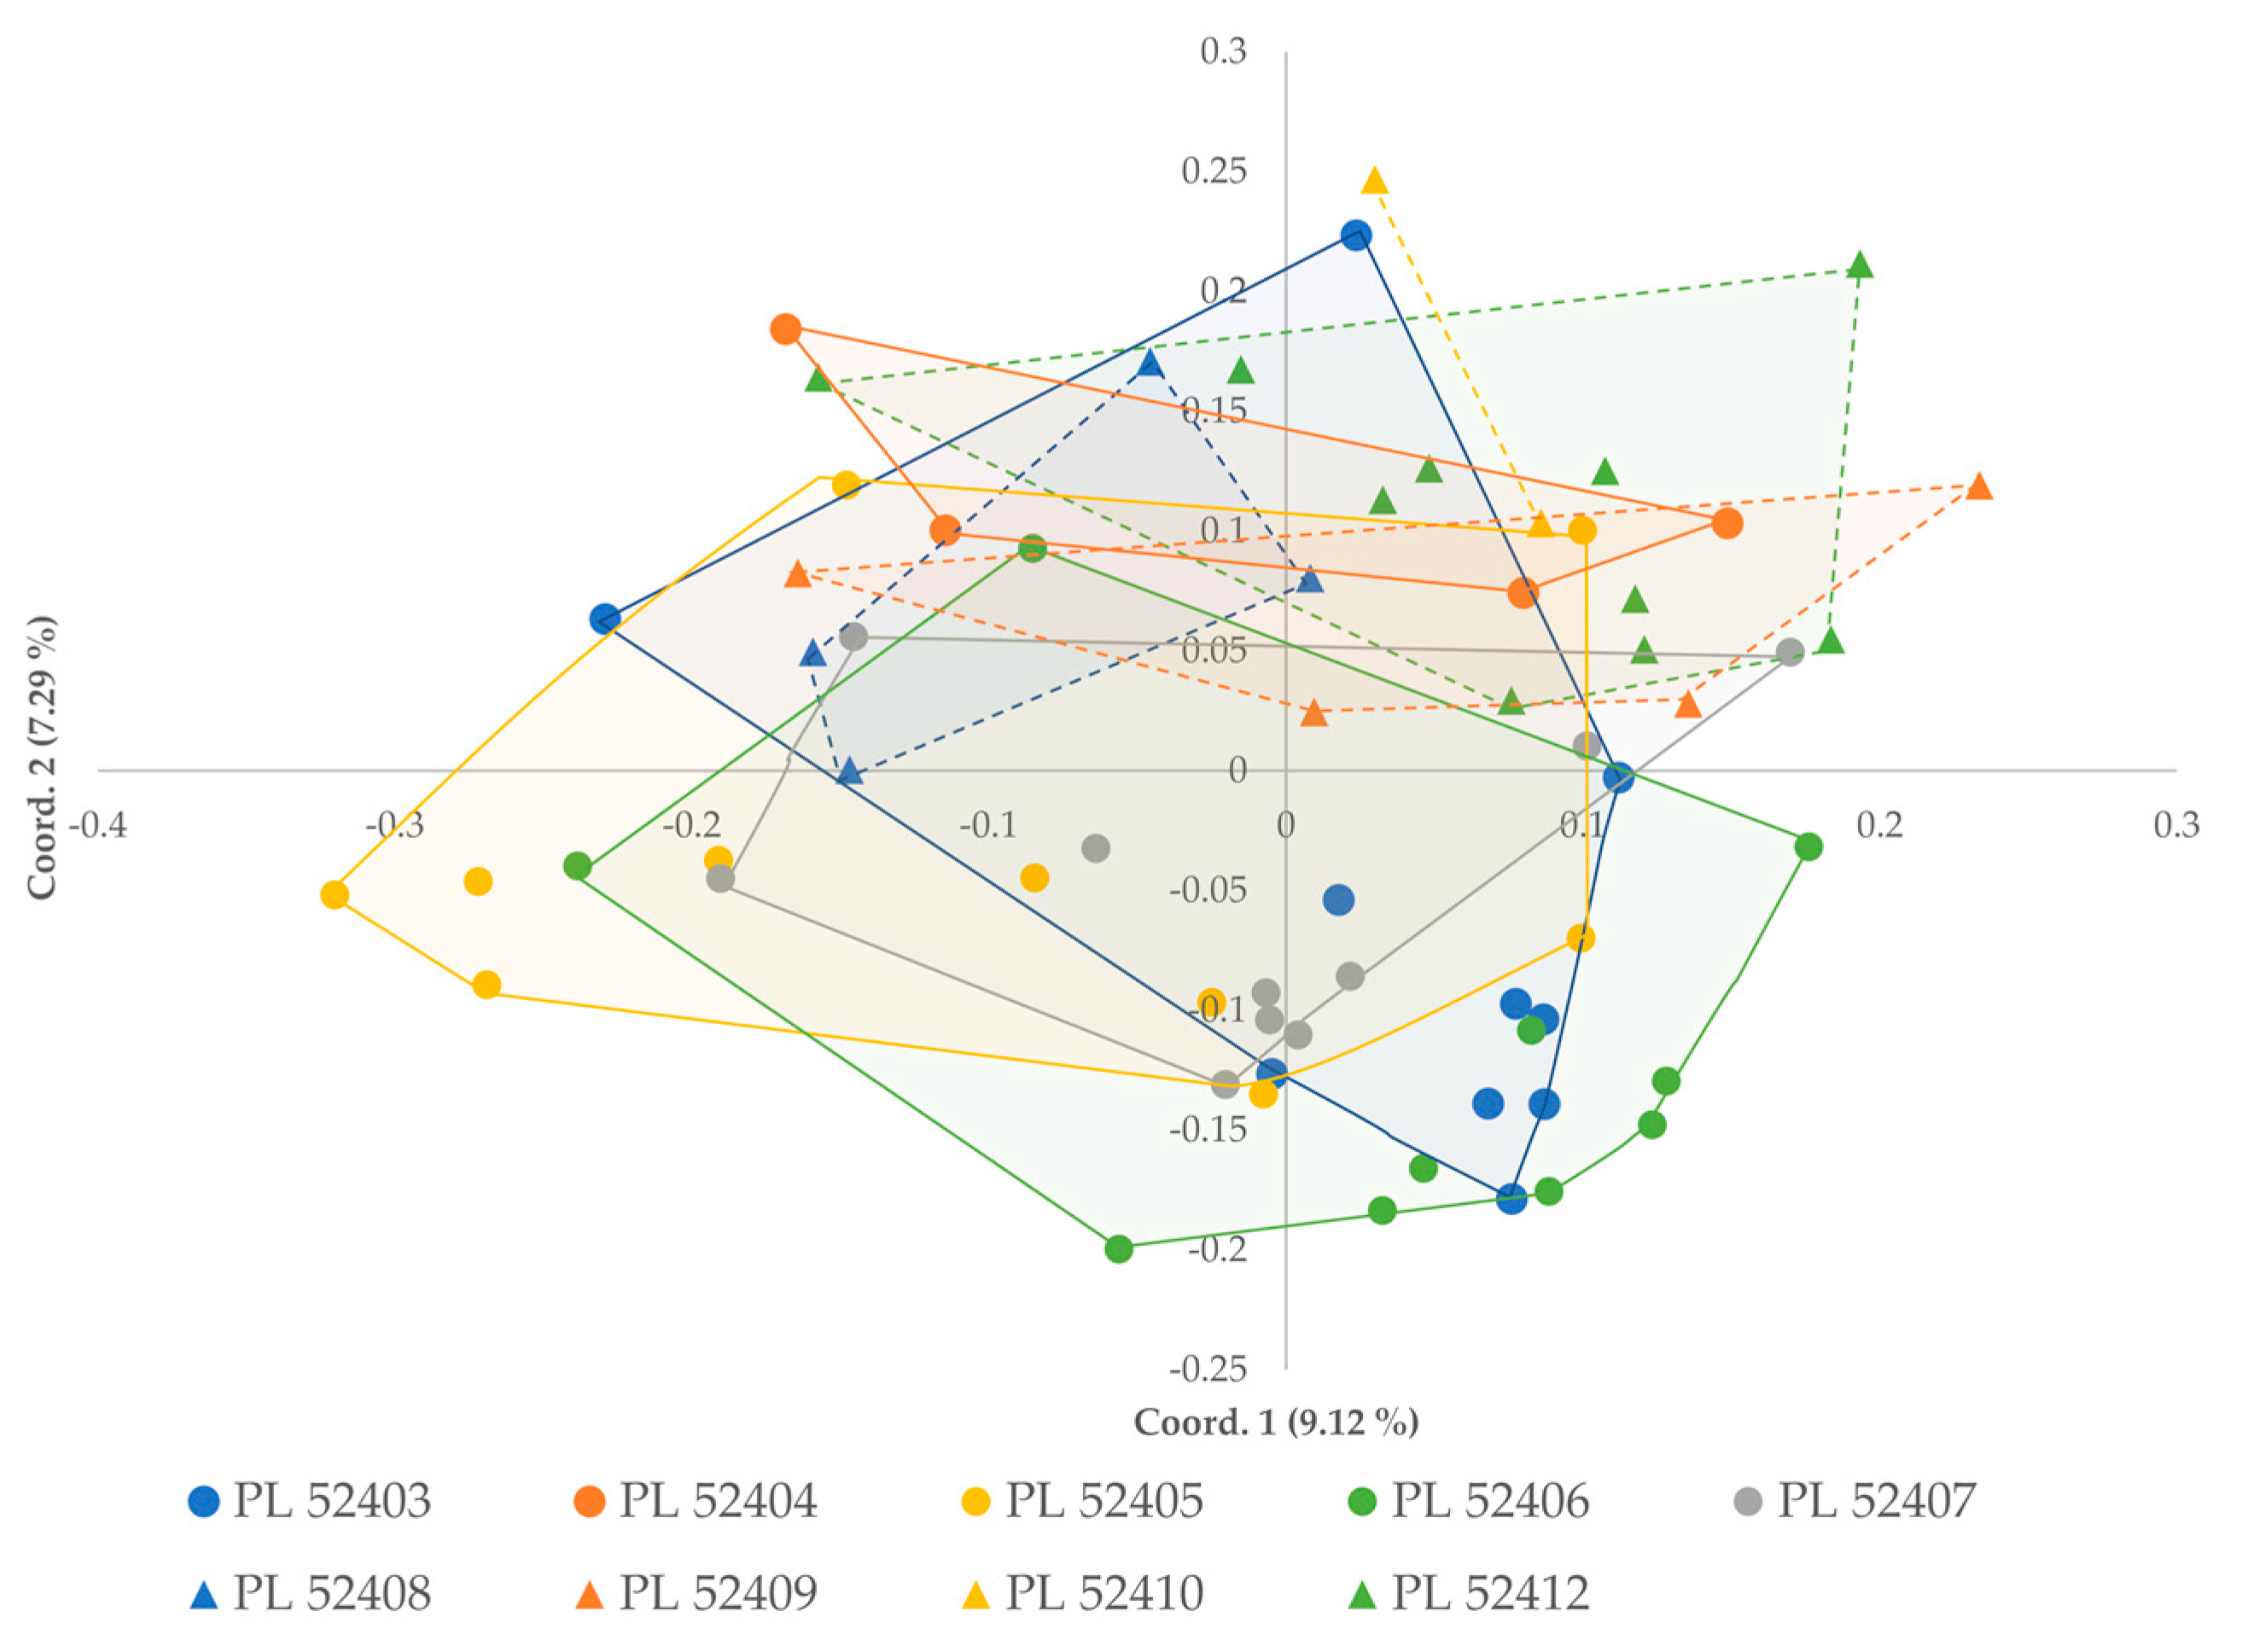
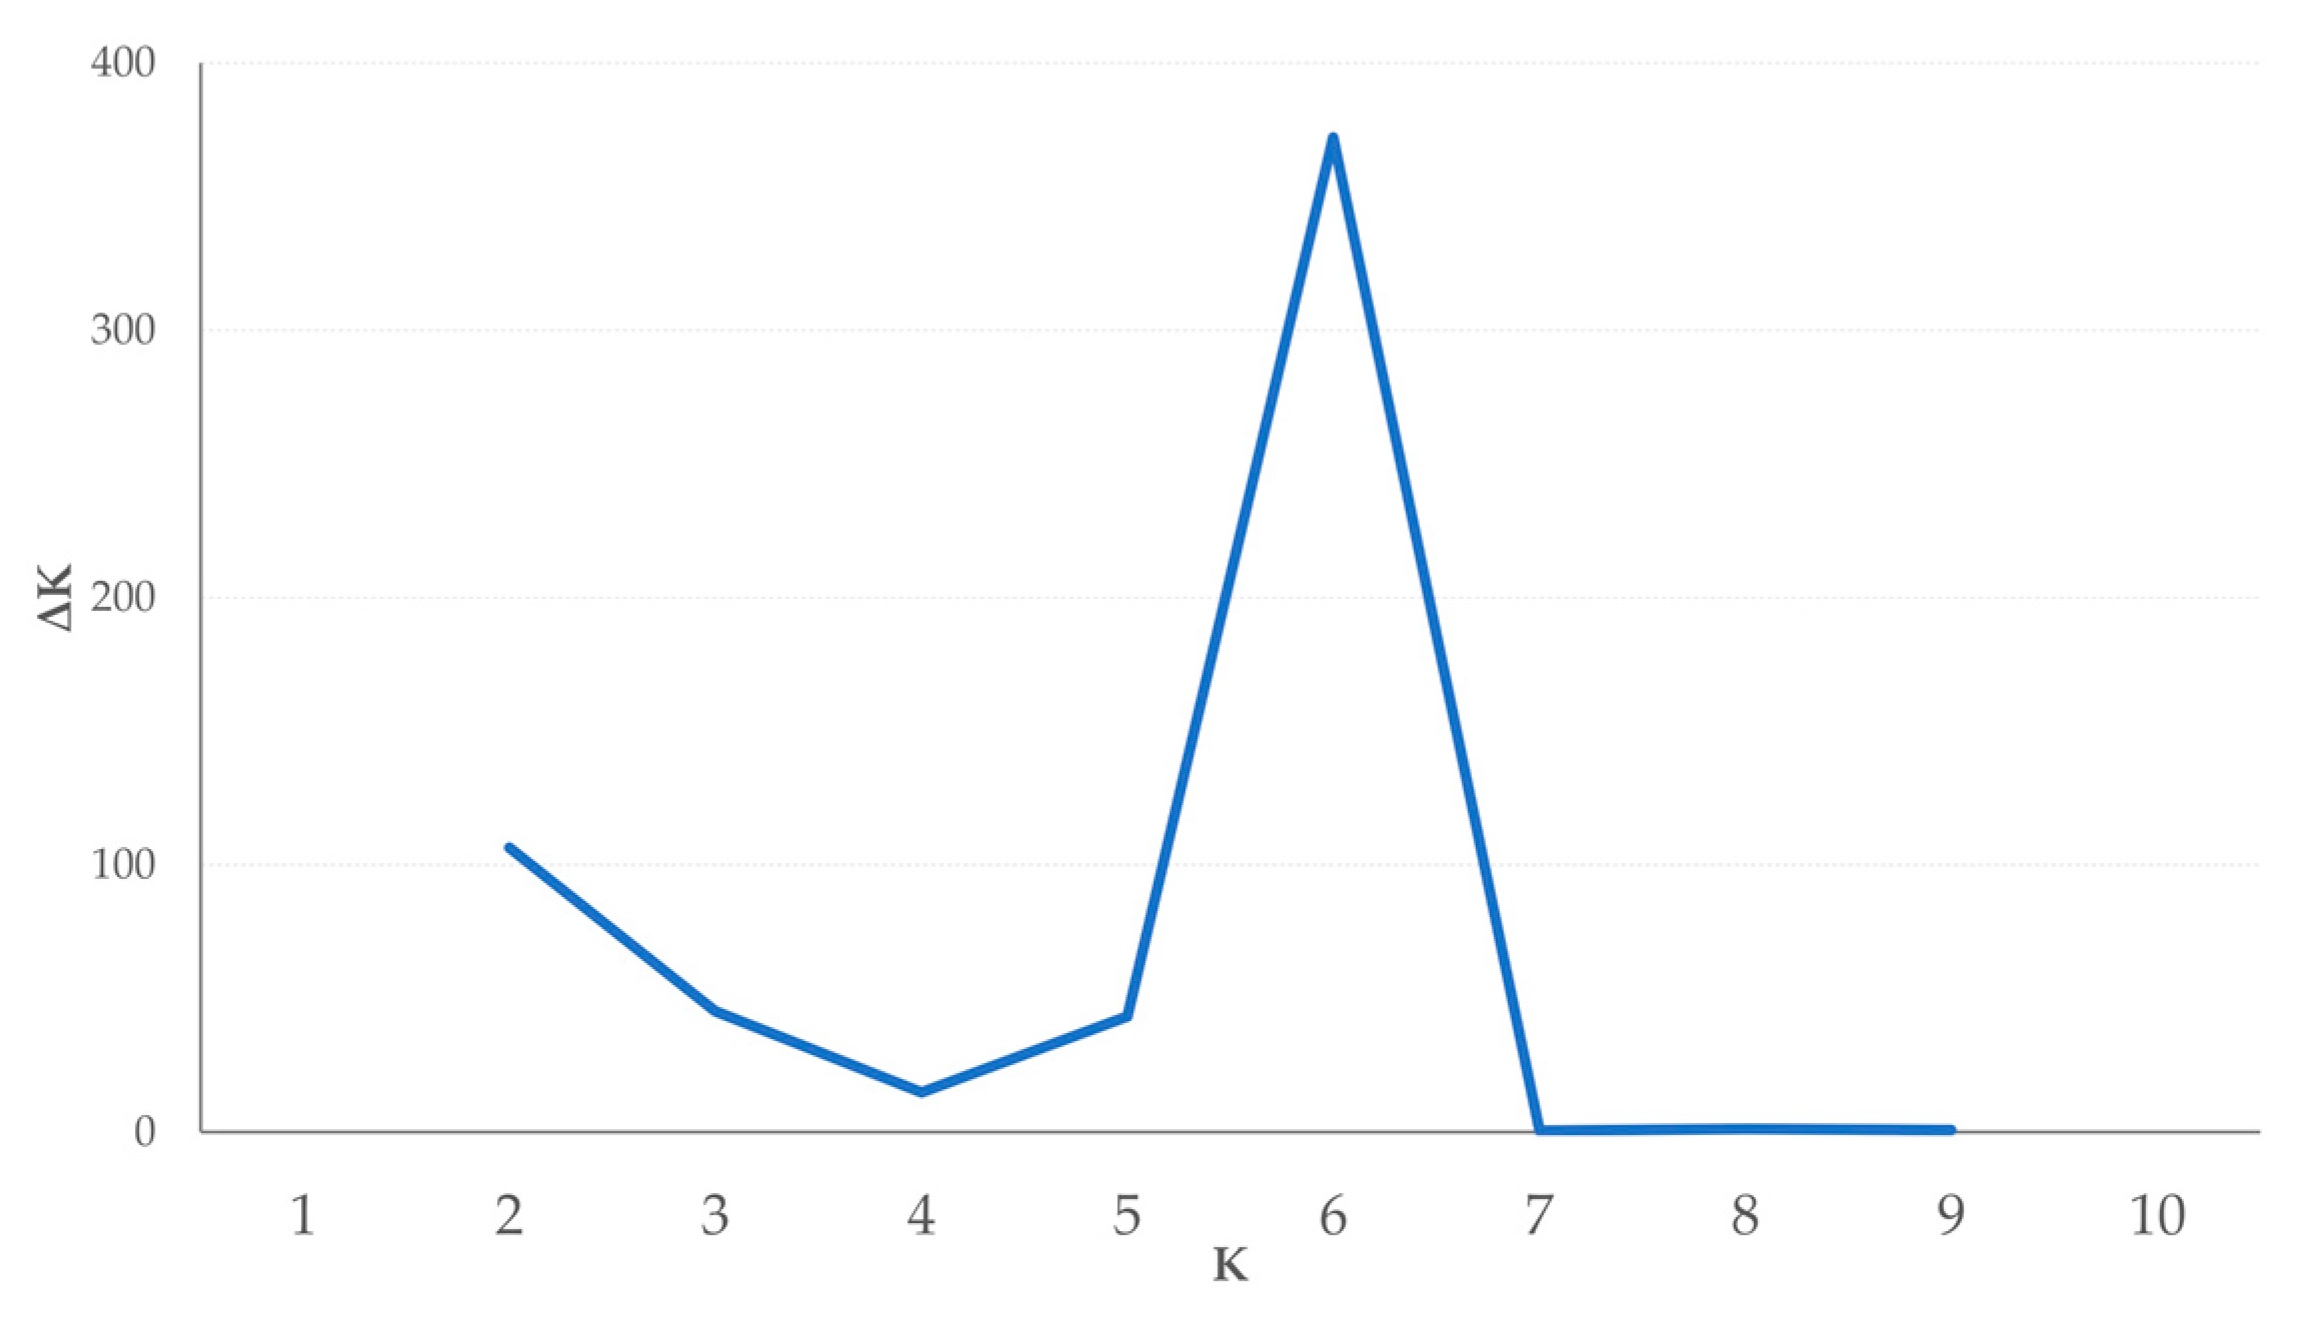
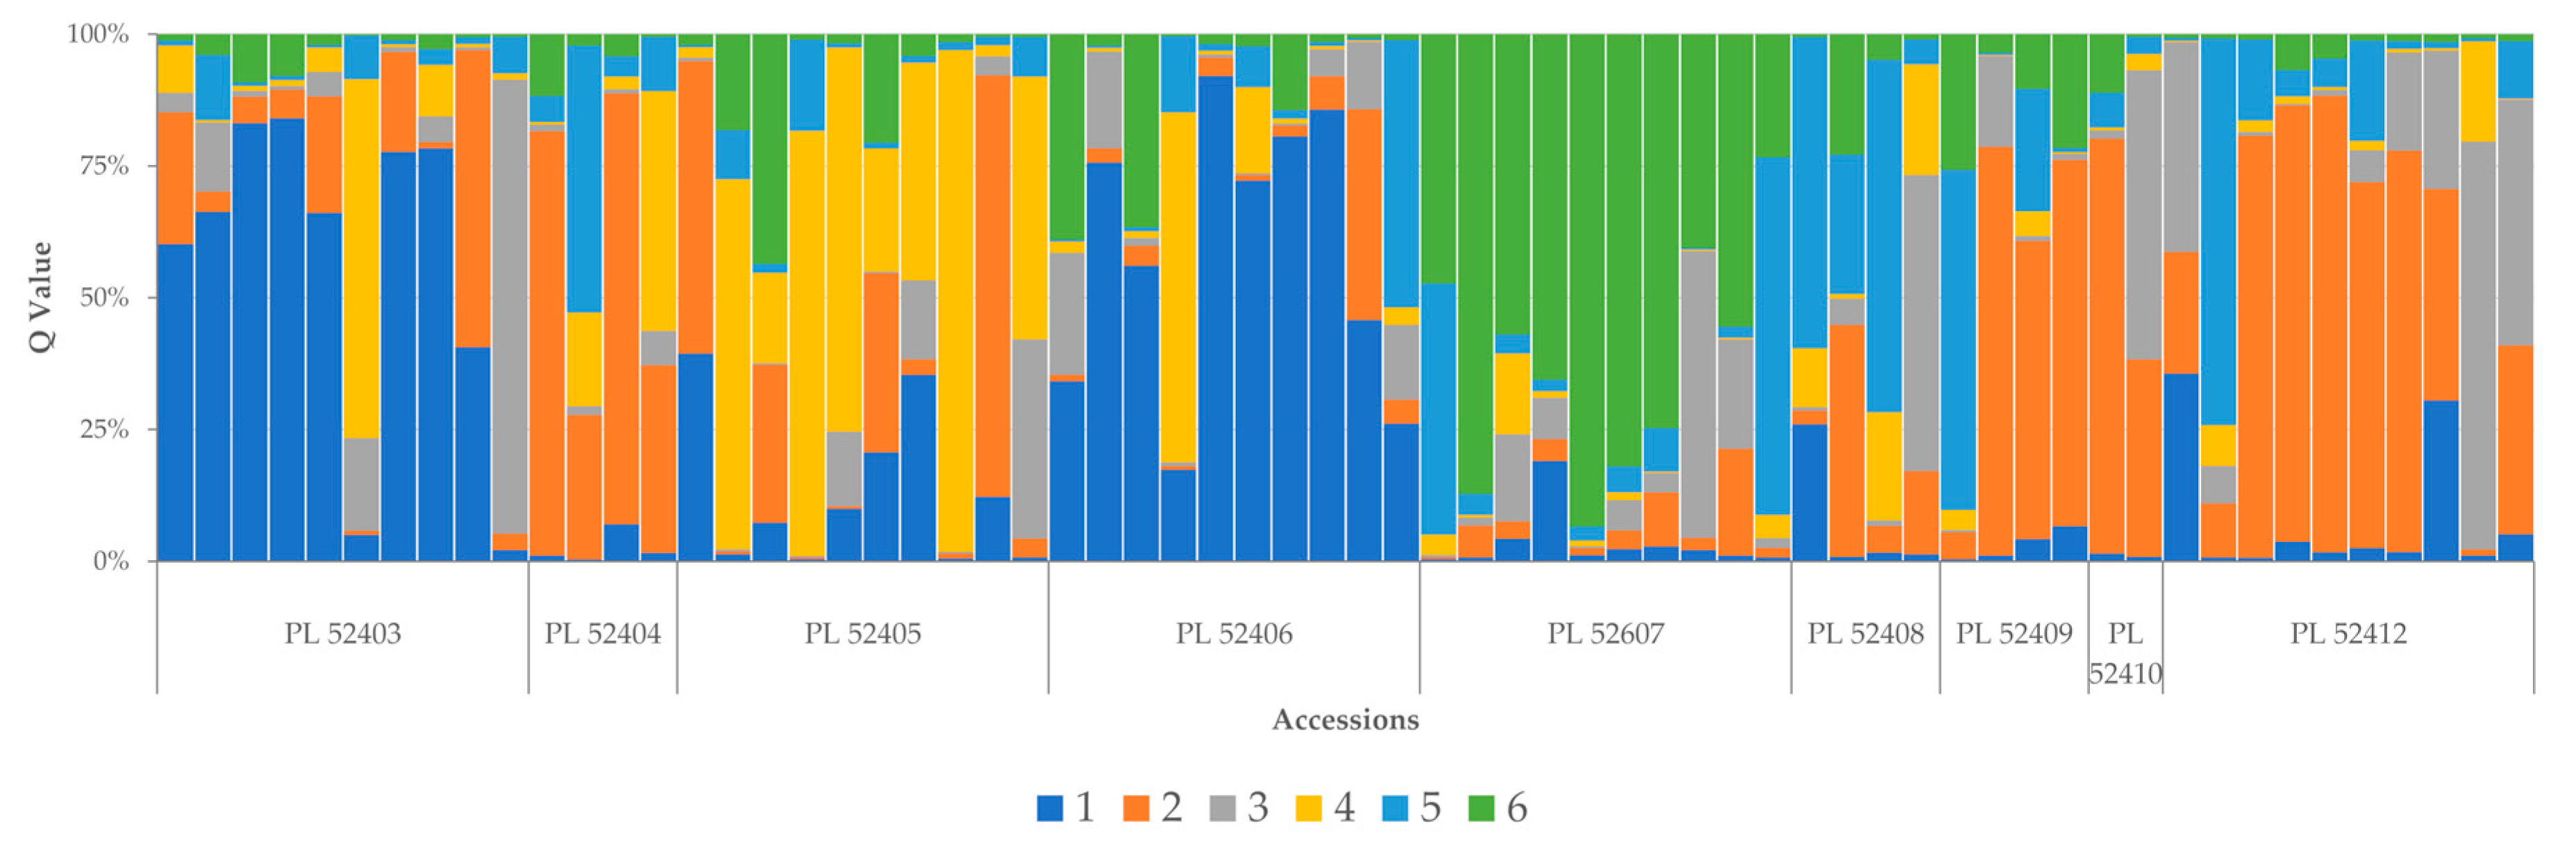
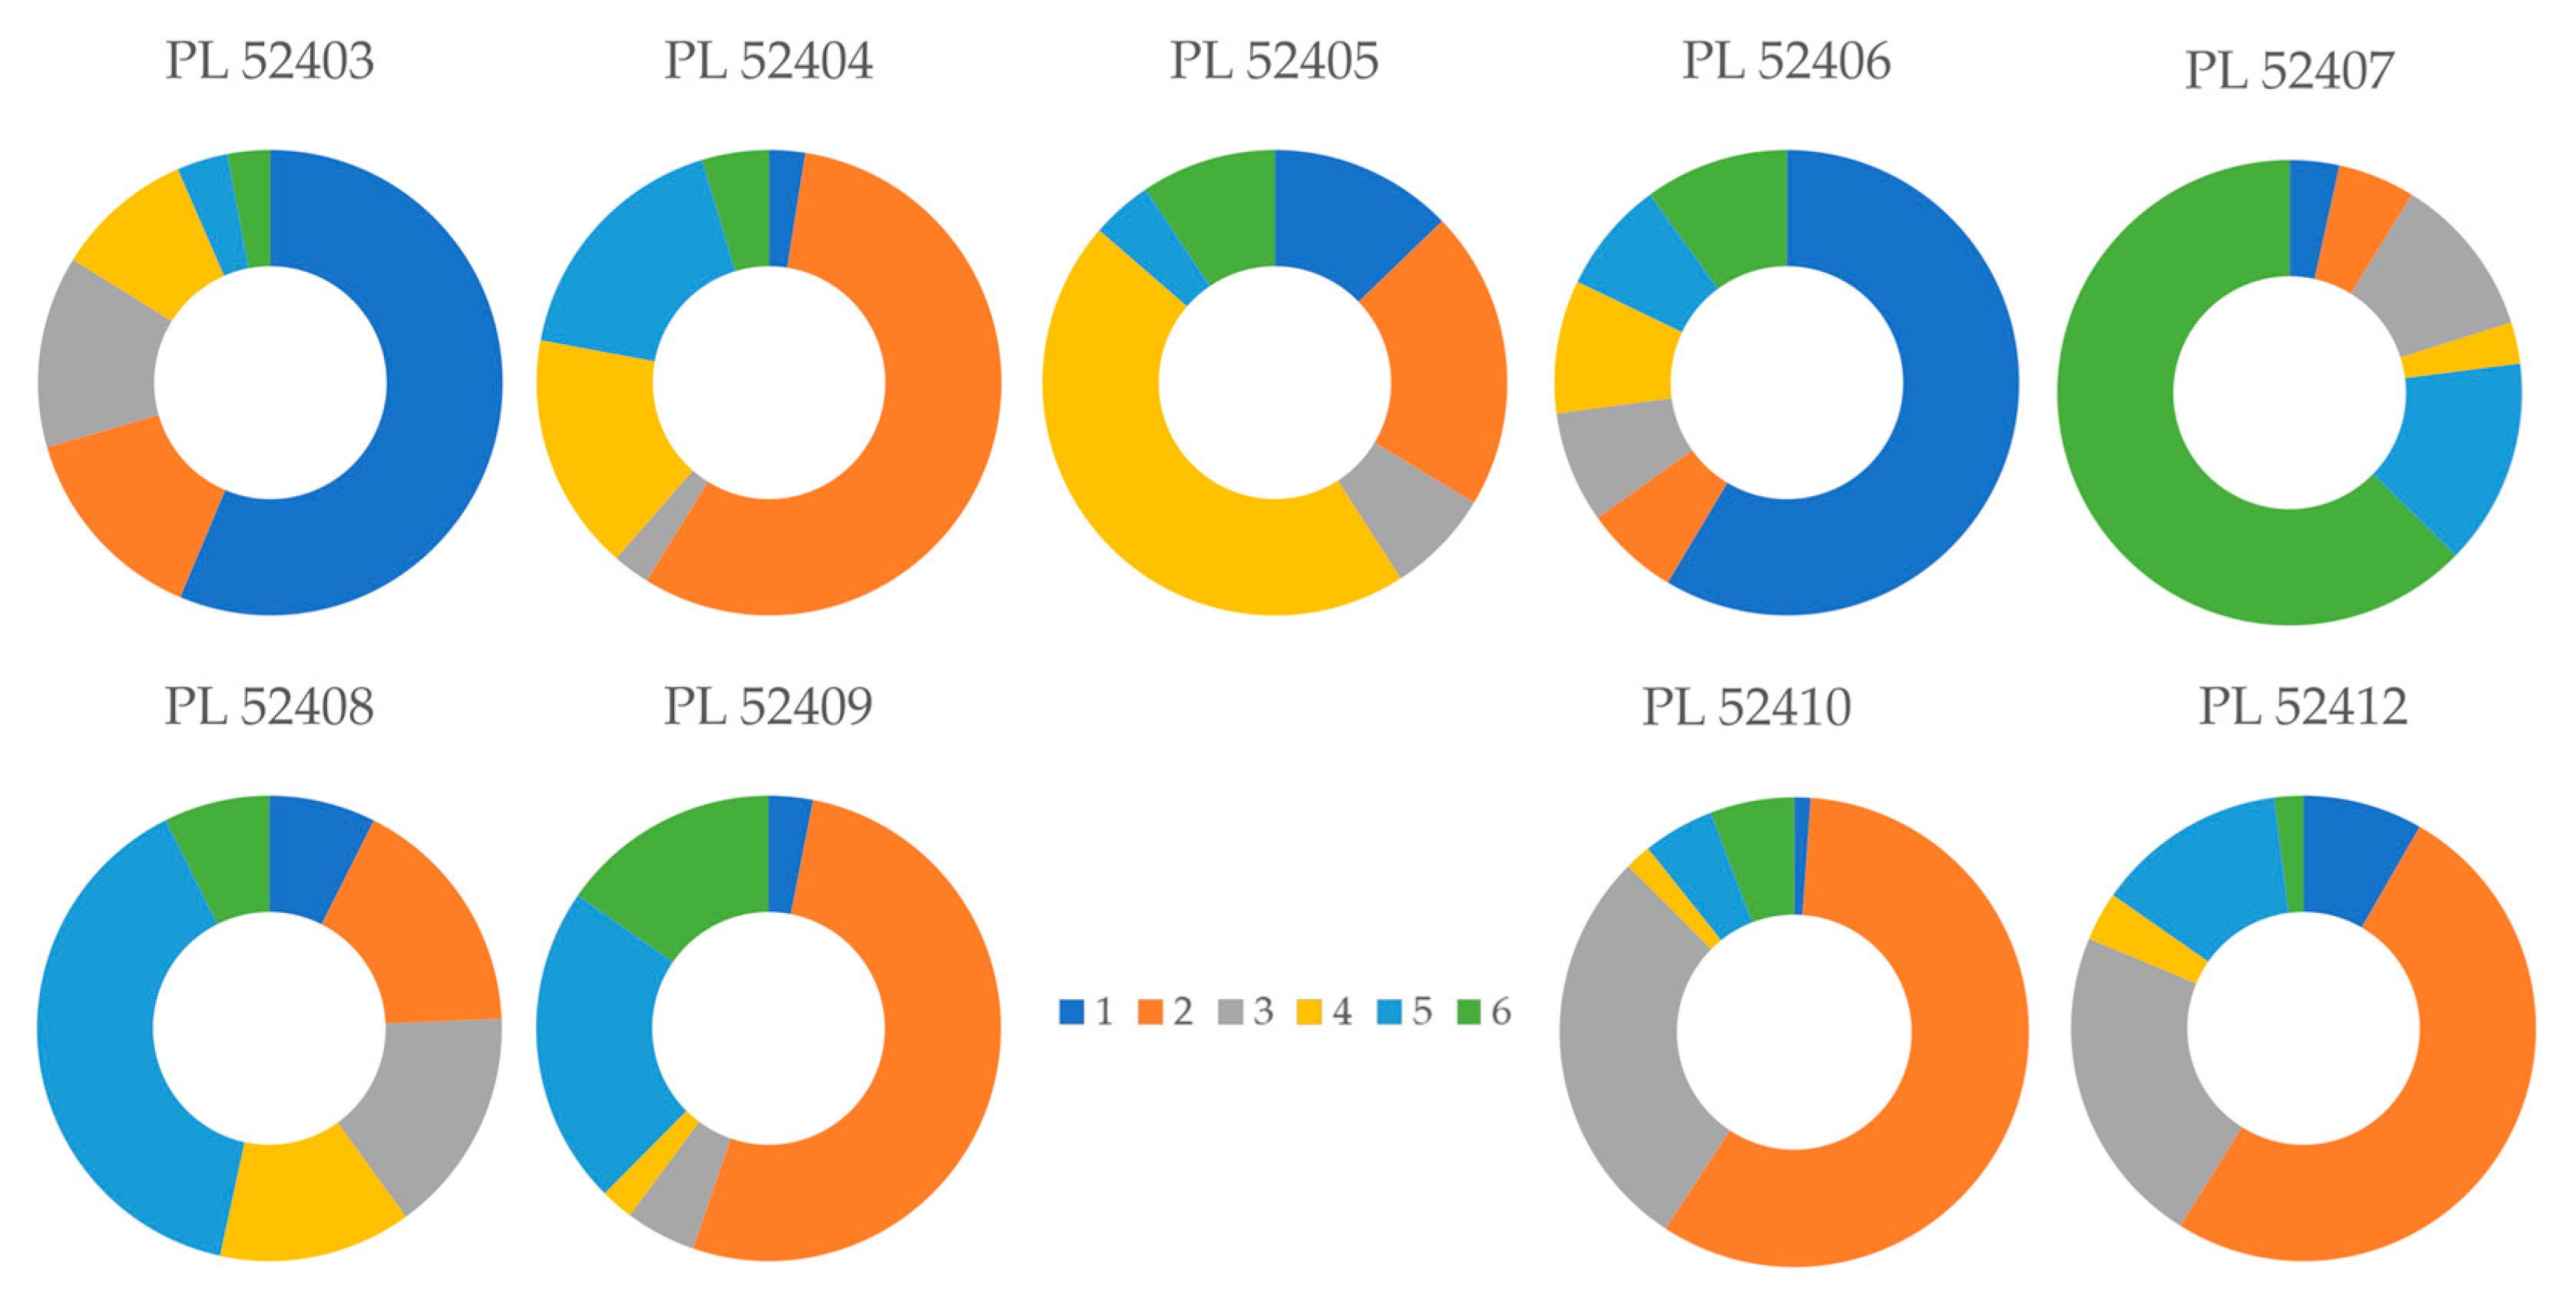
3.3. Population Structure

To examine the relationships of A. macrostachya individuals, PCoA was performed. The first coordinate (Coord. 1), second coordinate (Coord. 2), and third coordinate (Coord. 3) explained 9.12%, 7.29%, and 6.64% of the observed variation, respectively. The gradual overlapping of gene pools of all accessions was clear (Figure 4). This result is highly consistent with the AMOVA for nine accessions, where 90% of the genetic variation was found among individuals, whereas 10% of the genetic variation was found among accessions (ΦPT = 0.104, p = 0.0001).
To infer the population structure from genotypic data of the nine accessions, the admixture model in the STRUCTURE software was implemented [30]. The largest ΔΚ was identified for K = 6, giving the highest a posteriori probability of K [32] (Figure 5). Individuals were assigned into six groups (numbered 1–6) based on a 70% membership threshold. According to this indicator, particular groups from one to nine individuals were assigned (9, 9, 2, 4, 1, and 4 individuals, respectively). The remaining individuals displayed a varying degree and pattern of admixture (Figure 6). The obtained results indicate that within the accession PL 52403 the 1st group was the most significantly represented. Its total contribution to the accession structure was estimated at 56.5% (Figure 7). In this accession, four of ten studied individuals were classified into the 1st group, one into the 3rd, whilst the others showed admixture. The 1st group also contributed the most to the accession PL 52406 and constituted 58.6% of its entire genetic background. Half of the individuals were classified as members of the 1st group, while the others showed an admixed genetic background. The 2nd group was mainly present in the accessions PL 52404, PL 52410, and PL 52412, and its contribution to the genetic structure was 56.1%, 57.8%, and 50.4%, respectively. Among the 16 individuals studied in a total of these accessions, seven showed membership in the 2nd group. One plant originating from PL 52412 showed a genetic makeup typical for the 3rd group. The remaining individuals were not clearly assigned. The 3rd group appeared as an admixture in all the studied accessions and its contribution ranged from 2.8% (PL 52404) to 28.5% (PL 52410). Out of all 64 tested plants, only two were assigned to this group (from PL 52403 and PL 52412) according to the assumed criteria. The 4th group was the main contributor to the accession PL 52405 (45.4%) and 40% of the individuals have been assigned to it. In addition, one individual was assigned to the 2nd group, and the rest were admixed. The 5th group had the greatest impact on the genetic structure of the accession PL 52408 (39.4%), although all studied plants were considered as having a mixed origin. The last identified in the course of the analysis, the 6th group, prevailed in the genetic structure of the accession PL 52407. Four individuals showed homogeneous background, and the rest were admixed to varying degrees.

4. Discussion

4.1. Marker Effectivness

Here, the study of genetic diversity was performed using the sequence-related amplified polymorphism (SRAP) technique, which was developed by Li and Quiros in 2001 [20]. SRAP uses a combination of 17 or 18 nucleotides “forward” primers from GC-rich exons and “reverse” primers from AT-rich promoters or introns and spacers. SRAP technique is based on the amplification of open reading frames (ORF), which may strengthen the relationship between DNA polymorphisms and morphological characteristics [21]. The reproducibility of these markers is much better than that of the RAPD technique, and an additional advantage of the SRAP technique is the possibility to use fluorescent labeled primers and combine them with unlabeled primers to separate products in capillary sequencers [22]. Another advantage of SRAP is a small amount of starting DNA necessary for analysis (approx. 50 ng). The system does not require knowledge of the sequence or reference genome information. The SRAP markers were used previously for assessing genetic relationships and diversity within and between Saccharum genera [23], Brassica napus L. [24], Cynodon dactylon L. [25], Buchloë dactyloides Nutt [26], Cucurbita moschata Duchesne [27], Pinus kesiya Royle ex Gordon var. langbianensis (A. Chev.) Gaussen [28]. SRAP markers amplify coding regions, which may result in their lower variability [34]. Research on the genetic diversity of the Egyptian pomegranate (Punica granatum L.) indicated SRAP markers had higher sensitivity, PIC and discrimination capacity comparing to ISSR and ISTR markers [35]. The effectiveness of SRAP markers for the genetic variation studies in the genus Avena was confirmed during the evaluation of 64 Avena strigosa Schreb. accessions [36]. The pattern of variation level within the groups was the same regardless of the method of analysis, i.e., morphological traits, isoenzymes, or SRAP markers. Based on the SRAP analysis results, it was also possible to identify the loss of genetic integrity of some accessions due to genetic drift [36]. In the presented study, eight combinations of SRAP primers pairs allowed the identification of 781 fragments of which 69% were polymorphic. Both of these values were higher than previously obtained for A. strigosa [36]. A higher level of polymorphism detected in the study of A. macrostachya comparing to A. strigosa may resulted both from a different flowering biology (cross- vs. self-pollination) and a different approach to the collection and analysis of samples (individuals vs. bulk samples). The mean value of PIC (0.227) in comparison to the analysis of A. strigosa (0.33) was lower [36]. This is a direct result of the high proportion of rare fragments with low frequency. In the studied accessions of A. macrostachya, their average contribution was 27.8%. According to Anderson et al. (1992) formula for dominant markers PIC range 0–0.5 [37]. Therefore, its value for the SRAP marker will be the average of the PIC values obtained for all fragments generated by a given pair of primers. Therefore, when a pair of primers detects a large number of unique alleles for which PIC is very low, the average value will be significantly decreased by them.

4.2. Genetic Diversity

The overall genetic diversity in the examined A. macrostachya collection at the level of 0.23 does not differ significantly from the values observed in previous studies of other Avena species. In the study of the eight accessions of Avena strigosa Schreb., the average value of the uHe coefficient was 0.21, whereas the genetic diversity of Polish landraces of Avena sativa L. was determined as 0.23 [38,39]. Significantly lower values of the differentiation were observed for common oat commercial cultivars, i.e., 0.07 [40]. However, the three oat species differ in terms of their biological status, ploidy level, and also breeding system and each of these factors substantially affects genetic diversity [41]. Generally, genetic diversity increases with ploidy [42]. This phenomenon was observed in the family Poaceae for Cynodon and B. dactyloides [43,44,45]. The three previously mentioned oat species represent three subsequent levels of ploidy, i.e., A. strigosa is a diploid species (2n = 14), A. macrostachya is a tetraploid (2n = 28) and A. sativa is a hexaploidy (2n = 42). The biological status, indicating whether the accessions under investigation represent wild species, landraces, or cultivars, is directly related to the expected degree of their genetic diversity. Along with the domestication of the species, a decrease in their genetic diversity is observed [46]. Accessions of A. macrostachya studied here reflect populations of the wild species, while both A. strigosa and A. sativa are domesticated species. Crops show a decreased diversity level caused by a serious population size reduction resulting from sub-sampling of wild ancestral species followed by targeted selection for the desired phenotypic characteristics during the breeding. Plant breeding systems have been identified as a major factor influencing genetic diversity. Cross-pollinated species are expected to have a higher level of genetic diversity compared to self-pollinating ones. In general, outcrossing reduces the relationship between uniting gametes, thus increasing the number of effective alleles and blurring population subdivision [47]. A. macrostachya is the only outcrossing species of the genus Avena. [40,46].
Considering all the above-mentioned facts, it was expected that the genetic diversity of the examined accessions of A. macrostachya would be higher than that observed in cultivated oats. Relatively low genetic differentiation may result both from the specificity of the species and the fact that the investigated material was acquired from a gene bank. Thus, the loss of diversity may have resulted from a genetic drift that may have been caused by insufficient seed collection during the gene bank expedition, or the loss of alleles during the reproduction and regeneration of the gene bank accessions. Genetic diversity could also be lost due to the deterioration of seed viability during ex situ storage. In the absence of comparative material from natural sites, it is difficult to determine whether, and if so, to what extent, genetic diversity has been lost. According to Baum and Rajhathy [2], in genus Avena, a number of species seem to have a relict endemic distribution limited to isolated places in high elevations or on islands. As mentioned in the introduction A. macrostachya is an endemic species, occurring only in the Atlas Mountains. Populations of endemic species are more vulnerable to genetic drift and reduction of diversity [47]. Since the A. macrostachya sites occur in the mountains at an altitude exceeding 1300 m above sea level, natural selection related to the severe climate should also be considered as a diversity reducing factor. Furthermore, it seems to have a disjunct distribution (Aures and Djurdjura), which can be looked at as an intermediate stage of relict endemism in a process towards extinction. In the future, some of these small populations may become extinct, resulting in relict endemism in advanced stages of this reduction process. Thus, A. macrostachya appears to be one of the morphologically and geographically most isolated species in Avena and it probably originated from a very early branching off of the primitive Avena stock [2]. However, field studies in the Djurdjura showed that the partially isolated A. macrostachya populations were relatively numerous, so the low degree of variation was not caused by the bottleneck effect [1].

4.3. Population Structure

Knowledge about the population structure and diversity distribution, i.e., whether it is located within or between populations of the tested species, is important for preserving its genetic diversity [48]. In the study, AMOVA revealed no significant differentiation between the accessions (ΦPT = 0.094). Uneven distribution of genetic variation towards the intra-population one is typical for wind-pollination outcrossing species because this type of breeding system and pollination mechanisms promotes heterozygosity of the individuals [49,50,51,52,53]. The analysis of the genetic structure showed that there is no clear distinction between the accessions representing natural populations. The gene pools permeated each other, indicating some gene flow between the populations. The gene flow between populations is most probably caused by the pollination mechanism. Pollen transported with the wind can reach long distances, eliminating the subdivisions [47]. As is generally known, even a small gene flow across distant populations leads to atrophy of their differentiation [54,55]. Another possible factor that increases gene flow is the transmission of grains by animals. Cattle pasturing was allowed in the Djurdjura National Park so that the seeds could be transported on cattle hair [1]. Descriptions of sites in the Djurdjura National Park made by Guarino et al. in 1988 [1] indicated the continuity of A. macrostachya in this region. The lack of a definite fragmentation of sites in a short time before seed collection to the Polish Gene Bank seems to have the greatest impact on the absence of a distinctive population structure.

5. Conclusions

To summarize, the research presented in this paper for the first time describes genetic diversity within the A. macrostachya species. Relatively low diversity value may be a consequence of both the endemic character of the species and the genetic drift during collection and preservation in the gene bank. No clear genetic structure has been found within the examined collection, which indicates that the gene flow between the populations in the Djurdjura National Park has been continuously maintained in the late 1980s.
The importance of this research is underlined by the applicability of A. macrostachya in common oat breeding and the uniqueness of the studied collection. It is extremely important to re-establish the expedition in order to identify the changes that have occurred at natural sites. The molecular study of A. macrostachya confirmed the genetic uniformity of the species as already evidenced by morphological uniformity Genetic analysis of the currently occurring specimens is necessary to determine the effectiveness of in situ an ex situ conservation of this species. Considering the endemism of the species, its breeding potential, and the small-scale ex situ collection, careful monitoring of natural sites and repeating of the collection mission is therefore absolutely crucial.

Supplementary Materials

The following are available online at https://0-www-mdpi-com.brum.beds.ac.uk/2073-4395/10/12/1984/s1, Table S1: The resources of accessions of Avena macrostachya in ex situ living collections and herbaria.

Author Contributions

Conceptualization, M.B.; methodology, M.B.; validation, M.B.; investigation, P.B.; resources, W.P.; data curation, M.B.; writing—original draft preparation, P.B., M.B., W.P. and B.Ł.; writing—review and editing, W.P. and B.Ł.; visualization, P.B., M.B.; supervision, M.B.; project administration, M.B. All authors have read and agreed to the published version of the manuscript.

Funding

This work was supported by the Multi-annual program: 2015–2020 “Establishment of a scientific basis for biological progress and preservation of plant genetic resources as a source of innovation in order to support sustainable agriculture and food security of the country” coordinated by Plant Breeding and Acclimatization Institute (IHAR)—National Research Institute and financed by the Ministry of Agriculture and Rural Development of Poland. The calculations were performed at the Interdisciplinary Centre for Mathematical and Computational Modelling, University of Warsaw (ICM UW) within the framework of Computational Grant No. G72–19.

Conflicts of Interest

The authors declare no conflict of interest. The funders had no role in the design of the study; in the collection, analyses, or interpretation of data; in the writing of the manuscript, or in the decision to publish the results.

References

  1. Guarino, L.; Chadja, H.; Mokkadem, A. Collection of Avena Macrostachya Bal. Ex Coss. et Dur. (Poaceae) germplasm in Algeria. Econ. Bot. 1991, 45, 460. [Google Scholar] [CrossRef]
  2. Baum, B.R.; Rajhathy, T. A study of Avena macrostachya. Can. J. Bot. 1976, 54, 2434–2439. [Google Scholar] [CrossRef]
  3. Aissat, A.; Amirouche, R.; Amirouche, N. Cytotaxonomic investigation and meiotic behavior of natural populations of genus Avena in Algeria. Euphytica 2019, 215, 158. [Google Scholar] [CrossRef]
  4. Stebbins, G.L. Chromosomal Evolution in Higher Plants; Edward Arnold Ltd.: London, UK, 1971. [Google Scholar]
  5. Pohler, W.; Hoppe, H.D. Homeology between the chromosomes of Avena macrostachya and the Avena C genome. Plant Breed. 1991, 106, 250–253. [Google Scholar] [CrossRef]
  6. Leggett, J. Further hybrids involving the perennial autotetraploid oat Avena macrostachya. Genome 1992, 35, 273–275. [Google Scholar] [CrossRef]
  7. Cheng, D.; Armstrong, K.; Drouin, G.; McElroy, A.; Fedak, G.; Molnar, S. Isolation and identification of Triticeae chromosome 1 receptor-like kinase genes (Lrk10) from diploid, tetraploid, and hexaploid species of the genus Avena. Genome 2003, 46, 119–127. [Google Scholar] [CrossRef]
  8. Rodionov, A.; Tyupa, N.; Kim, E.; Machs, E.; Loskutov, I. Genomic configuration of the autotetraploid oat species Avena macrostachya inferred from comparative analysis of ITS1 and ITS2 sequences: On the oat karyotype evolution during the early events of the Avena species divergence. Russ. J. Genet. 2005, 41, 518–528. [Google Scholar] [CrossRef]
  9. Peng, Y.-Y.; Wei, Y.-M.; Baum, B.R.; Zheng, Y.-L. Molecular diversity of the 5S rRNA gene and genomic relationships in the genus Avena (Poaceae: Aveneae). Genome 2008, 51, 137–154. [Google Scholar] [CrossRef]
  10. Altosaar, I.; Fabijanski, S. Molecular biology of oat storage protein genes: Probes for evaluating germplasm variation. In Proceedings of the Second International Oats Conference, Aberystwyth, UK, 15–18 July 1985; pp. 39–45. [Google Scholar]
  11. Baum, B.R.; Hadland, V. The epicuticular waxes of glumes of Avena: A scanning electron microscopic study of the morphological patterns in all the species. Can. J. Bot. 1975, 53, 1712–1718. [Google Scholar] [CrossRef]
  12. Clayton, W.D.; Vorontsova, M.S.; Harman, K.T.; Williamson, H. GrassBase—The Online World Grass Flora. Available online: http://www.kew.org/data/grasses-db/www/imp05260.htm (accessed on 25 May 2020).
  13. Medail, F.; Quezel, P. Hot-spots analysis for conservation of plant biodiversity in the Mediterranean Basin. Ann. Mol. Bot. Gard. 1997, 112–127. [Google Scholar] [CrossRef]
  14. Yahi, N.; Vela, E.; Benhouhou, S.; De Belair, G.; Gharzouli, R. Identifying important plants areas (key biodiversity areas for plants) in northern Algeria. J. Threat. Taxa 2012, 2753–2765. [Google Scholar] [CrossRef] [Green Version]
  15. Mediouni, K. Etude structurale de la série du cèdre à Aït-Ouabane Djurdjura. Forêt Méditerranéenne 1989, 11, 103–112. [Google Scholar]
  16. Dobignard, A.; Chatelain, C. Index Synonymique et Bibliographique de la Flore d’Afrique du Nord; ville de Genève editions des Conservatoire et Jardin botaniques, Genève, Switzerland 2010; Volumes 5. Available online: http://www.ville-ge.ch/musinfo/bd/cjb/africa/recherche.php (accessed on 10 September 2020).
  17. Rankou, H.; Culham, A.; Jury, S.L.; Christenhusz, M.J. The endemic flora of Morocco. Phytotaxa 2013, 78, 1–69. [Google Scholar] [CrossRef]
  18. Maire, R. Flore de l’Afrique du Nord (Maroc, Algérie, Tunisie, Tripolitaine, Cyrénaïque et Sahara); Lechevalier: Paris, France, 1952. [Google Scholar]
  19. GBIF.org. GBIF Occurrence. Available online: https://0-doi-org.brum.beds.ac.uk/10.15468/dl.u8hw78 (accessed on 18 November 2020).
  20. Boczkowska, M.; Tarczyk, E. Genetic diversity among Polish landraces of common oat (Avena sativa L.). Genet. Resour. Crop. Evol. 2013, 60, 2157–2169. [Google Scholar] [CrossRef] [Green Version]
  21. Boczkowska, M.; Podyma, W.; Łapiński, B. Oat. In Genetic and Genomic Resources for Grain Cereals Improvement; Elsevier: London, UK, 2016; pp. 159–225. [Google Scholar]
  22. Santos, A.; Livingston, D.; Murphy, J. Agronomic, Cytological and RAPD Evaluations of Avena Sativa x A. Macrostachya Populations. In Proceedings of the Eastern Wheat Workers and Southern Small Grain Workers Proceedings, Raleigh, NC, USA, 25 July 2002; Available online: http://www.ars.usda.gov/research/publications/Publications.htm (accessed on 2 September 2020).
  23. Łapinski, B.; Kała, M.; Nakielna, Z.; Jellen, R.; Livingston, D. The perennial wild species Avena macrostachya as a genetic source for improvement of winterhardiness in winter oat for cultivation in Poland. In Biotechnology and Plant Breeding—Perspectives; Behl, R.E.A., Ed.; Agrobios (International) Publishers: Jodphur, India, 2013; pp. 51–62. [Google Scholar]
  24. Yu, J.; Herrmann, M. Inheritance and mapping of a powdery mildew resistance gene introgressed from Avena macrostachya in cultivated oat. Theor. Appl. Genet. 2006, 113, 429–437. [Google Scholar] [CrossRef]
  25. Loskutov, I. Oat (Avena L.) Distribution, Taxonomy, Evolution and Breeding Value; VIR: Saint Petersburg, Russia, 2007. [Google Scholar]
  26. Weibull, J. Resistance in the wild crop relatives Avena macrostachya and Hordeum bogdani to the aphid Rhopalosiphum padi. Entomol. Exp. Applica. 1988, 48, 225–232. [Google Scholar] [CrossRef]
  27. Budak, H.; Shearman, R.; Parmaksiz, I.; Gaussoin, R.; Riordan, T.; Dweikat, I. Molecular characterization of buffalograss germplasm using sequence-related amplified polymorphism markers. Theor. Appl. Genet. 2004, 108, 328–334. [Google Scholar] [CrossRef]
  28. Excoffier, L.; Smouse, P.E.; Quattro, J.M. Analysis of molecular variance inferred from metric distances among DNA haplotypes: Application to human mitochondrial DNA restriction data. Genetics 1992, 131, 479–491. [Google Scholar]
  29. Peakall, R.; Smouse, P.E. GENALEX 6: Genetic analysis in Excel. Population genetic software for teaching and research. Mol. Ecol. Resour. 2006, 6, 288–295. [Google Scholar] [CrossRef]
  30. Pritchard, J.K.; Stephens, M.; Donnelly, P. Inference of population structure using multilocus genotype data. Genetics 2000, 155, 945–959. [Google Scholar]
  31. Kopelman, N.M.; Mayzel, J.; Jakobsson, M.; Rosenberg, N.A.; Mayrose, I. Clumpak: A program for identifying clustering modes and packaging population structure inferences across K. Mol. Ecol. Resour. 2015, 15, 1179–1191. [Google Scholar] [CrossRef] [PubMed] [Green Version]
  32. Evanno, G.; Regnaut, S.; Goudet, J. Detecting the number of clusters of individuals using the software structure: A simulation study. Mol. Ecol. 2005, 14, 2611–2620. [Google Scholar] [CrossRef] [PubMed] [Green Version]
  33. Hubisz, M.J.; Falush, D.; Stephens, M.; Pritchard, J.K. Inferring weak population structure with the assistance of sample group information. Mol. Ecol. Resour. 2009, 9, 1322–1332. [Google Scholar] [CrossRef] [PubMed] [Green Version]
  34. Poczai, P.; Varga, I.; Laos, M.; Cseh, A.; Bell, N.; Valkonen, J.P.; Hyvönen, J. Advances in plant gene-targeted and functional markers: A review. Plant Methods 2013, 9, 6. [Google Scholar] [CrossRef] [Green Version]
  35. Amar, M.H.; El-Zayat, M.A.S. Utilization of ISTR, ISSR and SRAP molecular markers to reveal and classify Egyptian pomegranates (‘Punica granatum’ L.). Plant Omics 2017, 10, 237. [Google Scholar] [CrossRef]
  36. Podyma, W.; Bolc, P.; Nocen, J.; Puchta, M.; Wlodarczyk, S.; Lapinski, B.; Boczkowska, M. A multilevel exploration of Avena strigosa diversity as a prelude to promote alternative crop. BMC Plant Biol. 2019, 19, 291. [Google Scholar] [CrossRef] [Green Version]
  37. Anderson, J.A.; Churchill, G.A.; Autrique, J.E.; Tanksley, S.D.; Sorrells, M.E. Optimising parental selection for genetic linkage maps. Genome 1992, 36, 181–186. [Google Scholar] [CrossRef]
  38. Podyma, W.; Boczkowska, M.; Wolko, B.; Dostatny, D.F. Morphological, isoenzymatic and ISSRs-based description of diversity of eight sand oat (Avena strigosa Schreb.) landraces. Genet. Resour. Crop. Evol. 2017, 64, 1661–1674. [Google Scholar] [CrossRef]
  39. Boczkowska, M.; Łapiński, B.; Kordulasińska, I.; Dostatny, D.F.; Czembor, J.H. Promoting the use of common oat genetic resources through diversity analysis and core collection construction. PLoS ONE 2016, 11, e0167855. [Google Scholar] [CrossRef] [Green Version]
  40. Boczkowska, M.; Onyśk, A. Unused genetic resources: A case study of Polish common oat germplasm. Ann. Appl. Biol. 2016, 169, 155–165. [Google Scholar] [CrossRef]
  41. Sales, E.; Nebauer, S.G.; Mus, M.; Segura, J. Population genetic study in the Balearic endemic plant species Digitalis minor (Scrophulariaceae) using RAPD markers. Am. J. Bot. 2001, 88, 1750–1759. [Google Scholar] [CrossRef] [PubMed]
  42. Pecinka, A.; Fang, W.; Rehmsmeier, M.; Levy, A.A.; Scheid, O.M. Polyploidization increases meiotic recombination frequency in Arabidopsis. BMC Biol. 2011, 9, 24. [Google Scholar] [CrossRef] [PubMed] [Green Version]
  43. Budak, H.; Shearman, R.C.; Gulsen, O.; Dweikat, I. Understanding ploidy complex and geographic origin of the Buchloe dactyloides genome using cytoplasmic and nuclear marker systems. Theor. Appl. Genet. 2005, 111, 1545–1552. [Google Scholar] [CrossRef]
  44. Gulsen, O.; Shearman, R.C.; Vogel, K.P.; Lee, D.J.; Baenziger, P.S.; Heng-Moss, T.M.; Budak, H. Nuclear genome diversity and relationships among naturally occurring buffalograss genotypes determined by sequence-related amplified polymorphism markers. Hort. Sci. 2005, 40, 537–541. [Google Scholar] [CrossRef] [Green Version]
  45. Gulsen, O.; Sever-Mutlu, S.; Mutlu, N.; Tuna, M.; Karaguzel, O.; Shearman, R.C.; Riordan, T.P.; Heng-Moss, T.M. Polyploidy creates higher diversity among Cynodon accessions as assessed by molecular markers. Theor. Appl. Genet. 2009, 118, 1309–1319. [Google Scholar] [CrossRef] [Green Version]
  46. Allaby, R.G.; Ware, R.L.; Kistler, L. A re-evaluation of the domestication bottleneck from archaeogenomic evidence. Evol. Appl. 2019, 12, 29–37. [Google Scholar] [CrossRef] [Green Version]
  47. Loveless, M.D.; Hamrick, J.L. Ecological determinants of genetic structure in plant populations. Annu. Rev. Ecol. Evol. Syst. 1984, 15, 65–95. [Google Scholar] [CrossRef]
  48. Francisco-Ortega, J.; Santos-Guerra, A.; Kim, S.C.; Crawford, D.J. Plant genetic diversity in the Canary Islands: A conservation perspective. Am. J. Bot. 2000, 87, 909–919. [Google Scholar] [CrossRef] [Green Version]
  49. Bolibok-Brągoszewska, H.; Targońska, M.; Bolibok, L.; Kilian, A.; Rakoczy-Trojanowska, M. Genome-wide characterization of genetic diversity and population structure in Secale. BMC Plant Biol. 2014, 14, 184. [Google Scholar] [CrossRef] [Green Version]
  50. Zhang, C.; Huang, J.; Yin, X.; Lian, C.; Li, X. Genetic diversity and population structure of sour jujube, Ziziphus acidojujuba. Tree Genet. Genomes 2015, 11, 809. [Google Scholar] [CrossRef]
  51. Zhang, J.; Wang, M.; Guo, Z.; Guan, Y.; Liu, J.; Yan, X.; Guo, Y. Genetic Diversity and Population Structure of Bermudagrass (Cynodon dactylon (L.) Pers.) along Latitudinal Gradients and the Relationship with Polyploidy Level. Diversity 2019, 11, 135. [Google Scholar] [CrossRef] [Green Version]
  52. Shang, H.-Y.; Wei, Y.-M.; Wang, X.-R.; Zheng, Y.-L. Genetic diversity and phylogenetic relationships in the rye genus Secale L.(rye) based on Secale cereale microsatellite markers. Genet. Mol. Biol. 2006, 29, 685–691. [Google Scholar] [CrossRef] [Green Version]
  53. Zhang, J.; Xie, W.; Wang, Y.; Zhao, X. Potential of start codon targeted (SCoT) markers to estimate genetic diversity and relationships among chinese Elymus sibiricus accessions. Molecules 2015, 20, 5987–6001. [Google Scholar] [CrossRef] [Green Version]
  54. Wright, S. The genetical structure of populations. Ann. Eugen. 1949, 15, 323–354. [Google Scholar] [CrossRef]
  55. Wright, S. Isolation by distance under diverse systems of mating. Genetics 1946, 31, 39. [Google Scholar]
Figure 1. Morphology of Avena macrostachya Bal. ex Cross. et Durieu, (a) panicles (PL 52406), (b) the overall plant appearance (PL 52406), (c) grain morphology (PL 52409).
Agronomy 10 01984 g001
Figure 2. The Avena macrostachya Bal. ex Cross. et Durieu collection sites. Numbers indicating accessions according to Table 1. (UNEP-WCMC and IUCN (2020), Protected Planet: (protected area 4118; The World Database on Protected Areas (WDPA)) (On-line), (May 2020), Cambridge, UK: UNEP-WCMC and IUCN. Available at: www.protectedplanet.net.) Data available from the U.S. Geological Survey.
Agronomy 10 01984 g002
Figure 3. The unbiased genetic diversity coefficient (uHe) within nine accessions of Avena macrostachya Bal. ex Cross. et Durieu based on sequence-related amplified polymorphism (SRAP) markers. Homogeneous groups were labeled with the letters. The significance of differences was tested using ANOVA. (p < 0.05) and post-hoc Tukey’s HSD test.
Agronomy 10 01984 g003
Figure 4. The results of the Principal Coordinates Analysis (PCoA) of nine accessions of Avena macrostachya Bal. ex Cross. et Durieu based on sequence-related amplified polymorphism (SRAP) markers.
Agronomy 10 01984 g004
Figure 5. Results of the optimal population model investigation by plotting ad hoc measure ΔK of the data over ten runs generated by CLUMPAK software [31] The analysis performed for nine accessions of Avena macrostachya Bal. ex Cross. et Durieu based on sequence-related amplified polymorphism (SRAP) markers.
Agronomy 10 01984 g005
Figure 6. Q-plot of 50,000 burn-ins and 250,000 Markov Chain Monte Carlo generations of STRUCTURE software [33] with K = 6, where K is the number of ad hoc groups to be formed. Each vertical bar represents single plantlets. The length of the colored segment shows the estimated proportion of membership of that sample to each group. The analysis was performed for nine accessions of Avena macrostachya Bal. ex Cross. et Durieu based on sequence-related amplified polymorphism (SRAP) markers.
Agronomy 10 01984 g006
Figure 7. Proportion of six groups in nine accessions of Avena macrostachya Bal. ex Cross. et Durieu. Groups resulted from 50,000 burn-ins and 250,000 Markov Chain Monte Carlo generations of STRUCTURE software [33] with K = 6. The analysis based on sequence-related amplified polymorphism (SRAP) markers.
Agronomy 10 01984 g007
Table 1. List of A. macrostachya accessions preserved by the National Centre for Plant Genetic Resources (NCPGR) in Radzików, i.e., Polish gene bank.
No.Accession NumberCollection SiteLatitudeLongitudeAcquisition Number of Plant
1PL 52403Tikjda, 6 km W (Djurdjura)N 36°30′E 4°5′expedition [1]10
2PL 52404Tikjda, 3 km E (Djurdjura)N 36°30′E 4°12′expedition [1]4
3PL 52405Tikjda, 8 km E (Djurdjura)N 36°30′E 4°15′expedition [1]10
4PL 52406Tala Guilef (Djurdjura)N 36°30′E 4°0′expedition [1]10
5PL 52407Tirourda (Djurdjura)N 36°30′E 4°20′expedition [1]10
6PL 52408Col de Tirouda (Djurdjura)N 36°30′E 4°20′expedition4
7PL 52409(Djurdjura)N 36°30′E 4°11′Expedition NCPGR4
8PL 52410Tikjda (Djurdjura)N 36°27′E 4°25′exchange PGRC CAV 5264 [2]2
9PL 52412n.a.n.a.n.a.open-pollination PL 52411 and PL 5240910
Table 2. List of sequence-related amplified polymorphism (SRAP) primers used in the study.
PrimerSequenceDye
ForwardMe1TGA GTC CAA ACC GGA TA6FAM
Me2TGA GTC CAA ACC GGA GCVIC
Me3TGA GTC CAA ACC GGA ATNED
Me4TGA GTC CAA ACC GGA CCPET
ReverseEm3GAC TGC GTA CGA ATT GAC-
Em4GAC TGC GTA CGA ATT TGA-
Em6GAC TGC GTA CGA ATT GCA-
Em7GAC TGC GTA CGA ATT CAA-
Em8GAC TGC GTA CGA ATT CAC-
Em13GAC TGC GTA CGA ATT CTG-
Table 3. Primer combinations used in the study.
SetForwardReverse
1Me1Em4
Me2Em3
Me3Em3
Me4Em8
2Me1Em13
Me2Em7
Me3Em6
Me4Em7
Table 4. Marker statistics (PIC, Polymorphism Information Content).
PrimersNo. of Fragments% of Polymorphic Fragments% of Rare FragmentsPIC
Me1/Em411378%17%0.269
Me1/Em139369%20%0.233
Me2/Em310981%17%0.270
Me2/Em710270%22%0.228
Me3/Em39367%31%0.221
Me3/Em610766%33%0.223
Me4/Em87856%35%0.171
Me4/Em78667%26%0.204
Mean97.669.3%27.8%0.227
Publisher’s Note: MDPI stays neutral with regard to jurisdictional claims in published maps and institutional affiliations.

