Article

Assessing the Potential of Extra-Early Maturing Landraces for Improving Tolerance to Drought, Heat, and Both Combined Stresses in Maize

by
Charles Nelimor
1,2,3,
Baffour Badu-Apraku
2,*,
Antonia Yarney Tetteh
4,
Ana Luísa Garcia-Oliveira
2 and
Assanvo Simon-Pierre N’guetta
3
1
West African Science Service Centre on Climate Change and Adapted Land-use (WASCAL), Graduate Research Program on Climate Change and Biodiversity, Université Felix Houphouët Boigny, Abidjan 31 B.P. 165, Cote d’Ivoire
2
International Institute of Tropical Agriculture, Ibadan 200001, Nigeria
3
Department of Bioscience, Université Felix Houphouët Boigny, Abidjan 22 B.P. 461, Cote d’Ivoire
4
Department of Biochemistry and Biotechnology, Kwame Nkrumah University of Science and Technology, University Post Office Box PMP, Kumasi 00233, Ghana
*
Author to whom correspondence should be addressed.
Submission received: 17 December 2019 / Revised: 4 February 2020 / Accepted: 4 February 2020 / Published: 25 February 2020

Abstract

:
Maize landrace accessions constitute an invaluable gene pool of unexplored alleles that can be harnessed to mitigate the challenges of the narrowing genetic base, declined genetic gains, and reduced resilience to abiotic stress in modern varieties developed from repeated recycling of few superior breeding lines. The objective of this study was to identify extra-early maize landraces that express tolerance to drought and/or heat stress and maintain high grain yield (GY) with other desirable agronomic/morpho-physiological traits. Field experiments were carried out over two years on 66 extra-early maturing maize landraces and six drought and/or heat-tolerant populations under drought stress (DS), heat stress (HS), combined both stresses (DSHS), and non-stress (NS) conditions as a control. Wide variations were observed across the accessions for measured traits under each stress, demonstrating the existence of substantial natural variation for tolerance to the abiotic stresses in the maize accessions. Performance under DS was predictive of yield potential under DSHS, but tolerance to HS was independent of tolerance to DS and DSHS. The accessions displayed greater tolerance to HS (23% yield loss) relative to DS (49% yield loss) and DSHS (yield loss = 58%). Accessions TZm-1162, TZm-1167, TZm-1472, and TZm-1508 showed particularly good adaptation to the three stresses. These landrace accessions should be further explored to identify the genes underlying their high tolerance and they could be exploited in maize breeding as a resource for broadening the genetic base and increasing the abiotic stress resilience of elite maize varieties.

1. Introduction

Cultivation of maize (Zea mays L.) across the different agro-ecological zones of Africa dates to precolonial times after its introduction by Portuguese sailors in the late fifteenth century [1]. Hybridization between different populations, natural and artificial selection, and cultivation in diverse edaphic and climatic conditions, led to a plethora landraces/local varieties adapted to different agro-ecological zones, cultivation practices, and uses [2]. Whereas about 45% of these landraces/local varieties are still being grown across sub-Saharan Africa (SSA), many of these genotypes were collected and preserved in germplasm banks for avoiding the threat of extinction due to adoption of modern varieties or hybrids [3]. Historically, maize breeders identified and composited the most productive of these landraces to generate genetically diverse populations, constituting the foundation of hybrid maize breeding and developing open-pollinated varieties (OPVs) that displayed high yielding with tolerance to biotic and abiotic stresses [4,5].
Nonetheless, nowadays breeders are generally reluctant to use landraces because of the long-term commitment required to identify useful, novel diversity and introgress it into well-adapted elite cultivars while reducing the effects of undesired linked genes [6]. Breeders often resort to their own working collection consisting of elite breeding lines and some germplasm lines as parents in crossing, resulting in recirculating of the same germplasm. As a direct consequence, some newly developed maize varieties, including hybrids exhibit reduced genetic diversity [7], which may limit genetic gains and resilience to abiotic stresses. For example, by assessing the genetic diversity among selected elite CIMMYT Maize Hybrids in East and Southern Africa (ESA), Masuka et al. [7] observed that repeated use of four inbred parents resulted in narrowing of the genetic base of 29 to 58% of the hybrids, which could pose major risk in case of pest or disease outbreaks that are most likely under the prevailing climate changes.
The global climate over the past decade has changed rapidly, and temperatures are predicted to increase [8]. Similarly, precipitation patterns are expected to change significantly, which could adversely affect crop productivity either through drought or waterlogging [8]. Drought stress (DS) and heat (HS) stress are the two most critical and frequently co-occurring abiotic factors on farmers’ fields. The tropical location, socio-economic, demographic, policy and farming characteristics of SSA heighten the risk of these stresses [9,10]. Thus, climate change represents a major impediment to African economy and subsistence.
Predicted impacts of climate change on major staple crops including maize in SSA are significant and primarily negative [11,12]. Drought and HS impede maize performance at all stages of plant growth and development. At flowering and early grain-filling stages of maize, DS and HS result in longer anthesis-silking interval (ASI) owing to the delay of silk extrusion, premature lodging, and reduced rates of net photosynthesis arising from oxidative damage to chloroplasts. Damage to chloroplasts is initiated by other detrimental effects of stomatal closure, leaf firing, tassel blasting, and senescence [13,14,15,16,17,18]. Consequently, reduced pollination efficiency, abnormal development of the embryo sac, as well as zygotic and early kernel abortion occur [14,15]. For these reasons, DS and HS occurring just before and shortly after pollination have the most profound negative effects on maize grain yield (GY) [16]. Yield losses attributable to DS and HS at flowering and the early grain-filling stages of maize were estimated at between 46–90% [17,18,19] and 45–55%, respectively [19,20]. Worse of all, DS and HS often co-occur under natural field conditions and their combined effects on growth, GY and related traits can either be synergistic, antagonistic or hypo-additive [21,22,23,24]. Recently, we screened 36 early maturing maize accessions for tolerance to abiotic stresses and found that on average, GY was reduced by 46%, 55% and 66% under DS, HS and DSHS conditions, respectively [19]. The high GY loss under DSHS reflects hypo-additive effect of DS and HS, which under extreme conditions could force farmers to abandon their farmlands [18,25].
To meet the food and feed needs of the projected population by 2050, it is essential for maize improvement programs in SSA to focus on the development of maize varieties with climate-adaptive traits, specifically, enhanced DS and/or HS tolerance either through conventional or biotechnology means. Genetic resources of maize are crucial to this goal. In particular, the landraces of maize, given their millennia evolutionary history and adaptation to low-input agricultural systems, harbor wide genetic diversity for improved productivity, climate adaptation, nutritional value, and quality attributes [26]. Despite their potential, most genetic diversity studies on maize landraces have focused on the analysis of variation in genetic parameters without much consideration for traits that confer tolerance to abiotic stress conditions. Only few studies have assessed the amount and nature of variation in landrace accessions of maize under individual and combined DS and HS [19,27].
Besides high yield potential, an appropriate cultivar for large areas of West and Central Africa (WCA), especially the Sudan savanna agro-ecological zone where growing cycles are short, must be DS and/or HS-tolerant at an extra-early stage (requiring 80–85 days to maturity) or early stage (90–95 days to maturity) [28]. The success of maize improvement for DS tolerance in tropical maize is well acknowledged [29]. Nonetheless, new DS tolerant source populations are needed to sustain increased genetic gains for food security [29]. Moreover, in comparison to DS, research on HS tolerance in tropical maize is still at the infant stage [29,30], and more studies are needed to complement these breeding efforts. Therefore, performing phenotypic screens to capture the genetic diversity that exist in extra-early landrace accessions of maize resting idle in germplasm banks under DS, HS and DSHS conditions is a promising strategy to uncover new genetic sources, which when introgressed into breeding stocks could contribute to the broadening of the genetic base and development of ‘next generation’ maize varieties with enhanced quality and other end-user preferred traits.
The present study aimed at identifying DS, HS and DSHS tolerant extra-early maturing maize landraces by exploring agronomic and morpho-physiological traits along with grain yield.

2. Materials and Methods

2.1. Plant Materials

One hundred and ninety-six (196) landrace accessions of maize from Burkina Faso, Ghana and Togo, were randomly sampled from gene banks at the International Institute of Tropical Agriculture (IITA), Nigeria and the Plant Genetics Resources Institute of Ghana in January 2017. Records on collection dates and geographical co-ordinates of the collection sites of these landraces were not available. However, the agro-ecologies/environments in these countries differ in a number of ways in terms of temperature and precipitation, and the adaptation of the accessions to these contrasting agro-ecologies may have been different. We characterized the maize collections under non-stress (NS) conditions for two years, and identified traits related to adaptation to local environmental conditions [31]. A total of 66 landraces were selected for the present study based on variation in standability, plant architecture, agronomic traits (lodging, earlier flowering, anthesis-silking interval, ear husk cover) and grain yield potential under optimal conditions. Six extra-early maturing drought and /or heat-tolerant populations developed by the Maize Improvement Program at the International Institute of Tropical Agriculture (IITA-MIP), Ibadan, Nigeria were included as checks. Details on the 72 maize accessions assessed in this study are available in Supplementary Table S1.

2.2. Agronomic Management

In the present study, each location-year combination was regarded as an environment. At all environments, the experiment was arranged in a 9 × 8 alpha lattice design with two replications. Each plot consisted of one-row plots each 3-m long with plants within and between rows spaced 0.40 m and 0.75 m apart, respectively. Three seeds were sown per hill and thinned to two, two weeks after emergence, resulting in a final plant population density of 66,666 plants per hectare. All stress trials were conducted during the dry season to allow DS, HS and DSHS to be imposed at the period considered most critical for maize growth and development [16].
As control, trials conducted under NS conditions were planted between June and July at the IITA experimental stations at Ikenne (6°53’ N, 3°42’ E, 60 m altitude, 1200 mm annual rainfall) and Mokwa (9°18’ N, 5°185 4’ E, altitude 457 m, 1100 mm annual rainfall), all in Nigeria, in 2017 and 2018. At 2 weeks after planting (WAP), 60 kg ha–1 each of nitrogen (N), phosphorus (P) and potassium (K) was applied. Four weeks later, the trials were top-dressed with 30 kg ha−1 of urea. In the stress trials, all plots received 60 kg N ha−1, 60 kg P ha−1 and 60 kg K ha−1 as NPK 15–15–15 at sowing. A second application of N (30 kg N ha−1) was applied as urea two weeks later. Weeds were controlled with herbicides and/or manually.

2.2.1. Drought Stress Trials

Drought experiments were planted at Ikenne during the last week of November in 2017 and 2018, so that flowering and early grain filling stages occurred in January when the incidence of rainfall was negligible. In both years, irrigation was applied using a sprinkler system (flow rate 17 mm day−1) for the first 25 days after planting (DAP). Irrigation was suspended two weeks before anthesis until physiological maturity, so that the maize plants depended on stored water in the soil for growth and development.

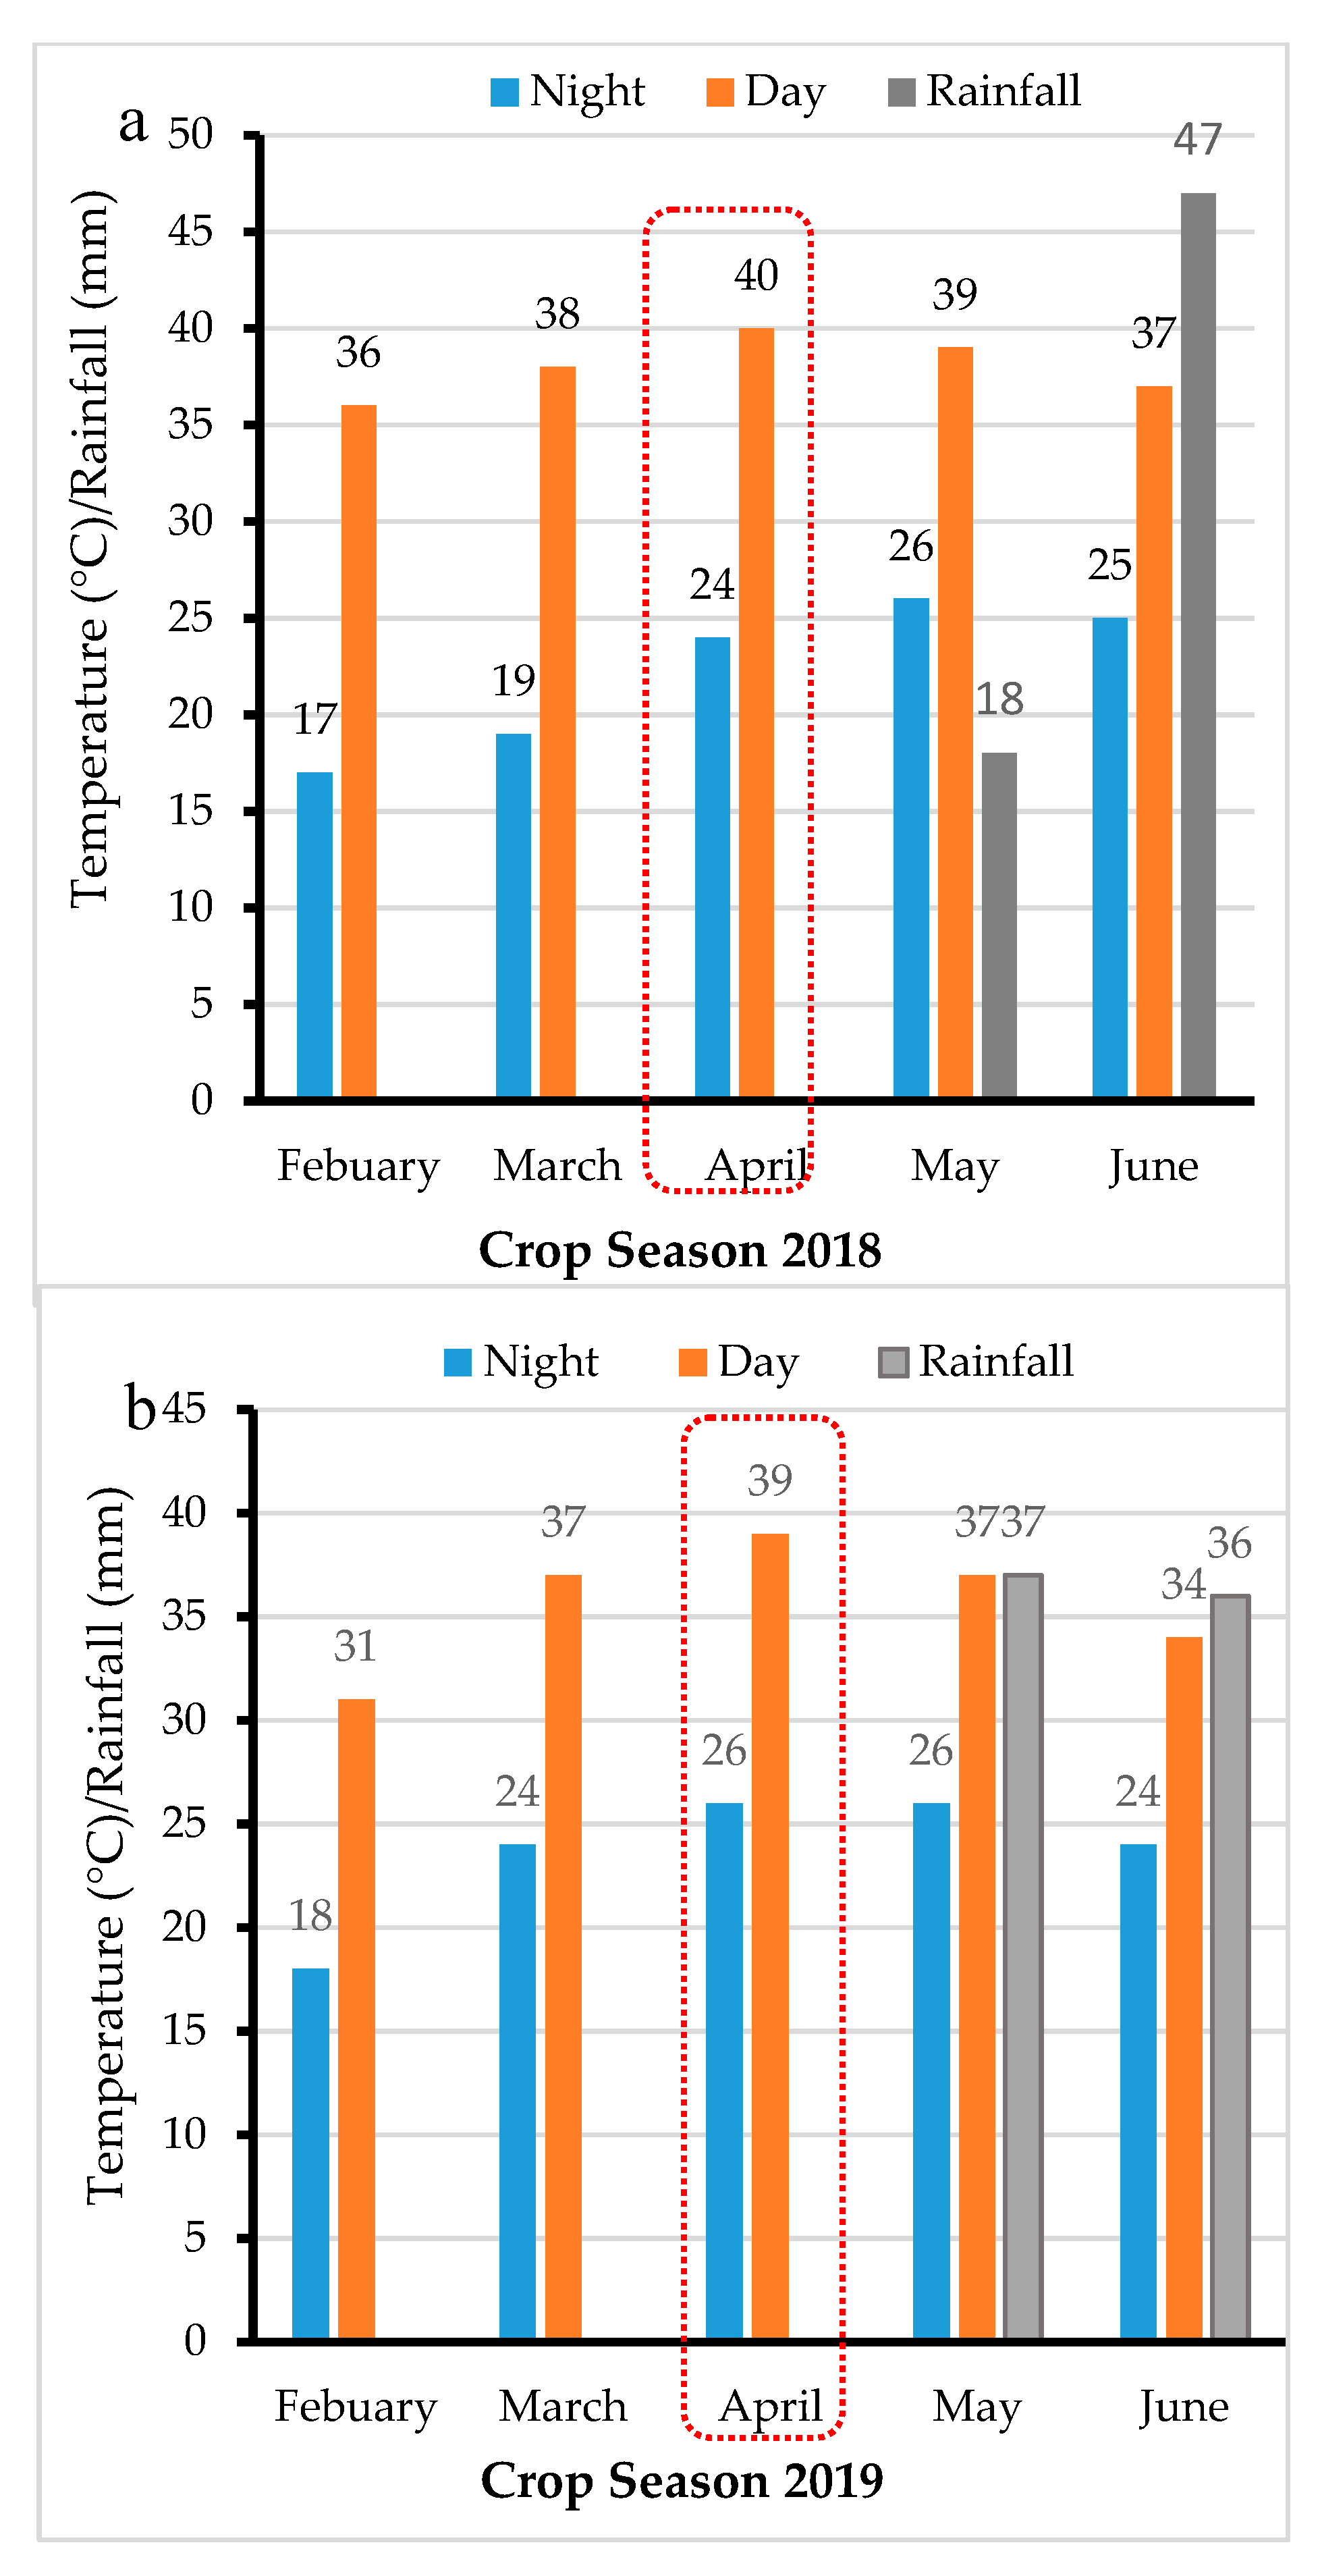
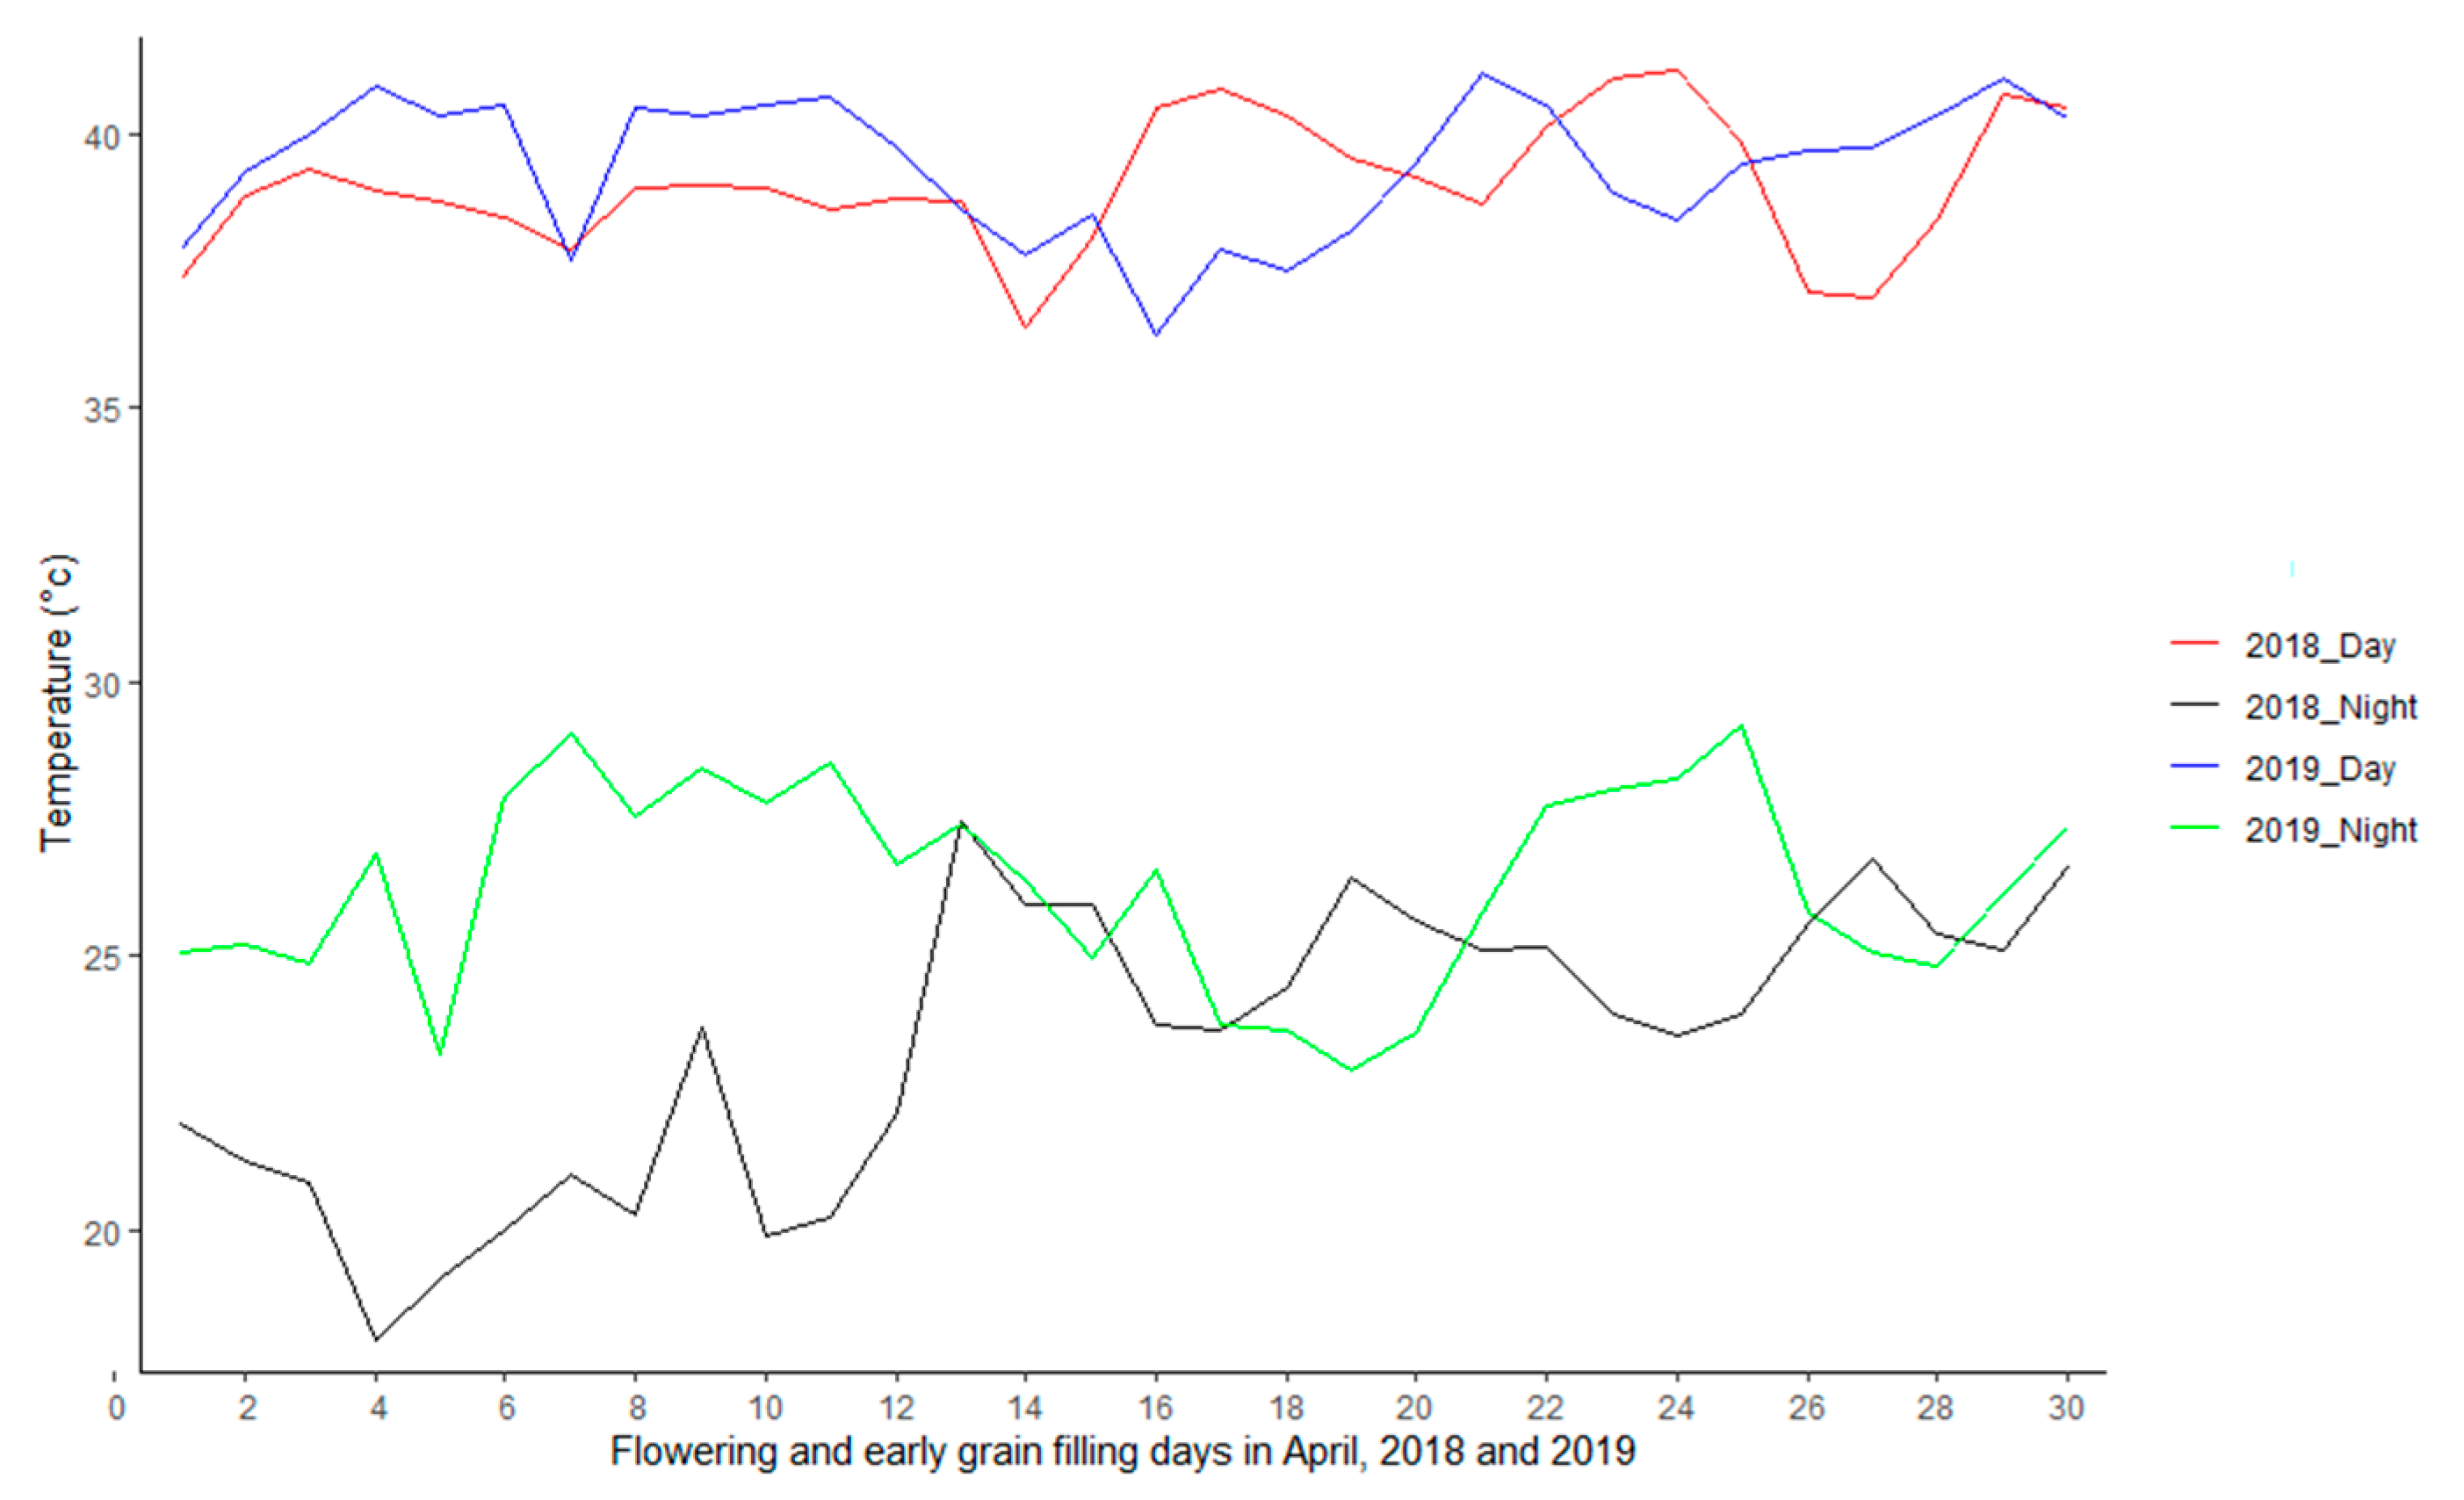
2.2.2. Heat and Combined Drought and Heat Stress Trials

HS and DSHS trials were carried out at Kadawa (11°39’ N, 8°27’ E, 500 m altitude), Nigeria, where extreme DS at elevated temperatures occur between February and June each year. During this period, air temperature often varies between 33 and 45 °C [18], allowing for the establishment of trials under HS and DSHS. The HS and DSHS trials were laid in adjacent blocks, 15 m apart and planting was done on the same day in mid-February 2018 and 2019. Temperature and rainfall patterns during the experiment were measured by an automatic weather station installed at Kano, Nigeria. The average temperature at the experimental sites during the study period ranged from 36 °C/17 °C (day/night) to 40 °C/24 °C (day/night) in 2018, and from 31 °C/18 °C (day/night) to 39 °C/26 °C (day/night) in 2019 (Figure 1). There were minor incidences of rainfall after grain filling in May and June in both years (Figure 1). Flowering and grain-filling stages occurred in April, coinciding with extreme DS at elevated temperatures, which resulted in irreversible tissue injuries (leaf firing and tassel blasting) to susceptible genotypes (Supplementary Figure S1). During the reproductive stages in April, the minimum temperature was 36 °C/18 °C (day/night) in 2018, and 36 °C/23 °C (day/night) in 2019. The maximum temperature observed was 41 °C/27 °C (day/night) in 2018, and 41 °C/29 °C (day/night) in 2019, with a mean of 39 °C/23 °C (day/night) and 39 °C/26 °C (day/night) in 2018 and 2019, respectively (Figure 2). Irrigation was applied twice weekly on both HS and DSHS blocks using a furrow irrigation system. Irrigation was suspended on the DSHS block at 32 DAP but was resumed after grain-filling and applied once in order to avoid complete loss of trials. The HS block on the hand continued to receive irrigation every four days until physiological maturity.

2.3. Trait Measurement

At flowering, days to anthesis (AD) and silking (SD) were recorded when 50% of the plants in a plot had shed pollen and extruded silks, respectively. ASI was computed as SD minus AD. Plants with leaf firing (LF) and tassel blasting (TB) were counted on HS and DSHS plots and converted to percentages. At physiological maturity, plant and ear heights (PLHT and EHT) were measured on ten representative plants per plot as the length from the base of the plant to the height of the first tassel branch and the node bearing the upper ear, respectively. Plant aspect (PASP) was visually scored based on the general appeal of plants in a plot (standability, vigour, plant, and ear height, uniformity of plants, ear placement and size, as well as disease damage and lodging) using a scale of 1 to 9, where 1 = excellent overall phenotypic appeal; 2 = very good overall phenotypic appeal; 3 = good overall phenotypic appeal; 4 = satisfactory overall phenotypic appeal; 5 = acceptable phenotypic appeal; 6 = undesirable phenotypic appeal, 7 = poor overall phenotypic appeal, 8 = very poor phenotypic appeal and 9 = completely undesirable phenotypic appeal. Similarly, husk cover (HC) was rated on a scale of 1 to 9, where 1 = husks tightly arranged and extended beyond the ear tip and 9 = exposed ears. Stay green characteristic (SG) was recorded on all stressed plots at 70 DAP using a scale of1 to 9, where 1 = 10% dead leaf area; 2 = 20% dead leaf area; 3 = 30% dead leaf area, 4 = 40% dead leaf area; 5 = 50% dead leaf area; 6 = 60% dead leaf area; 7 = 70% dead leaf area; 8 = 80% dead leaf area and 9 represented 90–100% dead leaf area. Few days before harvest, root and stalk lodging (RL and SL) were recorded as the percentage of plants leaning more than 30° from the vertical, and percentage plants broken at or below the highest ear node, respectively then all plants were hand harvested. At harvest, ear aspect (EASP) was rated based on the general appeal of the ears without the husks (ear size and number; uniformity of size, colour, and texture; extent of grain filling, insect and disease damage) using a scale of 1 to 9, where 1 = excellent (clean, uniform, large, and well-filled and disease-free ears); 2 = very good ears with no disease damage and fully filled grains; 3 = good ears with no disease damage and fully filled grains; 4 = no disease, fully filled grains, one or two irregularity in cob size poor; 5 = mild disease damage and fully filled grains, one or two irregularity in cob size, 6 = severe disease damage and fully filled grains, smaller cobs, non-uniform cob size; 7 = severe disease, scanty grain filling, few ears, non-uniformity of cobs; 8 = severe disease damage, very scanty grain filling, few ears, and 9 = only one or no ears produced (Supplementary Figure S2). Ears with rot (EAROT) were counted on plot basis and converted to percentage. Grain yield (kg ha−1) was estimated based on 80% shelling percentage for NS plots. In contrast, total shelled grain weight was obtained for stress plots and GY was adjusted to 15% moisture content.

2.4. Statistical Analysis

Variance components were estimated for each trial/environment by restricted maximum likelihood (Reml) using PROC Mixed of SAS version 9.4 [32]. The corresponding linear mixed model for the response variable was represented by:
Y i k l = μ + R k + I B ( R ) l k + G i + e i k l
where Y is the trait of interest, μ is the overall mean, R k is the effect of the k t h replicate, I B ( R ) l k is the effect of the incomplete block within the k t h replicate, G i is the effect of the i t h genotype, and e i k l is the experimental error. All effects were considered random except replicates. Broad-sense heritability ( H ) of grain yield was estimated for each environment as:
H = σ g 2 ( σ g 2 + σ e 2 r )
where σ g 2 and σ e 2 represented genotypic and residual variance, respectively and r denote the number of replicates. Trials with H of GY less than 0.30 were highly influenced by the environment and were removed from the analyses.
Combined analysis of variance (ANOVA) across environments were performed for each treatment (NS, HS, DS, and DSHS) with PROC GLM in SAS 9.4 using a RANDOM statement with the TEST option [32]. In the ANOVA, test environments, replicates, blocks and their interactions were considered as random factors while accessions were regarded as fixed effects.
Repeatability of the traits [33] under each treatment were computed on accession-mean basis using the following formula:
R = σ g 2 σ g 2 + σ g e 2 e + σ e r e
where σ g 2   is the genotypic variance, σ g e 2 is the variance of genotype × environment, σ e is the residual variance; e is the number of environments, and r is the number of replicates per environment.
Phenotypic correlations among grain yield of the treatments were computed to determine the mechanism of abiotic stress tolerance using R library Performance Analytics [34]. Genetic correlations between phenology (AD and SD) and other secondary traits were estimated following the procedure of Cooper et al. [35] using Multi Environment Trial Analysis (META) [36].
Sequential path coefficient analysis [37] was used to identify traits with significant contributions to GY of the maize accessions under the evaluation conditions. A stepwise regression analysis was used to categorize the predictor traits into first, second and third order based on their individual contributions to total variation in GY with minimized multicollinearity [38]. The first step involved the regression of all the traits on GY and those with significant contributions to GY at p < 0.05 were identified as first order traits. Subsequently, traits that were not identified as first order traits were regressed on each of the first order traits to identify those with significant contributions to GY through each of the first order traits and were categorized as second-order traits. The procedure was repeated to identify traits in subsequent orders. The path coefficients were represented by the standardized b-values obtained from the regression analysis [38,39,40]. The sequential path coefficient including the stepwise regression analyses was done using the Statistical Package for Social Sciences, SPSS version 17.0 [41]
A base index (BI) that integrated superior grain yield, EPP, ASI, PASP, EASP, and SG was used to select the best and worst performing genotypes under each treatment [40]. Each trait was first standardized with standard deviation of 1 and a mean of zero to minimize the effect of the different scales prior to integrating into the BI. The BI was computed using the equation:
B I = [ ( 2 × Y L D S ) + E P P A S I P A S P E A S P S G ]
where Y L D S is GY under stress, P A S P is plant aspect, E A S P is ear aspect, E P P is ears per plant, A S I is anthesis-silking interval and S G is the stay-green characteristic. A positive B I value indicated tolerance to the applied stress while negative values indicated susceptibility [40].
Principal components analysis (PCA) was performed and the results were graphically visualized in a biplot that displayed different genetic groups (highlighted with different colours) and the association between accessions and measured traits. Grain yield was regressed on TB scores, plotted on a graph to show the effect of TB on GY of the maize accessions under HS and DSHS. Standardized data of the traits included in the BI selection were subjected to cluster analysis, in which phylogenetic constellation plots were generated, depicting the genetic relationships among the accessions under each stress treatment. The PCA, regression and cluster analysis were performed using JMP pro 14.10 [32].

3. Results

3.1. Analysis of Variance and Broad-Sense Heritability

Detailed values for variance components are presented in Table 1 and Table 2. There was a large variation among the accessions for GY and other traits under NS, DS, HS and DSHS, which facilitated the grouping of abiotic stress-tolerant genotypes from their susceptible counterparts, as well as identification of traits that maximize variance in tolerance to the imposed stresses. Broad-sense heritability estimates of GY of individual trials ranged from 0.88 to 0.96 under NS, 0.51 to 0.61 under DS, 0.48 to 0.55 under HS, and 0.51 to 0.68 under DSHS (Supplementary Table S1). Hence, no trial was eliminated from the combined analysis. Within-treatments, repeatability measured across environmental conditions ranged from 0.41 for HC to 0.94 for GY under NS, 0.30 for EPP to 0.95 for EHT under DS, 0.21 for TB to 0.94 for AD under HS, and from 0.25 for EPP to 0.95 for AD under DSHS (Table 1 and Table 2).
Mean GY under NS was ~2992 kg/ha, ~2301 kg/ha under HS, ~1524 kg/ha under DS, and ~1259 kg/ha under DSHS (Table 1 and Table 2). Compared with the NS environment, DS reduced GY by between 2.5% to ~85% (mean = 49%), 1.1% to 68.4% with an average of 23% under HS and, between 10% to 94% with a mean of 58% under DSHS. Anthesis was, on average, reached after 47 and 46 days under NS and DS conditions, respectively. Under HS, anthesis was delayed by 10 days and by 9 days under DSHS. Similarly, silking was on the average reached after 50 days under both NS and DS conditions but delayed by 10 days under HS and 8 days under DSHS. Despite the stress, ASI remained largely unchanged under all the treatments (averaging 3 days under NS, HS and DSHS, and 4 days under DS). Plant height was reduced by ~24% under DS and by 6% and 7% under HS and DSHS, respectively. Reduction in EPP was highest under DS (26%) and DSHS (26%) and lowest under HS (11%). Traits such as HC, and PASP and EASP were unaffected by the stresses as indicated by the average score of 4 and 5 under all the contrasting conditions. Leaf senescence, RL, SL, TB, and LF were on average, higher under DSHS relative to HS conditions.

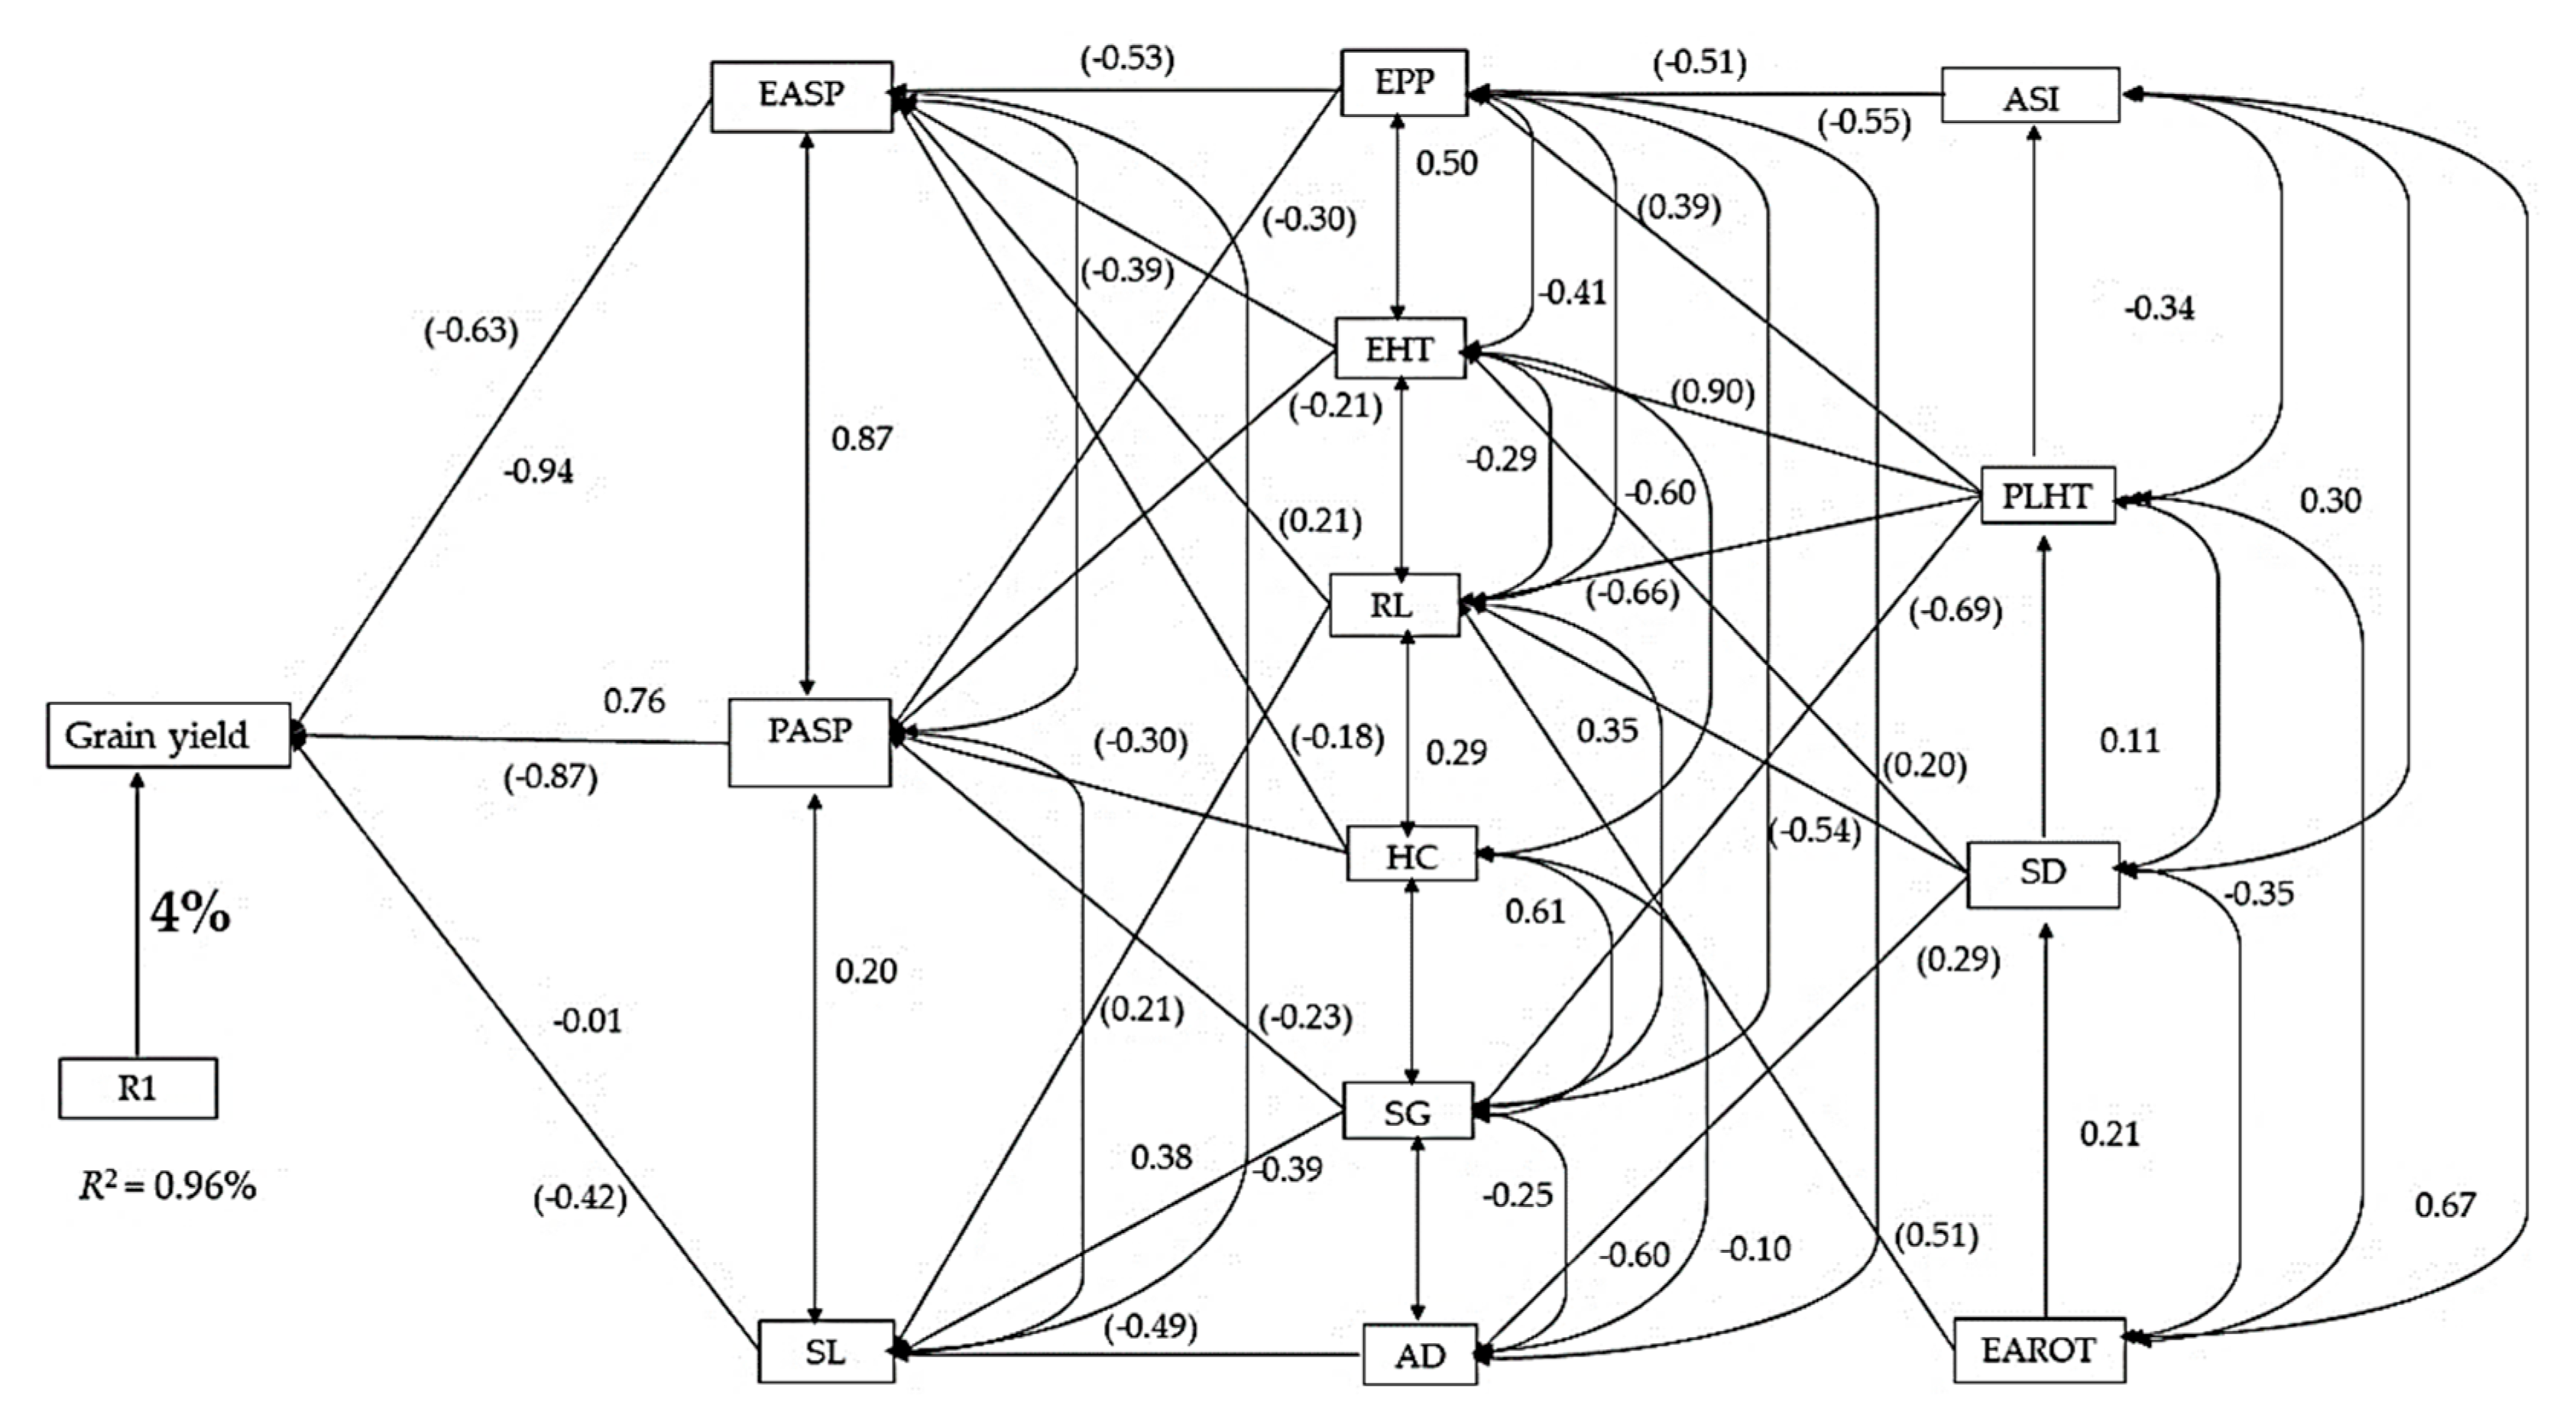
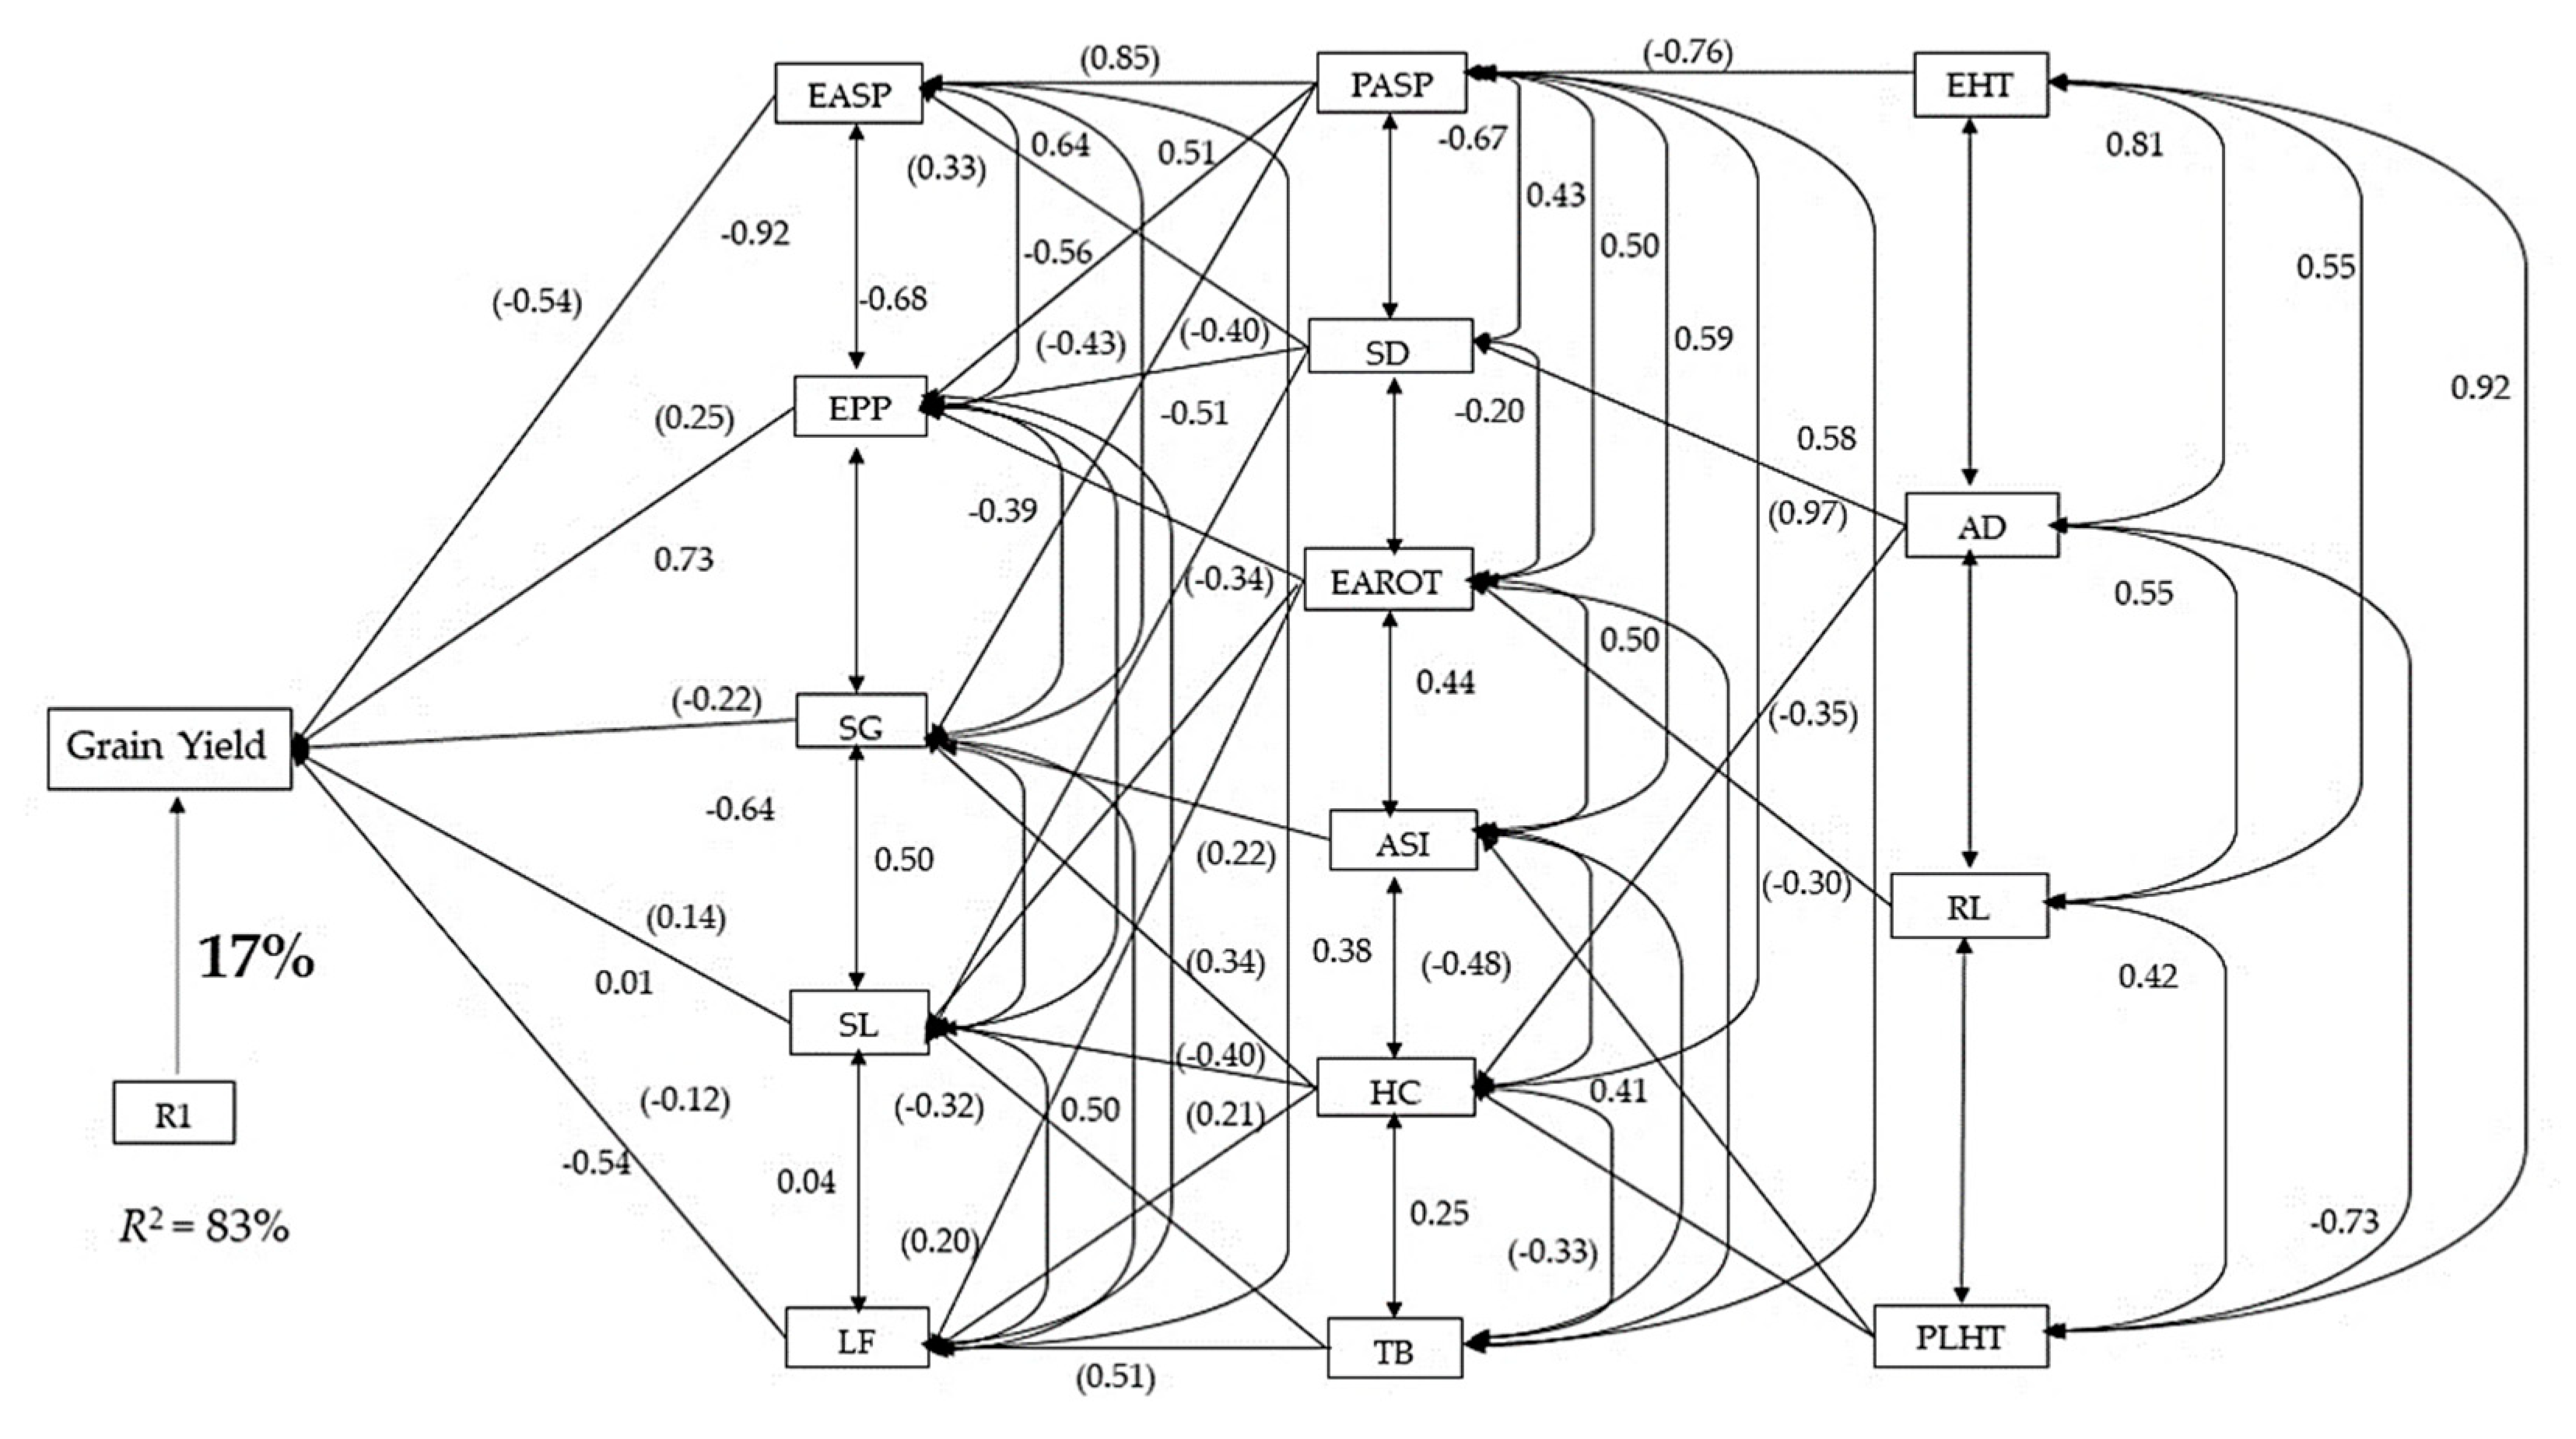
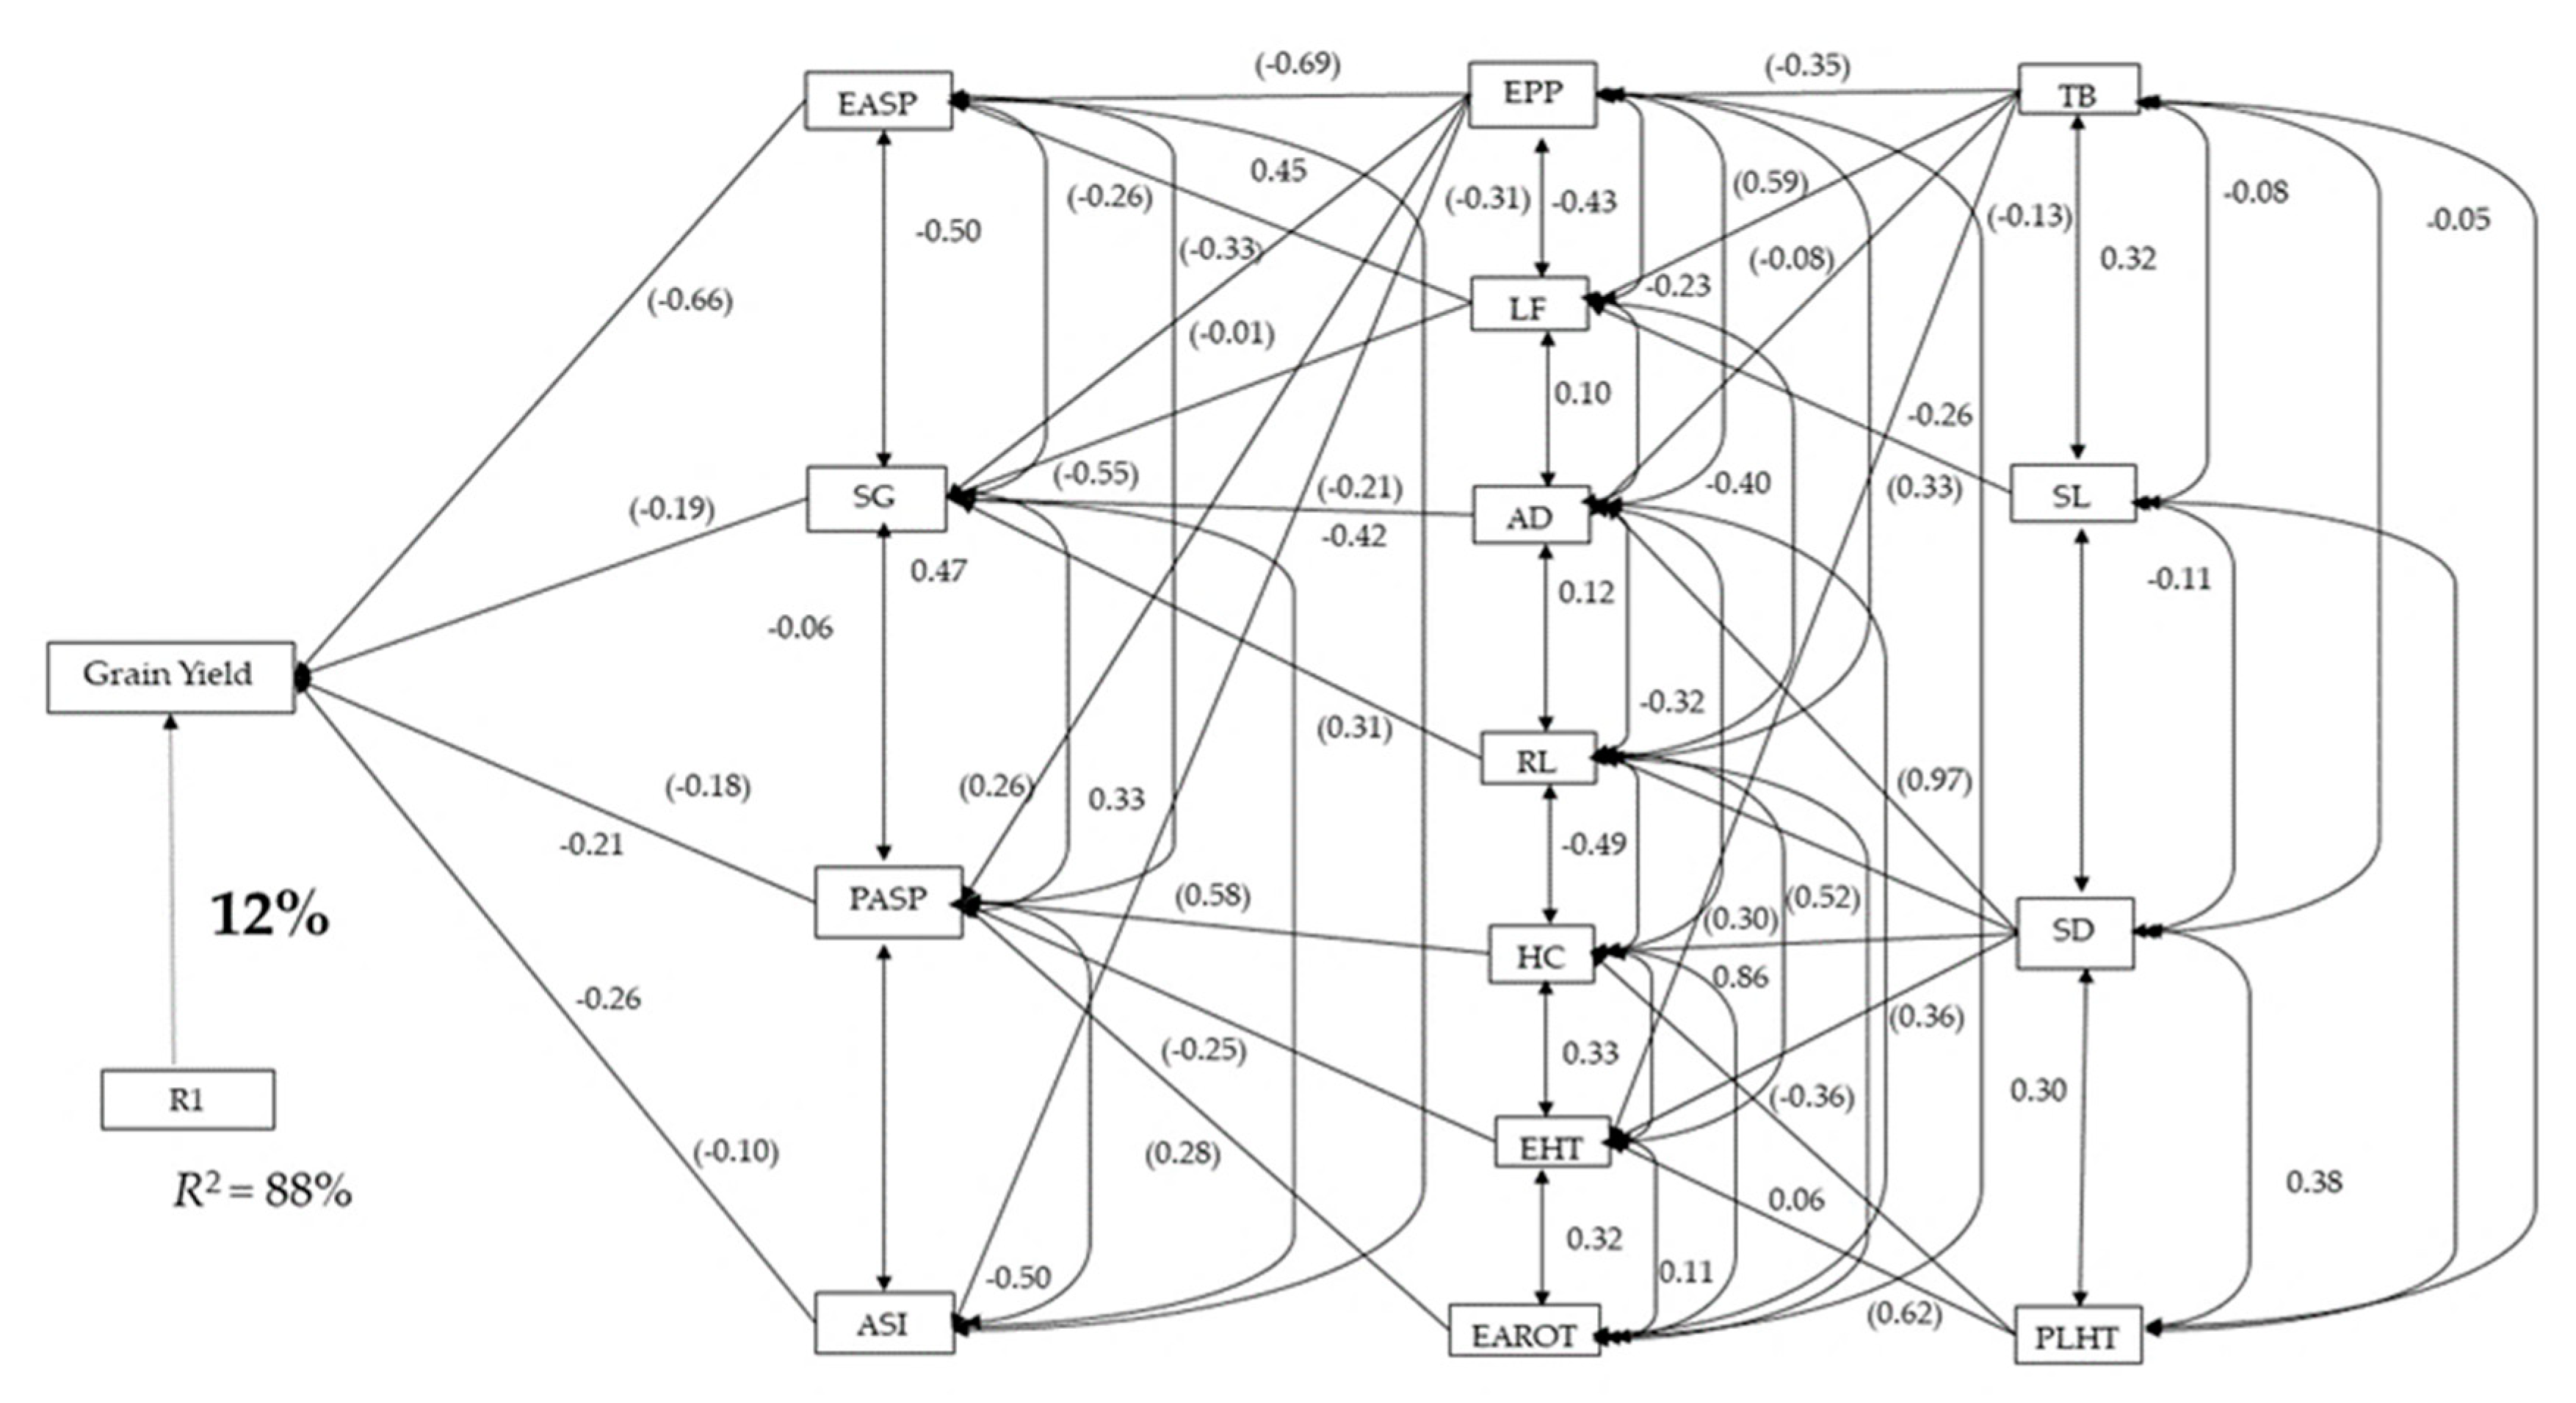
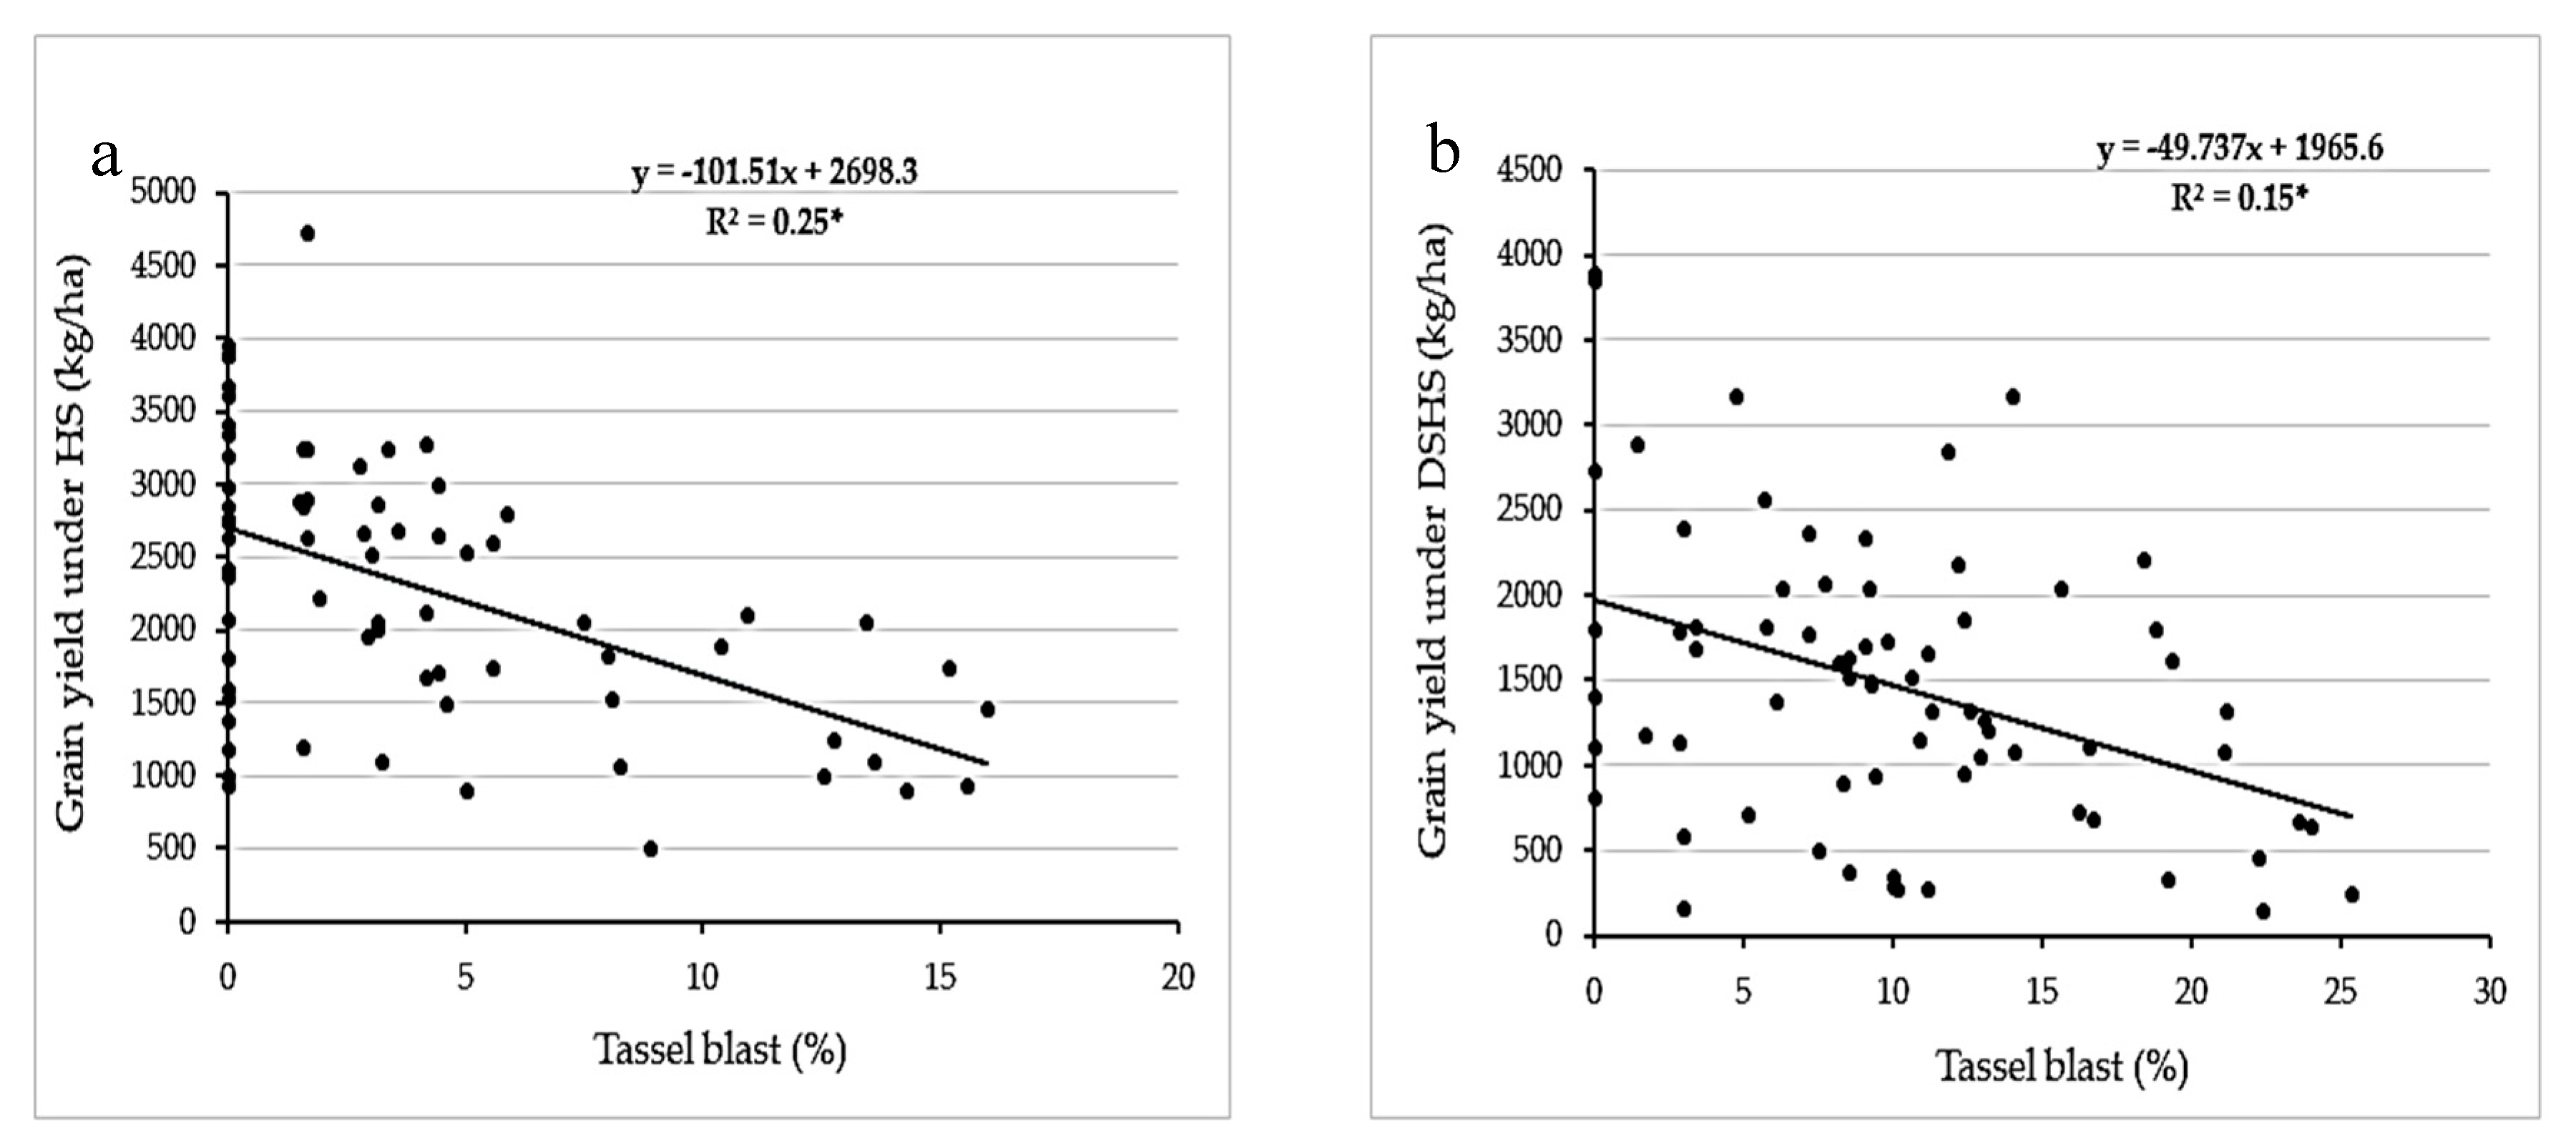
3.2. Genetic Correlations and Sequential Regression Analysis

Phenotypic correlations between grain yields under NS, DS, HS and DSHS are presented in Table 3. Grain yield observed under NS was strongly and positively correlated with GY under HS (r = 0.75; p < 0.0001) while the correlation between GY under NS and those under DS, and DSHS were moderate and positive. Similarly, the correlation between GY under DS and DSHS was positive and moderate (r = 0.60; p < 0.0001). However, weak and positive phenotypic correlations were observed between GY under DS and HS (r = 0.48; p < 0.001) as well as HS and DSHS (r = 0.37; p < 0.001). Strong and positive correlations (r ≥ 0.73; p < 0.0001) were observed for both AD and SD under NS and those under DS, and DSHS as well as between DS and DSHS. No significant correlation was observed between EPP under the different treatments except between NS and DS (r = 0.37; p < 0.001). Weak to moderate correlations were recorded for PASP under the different treatments except those between HS and DS (r = 0.19) and, HS and DSHS (r = 0.05). A similar trend was observed for EASP under the treatments. Negative genetic correlations were observed between phenology (AD and SD) and GY, HC, PASP, EASP, SG, LF, and TB under the applied stresses whereas, genetic correlations between flowering traits (AD and SD) and ASI, PLHT and EHT were positive (Table 4).
Under DS, stepwise multiple regression analysis identified EASP, PASP, and SL as the first order traits with significant contributions to GY (explaining 96 % of the total variation in GY) of the maize accessions (Figure 3). Of these first order traits, PASP had the highest negative direct effect on GY (−0.87) while SL contributed the least (−0.42) to GY. Traits, which contributed indirectly to GY through one or two of the first order traits, included EPP, EHT, RL, HC, SG, and AD. These traits were thus, classified into the second order. The traits classified into the third order were ASI, PLHT, SD, and EAROT, each contributing to variation in GY of the maize accessions through one or more of the second order traits.
Across the HS treatments, EASP, EPP, SG, SL, and LF were identified as first order traits responsible for 83% of the total variation in GY (Figure 4). Of these first order traits, EASP had the highest negative direct effect on GY (−0.54), while LF recorded the least direct negative effect on GY (−0.12). Only EPP had direct positive contribution to GY (0.25). Six traits, namely PASP, SD, EAROT, ASI, HC and TB contributed indirectly to GY through one or more of the first order traits and were thus categorized into the second order. Among the second order traits, ASI and TB contributed indirectly to GY through SG, and LF and SL, respectively. Plant aspect had the highest negative (−0.43) indirect contribution to GY through EPP, while the highest positive indirect contribution to GY was also observed for PASP through EASP (0.85). Four traits (EHT, AD, RL and PLHT) contributed indirectly to GY through one or two of the second order traits and were categorized into third order traits.
Under DSHS, traits classified in the first order (EASP, SG, PASP and ASI) explained 88% of the total variation in GY of the maize accessions (Figure 5). Each of these traits had direct negative contribution to GY with EASP being the highest contributor (−0.66). Seven traits, namely EPP, LF, AD, RL, HC, EHT and EAROT were categorized into the second order traits, each contributing to GY through one or two of the first order traits. Of the second order traits, EPP was found to have the highest negative indirect effect on GY through EASP (−0.69). Traits contributing to variation in GY through two or more of the second order traits included TB, SL, SD, and PLHT. Of these, TB contributed negatively to variation in GY through EPP (−0.35), AD (−0.26) while PLHT contributed positively to GY through EHT (0.62).

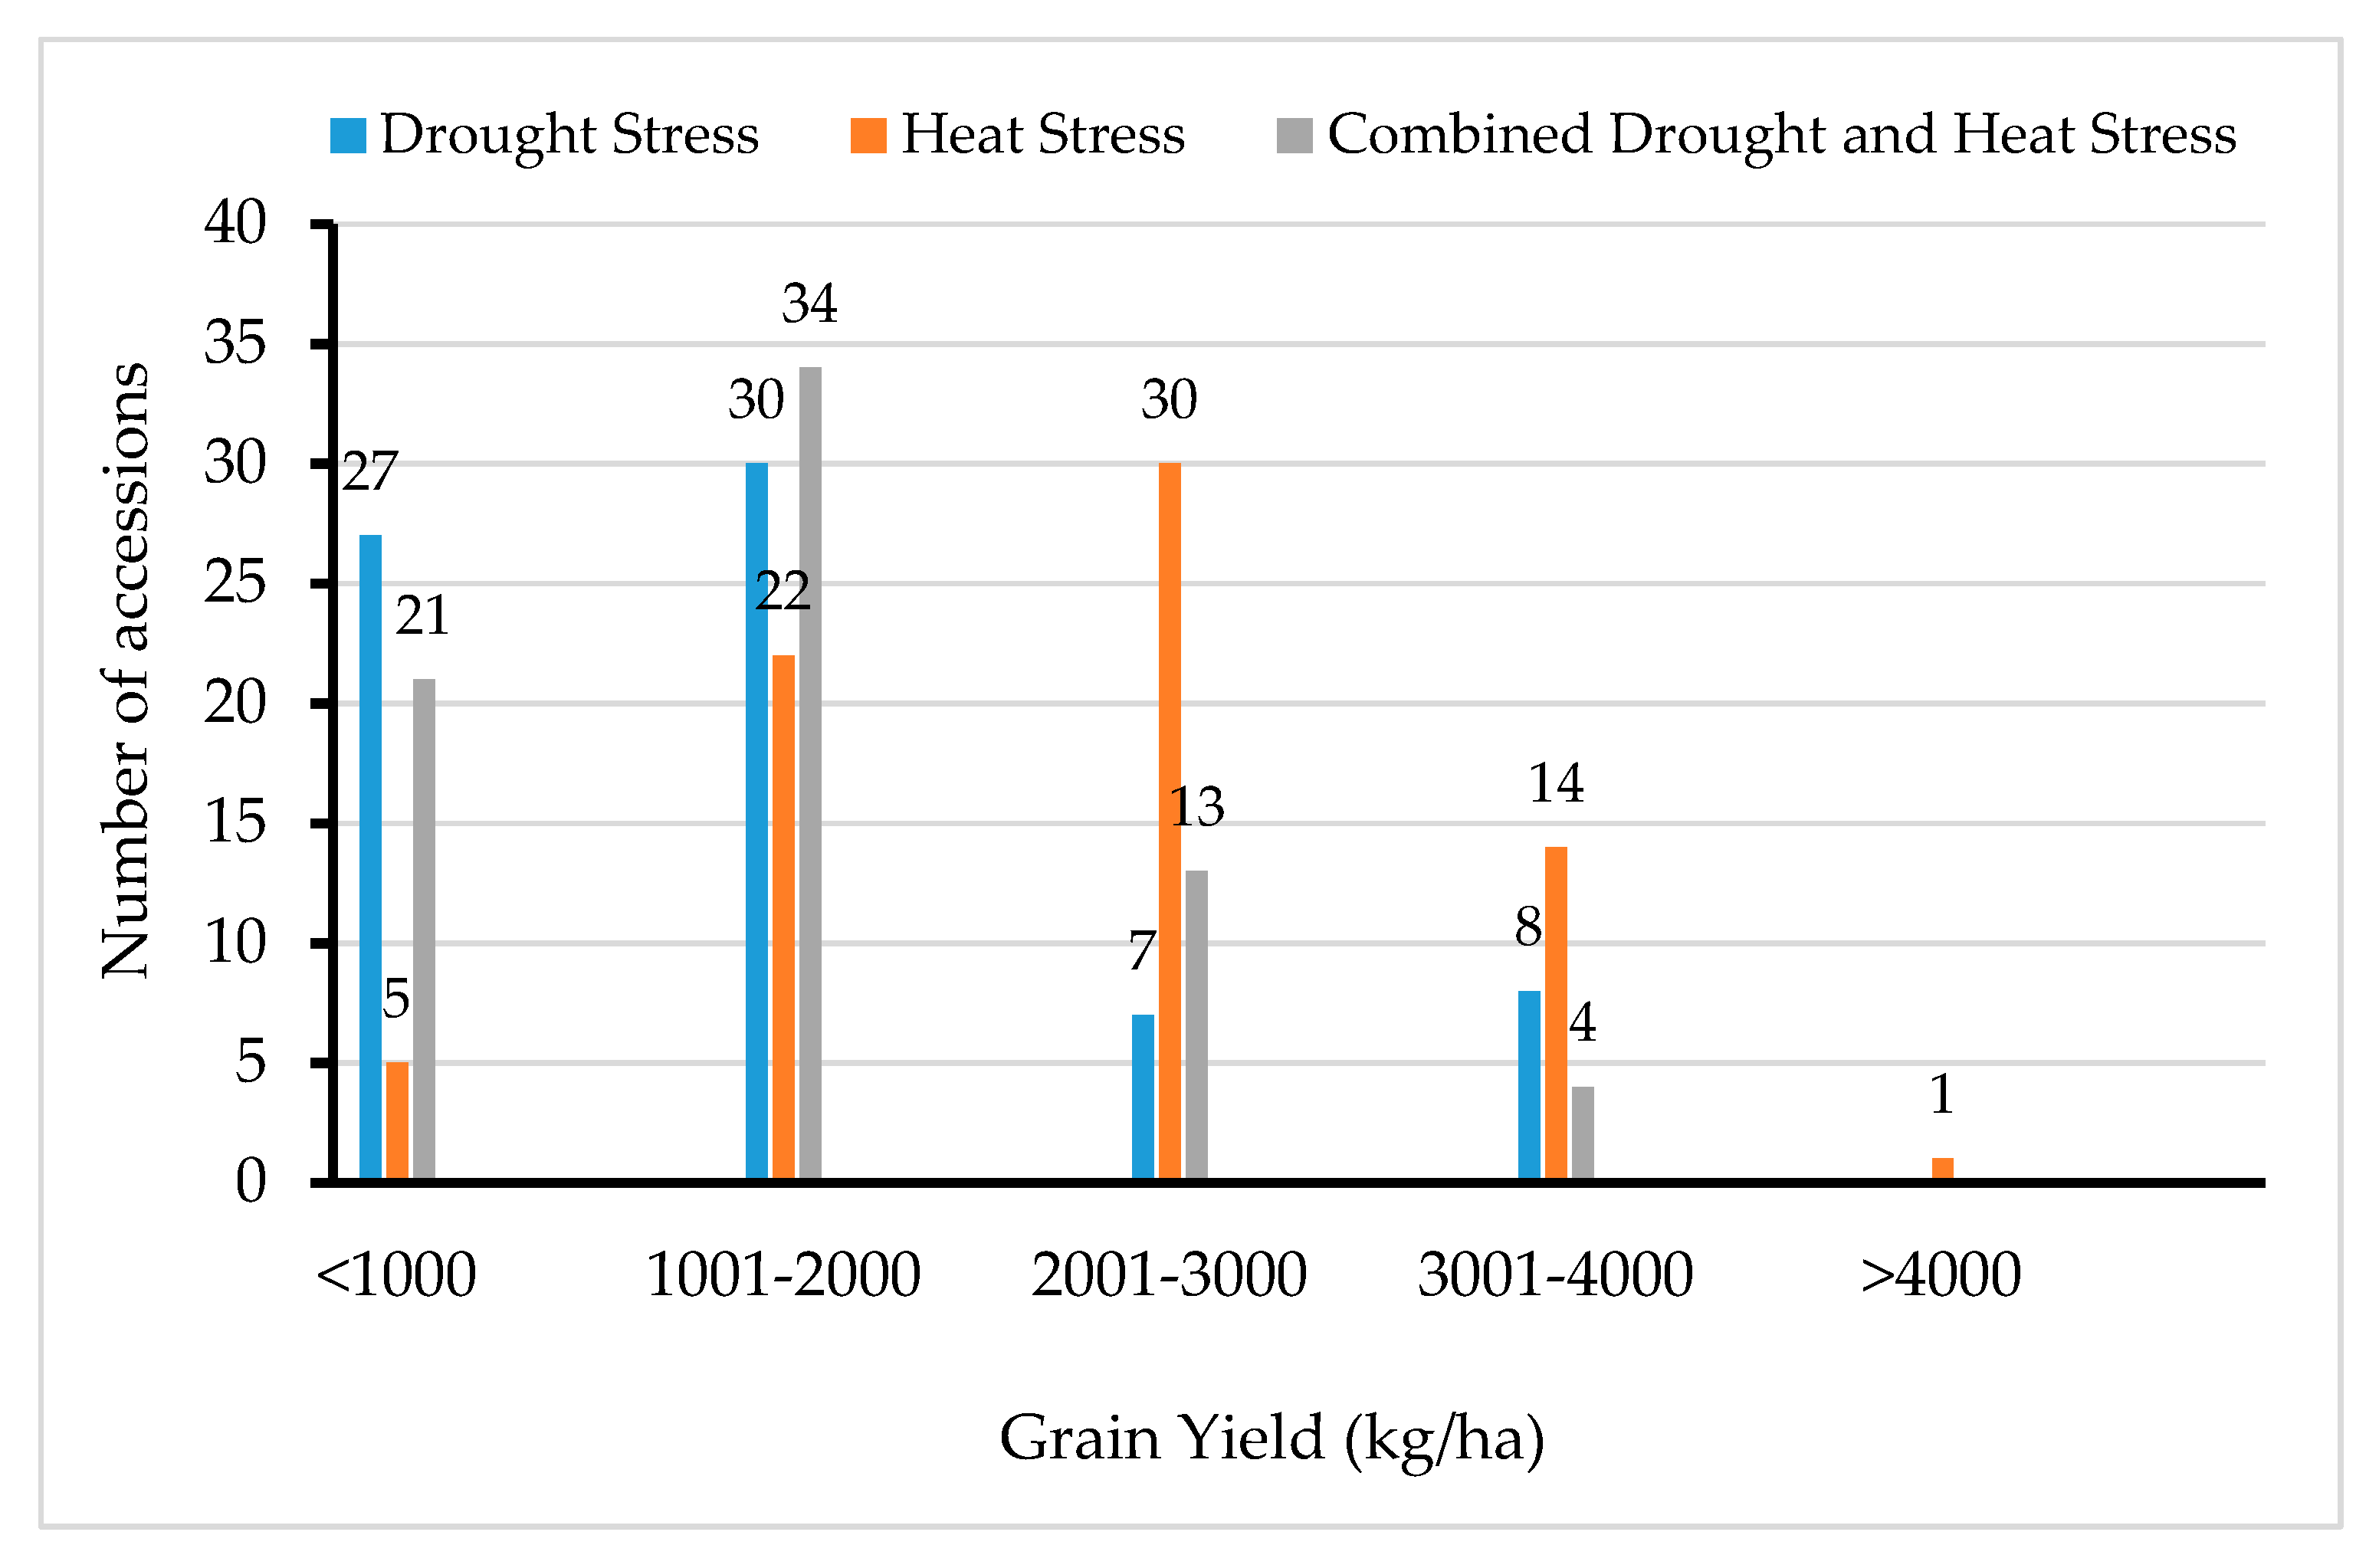
3.3. Performance of Accessions under the Contrasting Environment

The distribution of the accessions in terms of GY performance under the abiotic stresses is presented in Figure 6. Under DS, DSHS and HS, about 38%, 29% and 7% of the accessions yielded below 1000 kg/ha, respectively while about 47%, 42% and 31% of the accessions produced yields between 1001 to 2000 kg/ha under DSHS, DS, and HS, respectively. Whereas under HS, 42% of the maize accessions yielded between 2001–3000 kg/ha, only a small proportion of them produced yields between 2001–3000 kg/ha (9% under DS and 18% under DSHS). None of the landrace accessions yielded >4000kg/ha under any of the stresses.
Given that selection solely for GY potential under abiotic stress condition is considered inefficient for accelerating genetic gain [42], a base index that integrated GY with other important secondary traits (ASI, EPP, PASP, EASP, and SG) was used as criterion to select accessions tolerant to each of the stresses (accessions with positive BI values) as well as across the contrasting environments. Summary of the top accessions (best check, and 15 landraces) and worse five landraces identified by the base index under each research condition is presented in Table 5. Under DS, the BI values ranged from −10.6 for TZm−1510 (with GY of ~543 kg/ha) to 13.4 for the check 3-TZEE-W HDT C3 STR C5 (with GY of ~3863 kg/ha). Of the top 15 landrace accessions based on the BI values, four (TZm-1440, TZm-1163, TZm-1162, TZm-1500) yielded between 3000 and 3487 kg/ha, six (TZm-1486, TZm-1160, TZm-1508, TZm-1449, TZm-1472 and TZm-1159) yielded between 2000 kg/ha and 3000 kg/ha while the remaining yielded below 2000 kg/ha. All accessions with negative BI values yielded below 1000 kg/ha (Table 5).
Under HS, the BI values ranged from −12.29 for TZm-1498 (GY = 501 kg/ha) to 14.5 for the check5 -2014 TZEE-Y DTH STR (GY = 4723 kg/ha). All the top 15 landrace accessions based on the BI values yielded above 2500 kg/ha with TZm-1167, TZm-1157, TZm-1178, TZm-1163, and TZm-1179 yielding above 3500 kg/ha. As with DS, all accessions with negative BI values under HS yielded below 1000 kg/ha (Table 5).
Similarly, under DSHS, the BI values ranged from −11.3 for TZm-1173 (GY = 152 kg/ha) to 10.9 for check 4-TZEE-Y HDT C3 STR C5 (GY = 3899 kg/ha). Two of the top-yielding 15 landrace accessions identified by the BI (TZm-1486 and TZm-1162) yielded approximately 3000 kg/ha while TZm-1472, TZm-1440 and TZm-1470 yielded above 2300 kg/ha. The worse five landrace accessions under DSHS yielded below 500 kg/ha (Table 5).
Based on the BI values, seven landrace accessions (TZm-1159, TZm-1162, TZm-1163, TZm-1167, TZm-1472, TZm-1500 and TZm-1508) were tolerant to both DS and HS, eight (TZm-1160, TZm-1162, TZm-1167, TZm-1440, TZm-1472, TZm-1486, TZm-1496 and TZm-1508) were tolerant to both DS and DSHS. Only five landrace accessions (TZm-1167, TZm-1162, TZm-1472, TZm-1508 and TZm-1506) were tolerant to both HS and DSHS, while four (TZm-1162, TZm-1167, TZm-1472 and TZm-1508) showed good performance across all the individual and combined stresses.

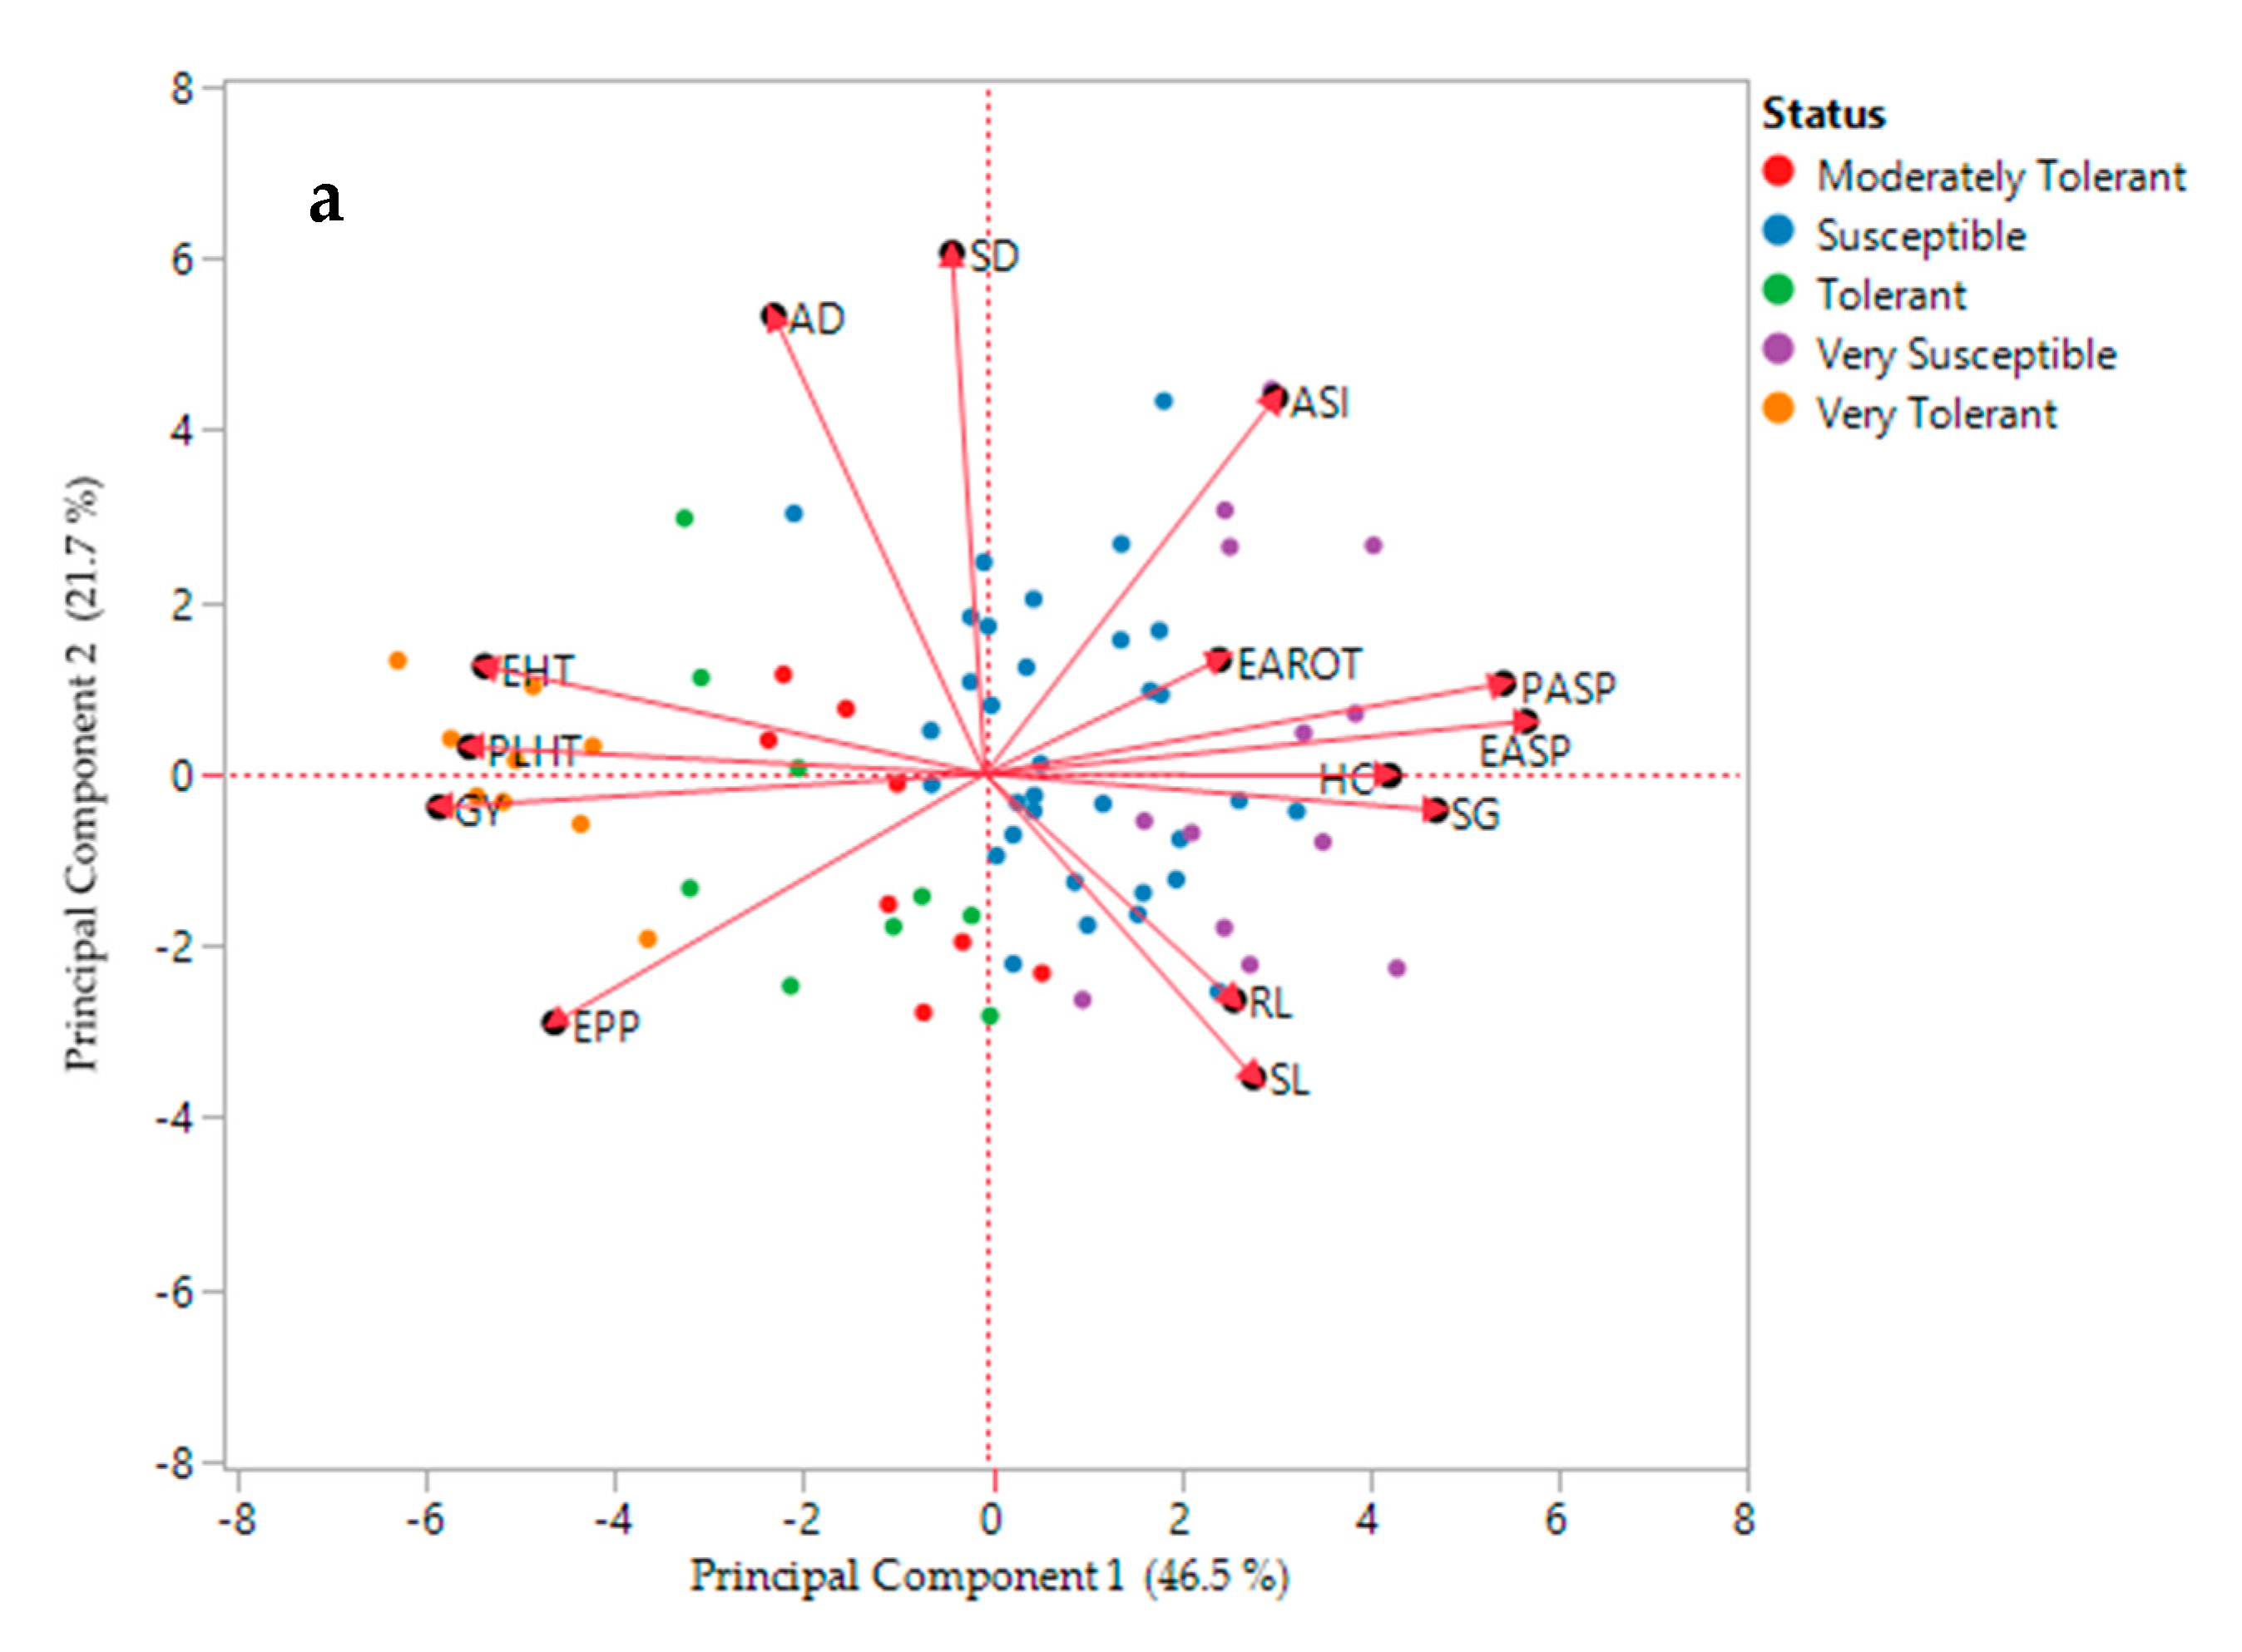
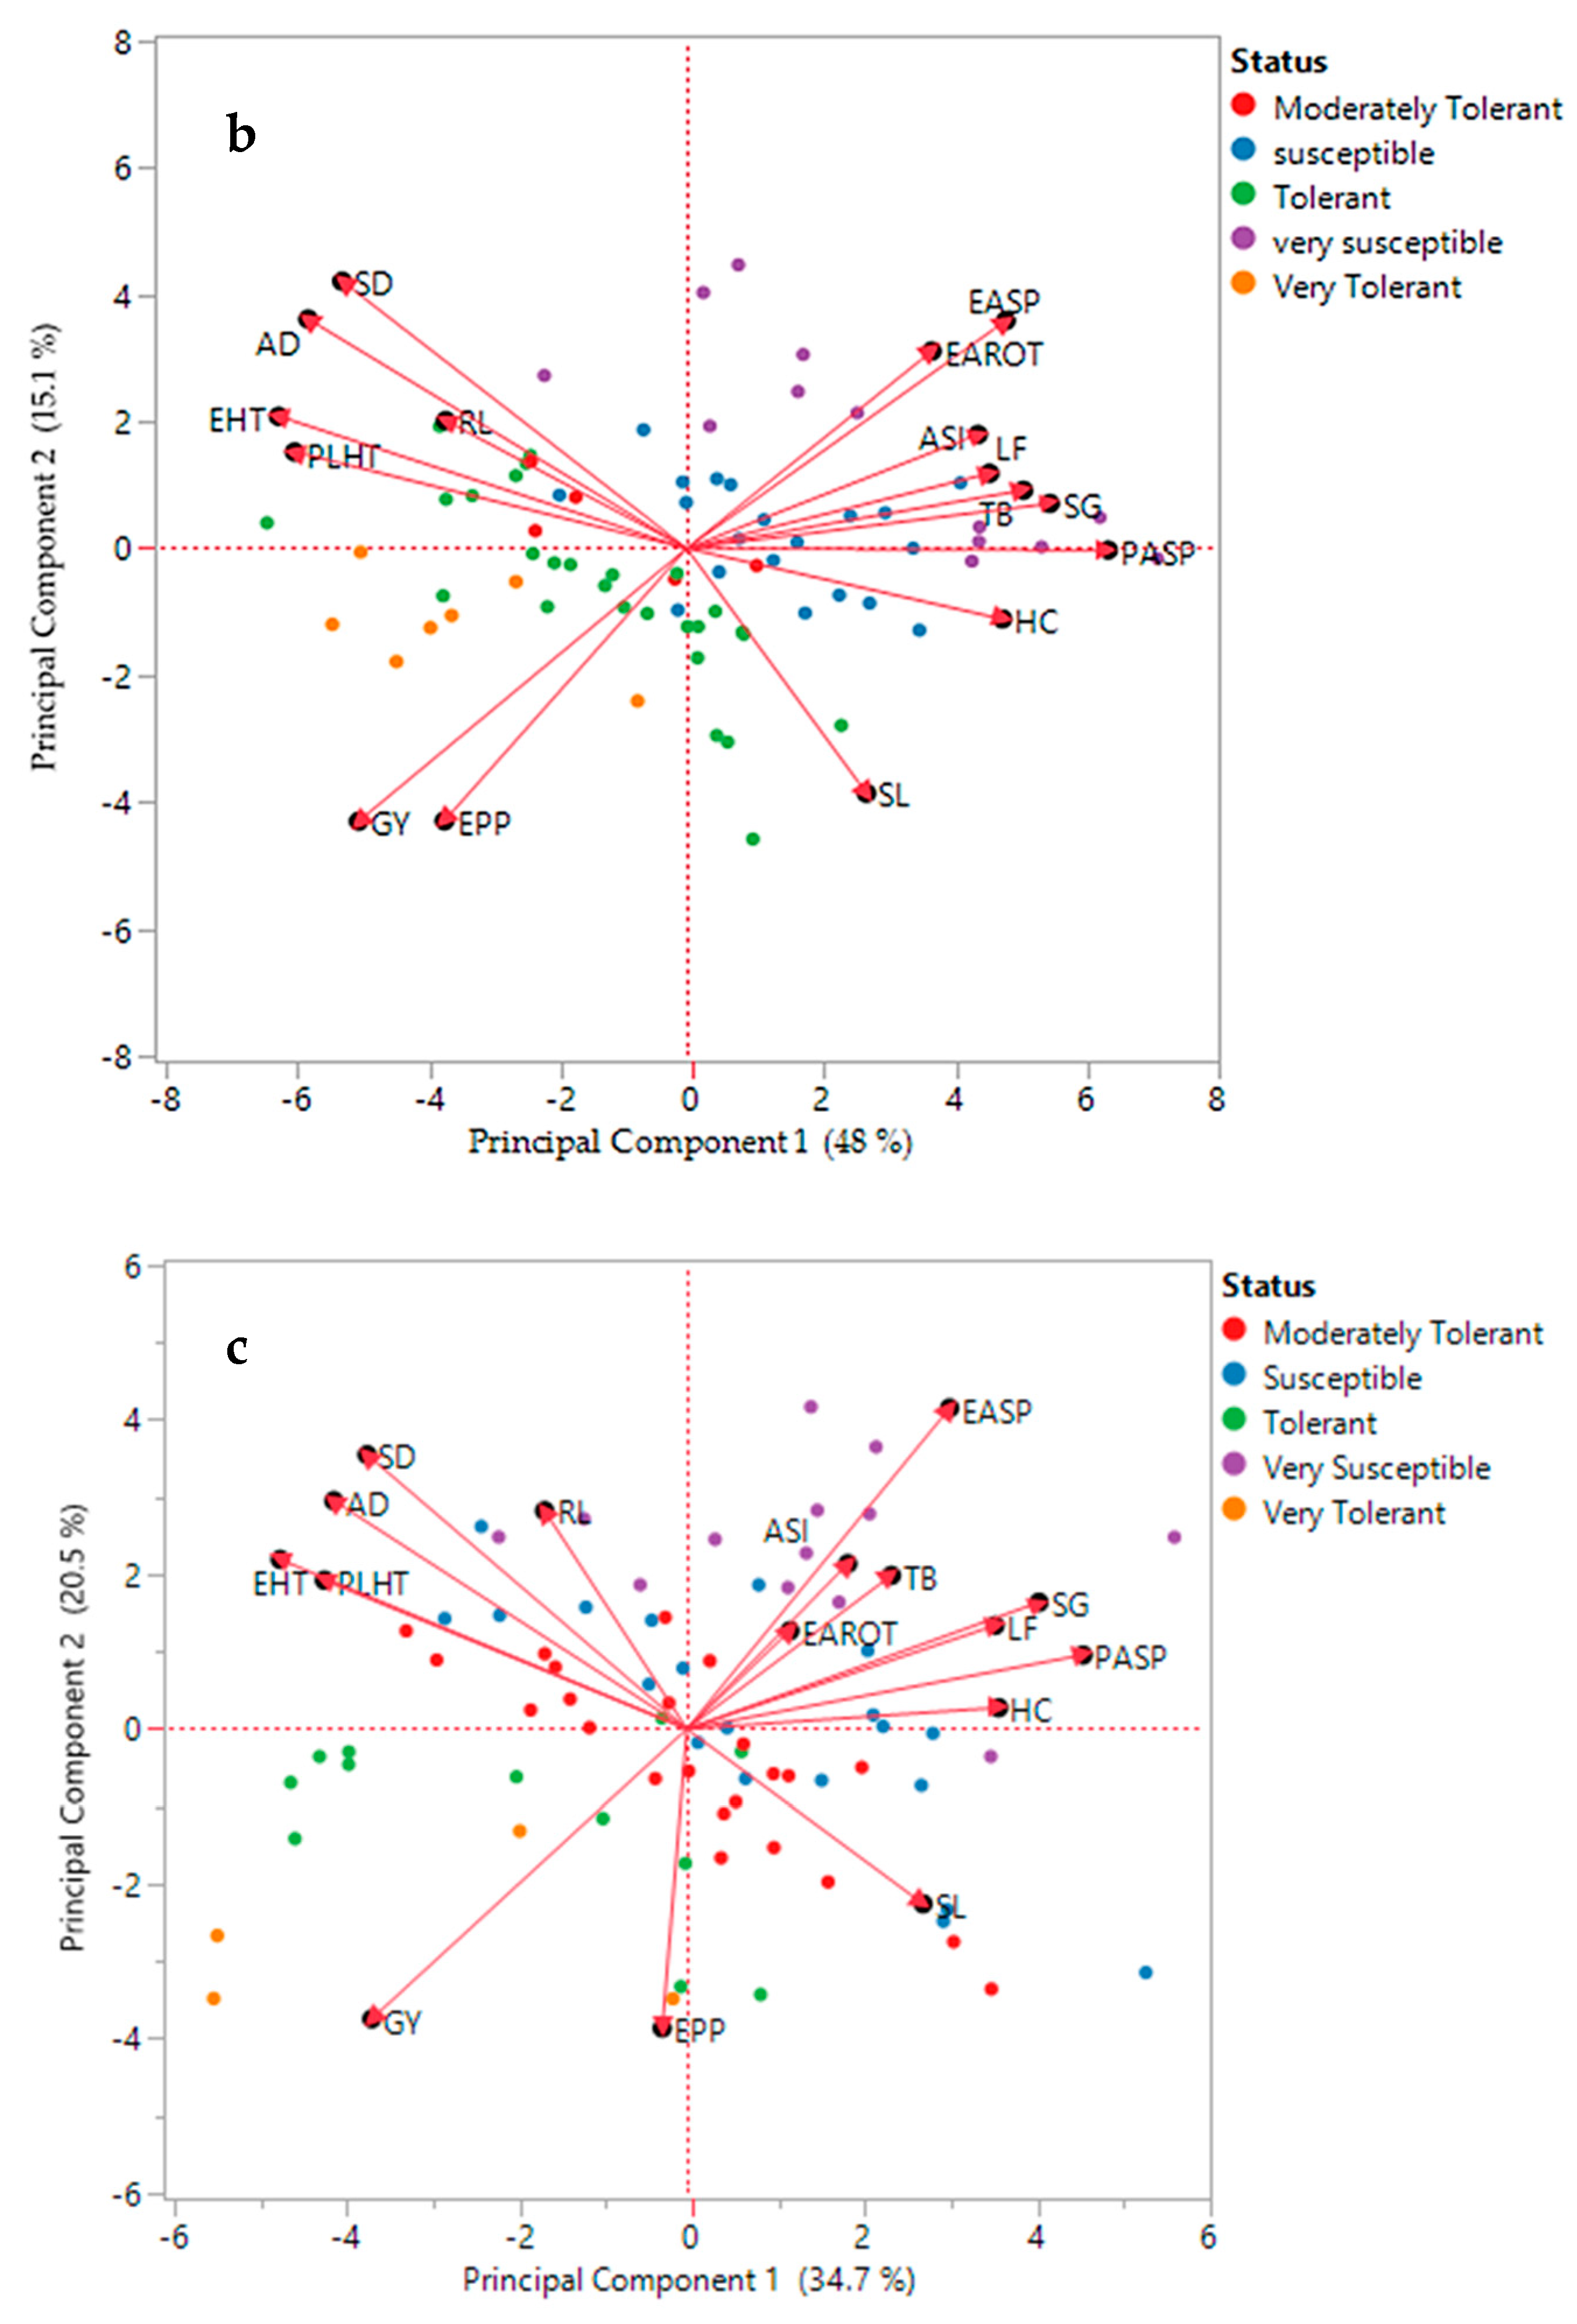
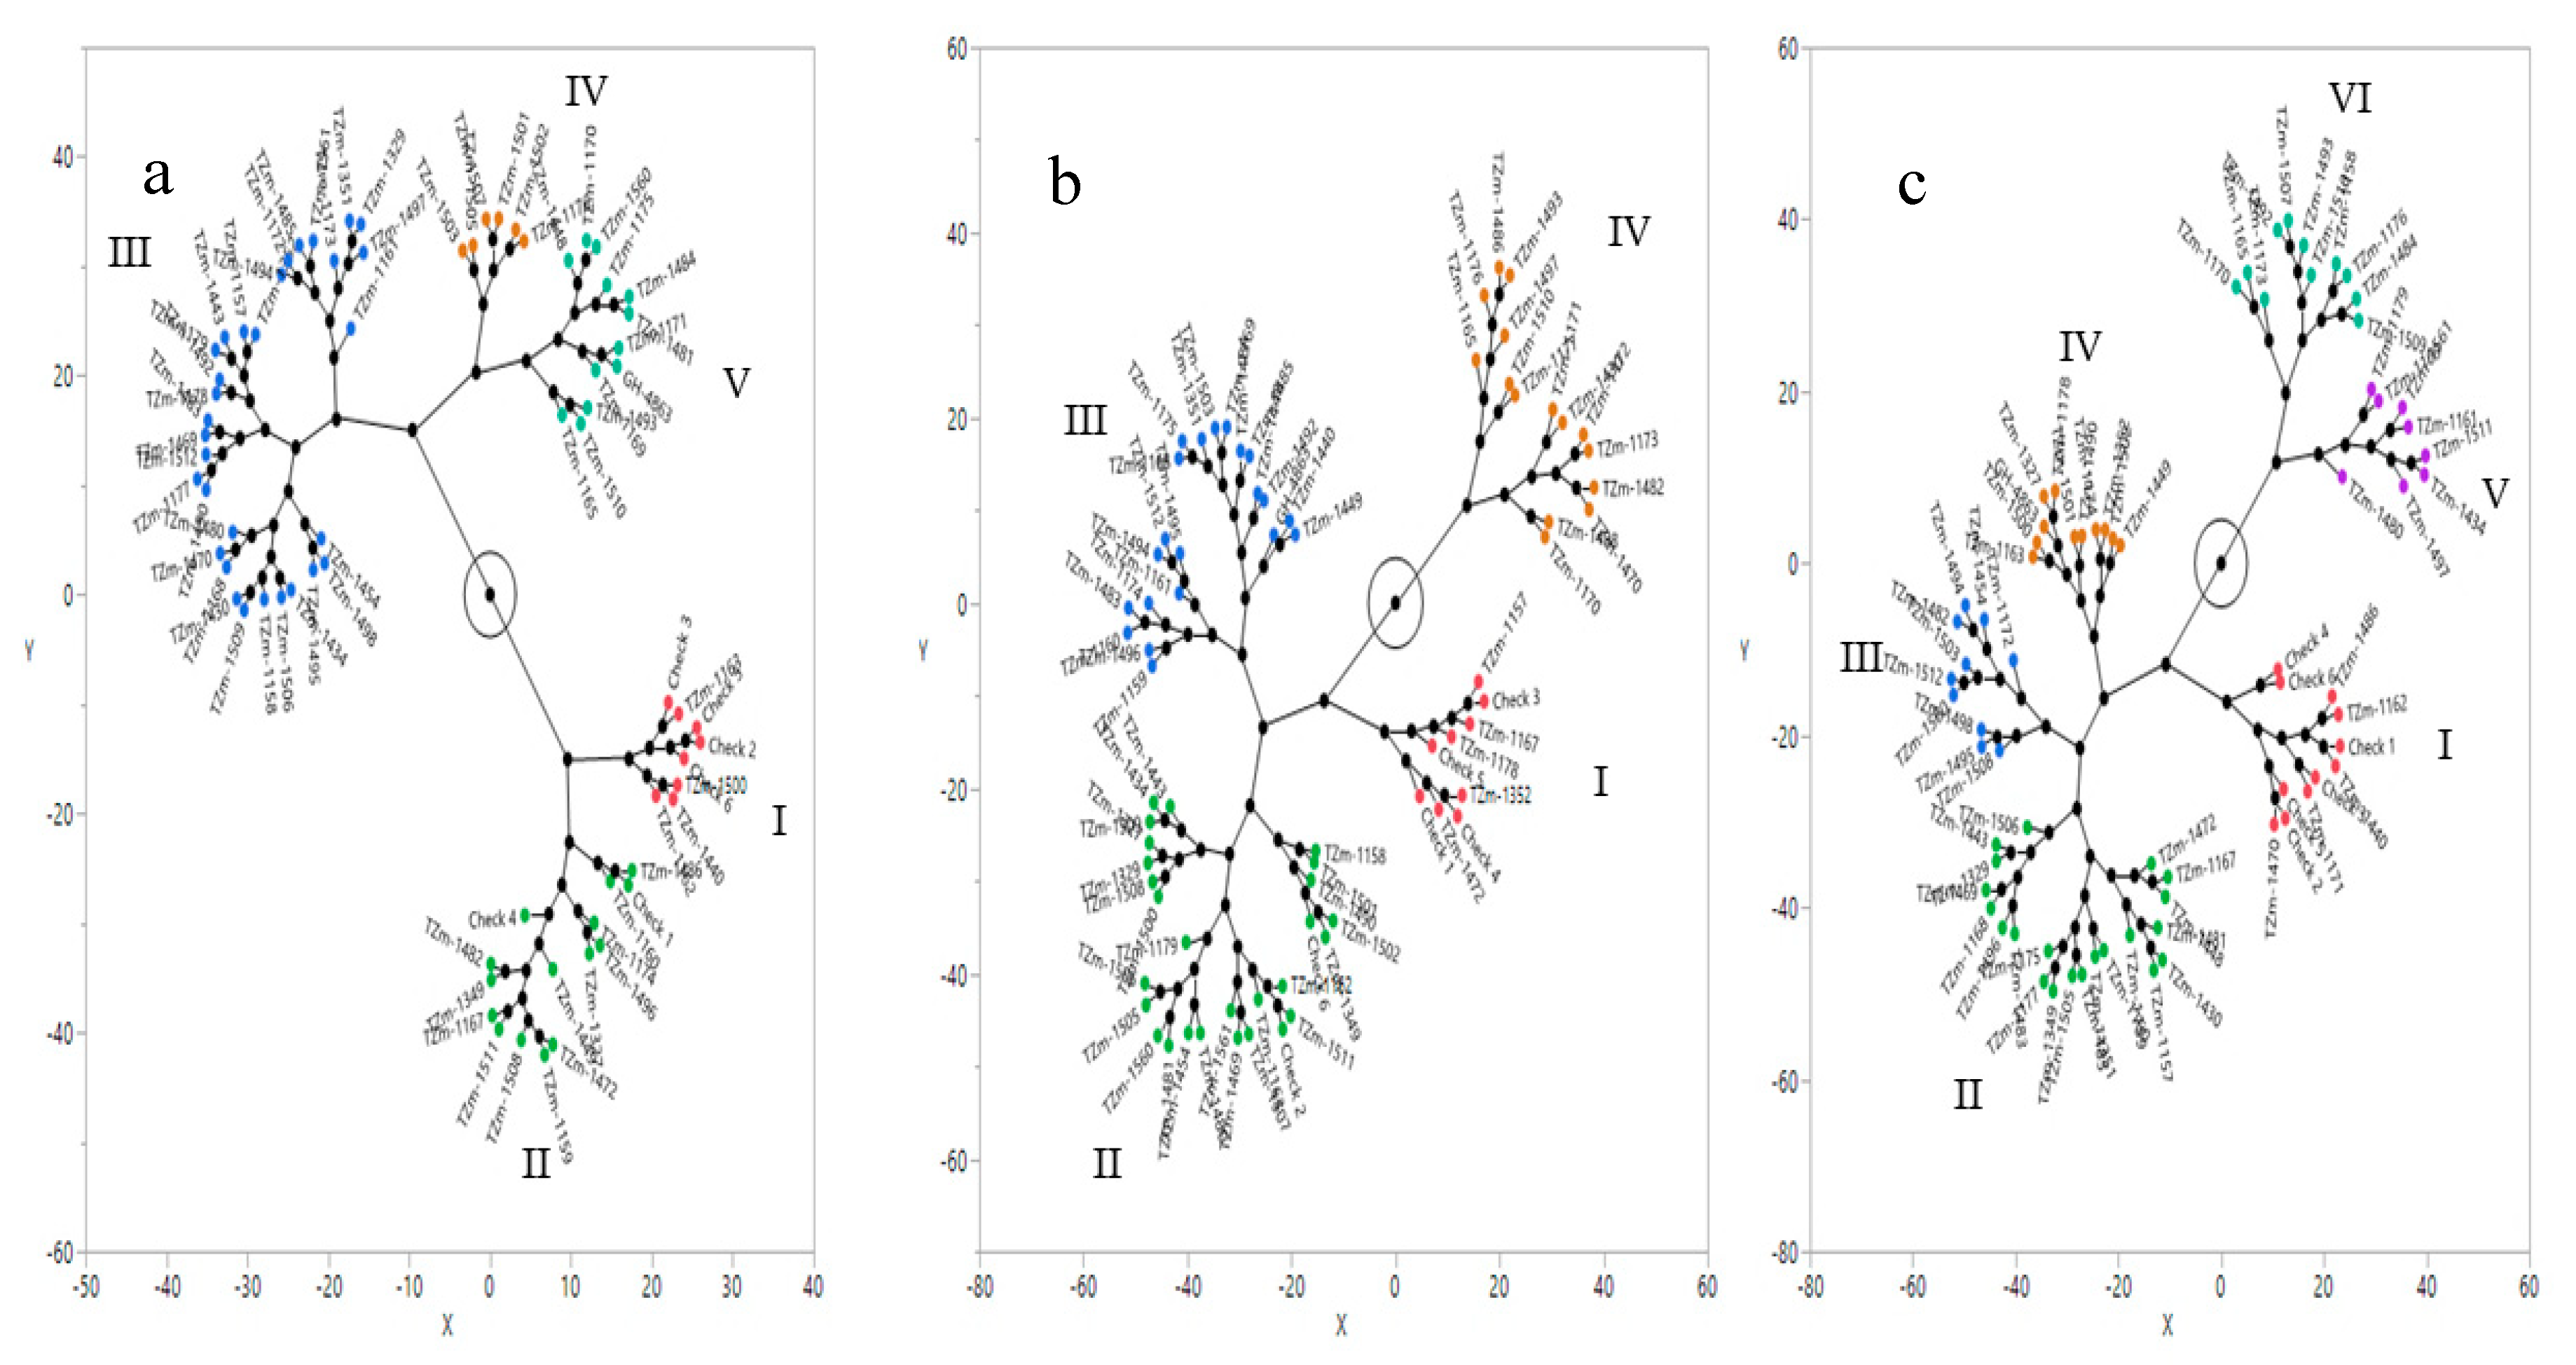
3.4. Principal Component Biplot and Cluster Analysis

The biplot of principal components 1 and 2 under the different treatment conditions are presented in Figure 7. Under DS, the PCA biplot explained ~68% of the total variability among the genotypes (Figure 7a), 63% under HS (Figure 7b) and 55% under DSHS (Figure 7c). Under each stress condition, tolerant to very tolerant accessions were largely located in the lower left of the plot and were mainly associated with increased GY and EPP whiles their susceptible to very susceptible counterparts, which were characterized by increased ASI, LF, TB, SG, RL, and SL, poor HC, EASP, and PASP, and to some extent increased AD, and SD were found sparingly distributed in the upper and lower right sides of the biplot. The strong positive correlation between GY and EPP was evident by the acute angle between their respective vectors of similar length. Similarly, the negative correlation between GY and ASI, LF, TB, SG, RL, SL, HC, EASP, and PASP can be seen from the opposite direction of the variable vectors.
Results of the regression of GY on TB showed that, largely accessions with high TB (%) had low grain yields (Figure 8). TB accounted for 15% and 28% of the yield reduction of the extra-early maize accessions under DSHS and HS, respectively.
Under DS, the phylogenetic constellation plot generated using GY and the secondary traits included in the index selection classified the 72 extra-early maize accessions into five major groups, each further divided into subgroups (Figure 9). The number of accessions in the major clusters ranged from six in cluster IV to 31 in cluster III. Accessions in cluster I and II were characterized by high GY (>2000 kg/ha), increased EPP (≥0.80), delayed senescence (average rating of 3), desirable PASP and EASP (4 to 5). Consequently, the average BI values of these groups were high (averaging, 11.72 for cluster I and 5.0 for cluster II) (Supplementary Table S3).
Similarly, under HS, the phylogenetic constellation plot separated the 72 accessions into five major clusters, with each further separated into sub-clusters that ranged from two in cluster I to four in cluster II (Figure 9). The first major cluster contained nine genotypes while the second consisted of 27 individuals. Individuals of the two clusters (I and II) were characterized by short ASI (2 to 3 days), good plant and ear aspect scores (4 to 5), and increased GY (>2800 kg/ha), hence the positive average BI values (9.73 for cluster I and 2.72 for II). Of the nine accessions in cluster I, five were landraces (TZm-1157, TZm-1167, TZm-1178, TZm-1352, and TZm-1472) and the other four were improved population checks. Accessions of the remaining clusters had very poor plant and ear aspect scores, reduced EPP, low GY and hence, negative BI values (Supplementary Table S3).
Under DSHS, six major groups of accessions were revealed by the phylogenetic constellation plot (Figure 9). The number of individuals in the clusters varied from eight in cluster IV to 21 in cluster II. The first major group consisted of nine accessions, including four checks, and five landrace accessions (TZm-1486, TZm-1162, TZm-1440, TZm-1171, and TZm-1470). The accessions of this group displayed desirable plant and ear aspect scores, and had good ears per plant and GY, which was reflected in their high positive index values (Supplementary Table S3). The second major group comprised accessions with good plant and ear aspect scores and had relatively good ears per plant, moderate grain yield as well as positive index values. The remaining four clusters contained accessions that recorded poor plant and ear aspect scores, reduced ears per plant, low GY, and negative BI values (Supplementary Table S3).

4. Discussion

Frequent occurrence of extreme weather conditions owing to global climate change has heightened the need for genetic improvement of major staple crops for tolerance to abiotic stresses. However, as selection pressure increases for a specific trait, genetic variability inevitably decreases [43], leading to reduced breeding gains. This is particularly true for tropical maize in which little additional gain in maximum drought-tolerance has been achieved in the last decade [29]. Addressing this issue and hence, ensuring progress in genetic improvement of maize under abiotic stress conditions requires identification of donor lines with beneficial traits that will bring new genetic variation [29,44]. Landrace gene pools of maize from areas that frequently experience DS at elevated temperatures may provide a useful source of novel alleles for abiotic stress tolerance [27,45]. In the present study, we evaluated 66 extra-early landrace accessions of maize representing gene pools from Burkina Faso, Ghana, and Togo, together with six abiotic stress-tolerant populations from the IITA-MIP under field conditions of DS, HS and DSHS imposed at the reproductive stages of crop growth and development for two years.
As shown in Figure 1, the HS trials were performed under high temperatures, while the DSHS trials were exposed to prolonged DS at elevated temperatures. In particular, temperatures during flowering and early grain-filling stages substantially exceeded the optimal threshold for lowland tropical maize (34 °C during the day and 23 °C at night; Figure 2) with no incidence of rainfall, indicating that the sites selected for this study were appropriate for screening the maize accessions for tolerance to HS and DSHS. These sites were used for screening maize for high levels of tolerance to DS and/or HS in earlier studies [13,18,19].
The presence of significant genotypic differences for all measured traits of the maize accessions under DS, HS, and DSHS conditions suggested that superior genotypes and traits conferring tolerance to the stresses could be identified and selected. Even though highly significant statistical differences were detected among genotypes, genotype × environment interaction was not significant for most traits indicating that the environments were similar in stress severity. This observation could be attributed to the coincidence of the imposed stresses at stages most critical for growth and development of the maize accessions. Moreover, the high repeatability estimates observed for majority of the measured traits including GY indicated that most of the variances observed in the present study can be attributed to differences among the studied accessions. These observations largely provided credibility in the performance of the accessions for breeding purposes. Low repeatability estimates across sites for some measured traits were probably the result of inconsistent expressions as indicated by high genotype × environment variance. Similar findings were reported in maize under multiple stresses [19,29].
In agreement with previous studies [19], the wide range of variation in GY losses observed in this study indicated that indeed the applied stresses were severe and that the yield levels observed could be attributed to stress tolerance. Compared with the NS environment, HS, DS, and DSHS, on the averaged reduced GY by ~23%, 49%, and 58%, respectively (Table 1 and Table 2), suggesting that the effect of the combined stresses on GY of the extra-early maize accessions was higher than the individual effects but lower than their sum (hypo-additive effect). These results corroborated the findings of earlier workers who reported higher yield losses from the combined effects of DS and HS than DS and HS applied alone in cereals including maize [17,19,29,46]. The high GY loss under DSHS compared to HS and DS could be attributed to the interaction effects of HS and DS on stomatal movements [46]. Stress-induced changes in morpho-physiological properties of the maize accessions might have caused osmotic imbalances under DSHS, resulting in the high yield losses. Under DS at elevated temperatures, plants either close their stomata to prevent water loss or keep stomata opened to cool the leaves through transpiration [46]. The long delay in anthesis and silking (by ≥8 days) under HS and DSHS was most likely the result of severe cold stress due to harmattan at the time of planting, that might have delayed seed emergence and extended pre-flowering developmental stages. Reduction in plant and ear heights were on the average, higher under DS (26%) compared to HS (6%) and DSHS (7%). These results suggested the occurrence of DS during the early stages of growth and development of the maize accessions and that the plants were only affected by HS and DSHS towards the end of the vegetative phase. Indeed, in the present study, DS was imposed at the early growth stages (25 DAP) compared to the HS and DSHS, which had the treatments imposed at 32 DAP. Under DS and DSHS, the number of ears per plant were strongly reduced (26%) relative to HS conditions, and this might have contributed to the high yield losses observed under DS (49%) and DSHS (58%) compared to HS (23%). This was further evident from the strong association of EPP and GY with the high yielding accessions as revealed by the PCA biplot analysis (Figure 7).
Grain yield measured under NS conditions was to some extent predictive of the performance under the applied stresses as indicated by the correlations across the treatments, suggesting that similar physiological mechanisms may be conditioning yield potential under NS and DS, HS and DSHS conditions. These observations, in part agreed with the results of previous studies [18,29]. The correlation between GY under NS and DS (0.66) observed in this study is similar to that (0.63) reported by Cairns et al. [29] but slightly lower than that (0.75) recorded by Meseka et al. [18]. In the present study, the moderately strong positive correlation between GY under DS and DSHS (r = 0.60; p < 0.0001) relative to DS and HS (r = 0.48; p < 0.001) as well as HS and DSHS (r = 0.37; p < 0.001) suggested that while yield performance under DS was predictive of attainable yield under DSHS, tolerance to HS was independent of tolerance to DS and DSHS in the extra-early maize accessions. Cairns et al. [29] suggested that tolerance to combined DS and HS in maize was genetically distinct from tolerance to the individual stresses, and tolerance to either stress alone did not confer tolerance to DSHS conditions. Similarly, Meseka et al. [18] found that tolerance to DS was independent of tolerance to DSHS. The discrepancy between our results and those of Cairns et al. [29] and Meseka et al. [18] particularly for the mechanism of DS and DSHS tolerance could be attributed to differences in maturity classes of the genetic materials investigated. Cairns et al. [29] evaluated early, intermediate and late maturing inbred lines while Meseka et al. [18] assessed drought-tolerant three-way cross maize hybrids, and a local variety that were intermediate to late maturing as compared to the present study where extra-early maturing maize accessions were studied. The strong correlations observed between the measured traits under the different treatments implied the presence of common genetic elements regulating the expression of these traits under the research conditions. The negative genetic correlations observed between phenology and GY, PASP, EASP and HC under DS, HS and DSHS indicated that early flowering was associated with higher GY and desirable PASP, EASP, and HC, which might have contributed resilience to the stresses.
It is widely acknowledged that selection for increased GY together with highly heritable secondary traits can lead to remarkable progress in genetic gains under abiotic stress conditions [42]. For example, significant genetic gains were reported under low nitrogen stress and DS by complementing selection for GY potential with key secondary traits [47]. In the present study, sequential multiple regression analysis identified EASP, PASP, SL, and SG, and to some extent, EPP, and LF as the principal determinants of GY, explaining more than 80% of the differences in GY levels observed under the different stresses (Figure 3, Figure 4 and Figure 5). This together with the moderate to high repeatability estimates of these traits indicated their potential to improve selection efficiency for GY under the abiotic stresses. Regression of TB on GY revealed that TB accounted for 15% and 25% of the yield reduction of the maize accessions under DSHS and HS conditions, respectively (Figure 8). Reduction in GY by 28% was attributed to TB under DSHS [18].
To allow efficient identification and selection of accessions tolerant to the stresses, we used a base index that integrated superior grain yield, EPP, anthesis-silking interval, plant and ear aspects, and the stay-green characteristic under each applied stress [38]. Promising accessions were identified, most of them tolerant to the individual stresses (Table 4). The tolerant landraces might contain novel resistance genes or combinations of resistance gene that would be valuable for ‘climate smart’ maize breeding efforts. In particular, eight landrace accessions were tolerant to DS and DSHS. Only five landrace accessions performed well across HS and DSHS, while four more accessions namely, TZm-1162, TZm-1167, TZm-1472, and TZm-1508 had outstanding performance across the three stresses. Therefore, development of lines from accessions that performed well across the stresses might be a successful strategy for abiotic stress tolerance maize breeding since hybrids resulting from the combination of the parents can have high performance for both DS and HS. The fact that only four accessions were tolerant across all the stresses was most likely the result of different physiological and morphological mechanisms conditioning tolerance to the three stresses applied in this study. Therefore, it is important to evaluate maize germplasm under each abiotic stress separately.
The genetic relationships/relatedness among germplasm under abiotic stress conditions are extremely important in determining specific groups of accessions that have good levels of tolerance to a specific stress. Herein, GY and stress adaptive secondary traits included in the base index selection were used to examine these relationships. The aggregation of the genotypes into four or more clusters under each stress further highlighted the potential of the landrace accessions to provide new genetic variation for abiotic stress tolerance in maize. In agreement with previous studies [18,19,48], cluster analyses showed a clear distinction between tolerant accessions and their susceptible counterparts. Under each stress condition, the highly tolerant landrace accessions clustered together with the most tolerant drought and/or heat-tolerant checks. This result suggested that the outstanding landraces and the resistant check cultivars were genetically similar. Majority of the outstanding landraces originated from Burkina Faso (a Sahel country). Thus, natural and artificial selection under the drier and hotter climatic conditions of the Sahel might have resulted in the excellent levels of abiotic stress resistance in these landraces. This observation provided further evidence that the superior landrace accessions identified in this study might contain novel resistance genes or combinations of resistance gene that could be valuable for expanding genetic base and thus, enhancing genetic gains in maize under the abiotic stress conditions.

5. Conclusions

This study uncovered striking levels of abiotic stress tolerance diversity among the extra-early landrace maize accessions, and identified traits potentially associated with tolerance to the stresses. Drought and heat stress, either individually or combined had significant negative effect on grain yield and other morpho-physiological traits of the maize accessions. Plant and ear aspects, stay green, lodging, leaf firing, and ears per plant were key to increased yield potential under the applied stresses. The performance pattern of the superior landrace accessions was similar to those of the best drought and/or heat-tolerant populations under DS, HS, and DSHS conditions. Therefore, they may be interesting for the development of germplasm tolerant to the stresses in SSA. In particular, accessions TZm-1162, TZm-1167, TZm-1472, and TZm-1508 showed good adaptation to the three stress. These landraces should be prioritised for further improvement of key adaptive traits and their introgression into maize breeding programs in SSA can play a considerable role in addressing the effects of drought and heat stress on maize. Extensive screening for abiotic stress tolerance in extra-early landrace accessions of maize should be undertaken to unearth further sources of tolerance.

Supplementary Materials

The following are available online at https://0-www-mdpi-com.brum.beds.ac.uk/2073-4395/10/3/318/s1, Table S1: List of the 72 extra-early maize accessions evaluated for tolerance to drought, heat, and combined drought and heat stress between 2017 and 2019 at Ikenne and Kadawa, Nigeria. Table S2: Genotypic and residual variance, and broad-sense heritability estimates of grain yield (kg/ha) of individual trials. Table S3: Cluster means (base index values and other secondary traits) of 72 extra-early maize accessions evaluated under non stress, drought, heat stress, and combined drought and heat stress conditions between 2017 and 2019, in Nigeria. Table S4: List of abbreviations and their explanations. Figure S1: Susceptible genotype (left) showing symptoms of leaf firing and tassel blasting under drought stress at elevated temperature at Kadawa, Nigeria. Figure S2: Ear aspect rating (plot basis) of extra-early maize accessions evaluated under heat stress conditions between 2017 and 2019 at Kadawa, Nigeria.

Author Contributions

Conceptualization: A.S.-P.N. and A.Y.T.; Methodology: C.N., B.B.-A. and A.L.G.-O.; Supervision: B.B.-A., A.S.-P.N., A.Y.T. and A.L.G.-O.; Data analysis and manuscript draft: C.N.; Manuscript review and editing, B.B.-A., A.Y.T., A.S.-P.N. and A.L.G.-O. All authors have read and agreed to the published version of the manuscript.

Funding

This research was financed by the German Federal Ministry of Education, through the West African Science Service Centre on Climate Change and Adapted Land-use (WASCAL) and, in part by the Bill & Melinda Gates Foundation [OPP1134248] through the funding support to the Stress Tolerant Maize for Africa (STMA) Project.

Acknowledgments

The first author is grateful to WASCAL for the PhD fellowship. We are grateful to the Genetic Resource Centre at IITA, Ibadan, Nigeria and the Plant Genetics Resources Institute at Bunso, Ghana for providing the maize accessions used in this study.

Conflicts of Interest

The authors declare no conflicting interest.

References

  1. McCann, J.C. Maize and Grace: Africa’s Encounter with a New World Crop, 1500–2000; Harvard University Press: Cambridge, MA, USA, 2005. [Google Scholar]
  2. Warburton, M.L.; Reif, J.C.; Frisch, M.; Bohn, M.; Bedoya, C.; Xia, X.C.; Crossa, J.; Franco, J.; Hoisington, D.; Pixley, K.; et al. Genetic diversity in CIMMYT non-temperate maize germplasm: Landraces, open pollinated varieties, and inbred lines. Crop Sci. 2008, 48, 617–624. [Google Scholar] [CrossRef] [Green Version]
  3. Abate, T.; Fisher, M.; Abdoulaye, T.; Kassie, G.T.; Luduka, R.; Marenya, P.; Asnake, W. Characteristics of maize cultivars in Africa: How modern are they and how many do smallholder farmers grow? Agric. Food Secur. 2017, 6, 30. [Google Scholar] [CrossRef] [Green Version]
  4. Edmeades, G.O.; Trevisan, W.; Prasanna, B.M.; Campos, H. Tropical maize (Zea mays L.). In Genetic Improvement of Tropical Crops; Campos, H., Caligari, P.D.S., Eds.; Springer: Cham, Switzerland, 2017; pp. 57–109. [Google Scholar]
  5. Wu, X.; Wang, A.; Guo, X.; Liu, P.; Zhu, Y.; Li, X.; Chen, Z. Genetic characterization of maize germplasm derived from Suwan population and temperate resources. Hereditas 2019, 156, 2. [Google Scholar] [CrossRef]
  6. Singh, S.; Vikram, P.; Sehgal, D.; Burgueño, J.; Sharma, A.; Singh, S.K.; Sansaloni, C.P.; Joynson, R.; Brabbs, T.; Ortiz, C.; et al. Harnessing genetic potential of wheat germplasm banks through impact-oriented-prebreeding for future food and nutritional security. Sci. Rep. 2018, 8, 12527. [Google Scholar] [CrossRef] [Green Version]
  7. Masuka, B.P.; van Biljon, A.; Cairns, J.E.; Das, B.; Labuschagne, M.; MacRobert, J.; Olsen, M. Genetic diversity among selected elite CIMMYT maize hybrids in East and Southern Africa. Crop Sci. 2017, 57, 2395–2404. [Google Scholar] [CrossRef] [Green Version]
  8. Edenhofer, O. (Ed.) Climate Change 2014: Mitigation of Climate Change; Cambridge University Press: Cambridge, UK, 2015; p. 3. [Google Scholar]
  9. Muller, C.; Cramer, W.; Hare, W.L.; Lotze-Campen, H. Climate change risks for African agriculture. Proc. Natl. Acad. Sci. USA 2011, 108, 4313–4315. [Google Scholar] [CrossRef] [Green Version]
  10. Kurukulasuriya, P.; Mendelsohn, R.; Hassan, R.; Benhin, J.; Deressa, T.; Diop, M.; Eid, H.M.; Fosu, K.Y.; Gbetibouo, G.; Jain, S.; et al. Will African agriculture survive climate change? World Bank Econ. Rev. 2006, 20, 367–388. [Google Scholar] [CrossRef] [Green Version]
  11. Cairns, J.E.; Hellin, J.; Sonder, K.; Araus, J.L.; MacRobert, J.F.; Thierfelder, C.; Prasanna, B.M. Adapting maize production to climate change in Sub-Saharan Africa. Food Secur. 2012, 5, 345–360. [Google Scholar] [CrossRef] [Green Version]
  12. Knox, J.; Hess, T.; Daccache, A.; Wheeler, T. Climate change impacts on crop productivity in Africa and South Asia. Environ. Res. 2012, 7, 034032. [Google Scholar] [CrossRef]
  13. Badu-Apraku, B.; Fakorede, M.A.B. Improvement of Early and Extra-Early Maize for Combined Tolerance to Drought and Heat Stress in Sub-Saharan Africa. In Advances in Genetic Enhancement of Early and Extra-Early Maize for Sub-Saharan Africa; Springer: Cham, Switzerland, 2017; pp. 311–358. [Google Scholar]
  14. Cicchino, M.; Rattalino-Edreria, J.I.; Uribelarrea, M.; Otegui, M.E. Heat stress in field-grown maize: Response of physiological determinants of grain yield. Crop Sci. 2011, 50, 1438–1448. [Google Scholar] [CrossRef]
  15. Zaidi, P.H.; Zaman-Allah, M.; Trachsel, S.; Seetharam, K.; Cairns, J.E.; Vinayan, M.T. Phenotyping for Abiotic Stress Tolerance in Maize Heat Stress: A Field Manual; CIMMYT: Mexico City, Mexico, 2016. [Google Scholar]
  16. Araus, J.L.; Serret, M.D.; Edmeades, G.O. Phenotyping maize for adaptation to drought. Front. Physiol. 2012, 3, 305. [Google Scholar] [CrossRef] [Green Version]
  17. NeSmith, D.S.; Ritchie, J.T. Effects of soil water-deficits during tassel emergence on development and yield components of maize (Zea mays L.). Field Crop Res. 1992, 28, 251–256. [Google Scholar] [CrossRef]
  18. Meseka, S.; Menkir, A.; Bossey, B.; Mengesha, W. Performance Assessment of Drought Tolerant Maize Hybrids under Combined Drought and Heat Stress. Agronomy 2018, 8, 274. [Google Scholar] [CrossRef] [Green Version]
  19. Nelimor, C.; Badu-Apraku, B.; Tetteh, A.Y.; N’guetta, A.S.P. Assessment of Genetic Diversity for Drought, Heat and Combined Drought and Heat Stress Tolerance in Early Maturing Maize Landraces. Plants 2019, 8, 518. [Google Scholar] [CrossRef] [Green Version]
  20. Bassu, S.; Brisson, N.; Durand, J.L.; Boote, K.; Lizaso, J.; Jones, J.W.; Basso, B. How do various maize crop models vary in their responses to climate change factors? Glob. Chang. Biol. 2014, 20, 2301–2320. [Google Scholar] [CrossRef]
  21. Wardlaw, I.F. Interaction between drought and chronic high temperature during kernel filling in wheat in a controlled environment. Ann. Bot. 2002, 90, 469–476. [Google Scholar] [CrossRef] [Green Version]
  22. Shah, N.H.; Paulsen, G.M. Interaction of drought and high temperature on photosynthesis and grain-filling of wheat. Plant Soil 2003, 257, 219–226. [Google Scholar] [CrossRef]
  23. Prasad, P.V.V.; Pisipati, S.R.; Momicilovic, I.; Ristic, Z. Independent and combined effects of high temperature and drought stress during grain filling on plant yield and chloroplast EF-Tu expression in spring wheat. J. Agron. Crop Sci. 2011, 197, 430–441. [Google Scholar] [CrossRef]
  24. Pradhan, G.P.; Prasad, P.V.V.; Fritz, A.K.; Kirkham, M.B.; Gil, B.S. Effects of drought and high temperature stress on synthetic hexaploid wheat. Funct. Plant Biol. 2012, 39, 190–198. [Google Scholar] [CrossRef]
  25. Heiniger, R.W. The Impact of Early Drought on Corn Yield; North Carolina State University: Raleigh, NC, USA, 2001. [Google Scholar]
  26. Dwivedi, S.L.; Ceccarelli, S.; Blair, M.W.; Upadhyaya, H.D.; Are, A.K.; Ortiz, R. Landrace germplasm for improving yield and abiotic stress adaptation. Trends Plant Sci. 2016, 21, 31–42. [Google Scholar] [CrossRef]
  27. Castro-Nava, S.; Ramos-Ortiz, V.H.; Reyes-Méndez, C.A.; Briones-Encinia, C.A.F.; López-Santillán, J.A. Preliminary field screening of maize landrace germplasm from northeastern Mexico under high temperatures. Maydica 2011, 56, 77–82. [Google Scholar]
  28. Gedil, M.; Menkir, A. An integrated molecular and conventional breeding scheme for enhancing genetic gain in maize in Africa. Front. Plant Sci. 2019, 10. [Google Scholar] [CrossRef] [PubMed]
  29. Cairns, J.E.; Crossa, J.; Zaidi, P.H.; Grudloyma, P.; Sanchez, C.; Araus, J.L.; Menkir, A. Identification of drought, heat, and combined drought and heat tolerant donors in maize. Crop Sci. 2013, 53, 1335–1346. [Google Scholar] [CrossRef] [Green Version]
  30. Alam, M.S.; Seetharam, K.; Zaidi, P.H.; Dinesh, A.; Vinayan, M.T.; Nath, U.K. Dissecting heat stress tolerance in tropical maize (Zea mays L.). Field Crop. Res. 2017, 204, 110–119. [Google Scholar] [CrossRef]
  31. Nelimor, C.; Badu-Apraku, B.; Nguetta, S.P.A.; Tetteh, A.Y.; Garcia-Oliveira, A.L. Phenotypic characterization of maize landraces from Sahel and Coastal West Africa reveals marked diversity and potential for genetic improvement. J. Crop Improv. 2019. [Google Scholar] [CrossRef]
  32. SAS Institute Inc. SAS User’s Guide: Statistics; Version 9.4; SAS Institute Inc.: Cary, NC, USA, 2017. [Google Scholar]
  33. Falconer, D.S.; Mackay, T.F.C. Introduction to Quantitative Genetics, 4th ed.; Longman: New York, NY, USA, 1996. [Google Scholar]
  34. Peterson, B.G.; Carl, P.; Boudt, K.; Bennett, R.; Ulrich, J.; Zivot, E.; Lestel, M.; Balkissoon, K.; Wuertz, D.; Peterson, M.B.G. Performance Analytics: Econometric Tools for Performance and Risk Analysis. R Package Version 1. Available online: https://cran.r-project.org/web/packages/PerformanceAnalytics/index.html (accessed on 15 August 2014).
  35. Cooper, M.; DeLacy, I.H.; Basford, K.E. Relationship among analytical methods used to analyse genotypic adaptation in multi-environment trials. In Plant Adaptation and Crop Improvement; Cooper, M., Hammer, G.L., Eds.; Cambridge University Press: Cambridge, UK, 1996; pp. 193–224. [Google Scholar]
  36. Vargas, M.; Combs, E.; Alvarado, G.; Atlin, G.; Mathews, K.; Crossa, J. META: A suit of SAS programs to analyse multi-environment breeding trials. Agron. J. 2013, 105, 11–19. [Google Scholar] [CrossRef] [Green Version]
  37. Mohammadi, S.A.; Prasanna, B.M.; Singh, N.N. Sequential path model for determining interrelationships among grain yield and related characters in maize. Crop Sci. 2003, 43, 1690–1697. [Google Scholar] [CrossRef]
  38. Badu-Apraku, B.; Akinwale, R.O.; Oyekunle, M. Efficiency of secondary traits in selecting for improved grain yield in extra-early maize under Striga-infested and Striga-free environments. Plant Breed. 2014, 133, 373–380. [Google Scholar] [CrossRef]
  39. Talabi, A.O.; Badu-Apraku, B.; Fakorede, M.A.B. Genetic variances and relationship among traits of an early-maturing maize population under drought-stress and low-N environments. Crop Sci. 2016, 57, 681–692. [Google Scholar] [CrossRef]
  40. Badu-Apraku, B.; Fakorede, M.A.B.; Talabi, A.O.; Oyekunle, M.; Akaogu, I.C.; Akinwale, R.O.; Annor, B.; Melaku, G.; Fasanmade, Y.; Aderounmu, M. Gene action and heterotic groups of early white quality protein maize inbreds under multiple stress environments. Crop Sci. 2015, 56, 183–199. [Google Scholar] [CrossRef]
  41. Statistical Package for Social Sciences (SPSS) Inc. SPSS Base 17.0 for Windows User’s Guide; SPSS Inc.: Chicago, IL, USA, 2007. [Google Scholar]
  42. Bolaños, J.; Edmeades, G.O. Eight cycles of selection for drought tolerance in lowland tropical maize. I. Responses in grain yield, biomass, and radiation utilization. Field Crop. Res. 1993, 31, 233–252. [Google Scholar] [CrossRef]
  43. Araus, J.L.; Kefauver, S.C.; Zaman-Allah, M.; Olsen, M.S.; Cairns, J.E. Translating high-throughput phenotyping into genetic gain. Trends Plant Sci. 2018, 23, 451–466. [Google Scholar] [CrossRef] [PubMed] [Green Version]
  44. Das, B.; Atlin, G.N.; Olsen, M.; Burgueño, J.; Tarekegne, A.; Babu, R.; Ndou, E.N.; Mashingaidze, K.; Moremoholo, L.; Ligeyo, D.; et al. Identification of donors for low-nitrogen stress with maize lethal necrosis (MLN) tolerance for maize breeding in sub-Saharan Africa. Euphytica 2019, 215, 80. [Google Scholar] [CrossRef] [Green Version]
  45. Gouesnard, B.; Zanetto, B.; Welcker, C. Identification of adaptation traits to drought in collections of maize landraces from southern Europe and temperate regions. Euphytica 2015, 209, 565–584. [Google Scholar] [CrossRef]
  46. Mahrookashani, A.; Siebert, S.; Hüging, H.; Ewert, F. Independent and combined effects of high temperature and drought stress around anthesis on wheat. J. Agron. Crop Sci. 2017, 203, 453–463. [Google Scholar] [CrossRef]
  47. Edmeades, G.O.; Bolaños, J.; Chapman, S.C.; Lafiite, H.R.; Bänziger, M. Selection improves drought tolerance in tropical maize populations. I. Gains in biomass, grain yield and harvest index. Crop Sci. 1999, 39, 1306–1315. [Google Scholar] [CrossRef]
  48. Tandzi, L.N.; Bradley, G.; Mutengwa, C. Morphological responses of maize to drought, heat and combined drought and heat stresses. J. Biol. Sci. 2019, 19, 7–16. [Google Scholar] [CrossRef] [Green Version]
Figure 1. Monthly average temperature and rainfall during the experimental period at Kadawa, Nigeria. Note: Dotted rectangles represent flowering and early grain filling stages. (a) Trial period in 2018 (b) Trial period in 2019.
Agronomy 10 00318 g001
Figure 2. Average temperature (night and day) at Kadawa during flowering and early grain filling in 2018 and 2019.
Agronomy 10 00318 g002
Figure 3. Path analysis diagram depicting the causal relationship of measured traits of the 72 maize accessions under drought-stressed conditions. Note: Value written in bold is the error effect; the direct path coefficients are values in parenthesis and other values are correlation coefficients. R1 is error effects, R2 = coefficient of determination. AD: Days to 50% anthesis; SD: Days to 50% silking; ASI: Anthesis-silking interval; PLHT: Plant height; EHT: Ear height; HC: Husk cover; EPP: Ears per plant; PASP: Plant aspect; EASP: Ear aspect; SG: Stay green characteristic; RL: Root lodging; SL: Stalk lodging; TB: Tassel blast; LF: Leaf firing; EAROT: Ear rot.
Agronomy 10 00318 g003
Figure 4. Path analysis diagram depicting the causal relationship of measured traits of the 72 maize accessions under heat stress conditions. Note: Values in bold are the error effect; the direct path coefficients are values in parenthesis and other values are correlation coefficients. R1 is error effects, R2 = coefficient of determination. AD: Days to 50% anthesis; SD: Days to 50% silking; ASI: Anthesis-silking interval; PLHT: Plant height; EHT: Ear height; HC: Husk cover; EPP: Ears per plant; PASP: Plant aspect; EASP: Ear aspect; SG: Stay green characteristic; RL: Root lodging; SL: Stalk lodging; TB: Tassel blast; LF: Leaf firing; EAROT: Ear rot.
Agronomy 10 00318 g004
Figure 5. Path analysis diagram depicting the causal relationship of measured traits of the 72 maize accessions under combined drought and heat stressed conditions. Note: Values in bold is the error effects; the direct path coefficients are values in parenthesis while other values are correlation coefficients. R1 is error effects, and R2 = coefficient of determination. AD: Days to 50% anthesis; SD: Days to 50% silking; ASI: Anthesis-silking interval; PLHT: Plant height; EHT: Ear height; HC: Husk cover; EPP: Ears per plant; PASP: Plant aspect; EASP: Ear aspect; SG: Stay green characteristic; RL: Root lodging; SL: Stalk lodging; TB: Tassel blast; LF: Leaf firing; EAROT: Ear rot.
Agronomy 10 00318 g005
Figure 6. Distribution of grain yield of 72 extra-early maize accessions evaluated under drought, heat and combined drought and heat stress conditions during 2017 and 2019 at Ikenne and Kadawa, Nigeria.
Agronomy 10 00318 g006
Figure 7. Biplot of 72 extra-early maize accessions and variables under drought (a), heat (b), and combined drought and heat stress (c) conditions. NB: The length of each variable vector is proportional to its contribution to total variation of the accessions, and the direction of the vector indicates its relative contribution to the principal components. AD: Days to 50% anthesis; SD: Days to 50% silking; ASI: Anthesis-silking interval; PLHT: Plant height; EHT: Ear height; HC: Husk cover; EPP: Ears per plant; PASP: Plant aspect; EASP: Ear aspect; SG: Stay green characteristic; RL: Root lodging; SL: Stalk lodging; TB: Tassel blast; LF: Leaf firing; EAROT: Ear rot.
Agronomy 10 00318 g007aAgronomy 10 00318 g007b
Figure 8. Regression of grain yield (kg/ ha) of 72 extra-early maize landraces including six drought and/or heat-tolerant populations/varieties, on tassel blast under heat stress (a) and combined drought and heat stress (b).
Agronomy 10 00318 g008
Figure 9. Phylogenetic constellation plots displaying the relationships between 66 extra-early maize landraces and six improved populations/varieties evaluated under managed drought stress (a), heat stress (b) and combined drought and heat stress (c). For each treatment, clusters I, and II were represented largely by tolerant accessions, while the remaining clusters consisted of susceptible accessions.
Agronomy 10 00318 g009
Table 1. Mean squares, and repeatability of grain yield and other traits of 72 extra-early maturing maize accessions evaluated under non-stress and drought stress conditions between 2017 and 2019 at Kadawa, Nigeria.
Non-Stress Conditions (NS)
SVdfGYADSDASIPLHTEHTHCEPPPASPEASPSGRLSLEAROT
Env25,746,960.3**1.3108.8*133.4**83913.4**32981.7**86.7**0.5**24.5**3.3*----
Rep (Env)3169,368.89.5*0.85.41485.9*1260.4**7.6**01.4*0----
Block (Env × Rep)42530,887.1*3.485.2690.1**1391.3**00.9*1.2*----
Genotype712,466,309.9**47.7**75.6**13.2**686.7**344.2**0.8*0.1**1.7**3.8**----
Env × Genotype
Error
142
171
84,207.7
204,531.2
5.5**
2.5
13.9*
7.9
6.8*
5.1
180.3
214.4
85.9
95
0.5
0.4
0
0
0.4
0.4
0.4
0.7
-
-
-
-
-
-
-
-
Repeatability0.940.890.810.50.750.770.410.70.820.86----
Grand Mean 2992.3847503152.7268.8140.9255----
Drought Stress (DS)
Env13,976,48475.4**130.7**19.4**10811.4**852.3**54.2**1.6**24.3**34.9**9.4**0.9**0.5**-
Rep (Env)22,258,7914.9*6.5*0.5280.5206.4*0.900.60.74.8**0.2**0-
Block (Env × Rep)281,039,0933.2*3.4*0.6402.9**177.5**0.700.50.50.94*00-
Genotype716,056,025.5 **72.4**76.4**2.6**1531.6**946.2**3.0**0.1**4.2**4.2**1.6**0*0**-
Env × Genotype711,840,1903.9**5.2**1.5**105.2431.0*0.0**0.6*0.8**0.3700-
Error1141,638,1191.620.8109.5600.700.40.40.3900-
Repeatability0.690.940.930.450.940.950.680.30.860.820.790.330.68-
Grand Mean 1523.9246504116.7354.9540.685540.10.22-
Reduction (%)0.491-10.240.20-0.26------
*, ** Significance at 0.01 and 0.001, respectively; GY: Grain yield (kg/ha); AD: Days to 50% anthesis; SD: Days to 50% silking; ASI: Anthesis-silking interval; PLHT: Plant height (cm); EHT: Ear height (cm); HC: Husk cover (scale:1-9); EPP: Ears per plant; PASP: Plant aspect (scale:1-9); EASP: Ear aspect (scale:1-9); SG: Stay green characteristic (scale:1-9); RL: Root lodging (%); SL: Stalk lodging (%); EAROT: Ear rot.
Table 2. Mean squares and repeatability of grain yield and other traits of 72 extra-early maturing maize accessions evaluated under heat stress and combined drought and heat stress conditions between 2017 and 2019 at Kadawa, Nigeria.
Heat Stress (HS)
SVdfGYADSDASIPLHTEHTHCEPPPASPEASPSGRLSLTBLFEAROT
Env116,037,142.5**9.820.1*1.840110.6**23562.6**103.9**1.8**0.28.7*48.3**0.2**0.1*0.2**0.0*-
Rep (Env)28,533,488.5**11.911.61287.9652.8*1.70.6**0.82.9*3.5*0.1**00.0*0-
Block (Env × Rep)281,970,909.7*9.1*9.2*1.11363.7**501.8**10.10.61.3*0.70000-
Genotype712,330,918.4**59.9**51. 0**3.4**1181.9**716.6**1.5*0.1**2.0**2.0**1.4**00.0**0.0*0.0*-
Env × Genotype71753,004.14.53.21.3286.3168.40.900.30.60.60.0*00.0*0-
Error114841,3664.34.61.5336.8135.60.700.40.70.50000-
Repeatability0.670.940.930.630.760.790.340.630.850.690.560.370.640.210.38-
Mean 2301.3957603144.1259.6540.825537.3312.713.914.19-
Reduction (%) 0.23−10−10-0.060.13-0.11-------
Combined Drought and Heat Stress (DSHS)
Env1613,509,9.7*1.90.12.5155177.3**58356.3**38.9**2.3*0.15.7*23.0**0.1*000.1*-
Rep (Env)2843,164.714.4*17.2*0.3522.3*21.31.40.10.52.9*0.40000.1*-
Block (Env × Rep)281,522,778.5*7.7*13.0**2.8*913.3**263.3**2.0**0.30.72.8**0.900.0*00.0*-
Genotype712,575,212.4**47.3**46.6**4.1**1010.2**719.7**1.6**0.2*1.8**3.5**2.1**0.0*0.0**0.0**0.0*-
Env × Genotype714,923,88.22.33.10.7254.1*113.4**0.60.20.30.80.60000-
Error114595,224.53.24.71.7161.746.80.70.20.50.80.60000-
Repeatability0.790.950.930.660.770.860.620.250.780.770.690.570.620.640.55-
Grand Mean 1258.5156583142.6858.5940.685549.7515.719.9411.97-
Reduction (%) 0.58−9−8-0.070.15-0.26--------
*, ** Significance at 0.01 and 0.001, respectively; GY: Grain yield (kg/ha); AD: Days to 50% anthesis; SD: Days to 50% silking; ASI: Anthesis-silking interval; PLHT: Plant height (cm); EHT: Ear height (cm); HC: Husk cover (scale:1-9); EPP: Ears per plant; PASP: Plant aspect (scale:1-9); EASP: Ear aspect (scale:1-9); SG: Stay green characteristic (scale:1-9); RL: Root lodging (%); SL: Stalk lodging (%); TB: Tassel blast (scale:1-9); LF: Leaf firing (scale:1-9); EAROT: Ear rot.
Table 3. Coefficient of phenotypic correlations between treatments for traits of 72 extra-early maturing maize accessions evaluated between 2017 and 2019 in Nigeria.
TraitNS vs. DSNS vs. HSNS vs. DSHSHS vs. DSDS vs. DSHSHS vs. DSHS
Grain yield0.66***0.75***0.62***0.48**0.60***0.37***
Anthesis days0.90***−0.050.87***−0.040.82***−0.13
Silking0.80***−0.070.84***−0.080.73***−0.08
Anthesis-Silking Interval0.23*−0.090.42***−0.130.13−0.28*
Plant height0.48***0.30*0.64***0.180.29*0.23*
Ear height0.60***0.210.77***0.24*0.140.55***
Ears per plant0.37**0.110.060.030.22−0.07
Ear aspect0.54***0.32**0.33**0.190.52***0.05
Plant aspect0.46***0.140.63***0.180.46***0.04
Stay green---0.080.38***0.03
Leaf firing-----−0.20
Tassel blast-----−0.10
*, **, *** Significant at 0.05, 0.01 and 0.001 probability levels, respectively.
Table 4. Genetic correlation between phenology (days to anthesis and silking) and other secondary traits of 72 extra-early maize accessions evaluated under contrasting environments between 2017 and 2019 in Nigeria.
Trait NSDSHSDSHS
Days to anthesis
Grain yield0.34−0.71−0.42−0.23
Silking days0.950.990.980.97
Anthesis-silking interval0.420.120.510.20
Husk cover−0.48−0.71−0.92−0.63
Plant height0.580.800.910.79
Ear height0.650.870.980.87
Plant aspect−0.31−0.76−0.87−0.62
Ear aspect−0.32−0.83−0.41−0.12
Ears per plant0.06−0.890.19−0.34
Stay green-−0.49−0.88−0.49
Leaf firing--−0.79−0.26
Tassel blast--−0.98−0.12
Days to Silking
Grain yield0.14-0.65-0.31-0.14
Anthesis-silking interval0.680.250.340.01
Husk cover−0.24−0.64−0.82−0.60
Plant height0.350.800.870.81
Ear height0.400.860.950.85
Plant aspect−0.06−0.71−0.81−0.59
Ear aspect−0.09−0.78−0.26−0.04
Ears per plant−0.33−0.770.08−0.53
Stay green−0.28-−0.76−0.45
Leaf firing--−0.79−0.20
Tassel blast--−0.98-
NS: Non stress; DS: Drought stress; HS: Heat stress; DSHS: Combined drought and heat stress.
Table 5. Grain yield and base index values of the best check and the top 15, and worse five landrace accessions evaluated under drought, heat, and combined drought and heat stress environments at Ikenne and Kadawa, Nigeria between 2017 and 2019.
Drought Stress (DS)Heat Stress (HS)Combined Drought and Heat Stress (DSHS)
AccessionGY (kg/ha)BIAccessionGY (kg/ha)BIAccessionGY (kg/ha)BI
Check 3386313.4Check 5472314.5Check 4389910.9
TZm-1440328711.4TZm-1167389512.3TZm-148631678.2
TZm-1163348711.3TZm-115736149.1TZm-116231747.7
TZm-1500308611.1TZm-117838968.0TZm-147223344.8
TZm-1162325610.5TZm-147232387.8TZm-117120704.7
TZm-148628159.2TZm-116336736.4TZm-144023734.5
TZm-116022157.4TZm-115832476.3TZm-147023914.2
TZm-117418866.5TZm-135225246.1TZm-116021873.9
TZm-134919325.1TZm-116231374.7TZm-148120393.8
TZm-149616854.9TZm-117939564.5TZm-150817973.1
TZm-144924044.9TZm-150833504.2TZm-148320422.6
TZm-150825214.5TZm-132934153.9TZm-148517352.5
TZm-147220154.3TZm-144329843.9TZm-116717002.5
TZm-115920264.3TZm-156132773.9TZm-149618022.4
TZm-151118614.1TZm-151127933.9TZm-150622102.2
TZm-116719263.7TZm-145431943.4TZm-144818532.0
TZm-1169530−8.8TZm-1497907−9.36TZm-1510336−6.8
TZm-1493571−9.0TZm-1493907−9.37TZm-1509281−7.3
GH-4863430−9.6TZm-1177936−9.41TZm-1176366−7.3
TZm-1165501−10.4TZm-1170932−12.08TZm-1480467−8.6
TZm-1510543−10.6TZm-1498501−12.29TZm-1173152−11.3
GY = Grain yield; BI = Base index; Check 3 = TZEE-W HDT C3 STR C5; Check 4 = TZEE-Y HDT C3 STR C5; Check 5 = 2014 TZEE-Y DTH STR.

