Assessing the Ability of Durum Wheat-Thinopyrum ponticum Recombinant Lines to Suppress Naturally Occurring Weeds under Different Sowing Densities

 , , and
Abstract
:1. Introduction
2. Materials and Methods
2.1. Plant Materials
2.2. Location and Experimental Design
2.3. Sampling and Measurements
2.3.1. Yield and Yield-Related Traits
2.3.2. Competitive Ability against Weeds
2.3.3. Light Interception
2.3.4. Optical Measurement of Physiological Traits
2.3.5. Morphological Traits
2.4. Statistical Analyses
3. Results
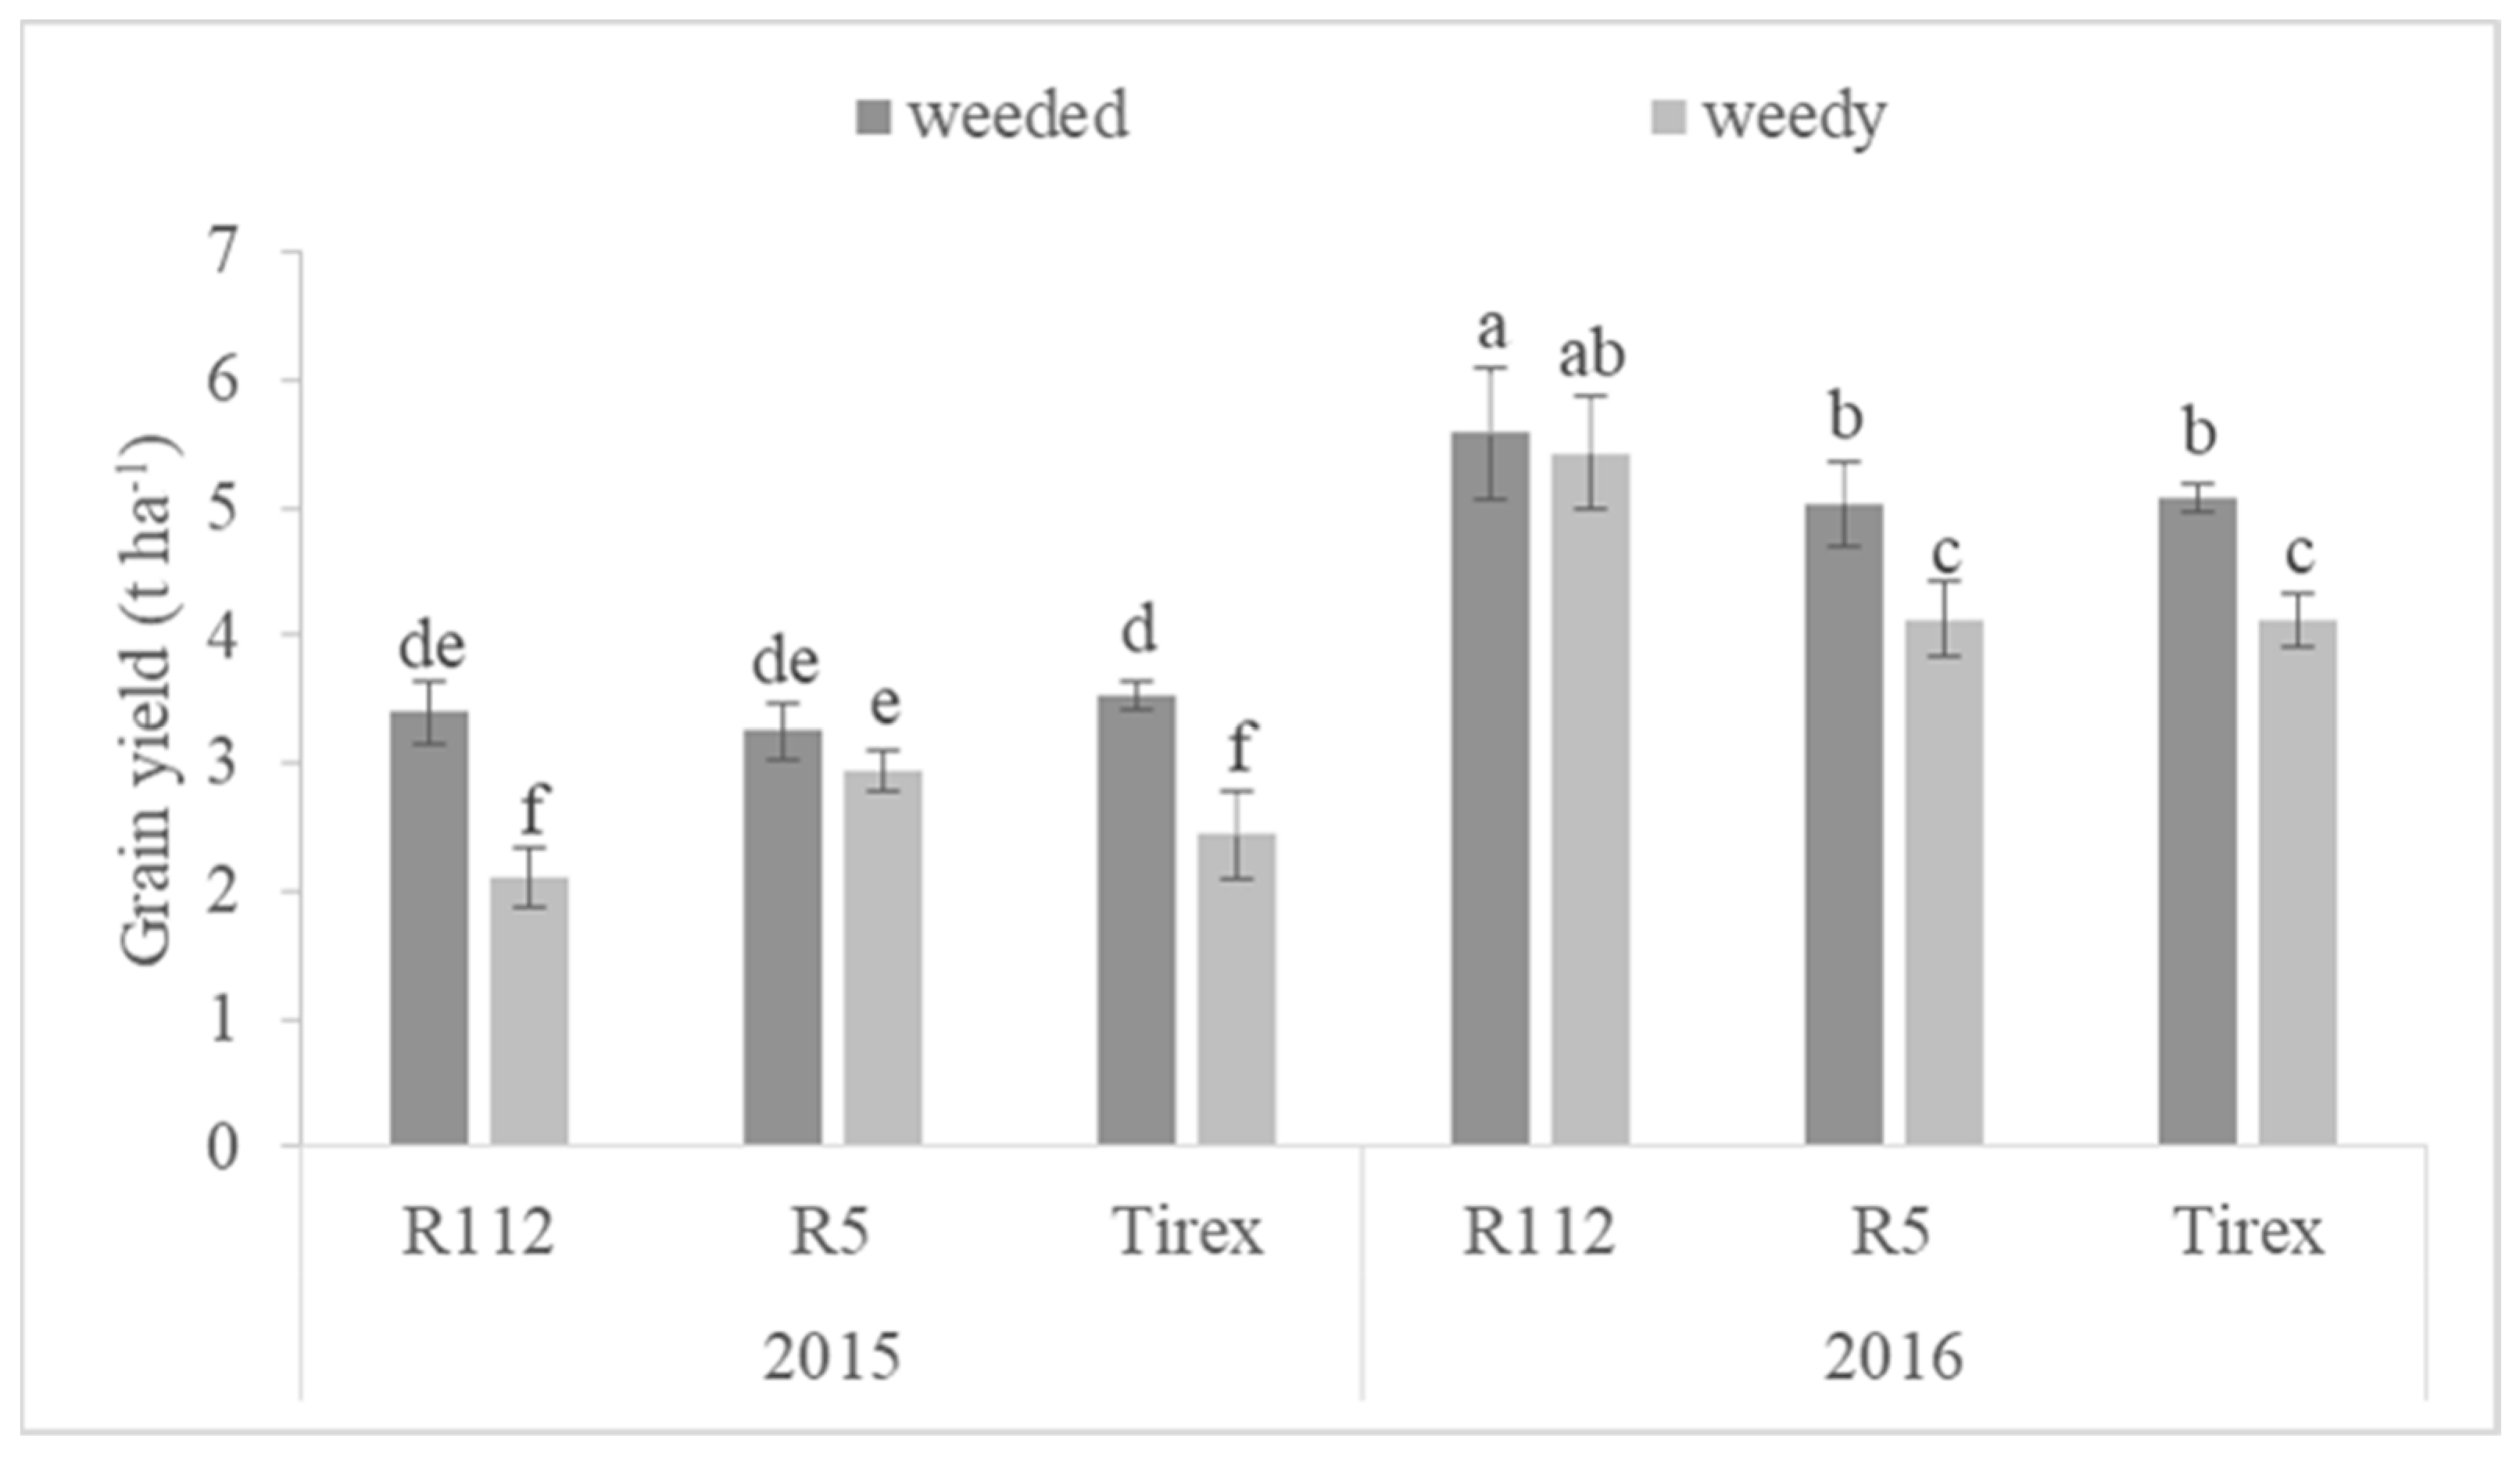
3.1. Yield and Yield-Related Traits
3.2. Competitive Ability against Weeds
3.3. Light Interception and Flag Leaf Chlorophyll Content
3.4. Morphological Traits: Flag Leaf and Plant Height
4. Discussion
4.1. Genotypes and Weed Competition
4.2. Sowing Density: Effect on Yield and Weed Competition
5. Conclusions
Supplementary Materials
Author Contributions
Funding
Acknowledgments
Conflicts of Interest
References
- FAO Addressing Sustainable Crop Production Priorities in National Adaptation Plans. Available online: http://www.http//www.fao.org/in-action/naps/resources/detail/en/c/1178545/ (accessed on 4 April 2020).
- Brar, D.S.; Khush, G.S. Biotechnological Approaches for Increasing Productivity and Sustainability of Rice Production. In Agricultural Sustainability; Bhullar, G.S., Bhullar, N.K., Eds.; Academic Press: San Diego, CA, USA, 2013; pp. 151–175. ISBN 9780124045606. [Google Scholar]
- Poudel, D.D.; Horwath, W.; Lanini, W.; Temple, S.; Van Bruggen, A. Comparison of soil N availability and leaching potential, crop yields and weeds in organic, low-input and conventional farming systems in northern California. Agric. Ecosyst. Environ. 2002, 90, 125–137. [Google Scholar] [CrossRef]
- FAO Agriculture, Food and Water. A Contribution to the World Water Development Report; FAO: Rome, Italy, 2003; ISBN 92-5-104943-2 / 0258-6150.
- Spina, A.; Brighina, S.; Muccilli, S.; Mazzaglia, A.; Rapisarda, P.; Fallico, B.; Arena, E. Partial Replacement of NaCl in Bread from Durum Wheat (Triticum turgidum L subsp. durum Desf.) with KCl and Yeast Extract: Evaluation of Quality Parameters During Long Storage. Food Bioprocess Technol. 2015, 8, 1089–1101. [Google Scholar] [CrossRef]
- Sall, A.T.; Chiari, T.; Legesse, W.; Ahmed, S.; Ortiz, R.; Van Ginkel, M.; Bassi, F.M. Durum Wheat (Triticum durum Desf.): Origin, Cultivation and Potential Expansion in Sub-Saharan Africa. Agronomy 2019, 9, 263. [Google Scholar] [CrossRef] [Green Version]
- Worthington, M.; Reberg-Horton, S.C. Breeding Cereal Crops for Enhanced Weed Suppression: Optimizing Allelopathy and Competitive Ability. J. Chem. Ecol. 2013, 39, 213–231. [Google Scholar] [CrossRef]
- Bond, W.; Grundy, A.C. Non-chemical weed management in organic farming systems. Weed Res. 2001, 41, 383–405. [Google Scholar] [CrossRef]
- Jha, P.; Kumar, V.; Godara, R.K.; Chauhan, B.S. Weed management using crop competition in the United States: A review. Crop. Prot. 2017, 95, 31–37. [Google Scholar] [CrossRef] [Green Version]
- Lutman, P.J.W.; Moss, S.R.; Cook, S.; Welham, S.J. A review of the effects of crop agronomy on the management of Alopecurus myosuroides. Weed Res. 2013, 53, 299–313. [Google Scholar] [CrossRef]
- Carrubba, A.; Labruzzo, A.; Comparato, A.; Muccilli, S.; Spina, A. Use of Plant Water Extracts for Weed Control in Durum Wheat (Triticum turgidum L. Subsp. durum Desf.). Agronomy 2020, 10, 364. [Google Scholar] [CrossRef] [Green Version]
- Korres, N.; Norsworthy, J.K.; Tehranchian, P.; Gitsopoulos, T.K.; Loka, D.A.; Oosterhuis, D.M.; Gealy, D.R.; Moss, S.R.; Burgos, N.R.; Miller, M.R.; et al. Cultivars to face climate change effects on crops and weeds: A review. Agron. Sustain. Dev. 2016, 36, 1–22. [Google Scholar] [CrossRef] [Green Version]
- Donley, N. The USA lags behind other agricultural nations in banning harmful pesticides. Environ. Heal. 2019, 18, 44. [Google Scholar] [CrossRef] [Green Version]
- Lemerle, D.; Gill, G.S.; Murphy, C.E.; Walker, S.R.; Cousens, R.D.; Mokhtari, S.; Peltzer, S.J.; Coleman, R.; Luckett, D.J. Genetic improvement and agronomy for enhanced wheat competitiveness with weeds. Aust. J. Agric. Res. 2001, 52, 527. [Google Scholar] [CrossRef]
- Andrew, I.K.S.; Storkey, J.; Sparkes, D.L. A review of the potential for competitive cereal cultivars as a tool in integrated weed management. Weed Res. 2015, 55, 239–248. [Google Scholar] [CrossRef] [PubMed]
- Kuzmanović, L.; Ruggeri, R.; Able, J.A.; Bassi, F.M.; Maccaferri, M.; Tuberosa, R.; De Vita, P.; Rossini, F.; Ceoloni, C. Yield of chromosomally engineered durum wheat-Thinopyrum ponticum recombinant lines in a range of contrasting rain-fed environments. Field Crop. Res. 2018, 228, 147–157. [Google Scholar] [CrossRef]
- Ceoloni, C.; Kuzmanović, L.; Ruggeri, R.; Rossini, F.; Forte, P.; Cuccurullo, A.; Bitti, A. Harnessing Genetic Diversity of Wild Gene Pools to Enhance Wheat Crop Production and Sustainability: Challenges and Opportunities. Diversity 2017, 9, 55. [Google Scholar] [CrossRef] [Green Version]
- Kuzmanović, L.; Ruggeri, R.; Virili, M.E.; Rossini, F.; Ceoloni, C. Effects of Thinopyrum ponticum chromosome segments transferred into durum wheat on yield components and related morpho-physiological traits in Mediterranean rain-fed conditions. Field Crop. Res. 2016, 186, 86–98. [Google Scholar] [CrossRef]
- Ceoloni, C.; Forte, P.; Kuzmanović, L.; Tundo, S.; Moscetti, I.; De Vita, P.; Virili, M.E.; D’Ovidio, R. Cytogenetic mapping of a major locus for resistance to Fusarium head blight and crown rot of wheat on Thinopyrum elongatum 7EL and its pyramiding with valuable genes from a Th. ponticum homoeologous arm onto bread wheat 7DL. Theor. Appl. Genet. 2017, 130, 2005–2024. [Google Scholar] [CrossRef]
- Stougaard, R.N.; Xue, Q. Spring wheat seed size and seeding rate effects on yield loss due to wild oat (Avena fatua) interference. Weed Sci. 2004, 52, 133–141. [Google Scholar] [CrossRef]
- Lemerle, D.; Verbeek, B.; Cousens, R.; Coombes, N.E. The potential for selecting wheat varieties strongly competitive against weeds. Weed Res. 1996, 36, 505–513. [Google Scholar] [CrossRef]
- Wilson, R.G.; Orloff, S.B.; Lancaster, D.L.; Kirby, D.W.; Carlson, H.L. Integrating Herbicide Use and Perennial Grass Revegetation to Suppress Weeds in Noncrop Areas. Invasive Plant Sci. Manag. 2010, 3, 81–92. [Google Scholar] [CrossRef]
- Monsen, S.B.; Stevens, R.; Shaw, N.L. Grasses. In Restoring Western Ranges and Wildlands; U.S. Department of Agriculture Forest Service, Rocky Mountain Research Station: Fort Collins, CO, USA, 2004; Volume 2, pp. 295–424. [Google Scholar]
- Doll, H.; Holm, U.; Søsgaard, B. Effect of crop density on competition by wheat and barley with Agrostemma githago and other weeds. Weed Res. 1995, 35, 391–396. [Google Scholar] [CrossRef]
- Kristensen, L.; Olsen, J.; Weiner, J. Crop Density, Sowing Pattern, and Nitrogen Fertilization Effects on Weed Suppression and Yield In Spring Wheat. Weed Sci. 2008, 56, 97–102. [Google Scholar] [CrossRef]
- Lazzaro, M.; Costanzo, A.; Farag, D.H.; Bàrberi, P. Grain yield and competitive ability against weeds in modern and heritage common wheat cultivars are differently influenced by sowing density. Ital. J. Agron. 2017, 11, 343–349. [Google Scholar] [CrossRef] [Green Version]
- Beavers, R.L.; Hammermeister, A.M.; Frick, B.; Astatkie, T.; Martin, R.C. Spring wheat yield response to variable seeding rates in organic farming systems at different fertility regimes. Can. J. Plant Sci. 2008, 88, 43–52. [Google Scholar] [CrossRef]
- Swanton, C.; Nkoa, R.; Blackshaw, R.E. Experimental Methods for Crop–Weed Competition Studies. Weed Sci. 2015, 63, 2–11. [Google Scholar] [CrossRef] [Green Version]
- Whaley, J.M.; Sparkes, D.L.; Foulkes, M.; Spink, J.H.; Semere, T.; Scott, R.K. The physiological response of winter wheat to reductions in plant density. Ann. Appl. Boil. 2000, 137, 165–177. [Google Scholar] [CrossRef]
- Freeze, D.M.; Bacon, R.K. Row-Spacing and Seeding-Rate Effects on Wheat Yields in the Mid-South. J. Prod. Agric. 1990, 3, 345. [Google Scholar] [CrossRef]
- Arduini, I.; Masoni, A.; Ercoli, L.; Mariotti, M. Grain yield, and dry matter and nitrogen accumulation and remobilization in durum wheat as affected by variety and seeding rate. Eur. J. Agron. 2006, 25, 309–318. [Google Scholar] [CrossRef]
- Flagella, Z.; Giuliani, M.M.; Giuzio, L.; Volpi, C.; Masci, S. Influence of water deficit on durum wheat storage protein composition and technological quality. Eur. J. Agron. 2010, 33, 197–207. [Google Scholar] [CrossRef]
- Rossini, F.; Provenzano, M.E.; Sestili, F.; Ruggeri, R. Synergistic Effect of Sulfur and Nitrogen in the Organic and Mineral Fertilization of Durum Wheat: Grain Yield and Quality Traits in the Mediterranean Environment. Agronomy 2018, 8, 189. [Google Scholar] [CrossRef] [Green Version]
- Uphoff, N.; Fasoula, V.; Iswandi, A.; Kassam, A.; Thakur, A.K. Improving the phenotypic expression of rice genotypes: Rethinking “intensification” for production systems and selection practices for rice breeding. Crop. J. 2015, 3, 174–189. [Google Scholar] [CrossRef] [Green Version]
- Van Der Meulen, A.; Chauhan, B.S. A review of weed management in wheat using crop competition. Crop. Prot. 2017, 95, 38–44. [Google Scholar] [CrossRef]
- Korres, N.; Froud-Williams, R.J. The Interrelationships of Winter Wheat Cultivars, Crop Density and Competition of Naturally Occurring Weed Flora. Boil. Agric. Hortic. 2004, 22, 1–20. [Google Scholar] [CrossRef]
- Ceoloni, C.; Forte, P.; Gennaro, A.; Micali, S.; Carozza, R.; Bitti, A. Recent developments in durum wheat chromosome engineering. Cytogenet. Genome Res. 2005, 109, 328–334. [Google Scholar] [CrossRef] [PubMed]
- Pandino, G.; Mattiolo, E.; Lombardo, S.; Lombardo, G.; Mauromicale, G. Organic Cropping System Affects Grain Chemical Composition, Rheological and Agronomic Performance of Durum Wheat. Agriculture 2020, 10, 46. [Google Scholar] [CrossRef] [Green Version]
- Pittaluga, E. Valutazione del comportamento in campo di linee di frumento duro recanti segmenti cromosomici, singoli e multipli, trasferiti da specie affini tramite ingegneria cromosomica. B. Sc. Thesis, (unpublished). University of Tuscia, Viterbo, Italy, 2017. (In Italian). [Google Scholar]
- Zadoks, J.C.; Chang, T.T.; Konzak, C.F. A decimal code for the growth stages of cereals. Weed Res. 1974, 14, 415–421. [Google Scholar] [CrossRef]
- Langeroudi, A.S.; Kamkar, B. Field screening of canola (Brassica napus) cultivars against wild mustard (Sinapis arvensis) using competition indices and some empirical yield loss models in Golestan Province, Iran. Crop. Prot. 2009, 28, 577–582. [Google Scholar] [CrossRef]
- Wilson, J.B. Shoot Competition and Root Competition. J. Appl. Ecol. 1988, 25, 279. [Google Scholar] [CrossRef]
- Mullan, D.; Pietragalla, J. Light interception. In Physiological Breeding II: A Field Guide to Wheat Phenotyping; Pask, A., Pietragalla, J., Mullan, D., Reynolds, M., Eds.; Cimmyt: Mexico City, Mexico, 2012; pp. 54–57. ISBN 978-970-648-182-5. [Google Scholar]
- Cartelat, A.; Cerovic, Z.; Goulas, Y.; Meyer, S.; Lelarge, C.; Prioul, J.-L.; Barbottin, A.; Jeuffroy, M.-H.; Gate, P.; Agati, G.; et al. Optically assessed contents of leaf polyphenolics and chlorophyll as indicators of nitrogen deficiency in wheat (Triticum aestivum L.). Field Crop. Res. 2005, 91, 35–49. [Google Scholar] [CrossRef]
- Dodig, D.; Zorić, M.; Kobiljski, B.; Šurlan-Momirović, G.; Quarrie, S. Assessing drought tolerance and regional patterns of genetic diversity among spring and winter bread wheat using simple sequence repeats and phenotypic data. Crop. Pasture Sci. 2010, 61, 812. [Google Scholar] [CrossRef]
- R Core Team R. A Language and Environment for Statistical Computing; R Foundation for Statistical Computing: Vienna, Austria, 2016; Available online: https://www.R-project.org/ (accessed on 9 February 2020).
- Porter, J.R.; Gawith, M. Temperatures and the growth and development of wheat: A review. Eur. J. Agron. 1999, 10, 23–36. [Google Scholar] [CrossRef]
- Lemerle, D.; Luckett, D.J.; Lockley, P.; Koetz, E.; Wu, H. Competitive ability of Australian canola (Brassica napus) genotypes for weed management. Crop. Pasture Sci. 2014, 65, 1300–1310. [Google Scholar] [CrossRef]
- Cousens, R.D.; Mokhtari, S. Seasonal and site variability in the tolerance of wheat cultivars to interference from Lolium rigidum. Weed Res. 1998, 38, 301–307. [Google Scholar] [CrossRef]
- Lemerle, D.; Verbeek, B.; Orchard, B. Ranking the ability of wheat varieties to compete with Lolium rigidum. Weed Res. 2001, 41, 197–209. [Google Scholar] [CrossRef]
- Jordan, N. Prospects for Weed Control Through Crop Interference. Ecol. Appl. 1993, 3, 84–91. [Google Scholar] [CrossRef] [PubMed]
- Coleman, R.K.; Gill, G.S.; Rebetzke, G. Identification of quantitative trait loci for traits conferring weed competitiveness in wheat (Triticum aestivum L.). Aust. J. Agric. Res. 2001, 52, 1235. [Google Scholar] [CrossRef]
- Seavers, G.P.; Wright, K.J. Crop canopy development and structure influence weed suppression. Weed Res. 1999, 39, 319–328. [Google Scholar] [CrossRef]
- Huel, D.G.; Hucl, P. Genotypic variation for competitive ability in spring wheat. Plant Breed. 1996, 115, 325–329. [Google Scholar] [CrossRef]
- Mason, H.E.; Spaner, D. Competitive ability of wheat in conventional and organic management systems: A review of the literature. Can. J. Plant Sci. 2006, 86, 333–343. [Google Scholar] [CrossRef]
- Lazzaro, M.; Bàrberi, P.; Dell’Acqua, M.; Pè, M.E.; Limonta, M.; Barabaschi, D.; Cattivelli, L.; Laino, P.; Vaccino, P. Unraveling diversity in wheat competitive ability traits can improve integrated weed management. Agron. Sustain. Dev. 2019, 39, 6. [Google Scholar] [CrossRef] [Green Version]
- Champion, G.T.; Holland, J.M.; Froud-Williams, R.J. Interactions between wheat (Triticum aestivum L.) cultivar, row spacing and density and the effect on weed suppression and crop yield. Ann. Appl. Boil. 1998, 133, 443–453. [Google Scholar] [CrossRef]
- Drews, S.; Neuhoff, D.; Köpke, U. Weed suppression ability of three winter wheat varieties at different row spacing under organic farming conditions. Weed Res. 2009, 49, 526–533. [Google Scholar] [CrossRef]
- Burnside, O.C.; Wicks, G.A.; Johnson, V.A. Competition Between Winter Wheat (Triticum aestivum) Cultivars and Downy Brome (Bromus tectorum). Weed Sci. 1986, 34, 689–693. [Google Scholar] [CrossRef]
- López-Castañeda, C.; Richards, R. Variation in temperate cereals in rainfed environments III. Water use and water-use efficiency. Field Crop. Res. 1994, 39, 85–98. [Google Scholar] [CrossRef]
- Loss, S.P.; Siddique, K. Morphological and Physiological Traits Associated with Wheat Yield Increases in Mediterranean Environments. Adv. Agron. 1994, 52, 229–276. [Google Scholar] [CrossRef]
- Isidro, J.; Knox, R.E.; Clarke, F.; Singh, A.; Depauw, R.; Clarke, J.; Somers, D.; Isidro-Sánchez, J. Quantitative genetic analysis and mapping of leaf angle in durum wheat. Planta 2012, 236, 1713–1723. [Google Scholar] [CrossRef]
- Liu, K.; Cao, J.; Yu, K.; Liu, X.; Gao, Y.; Chen, Q.; Zhang, W.; Peng, H.; Du, J.; Xin, M.; et al. Wheat TaSPL8 Modulates Leaf Angle Through Auxin and Brassinosteroid Signaling. Plant Physiol. 2019, 181, 179–194. [Google Scholar] [CrossRef] [Green Version]
- Belz, R.G. Allelopathy in crop/weed interactions—An update. Pest Manag. Sci. 2007, 63, 308–326. [Google Scholar] [CrossRef]
- Fragasso, M.; Iannucci, A.; Papa, R. Durum wheat and allelopathy: Toward wheat breeding for natural weed management. Front. Plant Sci. 2013, 4, 4. [Google Scholar] [CrossRef] [Green Version]
- Bertholdsson, N.-O.; Andersson, S.C.; Merker, A. Allelopathic potential of Triticum spp., Secale spp. and Triticosecale spp. and use of chromosome substitutions and translocations to improve weed suppression ability in winter wheat. Plant Breed. 2011, 131, 75–80. [Google Scholar] [CrossRef]
- Merker, A.; Lantai, K. Hybrids between wheats and perennial Leymus and Thinopyrum species. Acta Agric. Scand. Sect. B Soil Plant Sci. 1997, 47, 48–51. [Google Scholar] [CrossRef]
- Fradgley, N.S.; Creissen, H.; Pearce, H.; Howlett, S.A.; Pearce, B.D.; Döring, T.; Girling, R.D. Weed Suppression and Tolerance in Winter Oats. Weed Technol. 2017, 31, 740–751. [Google Scholar] [CrossRef] [Green Version]
- Christensen, S. Weed suppression ability of spring barley varieties. Weed Res. 2006, 35, 241–247. [Google Scholar] [CrossRef]
- Didon, U.M.E.; Boström, U. Growth and Development of Six Barley (Hordeum vulgare ssp. vulgare L.) Cultivars in Response to a Model Weed (Sinapis alba L.). J. Agron. Crop. Sci. 2003, 189, 409–417. [Google Scholar] [CrossRef]
- Bertholdsson, N.-O. Early vigour and allelopathy - two useful traits for enhanced barley and wheat competitiveness against weeds. Weed Res. 2005, 45, 94–102. [Google Scholar] [CrossRef]
- Vandeleur, R.K.; Gill, G.S. The impact of plant breeding on the grain yield and competitive ability of wheat in Australia. Aust. J. Agric. Res. 2004, 55, 855–861. [Google Scholar] [CrossRef]
- Ceoloni, C.; Kuzmanovic, L.; Forte, P.; Virili, M.E.; Bitti, A. Wheat-Perennial Triticeae Introgressions: Major Achievements and Prospects. In Alien Introgression in Wheat- Cytogenetics, Molecular Biology, and Genomics; Molnár-Láng, M., Ceoloni, C., Doležel, J., Eds.; Springer: Cham, Switzerland, 2015; pp. 273–313. [Google Scholar]
- Evans, L.E.; Bhatt, G.M. Influence of seed size, protein content and cultivar on early seedling vigor em wheat. Can. J. Plant Sci. 1977, 57, 929–935. [Google Scholar] [CrossRef]
- Grieve, C.M.; Francois, L.E. The importance of initial seed size in wheat plant response to salinity. Plant Soil 1992, 147, 197–205. [Google Scholar] [CrossRef]
- Lafond, G.P.; Baker, R.J. Effects of Genotype and Seed Size on Speed of Emergence and Seedling Vigor in Nine Spring Wheat Cultivars 1. Crop. Sci. 1986, 26, 341–346. [Google Scholar] [CrossRef]
- Fang, Y.; Xu, B.; Turner, N.C.; Li, F.-M. Grain yield, dry matter accumulation and remobilization, and root respiration in winter wheat as affected by seeding rate and root pruning. Eur. J. Agron. 2010, 33, 257–266. [Google Scholar] [CrossRef]
- Tompkins, D.K.; Hultgreen, G.E.; Wright, A.T.; Fowler, D.B. Seed Rate and Row Spacing of No-Till Winter Wheat. Agron. J. 1907, 83, 684–689. [Google Scholar] [CrossRef]
- Geleta, B.; Atak, M.; Baenziger, P.S.; Nelson, L.A.; Baltenesperger, D.D.; Eskridge, K.M.; Shipman, M.J.; Shelton, D.R. Seeding Rate and Genotype Effect on Agronomic Performance and End-Use Quality of Winter Wheat. Crop. Sci. 2002, 42, 827–832. [Google Scholar] [CrossRef]
- Wang, J.; Araus, J.L.; Wan, J. Breeding to Optimize Agriculture in a Changing World. Crop. J. 2015, 3, 169–173. [Google Scholar] [CrossRef] [Green Version]
- Tollenaar, M.; Dibo, A.A.; Aguilara, A.; Weise, S.F.; Swanton, C.J. Effect of Crop Density on Weed Interference in Maize. Agron. J. 1907, 86, 591–595. [Google Scholar] [CrossRef]
- Korres, N.; Froud-Williams, R.J. Effects of winter wheat cultivars and seed rate on the biological characteristics of naturally occurring weed flora. Weed Res. 2002, 42, 417–428. [Google Scholar] [CrossRef]
- Olsen, J.M.; Griepentrog, H.-W.; Nielsen, J.; Weiner, J. How Important are Crop Spatial Pattern and Density for Weed Suppression by Spring Wheat? Weed Sci. 2012, 60, 501–509. [Google Scholar] [CrossRef]
- Kuzmanović, L.; Rossini, F.; Ruggeri, R.; Pagnotta, M.A.; Ceoloni, C. Engineered Durum Wheat Germplasm with Multiple Alien Introgressions: Agronomic and Quality Performance. Agronomy 2020, 10, 486. [Google Scholar] [CrossRef] [Green Version]


| Source of Variation | Grain Yield | Spikes m−2 | Kernels Spike−1 | Thousand Grain Weight |
|---|---|---|---|---|
| Year (Y) | *** | ** | n.s. | * |
| Sowing density (D) | ** | *** | n.s. | n.s. |
| Genotype (G) | n.s. | *** | *** | *** |
| Weed presence (W) | *** | *** | * | * |
| Y × D | ** | ** | n.s. | n.s. |
| Y × G | ** | *** | n.s. | ** |
| D × G | ** | *** | n.s. | n.s. |
| Y × W | n.s. | ** | n.s. | n.s. |
| G × W | n.s. | *** | n.s. | n.s. |
| Y × G × W | * | * | n.s. | n.s. |
| Treatments | Genotype | Weed Presence | Sowing Density (seeds m−2) | Year | |||||
|---|---|---|---|---|---|---|---|---|---|
| R112 | R5 | Tirex | Weeded | Weedy | 250 | 350 | 2015 | 2016 | |
| Spikes m−2 | 212.6 b | 196.3 c | 239.4 a | 229.5 a | 202.7 b | 205.3 b | 226.9 a | 194.6 b | 237.6 a |
| Kernels spike−1 | 37.7 a | 34.2 b | 31.4 c | 35.5 a | 33.4 b | 36.0 n.s. | 32.8 n.s. | 33.1 ns | 35.7 n.s. |
| TGW (g) | 51.8 b | 56.8 a | 47.1 c | 52.9 a | 50.9 b | 52.1 n.s. | 51.7 n.s. | 46.8 b | 57.1 a |
| Source of Variation | DW Biomass (Weedy) | DW Biomass (Weeded) | Weed Biomass | Cb |
|---|---|---|---|---|
| Year (Y) | ** | ** | ** | * |
| Sowing density (D) | n.s. | n.s. | ** | * |
| Genotype (G) | n.s. | n.s. | *** | *** |
| Y × D | n.s. | n.s. | * | n.s. |
| Y × G | * | * | *** | ** |
| GYL | Cb | GYw | GYwf | |
|---|---|---|---|---|
| GYL | 1 | |||
| Cb | −0.53 * | |||
| GYw | −0.69 * | 0.57 * | ||
| GYwf | −0.21 | 0.36 * | 0.84 * | 1 |
| IPAR | CHL | FLAV | NBI | |||||||||||||
|---|---|---|---|---|---|---|---|---|---|---|---|---|---|---|---|---|
| Source of Variation | B | H | A | F | B | H | A | F | B | H | A | F | B | H | A | F |
| Year (Y) | * | * | ** | ** | n.s. | n.s. | n.s. | n.s. | * | n.s. | n.s. | n.s. | n.s. | n.s. | n.s. | n.s. |
| Sowing density (D) | n.s. | n.s. | n.s. | n.s. | n.s. | n.s. | n.s. | n.s. | n.s. | n.s. | n.s. | n.s. | n.s. | n.s. | n.s. | n.s. |
| Genotype (G) | n.s. | n.s. | ** | n.s. | ** | * | ** | *** | * | n.s. | * | *** | * | n.s. | n.s. | n.s. |
| Weed presence (W) | *** | *** | *** | *** | n.s. | n.s. | n.s. | n.s. | * | n.s. | * | n.s. | * | * | * | n.s. |
| Y × D | n.s. | n.s. | n.s. | n.s. | n.s. | n.s. | n.s. | n.s. | n.s. | n.s. | n.s. | * | n.s. | n.s. | n.s. | n.s. |
| Y × G | *** | ** | *** | ** | n.s. | n.s. | n.s. | n.s. | n.s. | n.s. | n.s. | n.s. | n.s. | n.s. | n.s. | n.s. |
| Y × W | * | ** | n.s. | * | n.s. | n.s. | n.s. | n.s. | n.s. | n.s. | n.s. | n.s. | n.s. | n.s. | n.s. | n.s. |
| D × G | n.s. | n.s. | *** | n.s. | n.s. | n.s. | n.s. | n.s. | n.s. | n.s. | n.s. | * | n.s. | n.s. | n.s. | n.s. |
| D × W | n.s. | * | n.s. | ** | n.s. | n.s. | n.s. | n.s. | n.s. | n.s. | n.s. | n.s. | n.s. | n.s. | n.s. | n.s. |
| G × W | n.s. | n.s. | n.s. | ** | n.s. | n.s. | n.s. | n.s. | n.s. | n.s. | n.s. | n.s. | n.s. | n.s. | n.s. | n.s. |
| Y × G × W | ** | * | ** | * | n.s. | n.s. | n.s. | n.s. | n.s. | n.s. | n.s. | n.s. | n.s. | n.s. | n.s. | n.s. |
| Source of Variation | Flag Leaf Width | Flag Leaf Length | Flag Leaf Area | Plant Height |
|---|---|---|---|---|
| Year (Y) | ** | ** | * | ** |
| Sowing density (D) | n.s. | n.s. | n.s. | n.s. |
| Genotype (G) | *** | * | *** | * |
| Weed presence (W) | n.s. | n.s. | n.s. | n.s. |
| Trait | R112 | R5 | Tirex |
|---|---|---|---|
| Flag leaf width (cm) | 1.84 ± 0.04 a | 1.87 ± 0.03 a | 1.61 ± 0.02 b |
| Flag leaf length (cm) | 22.75 ± 0.26 b | 23.95 ± 0.22 a | 23.03 ± 0.20 b |
| Flag leaf area (cm2) | 31.84 ± 1.11 a | 33.77 ± 0.92 a | 27.72 ± 0.70 b |
| Plant height (cm) | 72.9 ± 1.70 b | 75.5 ± 1.51 a | 75.0 ± 1.47 a |
© 2020 by the authors. Licensee MDPI, Basel, Switzerland. This article is an open access article distributed under the terms and conditions of the Creative Commons Attribution (CC BY) license (http://creativecommons.org/licenses/by/4.0/).
Share and Cite
Rossini, F.; Provenzano, M.E.; Kuzmanović, L.; Ceoloni, C.; Ruggeri, R. Assessing the Ability of Durum Wheat-Thinopyrum ponticum Recombinant Lines to Suppress Naturally Occurring Weeds under Different Sowing Densities. Agronomy 2020, 10, 709. https://0-doi-org.brum.beds.ac.uk/10.3390/agronomy10050709
Rossini F, Provenzano ME, Kuzmanović L, Ceoloni C, Ruggeri R. Assessing the Ability of Durum Wheat-Thinopyrum ponticum Recombinant Lines to Suppress Naturally Occurring Weeds under Different Sowing Densities. Agronomy. 2020; 10(5):709. https://0-doi-org.brum.beds.ac.uk/10.3390/agronomy10050709
Chicago/Turabian StyleRossini, Francesco, Maria Elena Provenzano, Ljiljana Kuzmanović, Carla Ceoloni, and Roberto Ruggeri. 2020. "Assessing the Ability of Durum Wheat-Thinopyrum ponticum Recombinant Lines to Suppress Naturally Occurring Weeds under Different Sowing Densities" Agronomy 10, no. 5: 709. https://0-doi-org.brum.beds.ac.uk/10.3390/agronomy10050709