Affordable Phenotyping of Winter Wheat under Field and Controlled Conditions for Drought Tolerance


 , and
, and 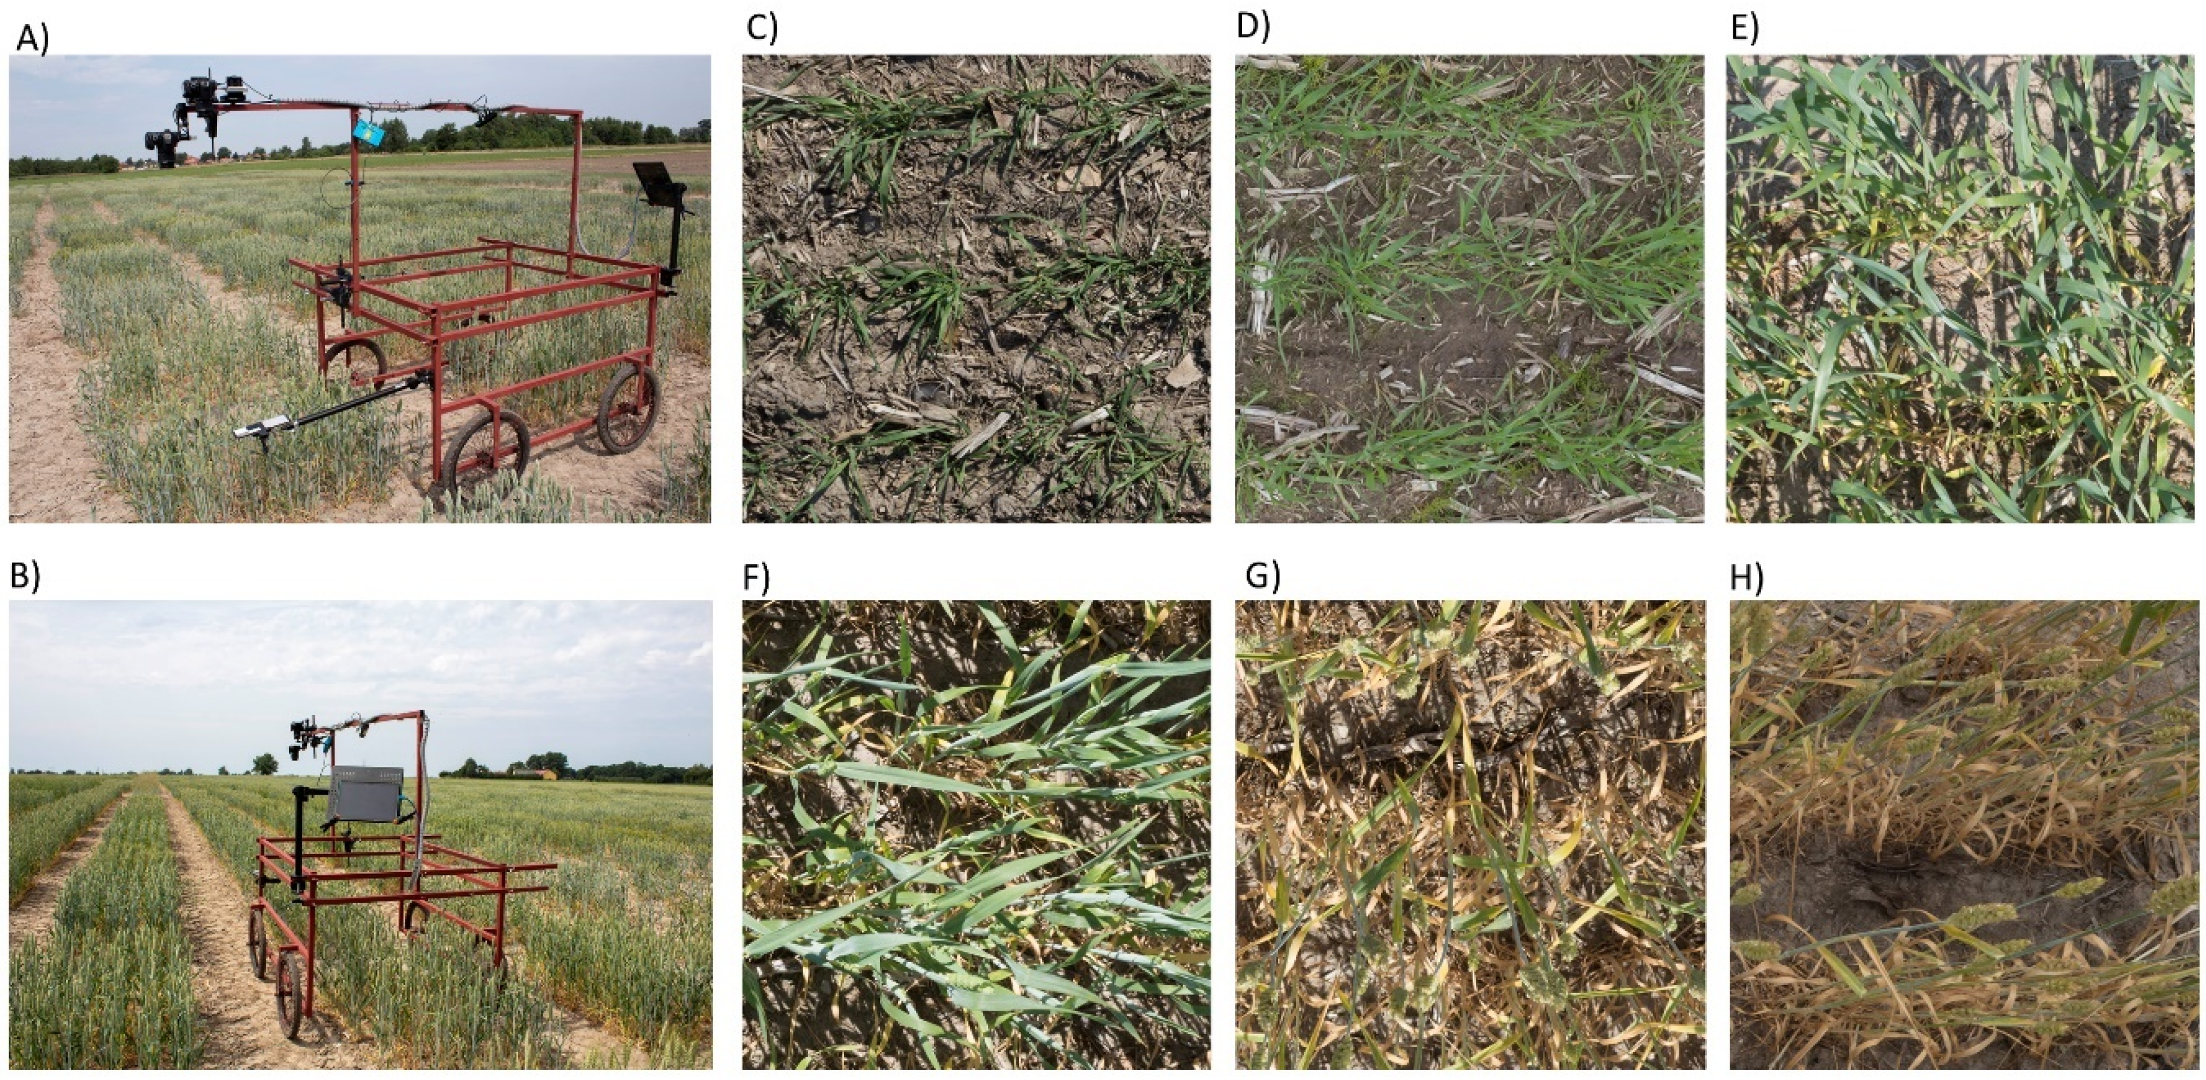
Abstract
:1. Introduction
2. Material and Methods
2.1. Plant Material, Phenocart, and Phenotyping in the Field
2.2. Plant Height and Drought Scoring
2.3. Shoot and Root Phenotyping under Controlled Conditions
2.4. Image Processing and Analysis
2.5. Random Forest
3. Results
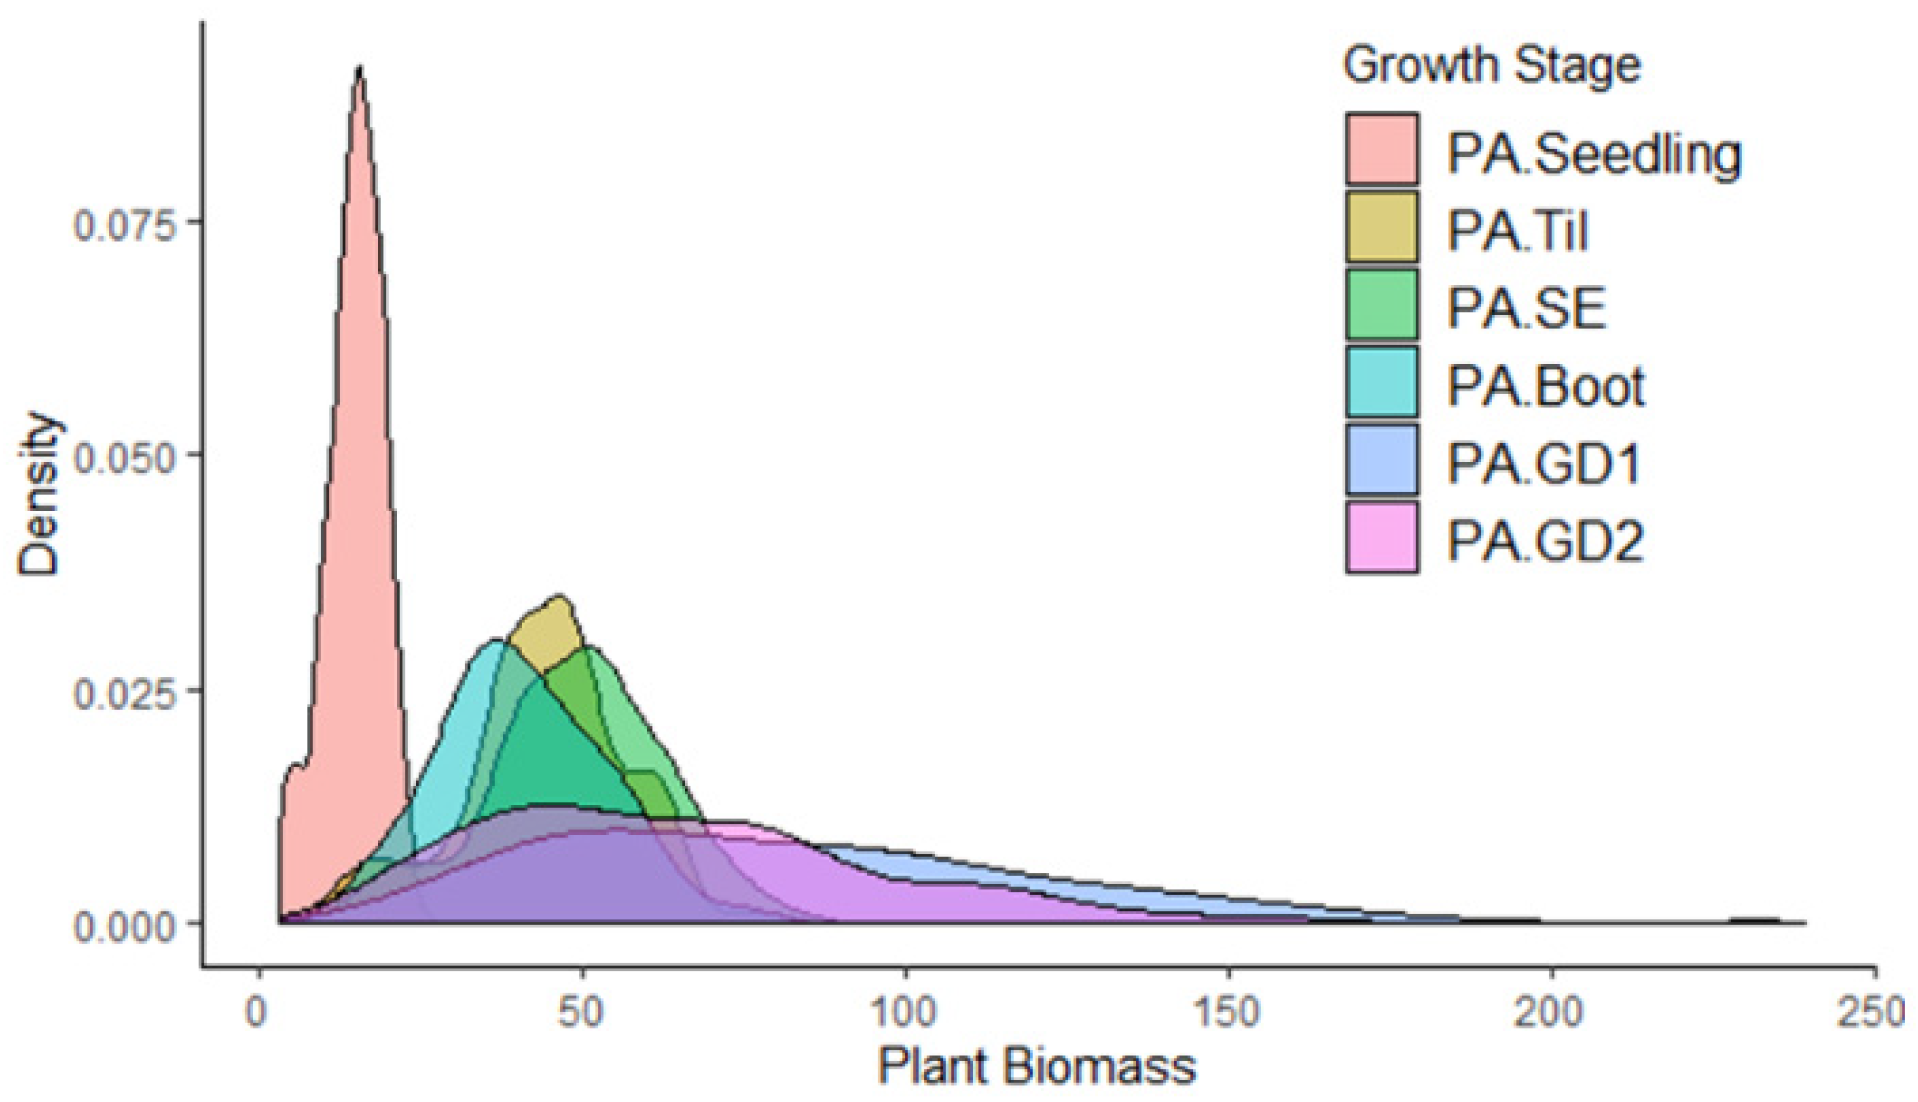
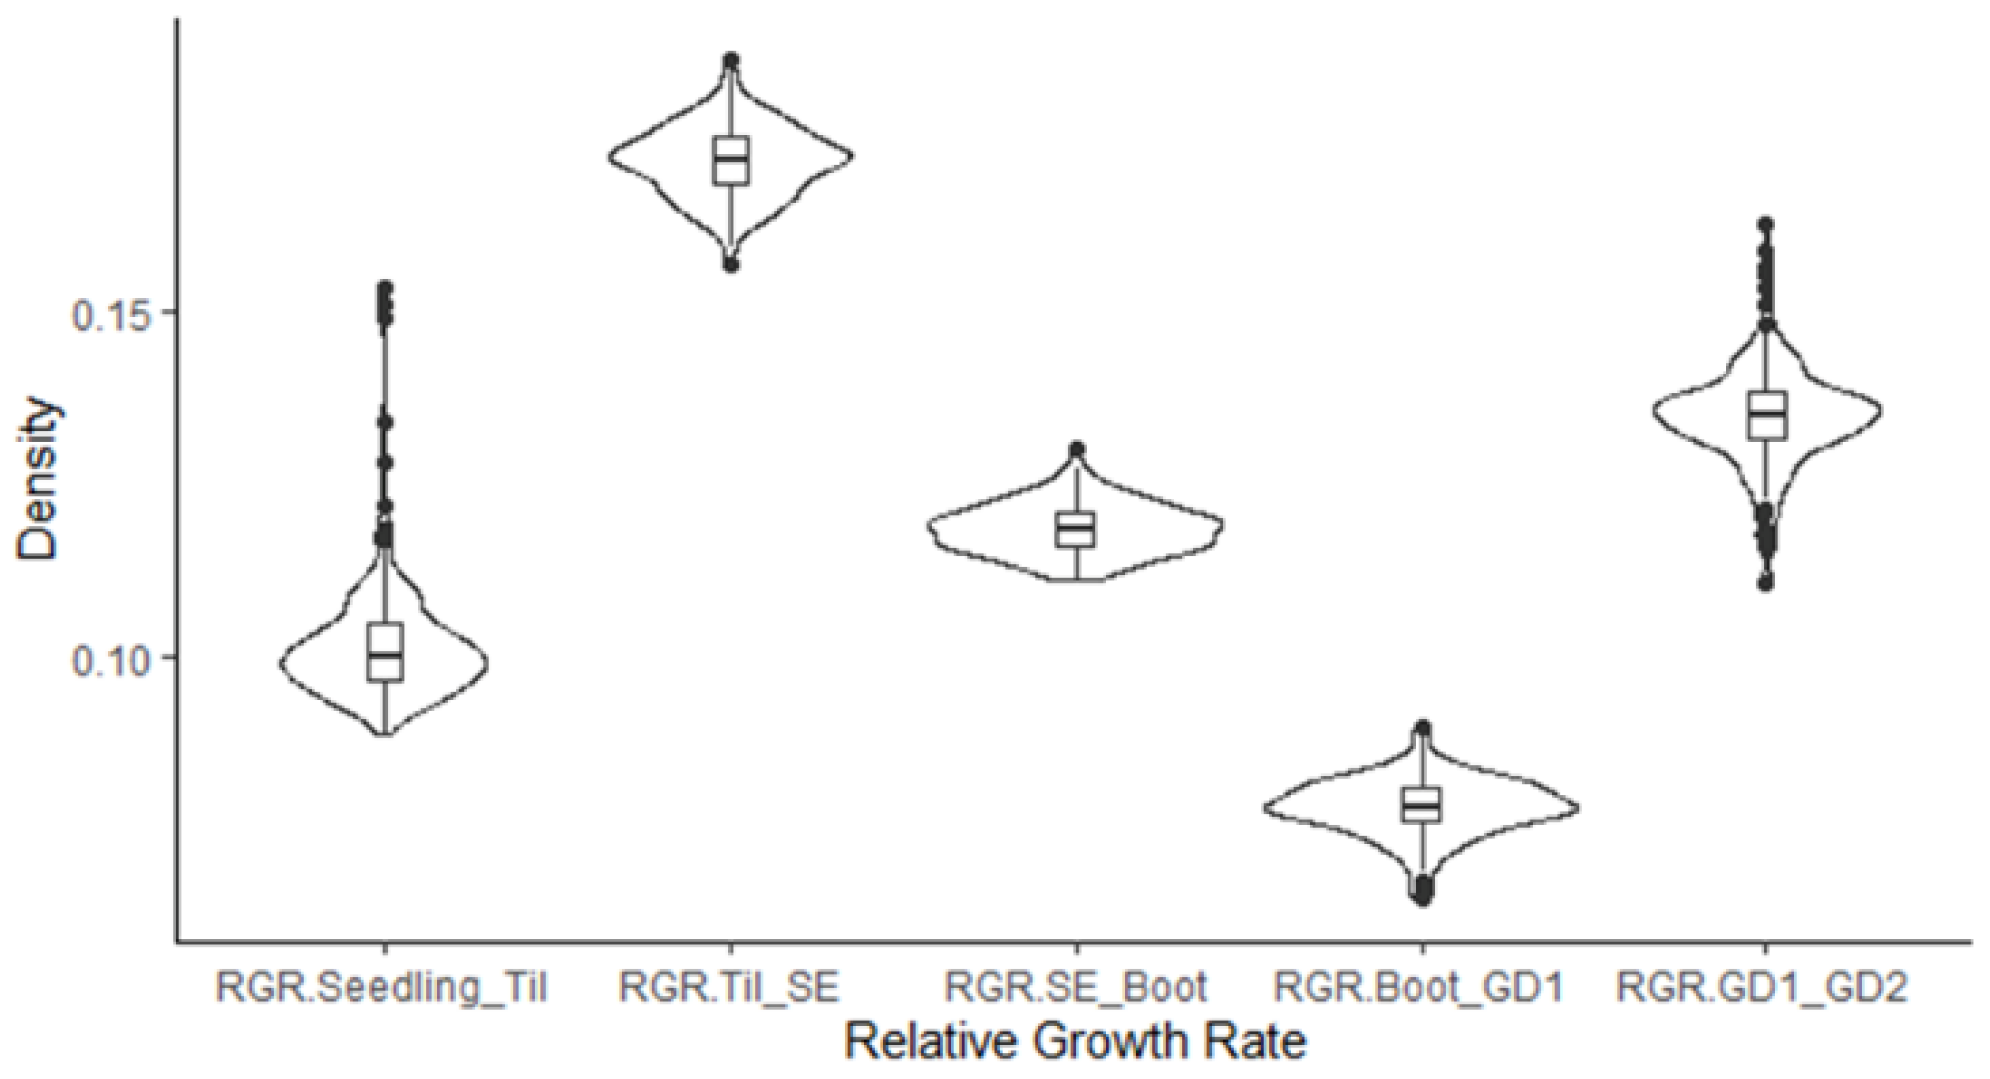
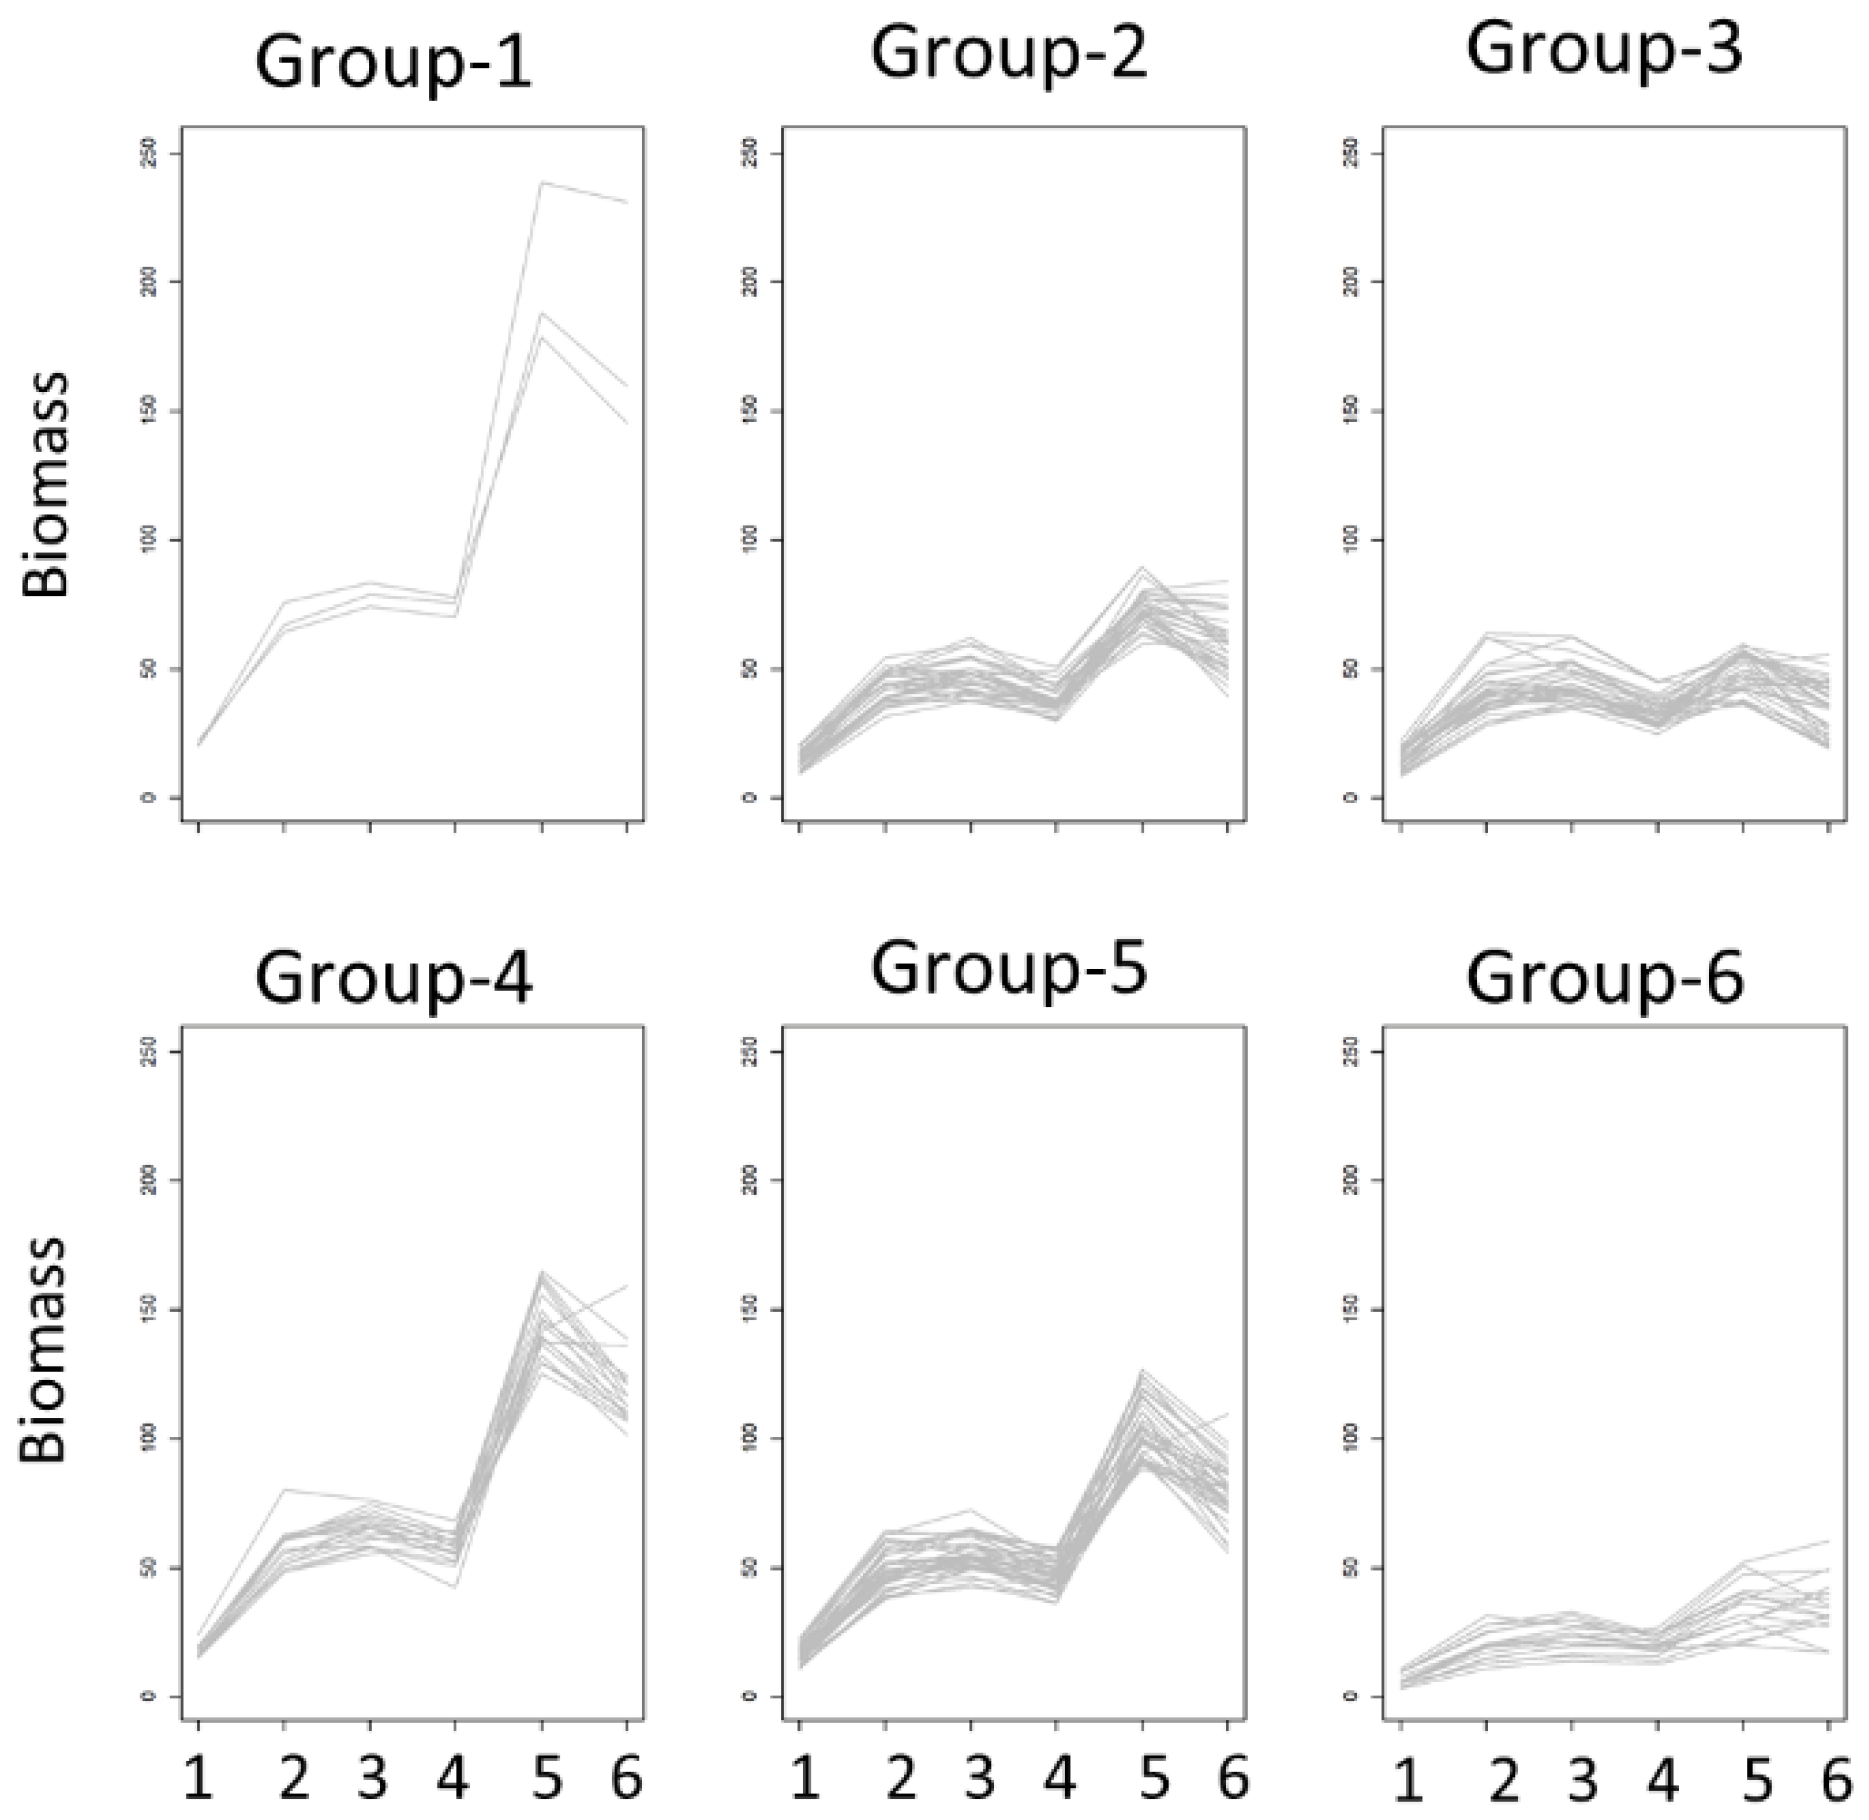
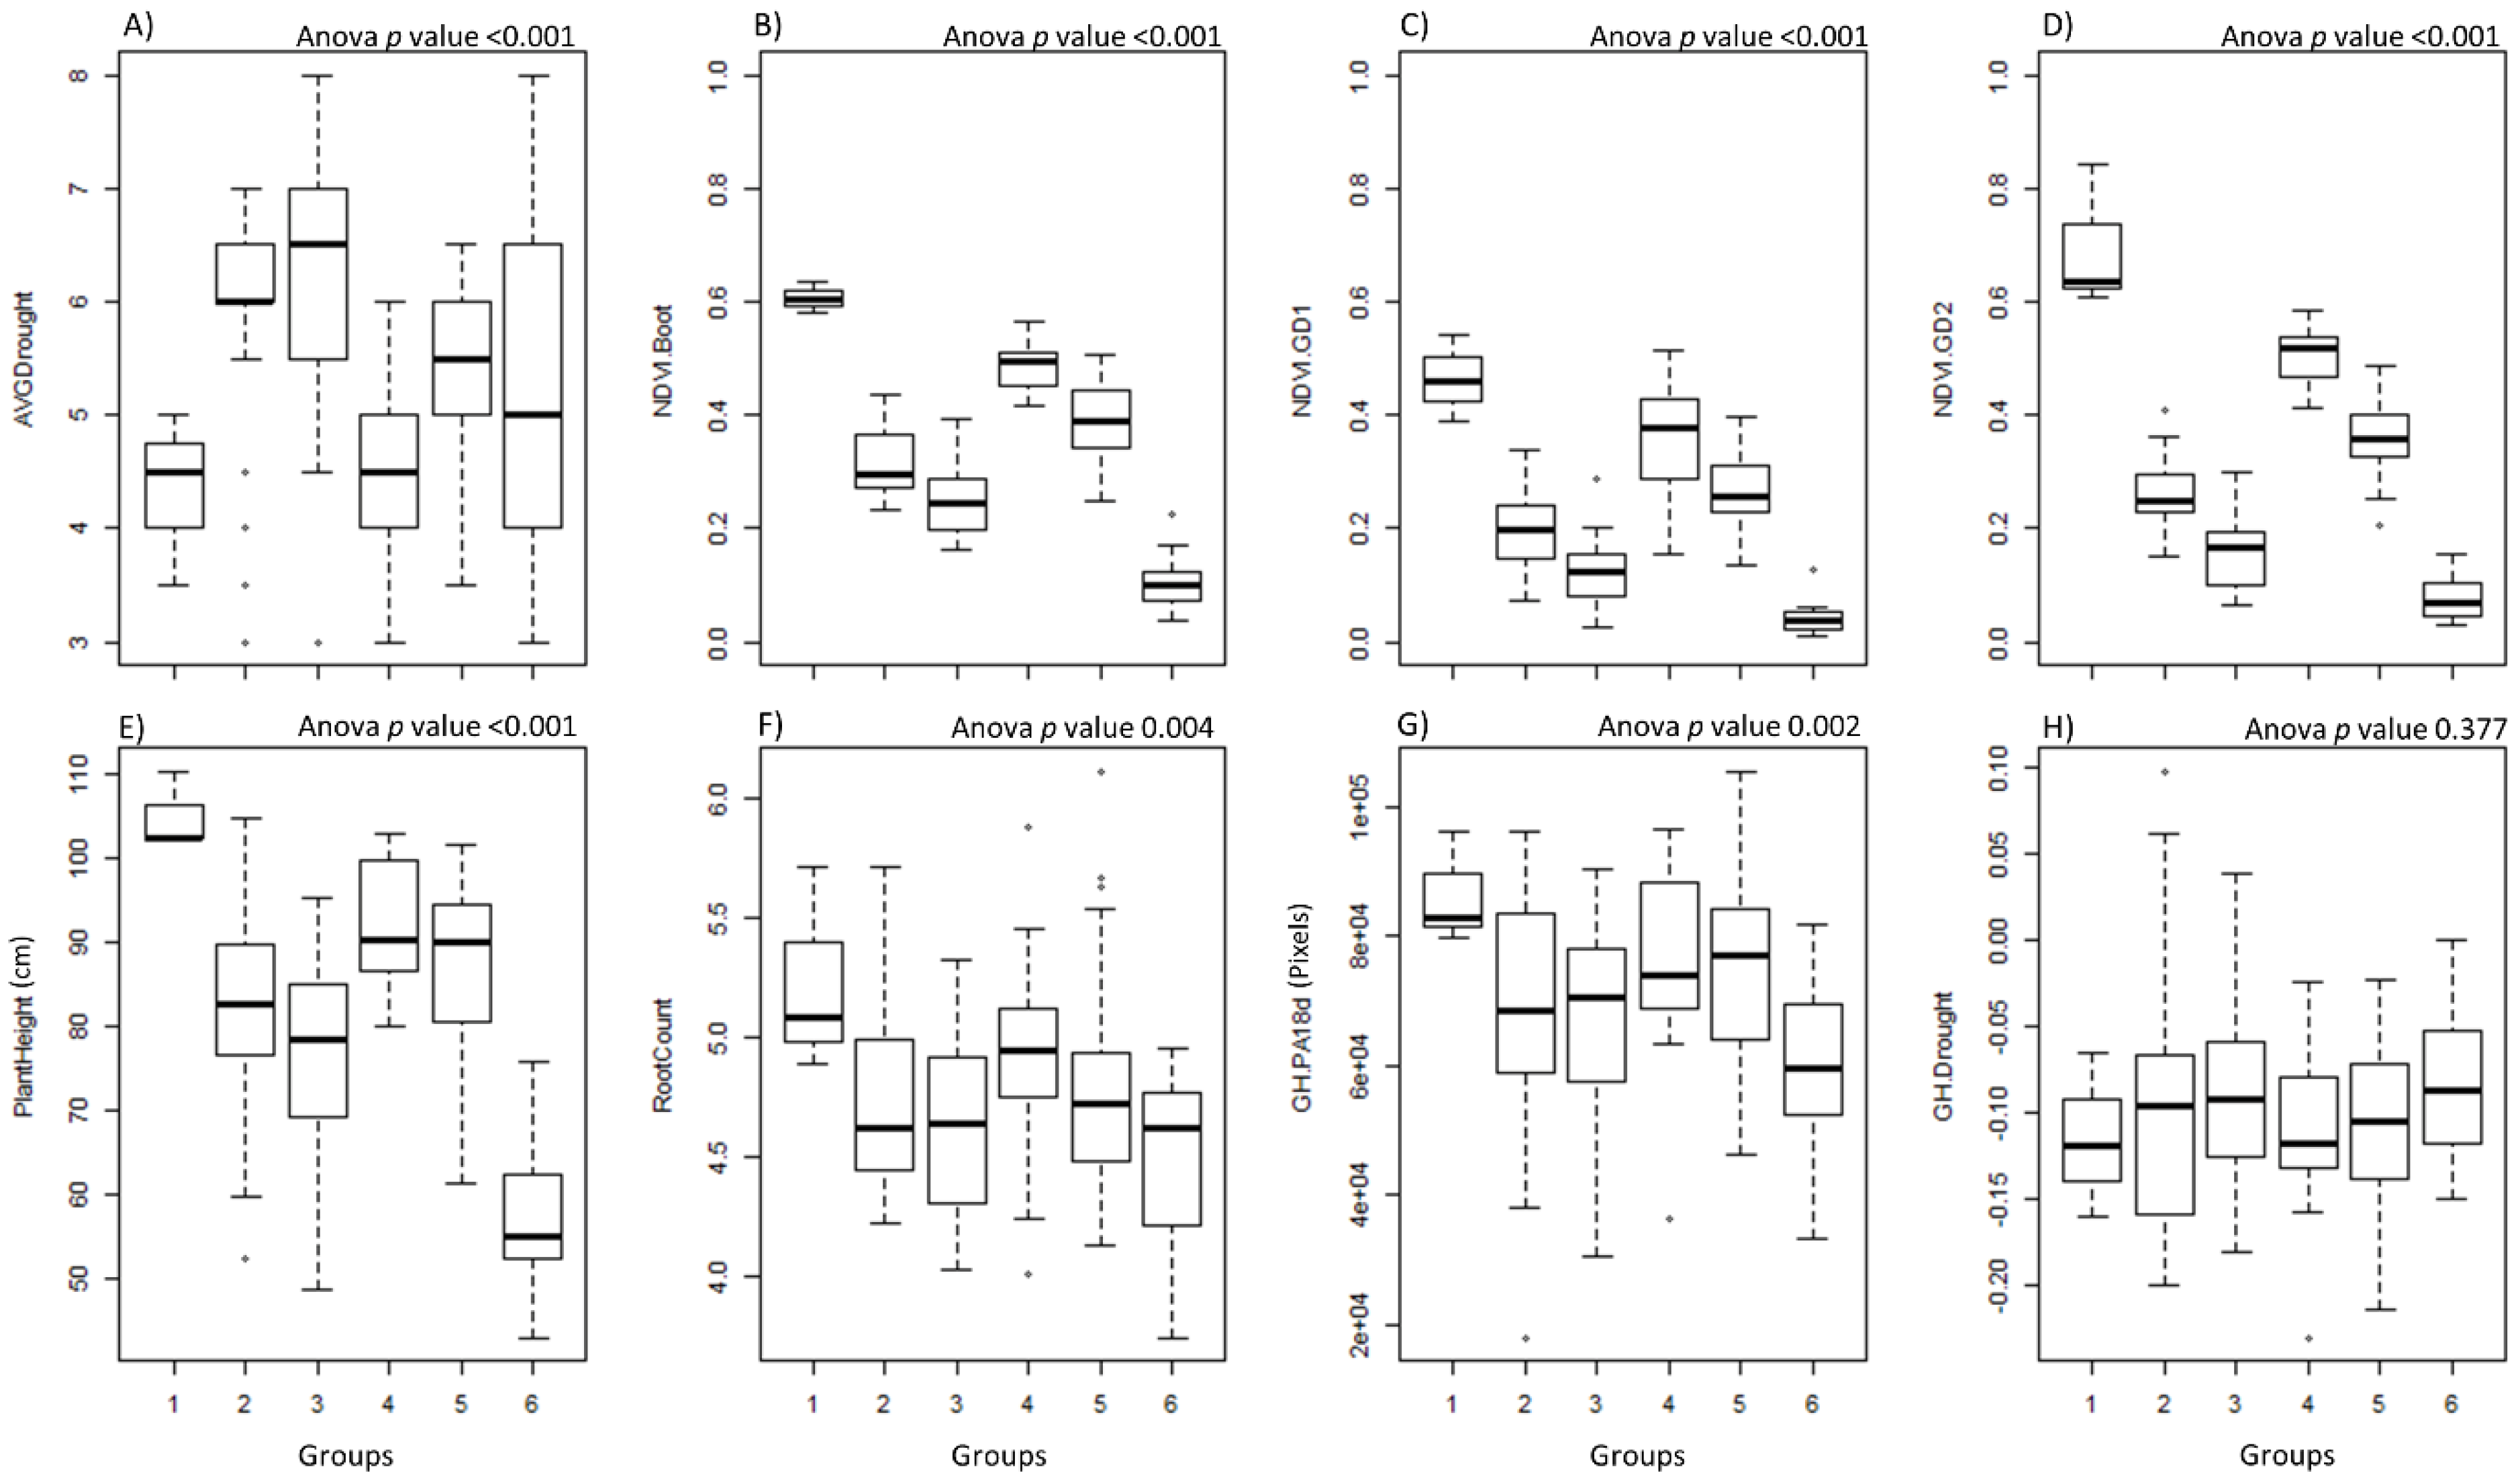
3.1. Phenotypic Characterization under Field Conditions
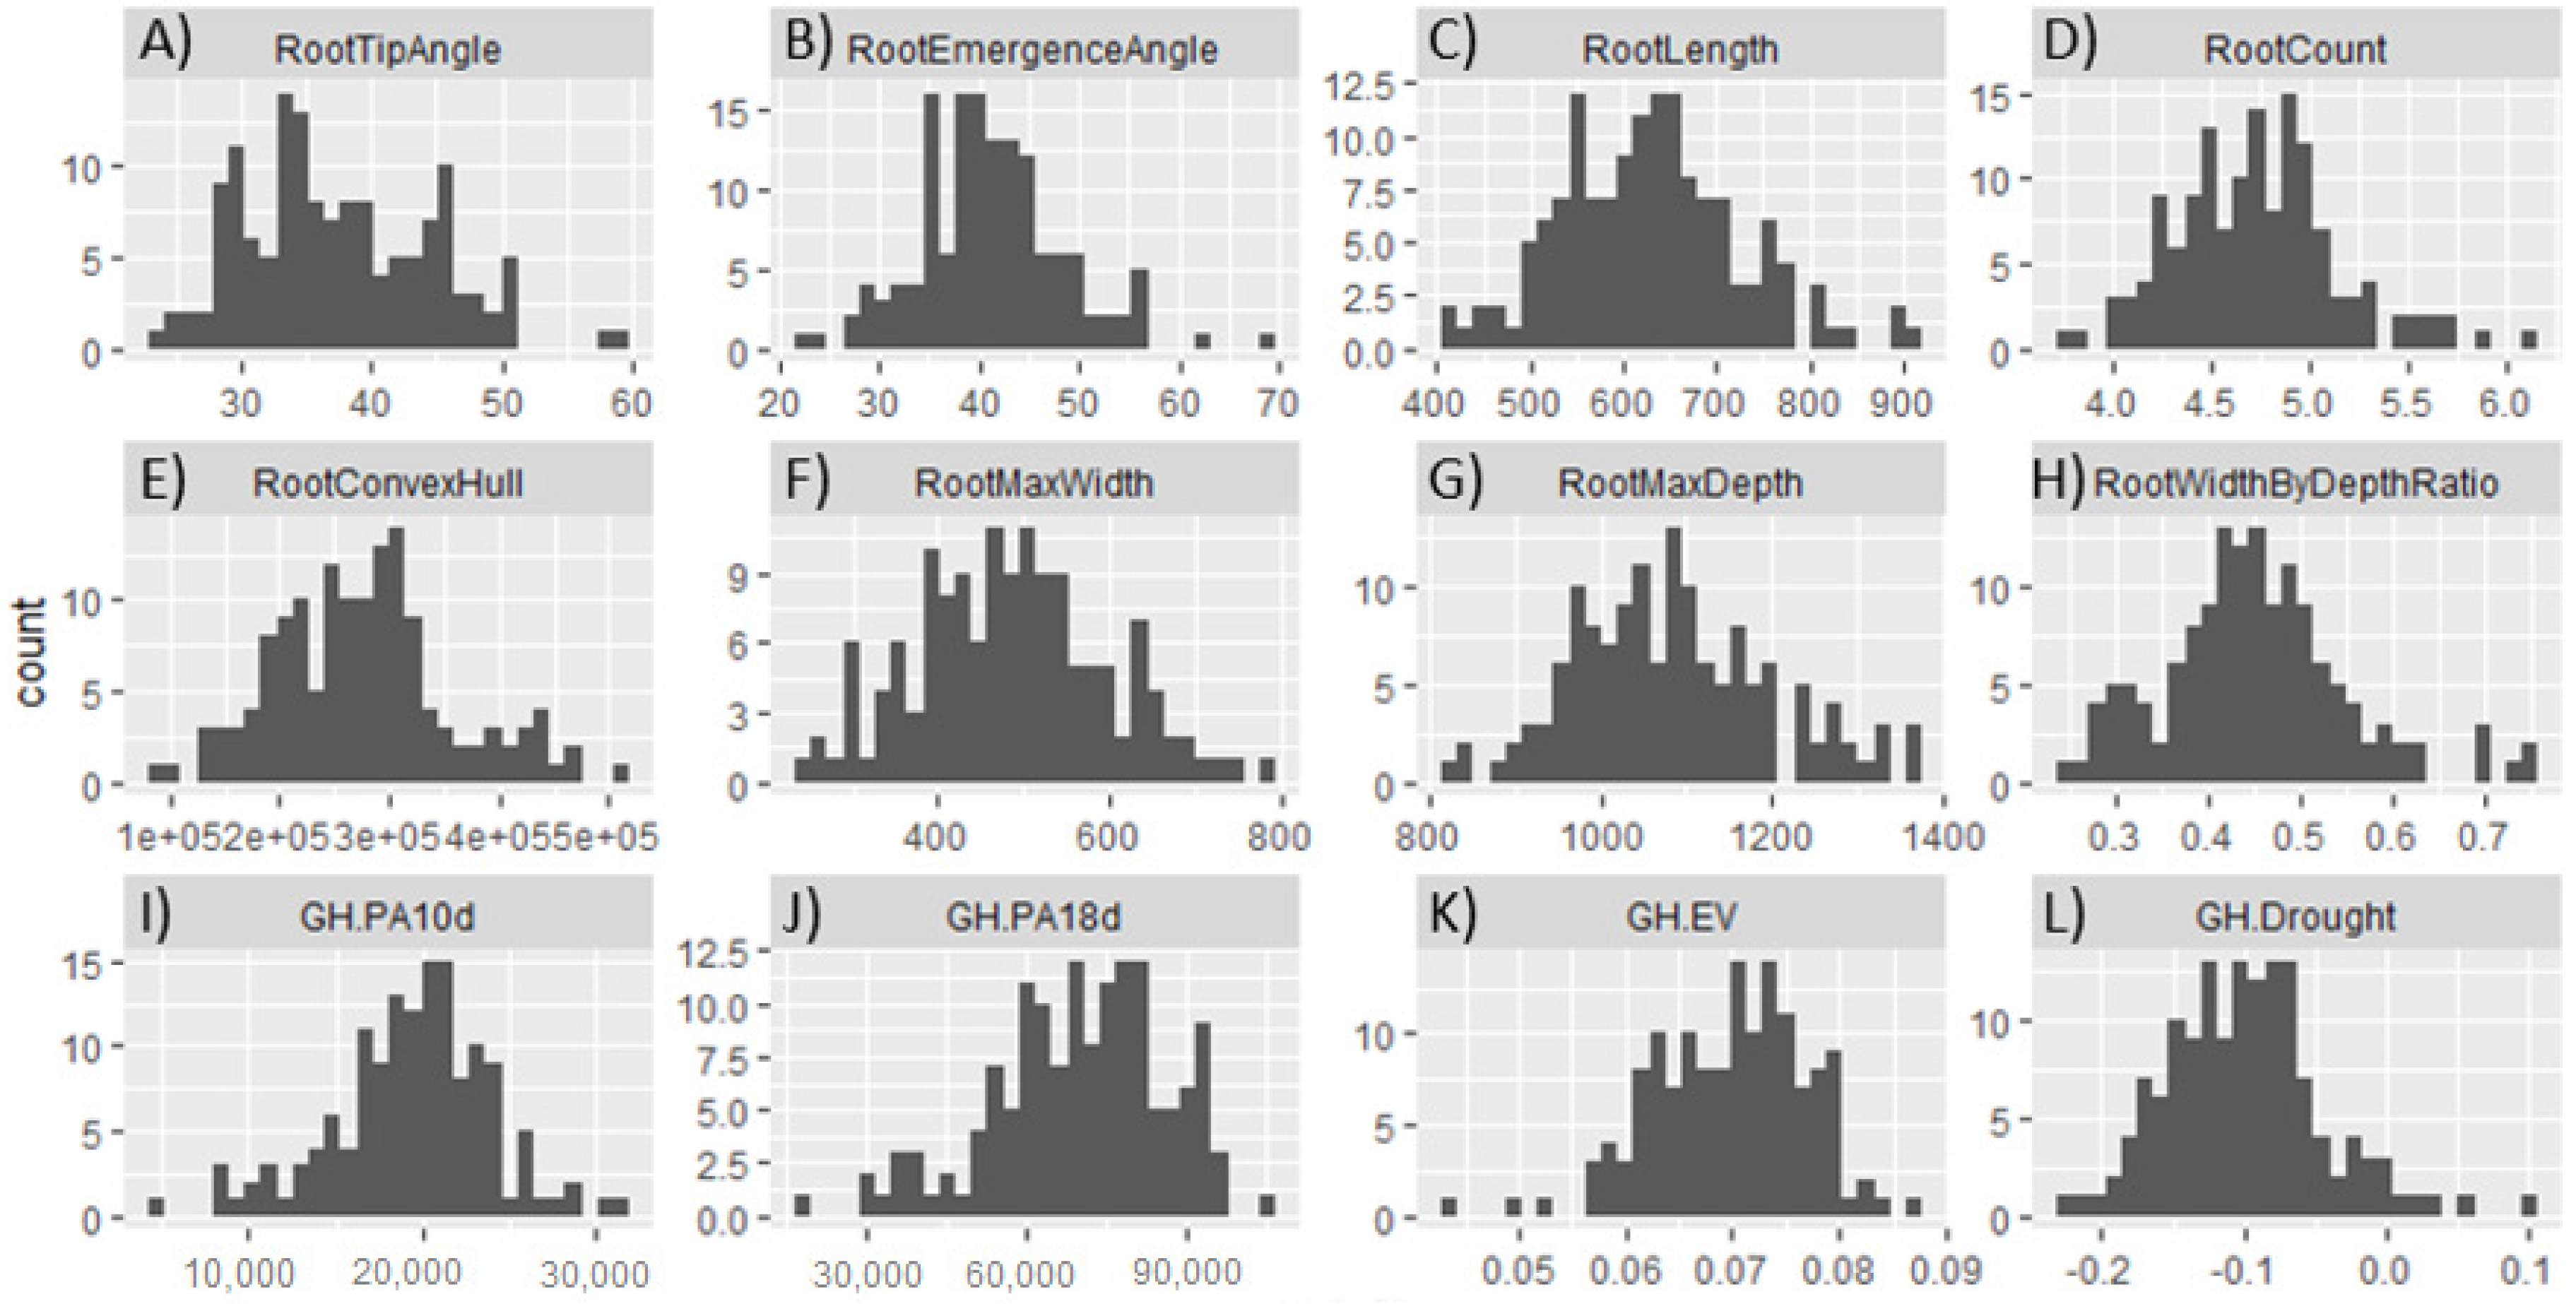
3.2. Phenotypic Characterization under Controlled Growth Conditions
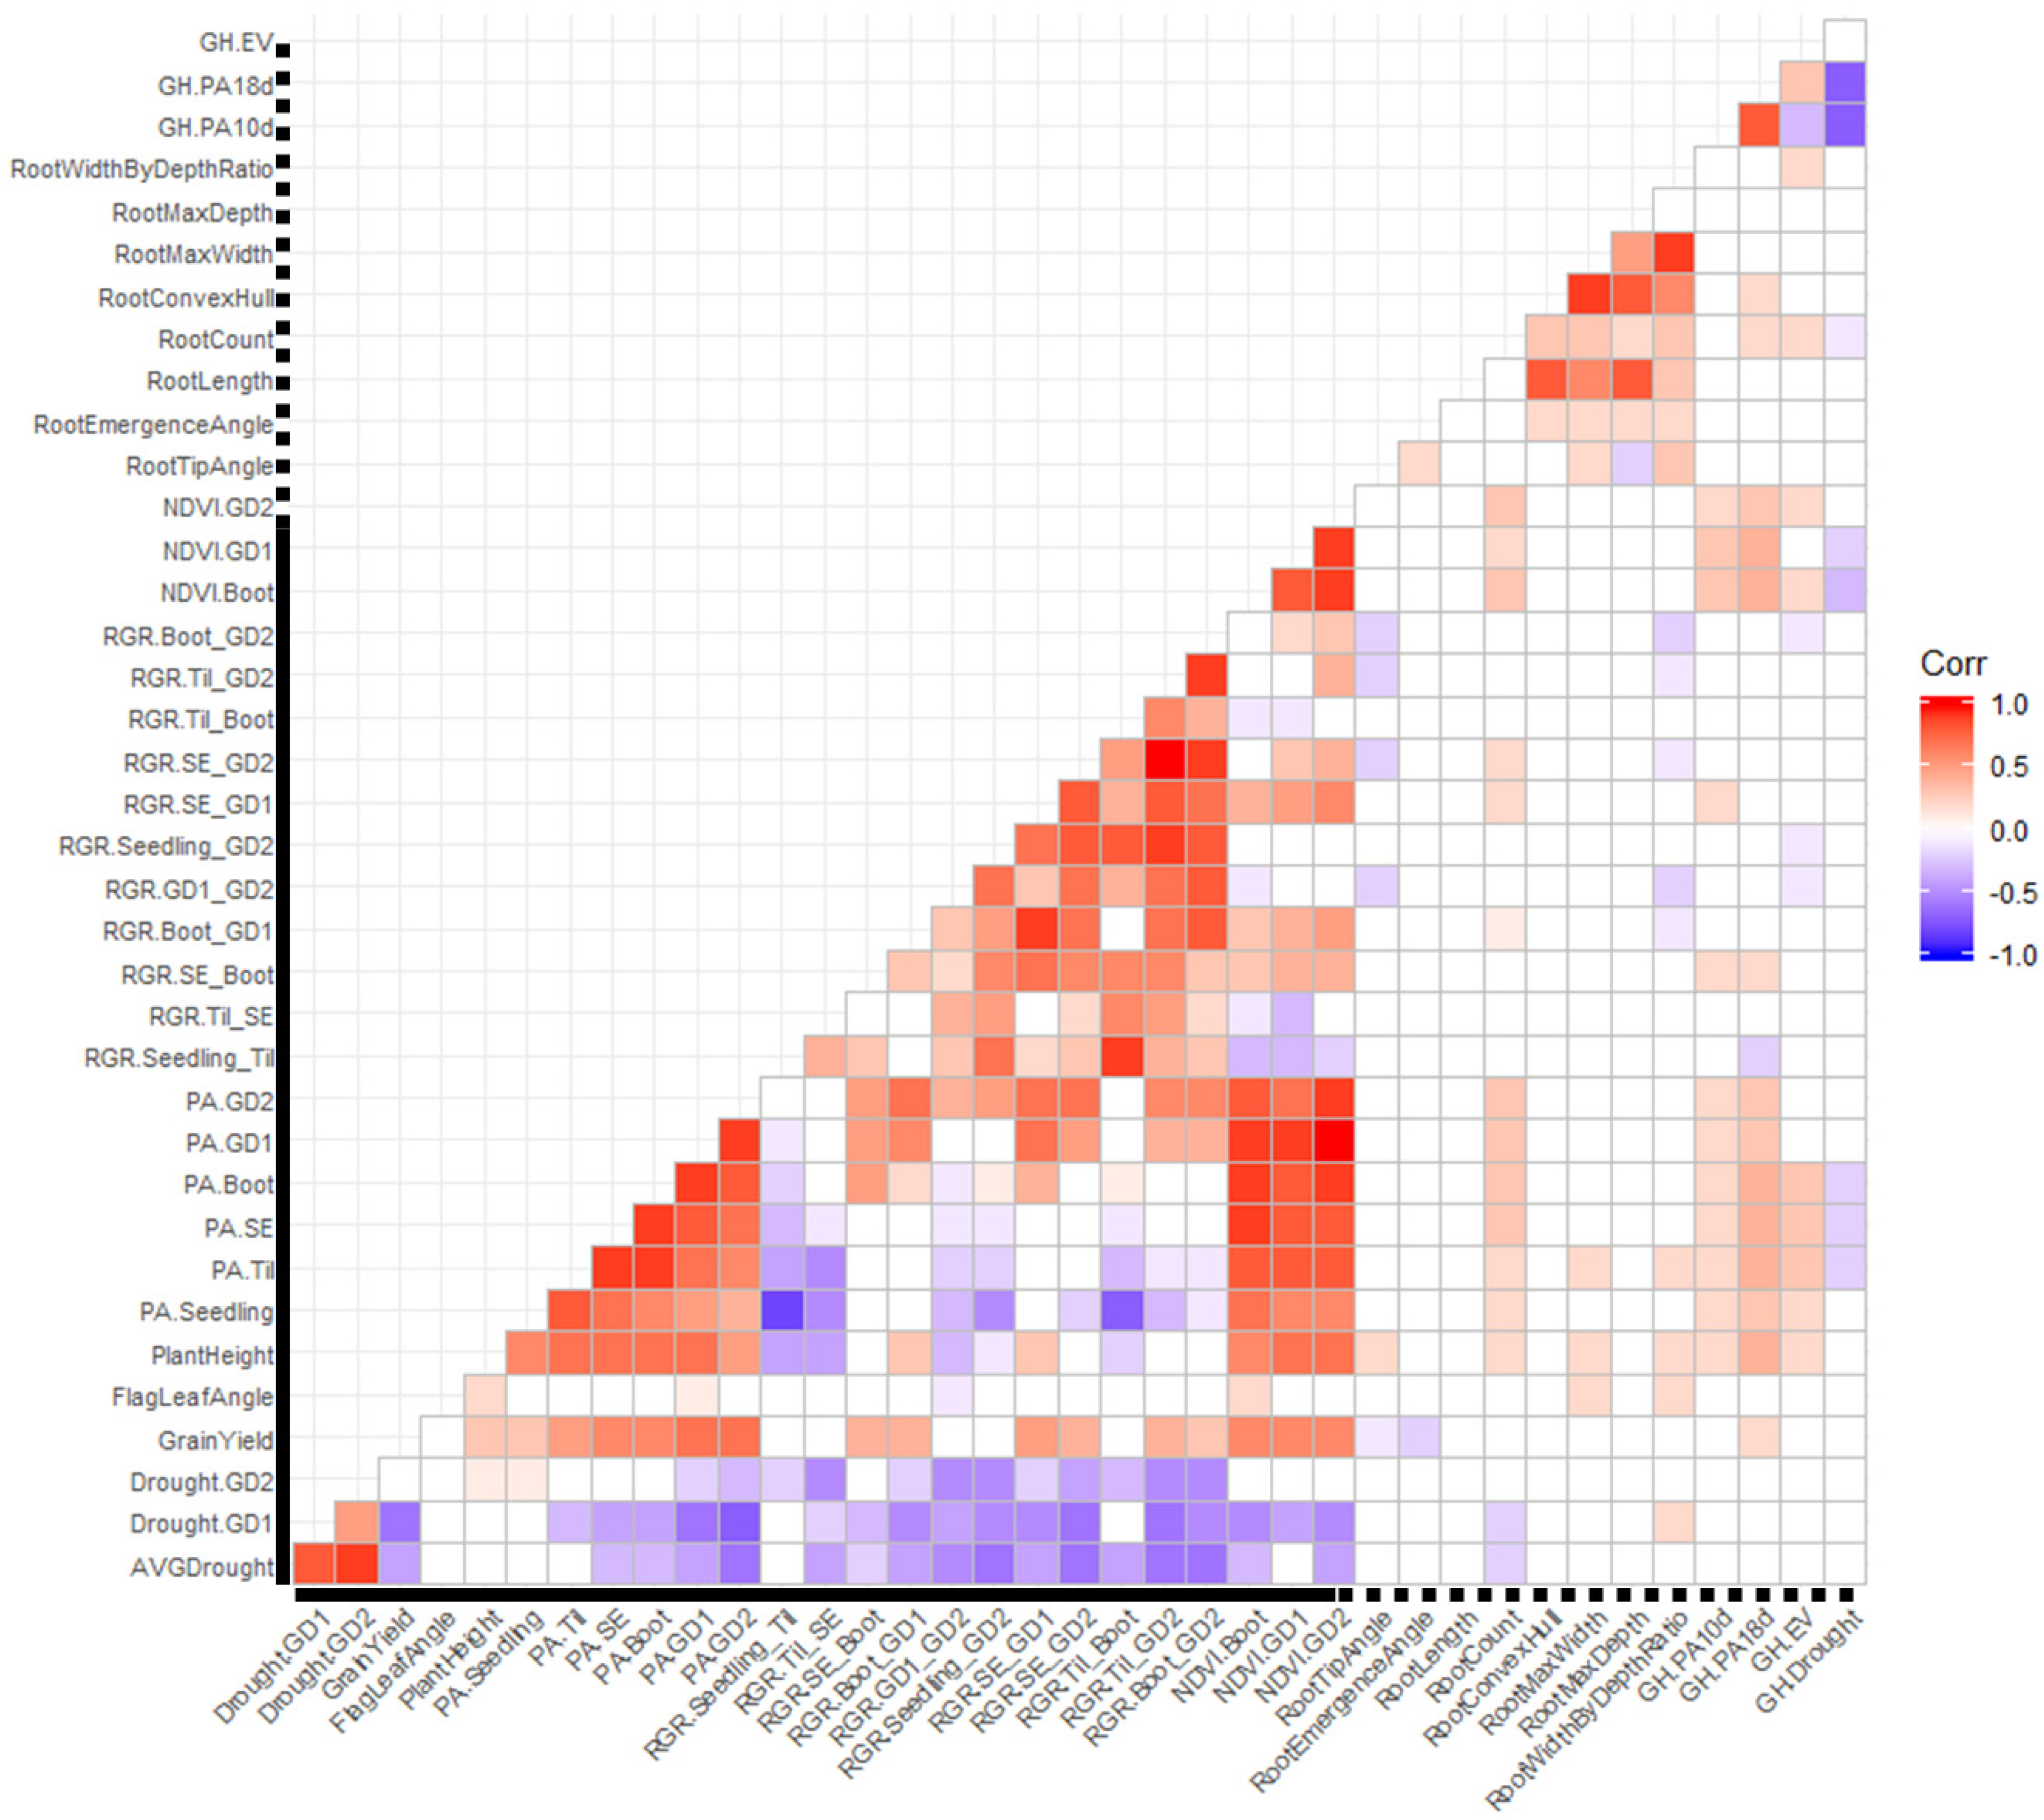
3.3. Correlation Analysis
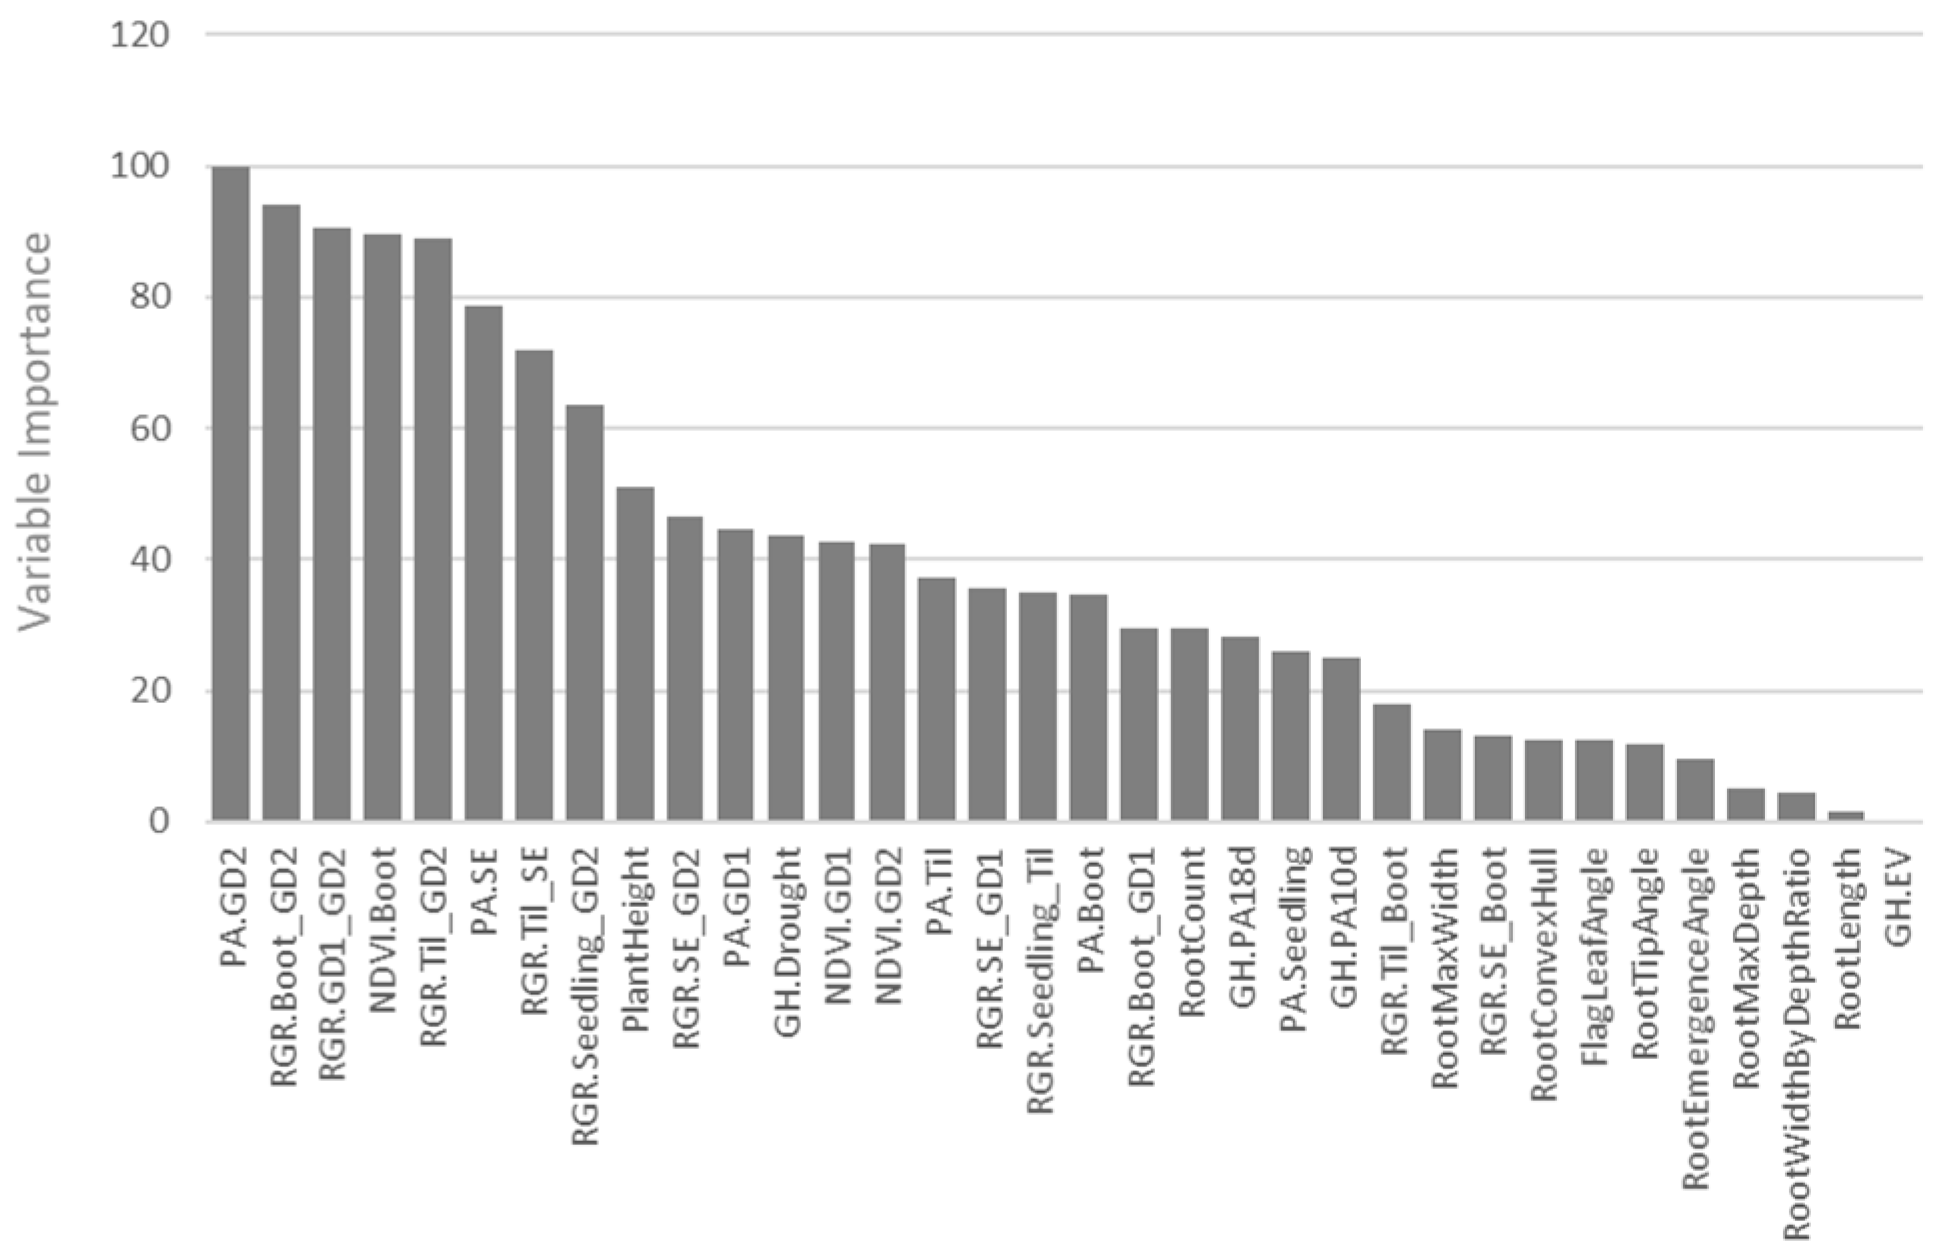
3.4. Random Forest for Prediction of Drought Tolerance
4. Discussion
5. Conclusions
Supplementary Materials
Author Contributions
Funding
Conflicts of Interest
References
- Shiferaw, B.; Smale, M.; Braun, H.-J.; Duveiller, E.; Reynolds, M.; Muricho, G. Crops that feed the world 10. Past successes and future challenges to the role played by wheat in global food security. Food Secur. 2013, 5, 291–317. [Google Scholar] [CrossRef] [Green Version]
- Ray, D.K.; Mueller, N.D.; West, P.C.; Foley, J.A. Yield trends are insufficient to double global crop production by 2050. PLoS ONE 2013, 8, e66428. [Google Scholar] [CrossRef] [Green Version]
- Tester, M.; Langridge, P. Breeding technologies to increase crop production in a changing world. Science 2010, 327, 818–822. [Google Scholar] [CrossRef] [PubMed]
- Ceglar, A.; Toreti, A.; Lecerf, R.; Van der Velde, M.; Dentener, F. Impact of meteorological drivers on regional inter-annual crop yield variability in France. Agric. For. Meteorol. 2016, 216, 58–67. [Google Scholar] [CrossRef]
- Olesen, J.E.; Jensen, T.; Petersen, J. Sensitivity of field-scale winter wheat production in Denmark to climate variability and climate change. Clim. Res. 2000, 15, 221–238. [Google Scholar] [CrossRef]
- Chawade, A.; Armoniené, R.; Berg, G.; Brazauskas, G.; Frostgård, G.; Geleta, M.; Gorash, A.; Henriksson, T.; Himanen, K.; Ingver, A. A transnational and holistic breeding approach is needed for sustainable wheat production in the Baltic Sea region. Physiol. Plant. 2018, 164, 442–451. [Google Scholar] [CrossRef] [PubMed] [Green Version]
- Team, B.A. Second assessment of climate change for the Baltic Sea basin. In Regional Climate Studies; Springer: Berlin/Heidelberg, Germany, 2015; Volume 6, pp. 131–144. [Google Scholar]
- Chenu, K.; Deihimfard, R.; Chapman, S.C. Large-scale characterization of drought pattern: A continent-wide modelling approach applied to the Australian wheatbelt–spatial and temporal trends. New Phytol. 2013, 198, 801–820. [Google Scholar] [CrossRef] [PubMed]
- Furbank, R.T.; Tester, M. Phenomics–Technologies to relieve the phenotyping bottleneck. Trends Plant Sci. 2011, 16, 635–644. [Google Scholar] [CrossRef]
- McCouch, S.; Baute, G.J.; Bradeen, J.; Bramel, P.; Bretting, P.K.; Buckler, E.; Burke, J.M.; Charest, D.; Cloutier, S.; Cole, G. Agriculture: Feeding the future. Nature 2013, 499, 23. [Google Scholar] [CrossRef]
- White, J.W.; Conley, M.M. A flexible, low-cost cart for proximal sensing. Crop Sci. 2013, 53, 1646–1649. [Google Scholar] [CrossRef] [Green Version]
- Virlet, N.; Sabermanesh, K.; Sadeghi-Tehran, P.; Hawkesford, M.J. Field Scanalyzer: An automated robotic field phenotyping platform for detailed crop monitoring. Funct. Plant Biol. 2017, 44, 143–153. [Google Scholar] [CrossRef] [PubMed] [Green Version]
- Rutkoski, J.; Poland, J.; Mondal, S.; Autrique, E.; Pérez, L.G.; Crossa, J.; Reynolds, M.; Singh, R. Canopy temperature and vegetation indices from high-throughput phenotyping improve accuracy of pedigree and genomic selection for grain yield in wheat. G3 Genes Genomes Genet. 2016, 6, 2799–2808. [Google Scholar] [CrossRef] [PubMed] [Green Version]
- Thorp, K.R.; Gore, M.; Andrade-Sanchez, P.; Carmo-Silva, A.; Welch, S.; White, J.; French, A.N. Proximal hyperspectral sensing and data analysis approaches for field-based plant phenomics. Comput. Electron. Agric. 2015, 118, 225–236. [Google Scholar] [CrossRef] [Green Version]
- Solomon, K.F.; Labuschagne, M.T. Morpho-physiological response of durum wheat genotypes to drought stress. S. Afr. J. Plant Soil 2013, 26, 141–146. [Google Scholar] [CrossRef] [Green Version]
- Simane, B.; Peacock, J.M.; Struik, P.C. Differences in developmental plasticity and growth rate among drought-resistant and susceptible cultivars of durum wheat (Triticum turgidum L. var. durum). Plant Soil 1993, 157, 155–166. [Google Scholar] [CrossRef]
- Reynolds, M.; Dreccer, F.; Trethowan, R. Drought-adaptive traits derived from wheat wild relatives and landraces. J. Exp. Bot. 2006, 58, 177–186. [Google Scholar] [CrossRef] [Green Version]
- Condorelli, G.E.; Maccaferri, M.; Newcomb, M.; Andrade-Sanchez, P.; White, J.W.; French, A.N.; Sciara, G.; Ward, R.; Tuberosa, R. Comparative Aerial and Ground Based High Throughput Phenotyping for the Genetic Dissection of NDVI as a Proxy for Drought Adaptive Traits in Durum Wheat. Front. Plant Sci. 2018, 9. [Google Scholar] [CrossRef]
- Liu, Z.; Li, C.; Zhou, P.; Chen, X. A probabilistic assessment of the likelihood of vegetation drought under varying climate conditions across China. Sci. Rep. 2016, 6. [Google Scholar] [CrossRef] [Green Version]
- An, J.; Li, W.; Li, M.; Cui, S.; Yue, H. Identification and Classification of Maize Drought Stress Using Deep Convolutional Neural Network. Symmetry 2019, 11, 256. [Google Scholar] [CrossRef] [Green Version]
- Singh, A.; Ganapathysubramanian, B.; Singh, A.K.; Sarkar, S. Machine Learning for High-Throughput Stress Phenotyping in Plants. Trends Plant Sci. 2016, 21, 110–124. [Google Scholar] [CrossRef] [Green Version]
- Aghabozorgi, S.; Shirkhorshidi, A.S.; Wah, T.Y. Time-series clustering–A decade review. Inf. Syst. 2015, 53, 16–38. [Google Scholar] [CrossRef]
- Montes, J.; Technow, F.; Dhillon, B.; Mauch, F.; Melchinger, A. High-throughput non-destructive biomass determination during early plant development in maize under field conditions. Field Crops Res. 2011, 121, 268–273. [Google Scholar] [CrossRef]
- Paparrizos, J.; Gravano, L. k-Shape: Efficient and Accurate Clustering of Time Series. In Proceedings of the 2015 ACM SIGMOD International Conference on Management of Data, Melbourne, Australia, 31 May–4 June 2015; pp. 1855–1870. [Google Scholar]
- Gracia-Romero, A.; Kefauver, S.C.; Fernandez-Gallego, J.A.; Vergara-Díaz, O.; Nieto-Taladriz, M.T.; Araus, J.L. UAV and Ground Image-Based Phenotyping: A Proof of Concept with Durum Wheat. Remote Sens. 2019, 11, 1244. [Google Scholar] [CrossRef] [Green Version]
- Gracia-Romero, A.; Vergara-Díaz, O.; Thierfelder, C.; Cairns, J.; Kefauver, S.; Araus, J. Phenotyping conservation agriculture management effects on ground and aerial remote sensing assessments of maize hybrids performance in Zimbabwe. Remote Sens. 2018, 10, 349. [Google Scholar] [CrossRef] [Green Version]
- Buchaillot, M.; Gracia-Romero, A.; Vergara-Diaz, O.; Zaman-Allah, M.A.; Tarekegne, A.; Cairns, J.E.; Prasanna, B.M.; Araus, J.L.; Kefauver, S.C. Evaluating Maize Genotype Performance under Low Nitrogen Conditions Using RGB UAV Phenotyping Techniques. Sensors 2019, 19, 1815. [Google Scholar] [CrossRef] [Green Version]
- Tripodi, P.; Massa, D.; Venezia, A.; Cardi, T. Sensing technologies for precision phenotyping in vegetable crops: Current status and future challenges. Agronomy 2018, 8, 57. [Google Scholar] [CrossRef] [Green Version]
- Crain, J.L.; Wei, Y.; Barker, J.; Thompson, S.M.; Alderman, P.D.; Reynolds, M.; Zhang, N.; Poland, J. Development and Deployment of a Portable Field Phenotyping Platform. Crop Sci. 2016, 56. [Google Scholar] [CrossRef]
- Zadoks, J.C.; Chang, T.T.; Konzak, C.F. A decimal code for the growth stages of cereals. Weed Res. 1974, 14, 415–421. [Google Scholar] [CrossRef]
- IRRI. Standard Evaluation System for Rice (SES), 5th ed.; International Rice Research Institute (IRRI): Los Baños, Philippines, 2013. [Google Scholar]
- Armoniené, R.; Odilbekov, F.; Vivekanand, V.; Chawade, A. Affordable imaging lab for noninvasive analysis of biomass and early vigour in cereal crops. BioMed Res. Int. 2018, 2018, 9. [Google Scholar] [CrossRef]
- Thomas, C.L.; Graham, N.S.; Hayden, R.; Meacham, M.C.; Neugebauer, K.; Nightingale, M.; Dupuy, L.X.; Hammond, J.P.; White, P.J.; Broadley, M.R. High-throughput phenotyping (HTP) identifies seedling root traits linked to variation in seed yield and nutrient capture in field-grown oilseed rape (Brassica napus L.). Ann. Bot. 2016, 118, 655–665. [Google Scholar] [CrossRef] [Green Version]
- DigiCamControl. Available online: http://digicamcontrol.com/ (accessed on 1 March 2019).
- Rawtherapee. Available online: https://rawtherapee.com/ (accessed on 1 February 2019).
- Gehan, M.A.; Fahlgren, N.; Abbasi, A.; Berry, J.C.; Callen, S.T.; Chavez, L.; Doust, A.N.; Feldman, M.J.; Gilbert, K.B.; Hodge, J.G. PlantCV v2: Image analysis software for high-throughput plant phenotyping. PeerJ 2017, 5, e4088. [Google Scholar] [CrossRef] [PubMed]
- Pound, M.P.; French, A.P.; Atkinson, J.A.; Wells, D.M.; Bennett, M.J.; Pridmore, T. RootNav: Navigating images of complex root architectures. Plant Physiol. 2013, 162, 1802–1814. [Google Scholar] [CrossRef] [PubMed] [Green Version]
- Mendiburu, F.D. Agricolae: Statistical Procedures for Agricultural Research, R package version 1.2-8. 2017. [Google Scholar]
- R Core Team. R: A Language and Environment for Statistical Computing; R Foundation for Statistical Computing: Vienna, Austria, 2017. [Google Scholar]
- Hunt, R. Plant Growth Curves: The Functional Approach to Plant Growth Analysis; Arnold: London, UK, 1982; Volume viii, p. 248. [Google Scholar]
- Spinoni, J.; Naumann, G.; Vogt, J.V.; Barbosa, P. The biggest drought events in Europe from 1950 to 2012. J. Hydrol. Reg. Stud. 2015, 3, 509–524. [Google Scholar] [CrossRef]
- Veijalainen, N.; Ahopelto, L.; Marttunen, M.; Jääskeläinen, J.; Britschgi, R.; Orvomaa, M.; Belinskij, A.; Keskinen, M. Severe Drought in Finland: Modeling Effects on Water Resources and Assessing Climate Change Impacts. Sustainability 2019, 11, 2450. [Google Scholar] [CrossRef] [Green Version]
- Buras, A.; Rammig, A.; Zang, C.S. Quantifying impacts of the drought 2018 on European ecosystems in comparison to 2003. Biogeosciences 2019. [Google Scholar] [CrossRef] [Green Version]
- Mishra, A.K.; Singh, V.P. A review of drought concepts. J. Hydrol. 2010, 391, 202–216. [Google Scholar] [CrossRef]
- European Drought Observatory. Available online: https://edo.jrc.ec.europa.eu/edov2 (accessed on 29 January 2020).
- Odilbekov, F.; Armoniené, R.; Koc, A.; Svensson, J.; Chawade, A. GWAS-Assisted Genomic Prediction to Predict Resistance to Septoria Tritici Blotch in Nordic Winter Wheat at Seedling Stage. Front. Genet. 2019, 10. [Google Scholar] [CrossRef]
- Manschadi, A.M.; Christopher, J.; deVoil, P.; Hammer, G.L. The role of root architectural traits in adaptation of wheat to water-limited environments. Funct. Plant Biol. 2006, 33. [Google Scholar] [CrossRef] [Green Version]
- El Hassouni, K.; Alahmad, S.; Belkadi, B.; Filali-Maltouf, A.; Hickey, L.T.; Bassi, F.M. Root System Architecture and Its Association with Yield under Different Water Regimes in Durum Wheat. Crop Sci. 2018, 58, 2331–2346. [Google Scholar] [CrossRef] [Green Version]
- Watt, M.; Moosavi, S.; Cunningham, S.C.; Kirkegaard, J.A.; Rebetzke, G.J.; Richards, R.A. A rapid, controlled-environment seedling root screen for wheat correlates well with rooting depths at vegetative, but not reproductive, stages at two field sites. Ann. Bot. 2013, 112, 447–455. [Google Scholar] [CrossRef] [Green Version]
- Canales, F.J.; Nagel, K.A.; Müller, C.; Rispail, N.; Prats, E. Deciphering Root Architectural Traits Involved to Cope With Water Deficit in Oat. Front. Plant Sci. 2019, 10. [Google Scholar] [CrossRef] [PubMed]
- Barbedo, J.G.A. A Review on the Use of Unmanned Aerial Vehicles and Imaging Sensors for Monitoring and Assessing Plant Stresses. Drones 2019, 3, 40. [Google Scholar] [CrossRef] [Green Version]
- Humplík, J.F.; Lazár, D.; Husičková, A.; Spíchal, L. Automated phenotyping of plant shoots using imaging methods for analysis of plant stress responses—A review. Plant Methods 2015, 11. [Google Scholar] [CrossRef] [PubMed] [Green Version]
- Poblete, T.; Ortega-Farías, S.; Moreno, M.; Bardeen, M. Artificial Neural Network to Predict Vine Water Status Spatial Variability Using Multispectral Information Obtained from an Unmanned Aerial Vehicle (UAV). Sensors 2017, 17, 2488. [Google Scholar] [CrossRef] [PubMed] [Green Version]
- Romero, M.; Luo, Y.; Su, B.; Fuentes, S. Vineyard water status estimation using multispectral imagery from an UAV platform and machine learning algorithms for irrigation scheduling management. Comput. Electron. Agric. 2018, 147, 109–117. [Google Scholar] [CrossRef]
- Berger, B.; Parent, B.; Tester, M. High-throughput shoot imaging to study drought responses. J. Exp. Bot. 2010, 61, 3519–3528. [Google Scholar] [CrossRef] [Green Version]
- Garnett, T.; Conn, V.; Kaiser, B.N. Root based approaches to improving nitrogen use efficiency in plants. Plant Cell Environ. 2009, 32, 1272–1283. [Google Scholar] [CrossRef]
- Tuberosa, R. Phenotyping for drought tolerance of crops in the genomics era. Front. Physiol. 2012, 3. [Google Scholar] [CrossRef] [Green Version]
- Ryan, P.R.; Liao, M.; Delhaize, E.; Rebetzke, G.J.; Weligama, C.; Spielmeyer, W.; James, R.A. Early vigour improves phosphate uptake in wheat. J. Exp. Bot. 2015, 66, 7089–7100. [Google Scholar] [CrossRef] [Green Version]


© 2020 by the authors. Licensee MDPI, Basel, Switzerland. This article is an open access article distributed under the terms and conditions of the Creative Commons Attribution (CC BY) license (http://creativecommons.org/licenses/by/4.0/).
Share and Cite
Kumar, D.; Kushwaha, S.; Delvento, C.; Liatukas, Ž.; Vivekanand, V.; Svensson, J.T.; Henriksson, T.; Brazauskas, G.; Chawade, A. Affordable Phenotyping of Winter Wheat under Field and Controlled Conditions for Drought Tolerance. Agronomy 2020, 10, 882. https://0-doi-org.brum.beds.ac.uk/10.3390/agronomy10060882
Kumar D, Kushwaha S, Delvento C, Liatukas Ž, Vivekanand V, Svensson JT, Henriksson T, Brazauskas G, Chawade A. Affordable Phenotyping of Winter Wheat under Field and Controlled Conditions for Drought Tolerance. Agronomy. 2020; 10(6):882. https://0-doi-org.brum.beds.ac.uk/10.3390/agronomy10060882
Chicago/Turabian StyleKumar, Dhananjay, Sandeep Kushwaha, Chiara Delvento, Žilvinas Liatukas, Vivekanand Vivekanand, Jan T. Svensson, Tina Henriksson, Gintaras Brazauskas, and Aakash Chawade. 2020. "Affordable Phenotyping of Winter Wheat under Field and Controlled Conditions for Drought Tolerance" Agronomy 10, no. 6: 882. https://0-doi-org.brum.beds.ac.uk/10.3390/agronomy10060882