The Submergence of the Graft Union Causes the Death of Grafted Mango Trees (Mangifera indica L.) under Flooding

Graduate school of Agriculture, Meiji University, Kawasaki, Kanagawa 214-8571, Japan
*
Author to whom correspondence should be addressed.
Agronomy 2020, 10(8), 1121; https://0-doi-org.brum.beds.ac.uk/10.3390/agronomy10081121
Submission received: 3 July 2020
/
Revised: 28 July 2020
/
Accepted: 29 July 2020
/
Published: 1 August 2020
(This article belongs to the Section Horticultural and Floricultural Crops)
Abstract
:The risk of flooding has increased as a result of climate change inspired by global warming. In this study, the difference in tolerance to flooding between grafted trees and seedlings was investigated in mango trees (Mangifera indica L.). Two levels of flooding treatment were established, in addition to a non-treated control. One was “30-flood,” in which trees were submerged up to 30 cm from the soil surface, and another was “10-flood,” in which trees were submerged up to 10 cm from the soil surface. Grafted trees treated with the 30-flood were submerged up to 5 cm above the graft union. Only the grafted trees in the 30-flood treatment began to decrease Fv/Fm and the root sugar content during treatment, then died after the completion of treatment. In grafted trees and seedlings alike, both flooding treatments also reduced root vigor, as determined by triphenyl tetrazolium chloride reduction tests and root starch content. However, root vigor and root starch content in grafted trees treated with the 10-flood as well as seedlings treated with both 10- and 30-flood recovered within two months after the completion of treatment, so that no significant differences were detected between the control. These results suggest that the submergence of the graft union into water causes the decline in photosynthesis of the scion first and the death of the grafted trees as a result.
1. Introduction
In recent years, the risk of flooding has increased as a result of global-warming-inspired climate change, and many mango orchards in tropical regions are exposed to potential damage. Since fruit trees are perennial crops and it takes several years after planting for the fruit to appear, fields devoted to fruit production are hardly restored to their previous use when the trees have been impacted by flooding [1]. Therefore, it seems that sustainable fruit cultivation is difficult in areas where flooding occurs frequently, and even in areas where flooding has not occurred, the threat of flooding in the future may lead to a reduction in the cultivation of fruit trees.
Flooding has been reported to induce a reduction in the photosynthetic rate of leaves in many tree species [2]. The photosynthetic rate of passion fruit tree leaves decreases with higher soil moisture content, resulting in a lower root starch content [3]. However, there are few reports about the effect of flooding on the root carbohydrate metabolism in mango trees (Mangifera indica L.), although it has been reported in some studies that the photosynthetic rate of mango leaves also decreased as a result of flooding [4]. In addition, the submergence of the underground part of the tree has been reported to induce anaerobic respiration and affect ethanol accumulation and acetaldehyde and ethylene biosynthesis [5,6,7]. Although some of the trees subjected to flooding have been reported dead in the above studies, the conditions under which they died were not described in detail. Therefore, the mechanism of mango tree death caused by flooding remains unexplained.
Since most fruit trees are propagated vegetatively by grafting or cutting, many studies have reported the tolerance of rootstocks to flooding [8,9,10]. Flood tolerance of grafted fruit trees is mainly determined by the rootstock [11,12]. Although the flooding-tolerant species of wild mango relatives has been found [13], the mechanism of tree death under flooding cannot be explained.
In this study, we investigated the difference between grafted trees and seedlings with respect to the effects of flooding on severity of leaf stress, tree mortality, root respiration and carbohydrate content.
2. Materials and Methods
2.1. Plant Materials and Treatments
Seedlings of a polyembryonic cultivar ‘Tsar-Swain’ native to Taiwan [14] and ‘Irwin’ trees grafted onto the seedlings as rootstock were purchased from a nursery in Okinawa Prefecture in 2012. These trees were planted in approximately 40 L of non-woven fabric pots using commercially available humus-rich soil and were grown in a greenhouse at the Meiji University (Kawasaki, Kanagawa, Japan: 35°61′ N, 139°55′ E) until they were used in the experiment. Although the age of seedlings was unknown, the height of the trees and the diameter of their trunks were almost 1.5 m and 5 cm, respectively, at the commencement of the experiment. The grafted trees had been growing four years after grafting; the height of these trees and the diameter of their trunks were 1.2 m and 5 cm, respectively. The graft union of the grafted trees was approximately 25 cm above the surface of the ground.
The trees were assigned to three treatments from 5 June to 31 July, 2014: (1) non-flooded (control), (2) submerged up to 10 cm above the ground surface (10-flood) and (3) submerged up to 30 cm above the ground surface (30-flood). In each treatment, five seedlings and five grafted trees were used as five single-tree replications. Trees were treated by submerging the pots in plastic seat tubs (2 × 3 × 0.6 m) filled with tap water up to 40 or 60 cm deep. The treatment of trees in tubs with 60 cm of water corresponded to the 30-flood treatment, and the treatment of those in 40 cm deep water corresponded to the 10-flood treatment because the height of the pot was approximately 30 cm. The graft union of the grafted trees was submerged approximately 5 cm under the water surface in the 30-flood treatment, whereas it was above the water surface in the 10-flood treatment. The water level was checked every two to three days, and water was added up to the designated level when it was found to have fallen. The dissolved oxygen saturation level was maintained by aeration with an air pump (GX-500, GEX. Co., Ltd., Tokyo, Japan). Control trees were irrigated to field capacity almost every day.
Root samples were collected every week until 28 July and then subsequently every two weeks until October 23. Approximately 1 g of fine roots (<2 mm in diameter) were collected from 3 cm below the soil surface from each tree and then used for the determination of root activity and carbohydrate content. The samples were lyophilized and ground to powder after the root activity had been determined; their carbohydrate content was then analyzed.
2.2. Root Carbohydrate Content
Sugars were extracted from 50 mg of the ground sample using 80% hot ethanol for 1 h. Ethanol was removed from the extract by a centrifugal evaporator (CVE-200D, Tokyo Rika Kikai Co. Ltd., Tokyo, Japan). The aqueous phase was adjusted to a volume of 100 mL with distilled water and then used for the determination of sugar content. The residue was dried for 24 h in a draft oven set at 60 °C, and then starch was extracted with perchloric acid. Sugars and starch were determined by the anthrone method. Six milliliters of anthrone reagent was added to 1 mL of sample, heated at 100 °C for 10 min and then cooled to room temperature in running tap water. Subsequently, absorbance at 620 nm was measured using a spectrophotometer (V-630; JASCO, Tokyo, Japan), and sugar and starch contents were calculated as sucrose and glucose equivalents, respectively.
2.3. Root Activity
Root activity was assessed by triphenyl tetrazolium chloride (TTC) reduction test; 0.2 g of fresh roots were immersed in a mixed solution (1:1) of 0.4% 2,3,5-triphenyl-2H-tetrazolium chloride and phosphate buffer (pH 7.0) and then placed in an incubator (FMU-0541, FUKUSHIMA GALILEI CO., LTD., Osaka, Japan) set to dark at 37 °C. After 3 h of incubation, the roots were homogenized with approximately 5 mL of 99.5% ethanol [15]. Then, the supernatant was adjusted to a volume of 25 mL with 99.5% ethanol, and absorbance was determined at 520 nm as described above. The amount of triphenylformazan (TFP) was calculated from a calibration curve prepared by standard TFP. Root activity was expressed as the amount of TFP produced by 1 g of fresh roots in 3 h of incubation.
2.4. Leaf Water Potential and Chlorophyll Fluorescence
The leaf water potential was measured using a psychrometer (WP4-T; METER Group, Inc., Pullman, WA, USA) in an incubator maintained at 25 °C. Two leaves per tree were collected almost every two weeks at 8:00 h from 5 June to 28 August. At the time of leaf sampling, the adaxial surface was rubbed with wet sandpaper (# 1000) to remove the cuticular layer. The leaves were then sealed in an aluminum vapor deposition film bag and placed in an incubator maintained at 25 °C until they were measured. The water potential was measured using a 40 mm diameter section of the leaf disk.
Leaf chlorophyll fluorescence was measured every week from 5 June to 28 August between 9:00 and 10:00 h using leaves from the previous year. Measurements were undertaken using a MINI-PAM fluorometer (Walz, Germany) after 30 min of adaptation to darkness, and the maximum quantum yield (Fv/Fm) was calculated from the results as follows.
Fv/Fm = (Fm − Fo)/Fm
Fv: Variable fluorescence; Fm: Maximum fluorescence; Fo: Minimal fluorescence.
2.5. Statistical Analyses
All data were analyzed using software (KaleidaGraph, v.4.5; Synergy Software, Reading, PA, USA). Mean separations in TTC reduction, carbohydrate content, leaf water potential and leaf chlorophyll fluorescence among the treatments were undertaken in grafted trees and seedlings separately using Fisher’s least significance test when the analysis of variance was significant at p = 0.05 or p = 0.01. The correlation between sugar content and TTC reduction or starch content was analyzed by linear regression.
3. Results
3.1. Root Carbohydrates Content
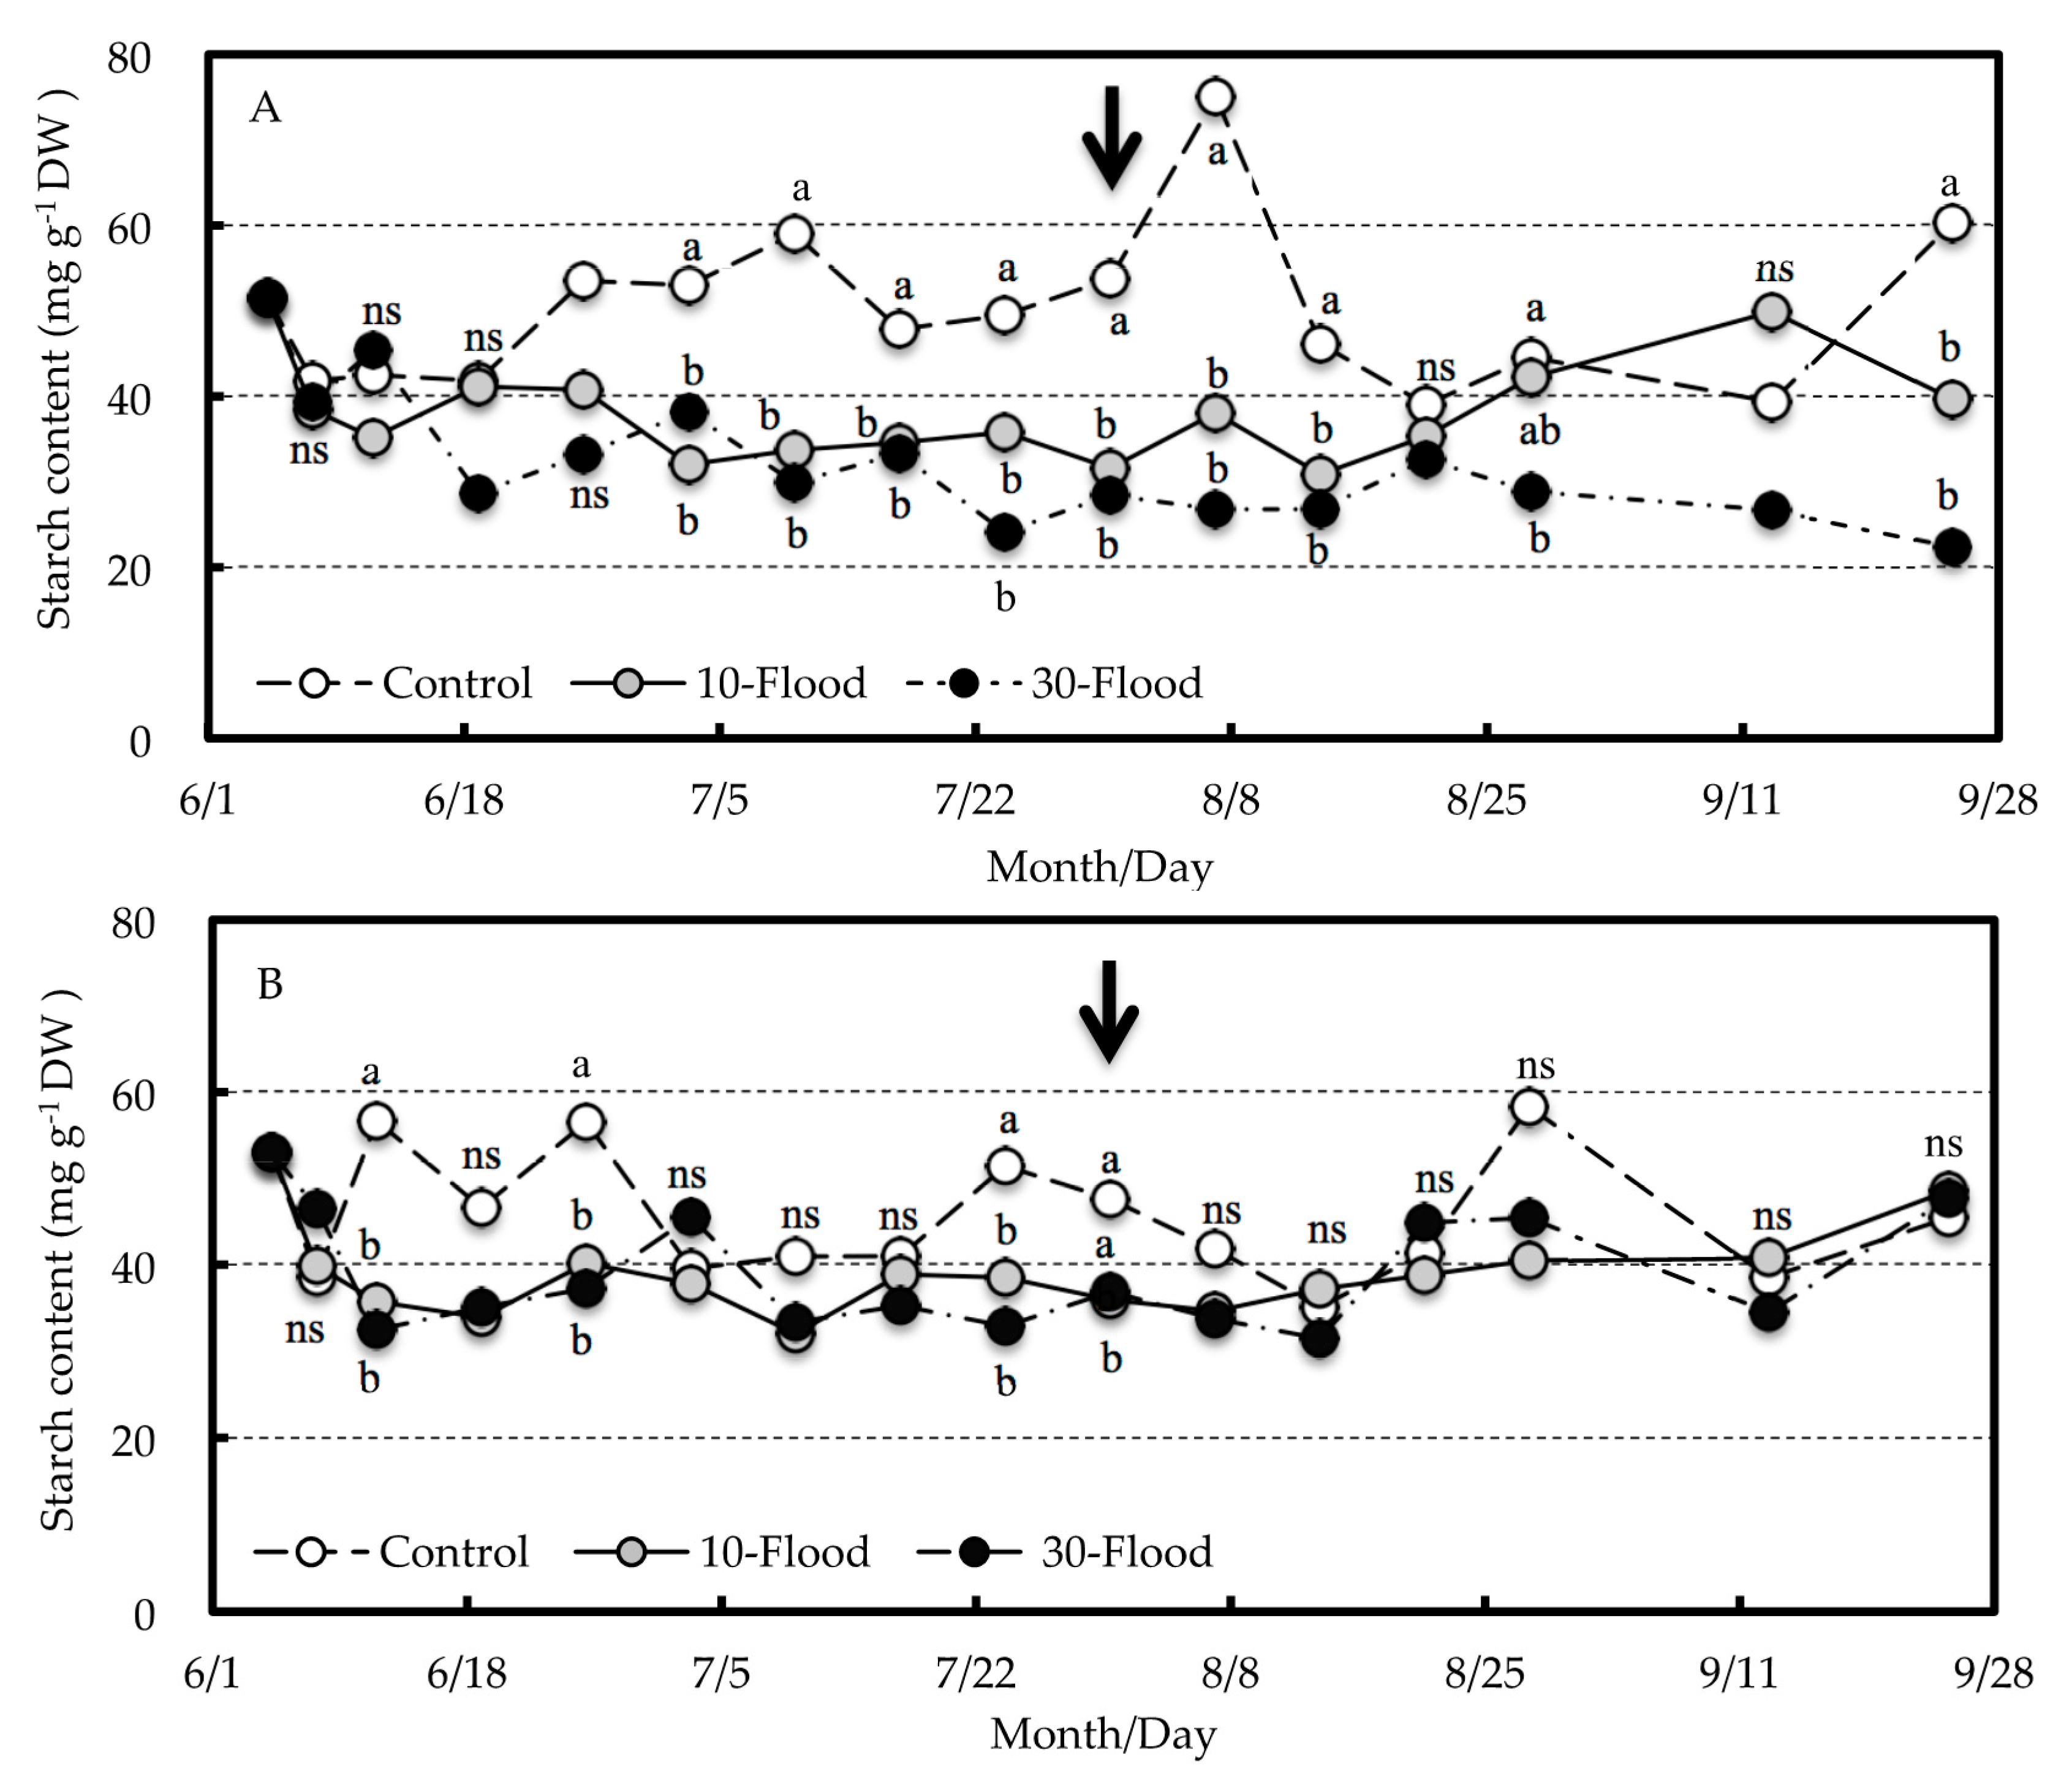
The starch content was approximately 50 mg g−1 dry weight (DW) at the start of the treatment, and there was no difference between grafted trees and seedlings. Then, it gradually decreased in the 10-flood and 30-flood treatments and was approximately 30 mg in grafted trees and 40 mg g−1 DW in seedlings at the end of the treatment (Figure 1). In grafted trees, the starch content was significantly lower in the 10-flood and 30-flood treatments than in the control after 3 July, although this varied according to the time of the treatment in the seedlings. After the treatment was completed, the starch content of the grafted trees treated with 10-flood as well as seedlings treated with both 10-flood and 30-flood recovered rapidly. On the other hand, the grafted trees treated with the 30-flood had not recovered even three months after the end of treatment.
The sugar content of the grafted trees and seedlings was around 25 mg g−1 DW at the commencement of the treatment but fluctuated between 20 and 30 mg g−1 DW during treatment (Figure 2). The sugar content began to decrease toward the end of the treatment only in the 30-flood treatment of grafted trees. After treatment, the sugar content of grafted trees in the 30-flood treatment remained significantly lower than in the other treatments, but there were no significant differences among the treatments in seedlings.
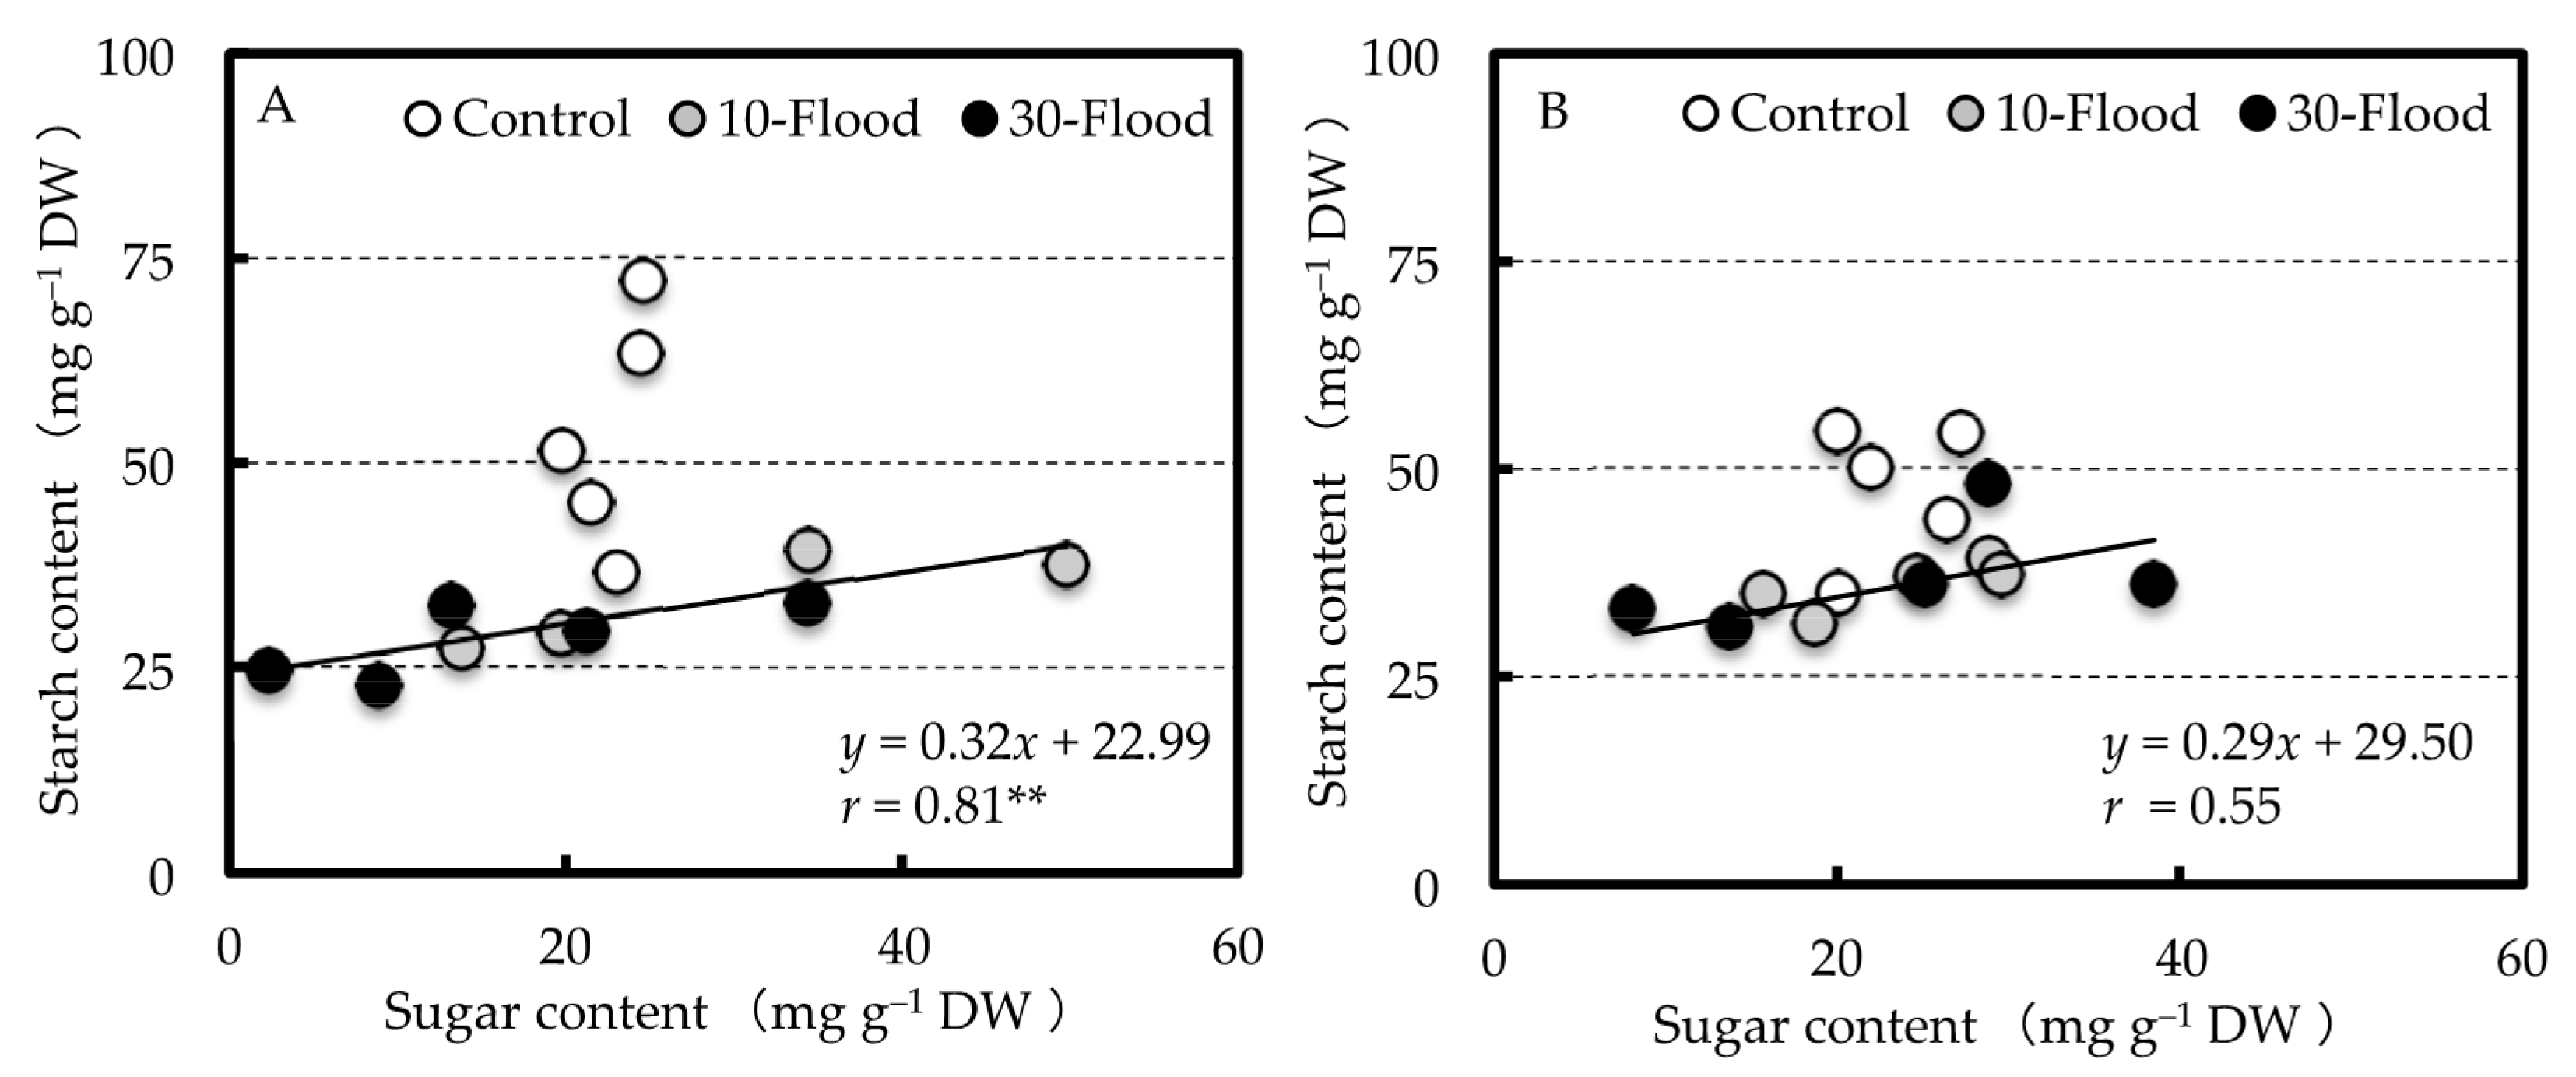
The starch content at the end of the 10-flood and 30-flood treatments decreased compared with that of the control, whereas the sugar content varied more among the treatments. However, the scatter plot showing the relationship between sugar and starch content at the end of treatment showed a positive correlation in the 10-flood and 30-flood treatment. Although the correlation coefficients were not significant when the correlation was calculated separately, it was significant at p = 0.01 when calculated by combined data of both flooding treatments on 31 July (Figure 3). Nevertheless, it was not significant in seedlings in both cases.
3.2. Root Activity
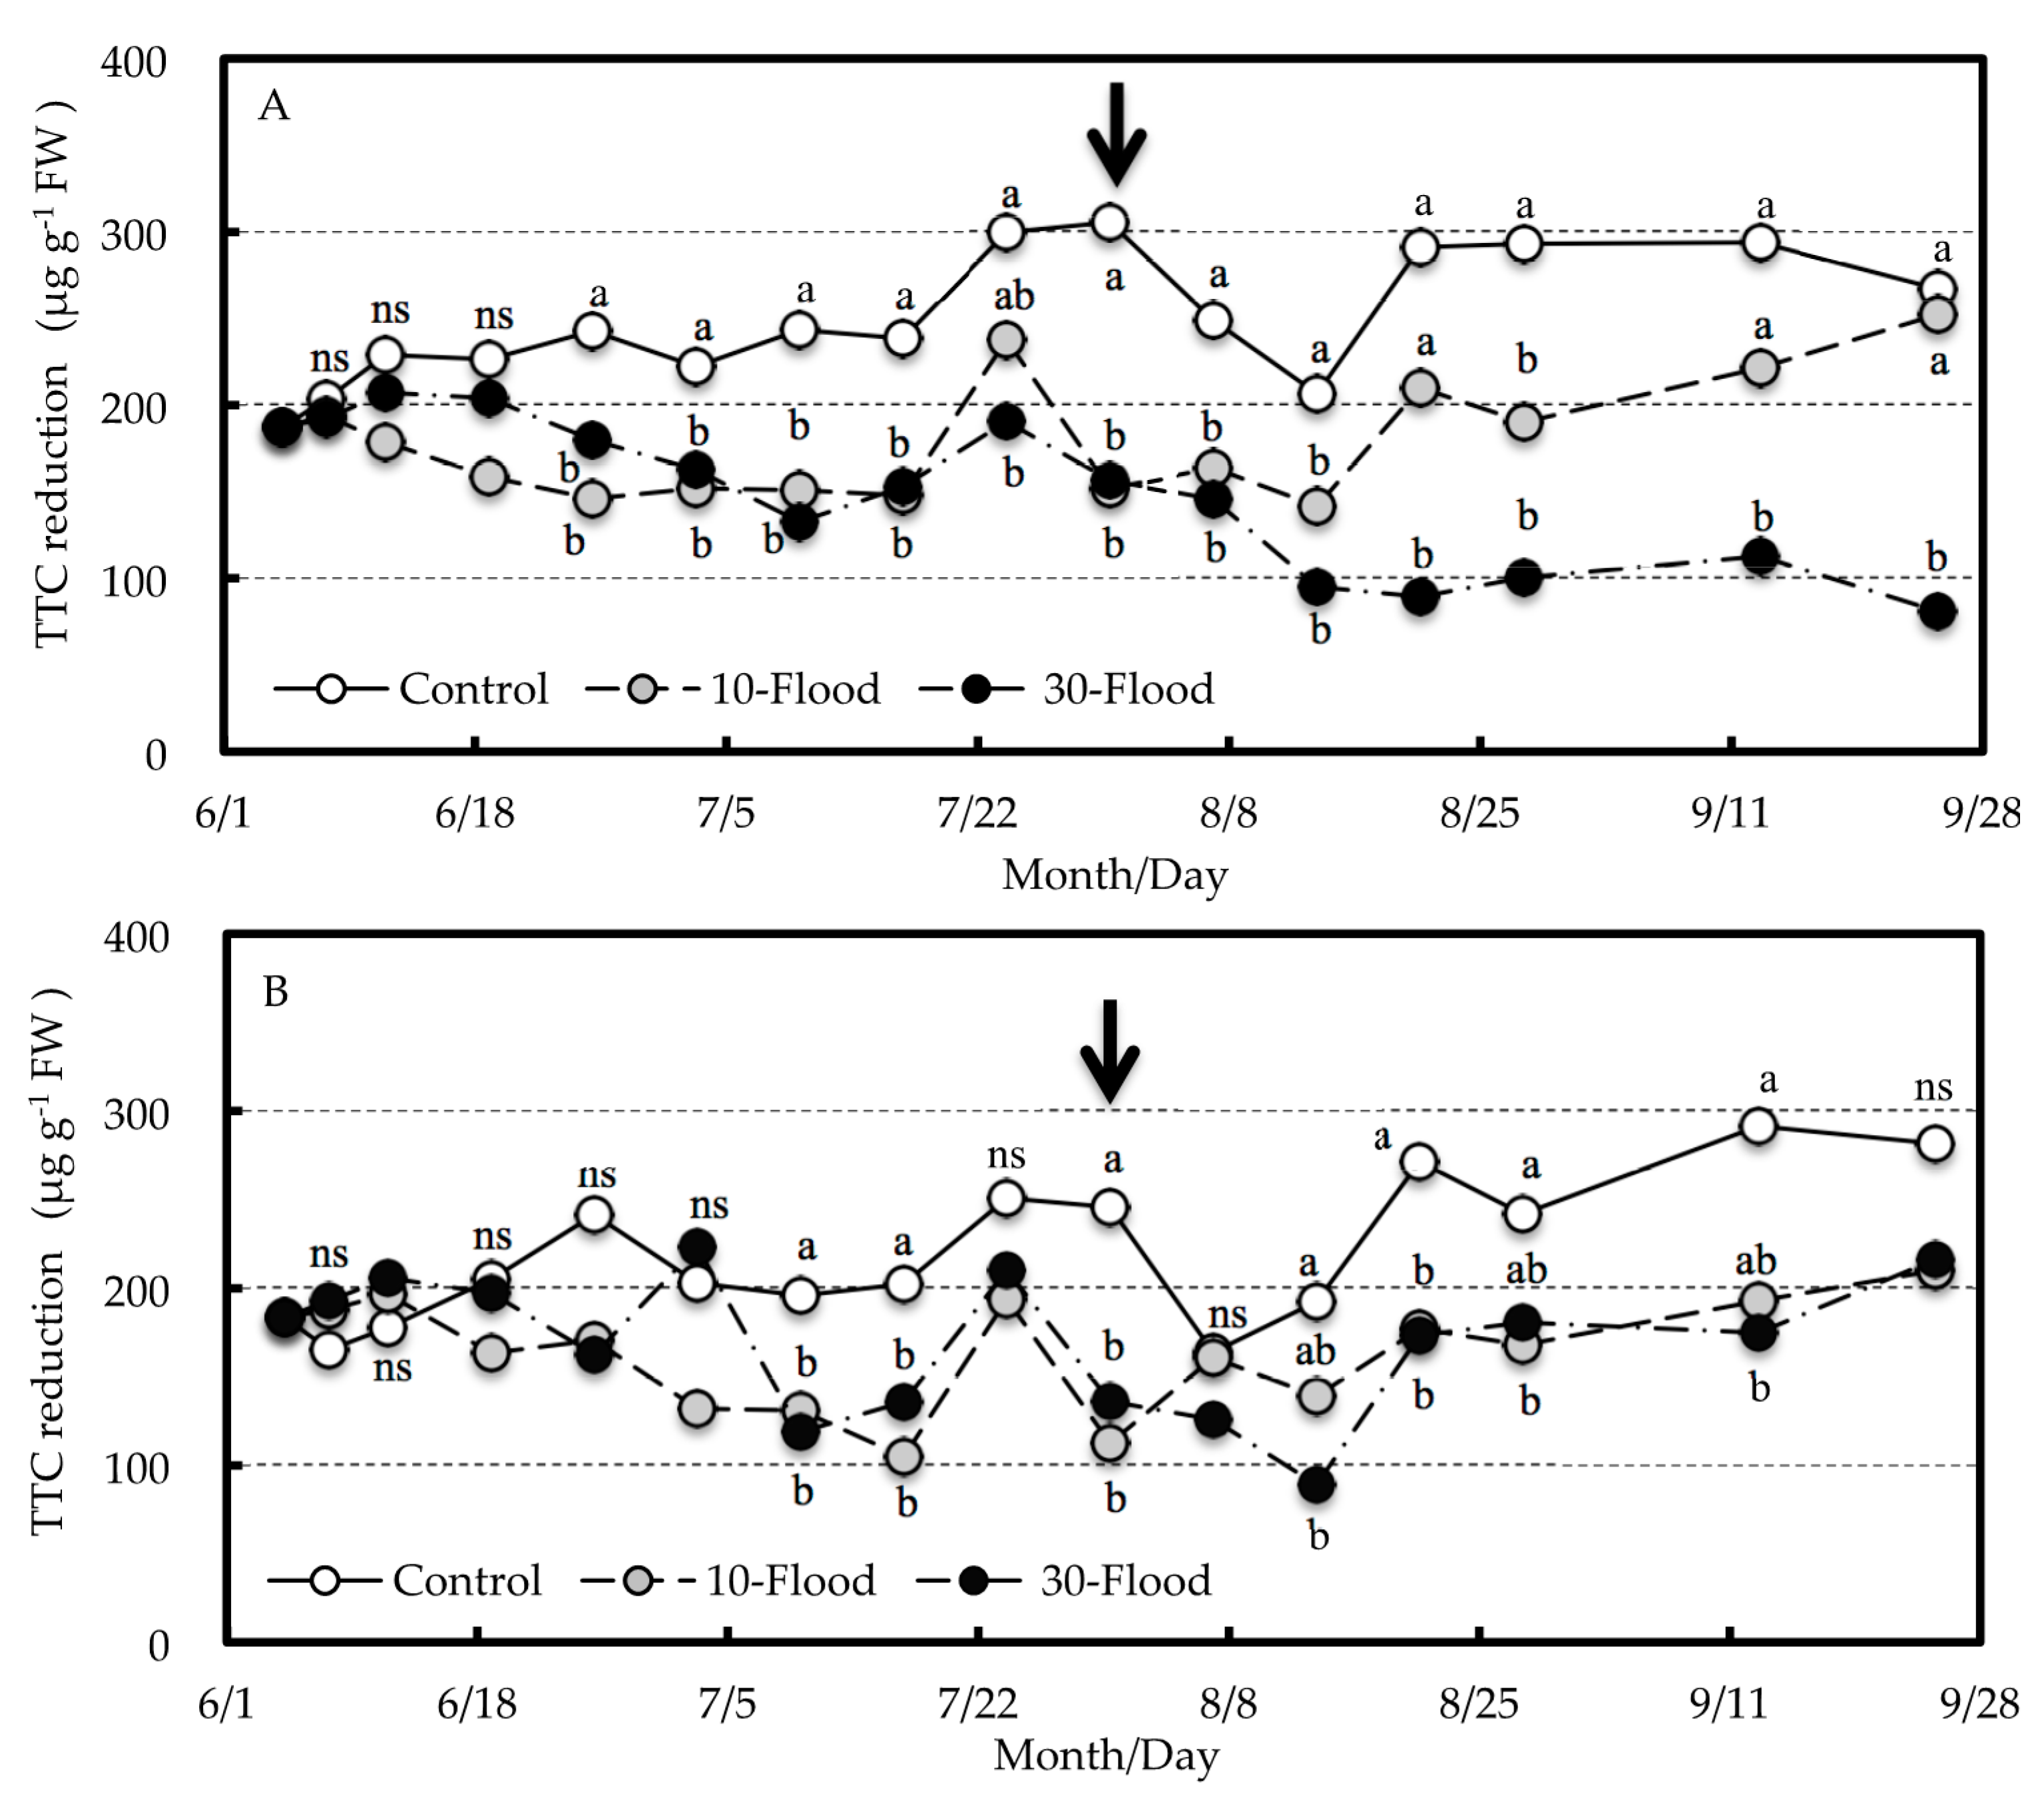
The TTC reduction of roots at the commencement of treatment was 180 μg g−1 fresh weight (FW) in both grafted trees and seedlings and tended to decrease gradually in both grafted trees and seedlings during the 10-flood and 30-flood treatments (Figure 4). This was significantly lower in trees in the 10-Flood and 30-Flood treatments compared with the level in the control. After treatment, the TTC reduction in the 10-Flood-treated grafted trees gradually recovered until it was not significantly different from the control, whereas it remained at a significantly low level in the 30- Flood-treated trees. On the other hand, there were no significant differences in TTC reduction among the treatments on September 28 in seedlings. A positive significant correlation between sugar content and TTC reduction was obtained on July 31 in the 30-Flood-treated grafted trees, although it was not significant in the 10-Flood treatment (Figure 5A). On the other hand, in seedlings, the correlation was positive in the trees in the 10-Flood treatment, whereas it was significantly negative correlation in 30-Flood-treated trees (Figure 5B).
3.3. Leaf Water Potential and Fv/Fm
Leaf water potential did not differ among the treatments in both grafted trees and seedlings until the middle of July, although there were some fluctuations depending on the measurement date (Table 1). However, at the end of treatment, there was a significant decrease in the 30-flood-treated grafted trees compared with the other treatments (determined on 30 July), although there were no differences among the treatments in seedlings (determined on 31 July).
Similarly, Fv/Fm did not differ among the treatments in both grafted trees (mean 0.81, SEM 0.002) and seedlings (mean 0.82, SEM 0.001) until the middle of July. Nevertheless, at the end of July (29 July), 30-flood (0.60 ± 0.072) was lower than both 10-flood (0.80 ± 0.015) and control (0.80 ± 0.020) only in grafted trees.
3.4. Tree Mortality
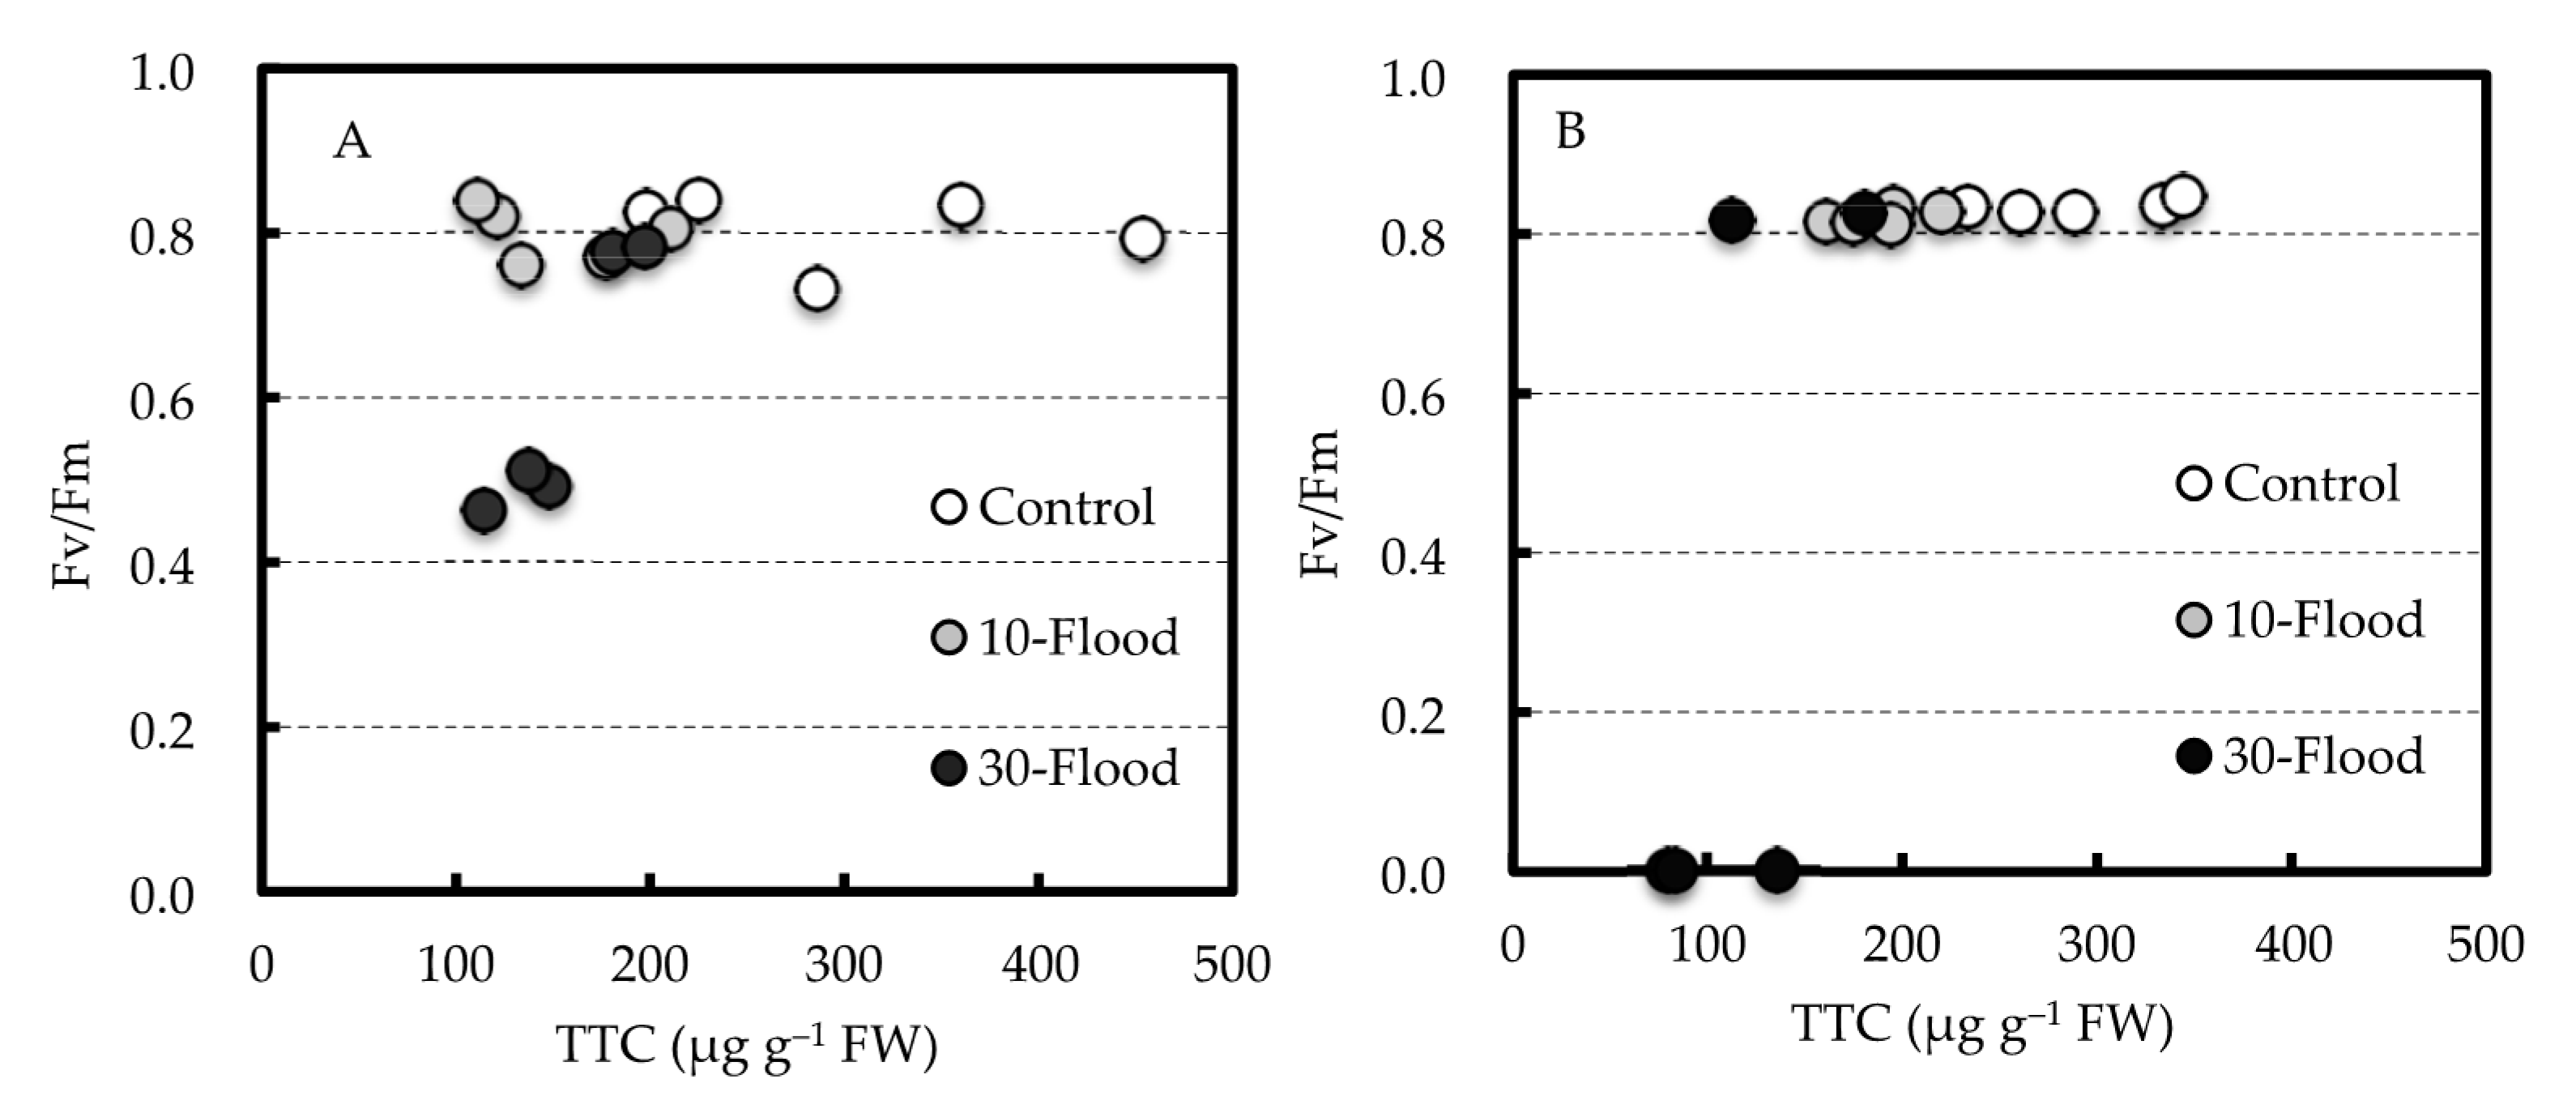
In three trees in the 30-flood-treated grafted trees, leaf wilting began during the treatment, just as leaf water potential and Fv/Fm decreased (Figure 6A). In these three trees, the scion part of the tree died in late August after the end of the treatment (Figure 6B), and the rootstock also died by the end of October. In the other two trees in the 30-flood-treated grafted trees, the leaf wilting or the reduction of Fv/Fm was not observed during the treatment; nevertheless, only the scion part of the tree died after treatment around the end of October. On the other hand, no seedlings wilted or died during and after the treatment.
The TTC of the three trees that wilted during the 30-flood treatment showed no difference from the other two in the 30-flood treatment or the 10-flood-treated trees that did not show wilt, but the Fv/Fm of the three trees was clearly lower in late July (Figure 6A).
4. Discussion
The starch content of roots decreased immediately after the commencement of the 10-flood and 30-flood treatments in both grafted trees and seedlings, whereas there was no clear difference in sugar content among the treatments. The starch content in satsuma mandarin roots, a subtropical evergreen fruit tree, is generally low during the growing season and tends to increase during the dormant season [16]. Since this experiment was conducted during the growing season in summer, the starch content of 40–70 mg g−1 DW in the grafted trees and seedlings before the commencement of treatment was considered to be the lowest level of the year. Therefore, the decrease in starch content during the treatment and the significant differences among the treatments were considered to be the effects of the 10-flood or 30-flood treatment. It has been reported that the root starch content in tea plants is reduced by artificial light shading in winter to spring [17]. That is, when the photosynthates supplied from the aboveground part decrease, the accumulation of stored starch in roots decreases as a result. Gravatt and Kirby [18] also reported that high root starch concentration is a characteristic of flood-tolerant tree species such as water tupelo (Nyssa aquatica L.), and continued translocation of photosynthetically derived carbohydrates may be an important trait. Therefore, in grafted trees treated with the 10-flood or 30-flood treatment, the lower starch content at the end of the treatment compared with that of the control was considered to be the result of a decrease in photosynthates supplied to the roots. However, the Fv/Fm of the leaves, which indicates the photosynthetic efficiency of the leaves, decreased only in the 30-flood treatment.
The TTC reduction test used to evaluate root activity in this experiment determined that the reaction of TTC being reduced to TPF was a result of receiving electrons from succinate dehydrogenase involved in the intracellular electron transport system. Therefore, the result of the TTC reduction test indicates dehydrogenase activity [19,20] and is thought to be related to the respiration rate [21]. In this experiment, it was considered that the respiration rate of the roots decreased because the result of the TTC reduction test was significantly reduced by the 10-flood or 30-flood treatment. It has been reported previously that the TTC reduction of roots decreases under flooding conditions where the callery pear (Pyrus calleryana) and the birchleaf pear (Pyrus ussuriensis) are used as the rootstock for pear trees [22], and the respiration rate of tobacco roots also decreases at low oxygen concentration in the rhizosphere [23]. In this experiment, the values of TTC reduction were positively correlated with root sugar content in grafted trees at the end of treatment. Thus, the decrease in root respiratory rate was thought to be related not only to the lack of oxygen in the rhizosphere due to flooding, but also the decrease in carbohydrates supplied from aboveground.
In grafted trees in the 10-flood treatment, the starch content and TTC reduction of the roots gradually recovered after the treatment until no significant difference was found from the control. However, in those trees in the 30-flood treatment that showed a tendency toward decreased sugar content at the end of treatment, the sugar and starch content as well as TTC reduction of the roots did not recover after the treatment. Therefore, the decrease in carbohydrates supplied from the aboveground tree parts may be related to the death of the 30-flood-treated trees.
Leaf water potential and Fv/Fm decreased only in the grafted trees that died after 30-flood treatment. The Fv/Fm depends on light-induced electron transfer reactions in PSII and is an index that indicates photosynthetic efficiency. Therefore, it can be used to assess the severity of stress experienced by plants [24]. In this experiment, Fv/Fm did not change for nearly two months after the commencement of the 30-flood treatment, and it decreased with the water potential when visible signs such as leaf wilting appeared. Therefore, these declines are thought to be associated with the death of the trees. However, it was considered not to be suitable as an index for assessing the effect of flooding on mango trees because there was no noticeable change until just before wilting started.
5. Conclusions
In this experiment, no dead trees were observed in 10-flood-treated grafted trees where the grafted union was not submerged, as well as in the seedlings that were not grafted. Therefore, the submergence of the graft union may be related to the death of the flooded grafted trees. In addition, the three 30-flood-treated grafted trees that showed wilt during the treatment did not show any difference in the TTC reduction tests from the other two trees in the 30-flood treatment or the trees in the 10-flood treatment. These results suggest that the damage from flooding begins in the scion as a decline in photosynthesis, which reduces the supply of carbohydrates to the roots, then results in the death of the rootstock. It is considered necessary to investigate the physiological damage of the scion resulting from the submergence of the graft union by flooding and the effect of the grafting position higher than the expected water level under flooding conditions.
Author Contributions
Conceived and designed the experiments: A.S. and N.I.; Performed the experiments: A.S.; Analyzed the data: A.S. and N.I.; Wrote the manuscript: A.S. and N.I. All authors have read and agreed to the published version of the manuscript.
Funding
This research received no external funding.
Conflicts of Interest
The authors declare no conflict of interest.
References
- Hara, Y.; Yukimatsu, H.; Thaitakoo, D.; Tsuchiya, K. Agricultural landscape changes and its resilience in response to the 2011 serious floods in the urban frige of Bangkok. J. Rural Plan. 2014, 33, 191–196. [Google Scholar] [CrossRef] [Green Version]
- Schaffer, B.; Davies, F.S.; Crane, J.H. Responses of subtropical and tropical fruit trees to flooding in calcareous soil. HortScience 2006, 41, 549–555. [Google Scholar] [CrossRef] [Green Version]
- Shimada, A.; Tominaga, S.; Yamamoto, M. Effects of water management on vine growth and fruit quality in passion fruit. Hort. Res. 2018, 17, 1–10. [Google Scholar] [CrossRef] [Green Version]
- Larson, K.D.; Schaffer, B.; Davies, F.S. Flooding, leaf gas exchange, and growth of mango in containers. J. Amer. Soc. Hort. Sci. 1991, 116, 156–160. [Google Scholar] [CrossRef] [Green Version]
- Armstrong, W. Oxygen diffusion from the roots of woody species. Physiol. Plant. 1968, 21, 539–543. [Google Scholar] [CrossRef]
- Chirkova, T.V.; Gutman, T.S. Physiological role of branch lenticels in Willow and Poplar under conditions of root anaerobiosis. Sov. Plant Physiol. 1972, 19, 289–295. [Google Scholar]
- Larson, K.D.; Schaffer, B.; Davies, F.S. Flood water oxygen content, ethylene production and lenticel hypertrophy in flooded Mango (Mangifera indica L.) trees. J. Exp. Bot. 1993, 44, 665–671. [Google Scholar] [CrossRef]
- Kawai, Y.; Benz, J.; Kliewer, W.M. Effect of flooding on shoot and root growth of rooted cuttings of grape rootstocks. J. Jpn. Soc. Hort. Sci. 1996, 65, 455–461. [Google Scholar] [CrossRef]
- Mizutani, F.; Yamada, M.; Tomana, T. Differential water tolerance and ethanol accumulation in Prunus species under flooded conditions. J. Jpn. Soc. Hort. Sci. 1982, 51, 29–34. [Google Scholar] [CrossRef] [Green Version]
- Tamura, F.; Tanabe, K.; Katayama, M. Relationship between water tolerance and cyanide-resistant respiration in pear rootstocks. J. Jpn. Soc. Hort. Sci. 1995, 64, 47–53. [Google Scholar] [CrossRef] [Green Version]
- Ranney, T.G.; Bir, R.E. Comparative flood tolerance of Birch rootstock. J. Am. Soc. Hort. Sci. 1994, 119, 43–48. [Google Scholar] [CrossRef] [Green Version]
- Arbona, V.; Hossain, Z.; Lopez-Climent, M.F.; Perez-Clemente, R.M.; Gomez-Cadenas, A. Antioxidant enzymatic activity is linked to waterlogging stress tolerance in citrus. Physiol. Plant. 2008, 132, 452–466. [Google Scholar] [CrossRef] [PubMed]
- Eidathong, W.; Yonemori, K.; Sugiura, A.; Utsunomiya, N.; Subhadrabandhu, S. Genetic resources of Mangiferea species in Thailand. Jpn. J. Trop. Agric. 1999, 43, 76–83. [Google Scholar]
- Lee, W.L.; Chou, K.D.; Weng, I.S. Study on genetic variations of mango (Mangifera indica L.) germplasm. J. Taiwan Agric. Res. 2009, 58, 243–253. [Google Scholar]
- Steponkus, L.P.; Lanphear, O.F. Refinement of the triphenyl tetrazolium chloride method of determining cold injury. Plant Physiol. 1967, 42, 1423–1426. [Google Scholar] [CrossRef] [PubMed] [Green Version]
- Shimizu, T.; Torikata, H.; Torii, S. Studies on the effect of crop load on composition of satsuma mandarin trees. V. Analysis of production processes of bearing and non-bearing trees based on the carbohydrate economy. J. Jpn. Soc. Hort. Sci. 1978, 46, 465–478. [Google Scholar] [CrossRef] [Green Version]
- Suzuki, T.; Ikka, T.; Morita, A. The effect of shading in winter on the carbohydrate content of tea plants and productivity of first crop of tea. Jpn. J. Crop Sci. 2013, 82, 345–352. [Google Scholar] [CrossRef] [Green Version]
- Gravatt, D.A.; Kirby, C.J. Patterns of photosynthesis and starch allocation in seedlings of four bottomland hardwood tree species subjected to flooding. Tree Physiol. 1998, 18, 411–417. [Google Scholar] [CrossRef]
- Kun, E.; Abood, G.L. Colorimetric estimation of succinic dehydrogenase by triphenyltetrazolium chloride. Science 1949, 109, 144–146. [Google Scholar] [CrossRef]
- Aimi, R.; Fujimaki, K. Cell-physiological studies on the function of root. (1) Chemical and enzymatic constitution associated with the structural differentiation of root in rice plant. Jpn. J. Crop Sci. 1958, 27, 21–24. [Google Scholar] [CrossRef] [Green Version]
- Comas, L.H.; Eissenstat, D.M.; Lakso, A.N. Assessing root death and root system dynamics in a study of grape canopy pruning. New Phytol. 2000, 147, 171–178. [Google Scholar] [CrossRef] [Green Version]
- Robanni, M.; Banno, K.; Kakegawa, M. Differential flooding tolerance of some dwarfing pear rootstock clones selected from the progenies of Pyrus betulaefolia and P. calleryana. J. Jpn. Soc. Hort. Sci. 2006, 75, 297–305. [Google Scholar] [CrossRef]
- Harris, D.G.; Van Bavel, C.H.M. Root respiration of tobacco, corn and cotton plants. Agron. J. 1957, 49, 182–184. [Google Scholar] [CrossRef]
- Kitao, M. Effects of environmental stress on photosynthesis of woody plants. J. Jpn. For. Soc. 2004, 86, 42–47. [Google Scholar]
Figure 1.
Changes in starch content of roots in mango grafted trees (A) and seedlings (B) during and after treatments. Different letters in the figures indicate significant differences at p = 0.05 by Fisher’s LSD, and ns indicates no significant difference among the treatments (n = 5). Arrow indicates the end of the treatments.

Figure 2.
Changes in sugar content of roots in mango grafted trees (A) and seedlings (B) during and after treatments. Different letters in the figures indicate significant differences at p = 0.05 by Fisher’s LSD, and ns indicates no significant difference among the treatments (n = 5). Arrow indicates the end of the treatments.

Figure 3.
Effects of treatments on the relationship between starch and sugar content in the roots of grafted trees (A) and seedlings (B) of mango. Both grafted trees and seedlings show the results determined on 31 July. The regression analysis was applied to the combined data in both 10- and 30-flood treatments. ** indicates significance at p = 0.01.

Figure 4.
Changes in TTC reduction rate of roots in mango grafted trees (A) and seedlings (B) during and after treatments. Different letters in the figures indicate significant differences at p = 0.05 by Fisher’s LSD, and ns indicates no significant difference among the treatments (n = 5). Arrow indicates the end of the treatments.

Figure 5.
Effects of treatment on relationships between TTC reduction and sugar content in the roots of grafted trees (A) and seedlings (B) of mango. Both grafted trees and seedlings show the results measured on 31 July. As a result of the regression analysis, a significant result was obtained only in 30-flood. * and ** indicate significance at p = 0.05, p = 0.01, respectively.

Figure 6.
Relationship between TTC reduction of roots and Fv/Fm of leaves in grafted mango trees during or after treatments. Fv/Fm and TTC in (A) were measured on 28 July and 31 July, respectively, and those in (B) were undertaken on 25 August and 28 August.
Figure 6.
Relationship between TTC reduction of roots and Fv/Fm of leaves in grafted mango trees during or after treatments. Fv/Fm and TTC in (A) were measured on 28 July and 31 July, respectively, and those in (B) were undertaken on 25 August and 28 August.


Table 1.
Effects of flooding treatments at different water depths in leaf water potential (Mpa) of grafted mango trees and seedlings.
Table 1.
Effects of flooding treatments at different water depths in leaf water potential (Mpa) of grafted mango trees and seedlings.
| Control | 10-Flood | 30-Flood | ||
|---|---|---|---|---|
| Grafted trees | 5 June | −1.54a z | −1.54a | −1.54a |
| 18 June | −1.99a | −1.92a | −1.83a | |
| 2 July | −2.16a | −1.92a | −2.06a | |
| 16 July | −1.82a | −1.85a | −1.73a | |
| 23 July | −1.51a | −1.81a | −2.35a | |
| 30 July | −1.87a | −1.88a | −4.29b | |
| Seedlings | 5 June | −1.73a | −1.73a | −1.73a |
| 19 June | −2.11a | −2.17a | −2.07a | |
| 3 July | −1.70a | −1.82a | −1.84a | |
| 17 July | −1.65a | −1.47a | −1.56a | |
| 24 July | −1.55a | −1.53a | −1.37a | |
| 31 July | −1.83a | −1.73a | −1.52a |
z Different letters within row in grafted trees or seedlings indicate significant differences at p = 0.05 by Fisher’s LSD (n = 5).
© 2020 by the authors. Licensee MDPI, Basel, Switzerland. This article is an open access article distributed under the terms and conditions of the Creative Commons Attribution (CC BY) license (http://creativecommons.org/licenses/by/4.0/).
Share and Cite
MDPI and ACS Style
Saeki, A.; Iwasaki, N. The Submergence of the Graft Union Causes the Death of Grafted Mango Trees (Mangifera indica L.) under Flooding. Agronomy 2020, 10, 1121. https://0-doi-org.brum.beds.ac.uk/10.3390/agronomy10081121
AMA Style
Saeki A, Iwasaki N. The Submergence of the Graft Union Causes the Death of Grafted Mango Trees (Mangifera indica L.) under Flooding. Agronomy. 2020; 10(8):1121. https://0-doi-org.brum.beds.ac.uk/10.3390/agronomy10081121
Chicago/Turabian StyleSaeki, Akira, and Naoto Iwasaki. 2020. "The Submergence of the Graft Union Causes the Death of Grafted Mango Trees (Mangifera indica L.) under Flooding" Agronomy 10, no. 8: 1121. https://0-doi-org.brum.beds.ac.uk/10.3390/agronomy10081121
Note that from the first issue of 2016, this journal uses article numbers instead of page numbers. See further details here.