Article

Can Nitrogen Fertilizer Management Improve Grain Iron Concentration of Agro-Biofortified Crops in Zimbabwe?

by
Muneta G. Manzeke-Kangara
1,2,*,
Florence Mtambanengwe
2,
Michael J. Watts
3,
Martin R. Broadley
1,
R. Murray Lark
1 and
Paul Mapfumo
2
1
Division of Agricultural and Environmental Sciences, School of Biosciences, Sutton Bonington Campus, University of Nottingham, Leicestershire LE12 5RD, UK
2
Soil Fertility Consortium for Southern Africa, Department of Soil Science and Agricultural Engineering, University of Zimbabwe, Harare, Zimbabwe
3
Inorganic Geochemistry Laboratories, Centre for Environmental Geochemistry, British Geological Survey, Nottingham NG12 5GG, UK
*
Author to whom correspondence should be addressed.
Submission received: 23 November 2020 / Revised: 21 December 2020 / Accepted: 24 December 2020 / Published: 11 January 2021
(This article belongs to the Special Issue From Biofortification to Tailored Crops and Food Products)

Abstract

:
Improving iron (Fe) concentration in staple grain crops could help reduce Fe-deficiency anaemia in communities dependent on plant-based diets. Co-application of nitrogen (N) and zinc (Zn) fertilizers has been reported to improve both yield and grain Zn concentration of crops in smallholder farming systems. This study was conducted to determine if similar effects are observed for grain Fe concentration. Field experiments were conducted in two years, in two contrasting agro-ecologies in Zimbabwe, on maize (Zea mays L.), cowpea (Vigna unguiculata [L.] Walp) and two finger millet (Eleusine coracana (L.) Gaertn.) “seed pools”. The two finger millet “seed pools” were collected during previous farmer surveys to represent “high” and “low” Fe concentrations. All plots received foliar Fe-ethylene diamine tetra-acetic acid (EDTA) fertilizer and one of seven N treatments, representing mineral or organic N sources, and combinations thereof. Higher grain yields were observed in larger N treatments. Grain Fe concentration increased according to species: maize < finger millet < cowpea but varied widely according to treatment. Significant effects of N-form on grain Fe concentration were observed in the low finger millet “seed pool”, for which mineral N fertilizer application increased grain Fe concentration to a greater extent than other N forms, but not for the other species. Whilst good soil fertility management is essential for yield and grain quality, effects on grain Fe concentration are less consistent than reported previously for Zn.

1. Introduction

Iron (Fe) is an essential element required by humans, plants, and animals for various metabolic processes such as deoxyribonucleic acid (DNA) synthesis, electron, and oxygen transport [1,2]. Iron mainly enters the body as heme Fe, which comes from animal source foods, with plant-based sources of Fe generally of low bioavailability [1]. Inadequate dietary Fe intake results in Fe-deficiency anaemia which particularly affects children under the age of five years, women of child-bearing age, and pregnant women [3]. Iron-deficiency anaemia is widespread globally, in both low and high-income settings, but prevalence is larger in sub-Saharan Africa (SSA) and South Asia than it is elsewhere [4]. For example, in Zimbabwe, the most recent Demographic and Health Survey reported that over one-quarter (27%) of women were anaemic, in both urban (29%) and rural areas (26%) [5]. Whilst anaemia has multiple aetiologies, including chronic infections and malaria, it is generally considered that ~50% of anaemia cases are linked to low dietary Fe intake. Furthermore, >30% of children under five years of age were anaemic with similar proportions in rural and urban areas [5]. Notably, consumption of animal source foods is limited among most rural communities in Zimbabwe [6,7,8].
Biofortification of crops, to increase Fe in their edible portions through crop breeding was reported to increase the Fe status of communities consuming those crops [9]. New varieties of Fe-rich beans and pearl millet have been released by HarvestPlus in Rwanda and India, respectively [9,10]. In Rwanda, 29% of bean farmers were growing high-iron beans just four years after introduction. In India, a high-iron pearl millet variety released in 2013 replaced the lower-iron version. A recent systematic review reported that consumption of iron biofortification improved cognitive performance (i.e., improved attention and memory), compared with conventional non-biofortified crops [11].
There has been much less work on the potential of agronomic biofortification with Fe fertilizers. Few field experiments looking at the effect of Fe fertilizer applied alone [12] or in combination with other micronutrients [13,14] on the nutritional composition of staple crops have been conducted. A 12% increase in grain Fe concentration was recently reported in wheat (Triticum aestivum L. Moench) grown with a micronutrient cocktail (Zn; iodine, I; selenium, Se; and Fe) in six countries in Asia and Southern Africa [14]. Godsey et al. [15] reported increases in grain yields of maize (Zea mays L.) grown on calcareous soils in the field with chelated Fe and FeSO4·H2O fertilizer applied in various forms (granulated, foliar, and liquid). This contrasts with Zn, which has been studied extensively in field-grown cereal and legume crops [16,17,18,19,20,21]. While fewer studies looking at Fe versus Zn nutrition have been conducted, benefits of Fe on crop productivity and nutrition have been reported. In pot studies, the application of Fe sulphate and a chelate as a nutrient solution improved seed Fe concentration and grain yield in cowpea (Vigna unguiculata [L.] Walp) [22]. Similarly, Mathers [23] reported increases in grain yields of sorghum (Sorghum bicolor L. Moench) grown with FeSO4 in potted calcareous soils.
Previously, in Zn agronomic biofortification field studies, it has been noted that N and integrated soil fertility management (ISFM) using both inorganic and organic nutrient resources can increase maize grain Zn concentration both in the absence [24,25] and presence [17,19] of Zn fertilizers. Similar effects have been reported in previous work on wheat [20,26,27]. For example, Kutman et al. [26] showed that increased N supply increased the acquisition and allocation of Zn and Fe into wheat grains grown with Zn (but not Fe) fertilizer in potted experiments.
The estimated average requirement (EAR) for dietary Fe intake is 22.4 mg day−1 for females aged 18–24 years and consuming a high phytate diet [28]. In a survey of 350 farmers’ fields, under two contrasting agro-ecologies in Zimbabwe, the grain Fe concentration of maize averaged 36.0 mg kg−1 [25]. Thus, a typical intake of Fe from maize in Zimbabwe is 69% of EAR based on 278.3 g (including corn flour) consumption person−1 day−1 (https://dataverse.harvard.edu). Given that 95% of fields that were surveyed in this earlier study [25] had plant available (diethylenetriamine penta-acetic acid (DTPA)-extractable) Fe concentrations >5 mg kg−1, which indicates that these were not Fe-deficient soils, the scope for soil Fe fertilizers to improve grain Fe concentration is likely to be limited. Soil and grain Fe concentrations were largely governed by soil type and crop type, respectively, in contrast to soil and grain Zn concentrations which were more strongly affected by farmer management (i.e., organic or mineral fertilizer inputs). Therefore, whilst there is a clear role for improved soil fertility management for both yield and quality for Zn, the effects on other micronutrients including Fe, under controlled field experiments, are less clear.
The aim of this study was to determine if improved soil fertility management can improve the grain Fe concentration of staple crops under field conditions, as reported earlier with Zn. The objective of this study was to determine effects of N fertilizer application form, rate, and management strategy on grain yield and Fe concentration of maize, cowpea, and two finger millet (Eleusine coracana L.) “seed pools” collected during previous farmer surveys and representing “high” and “low” Fe concentrations.

2. Materials and Methods
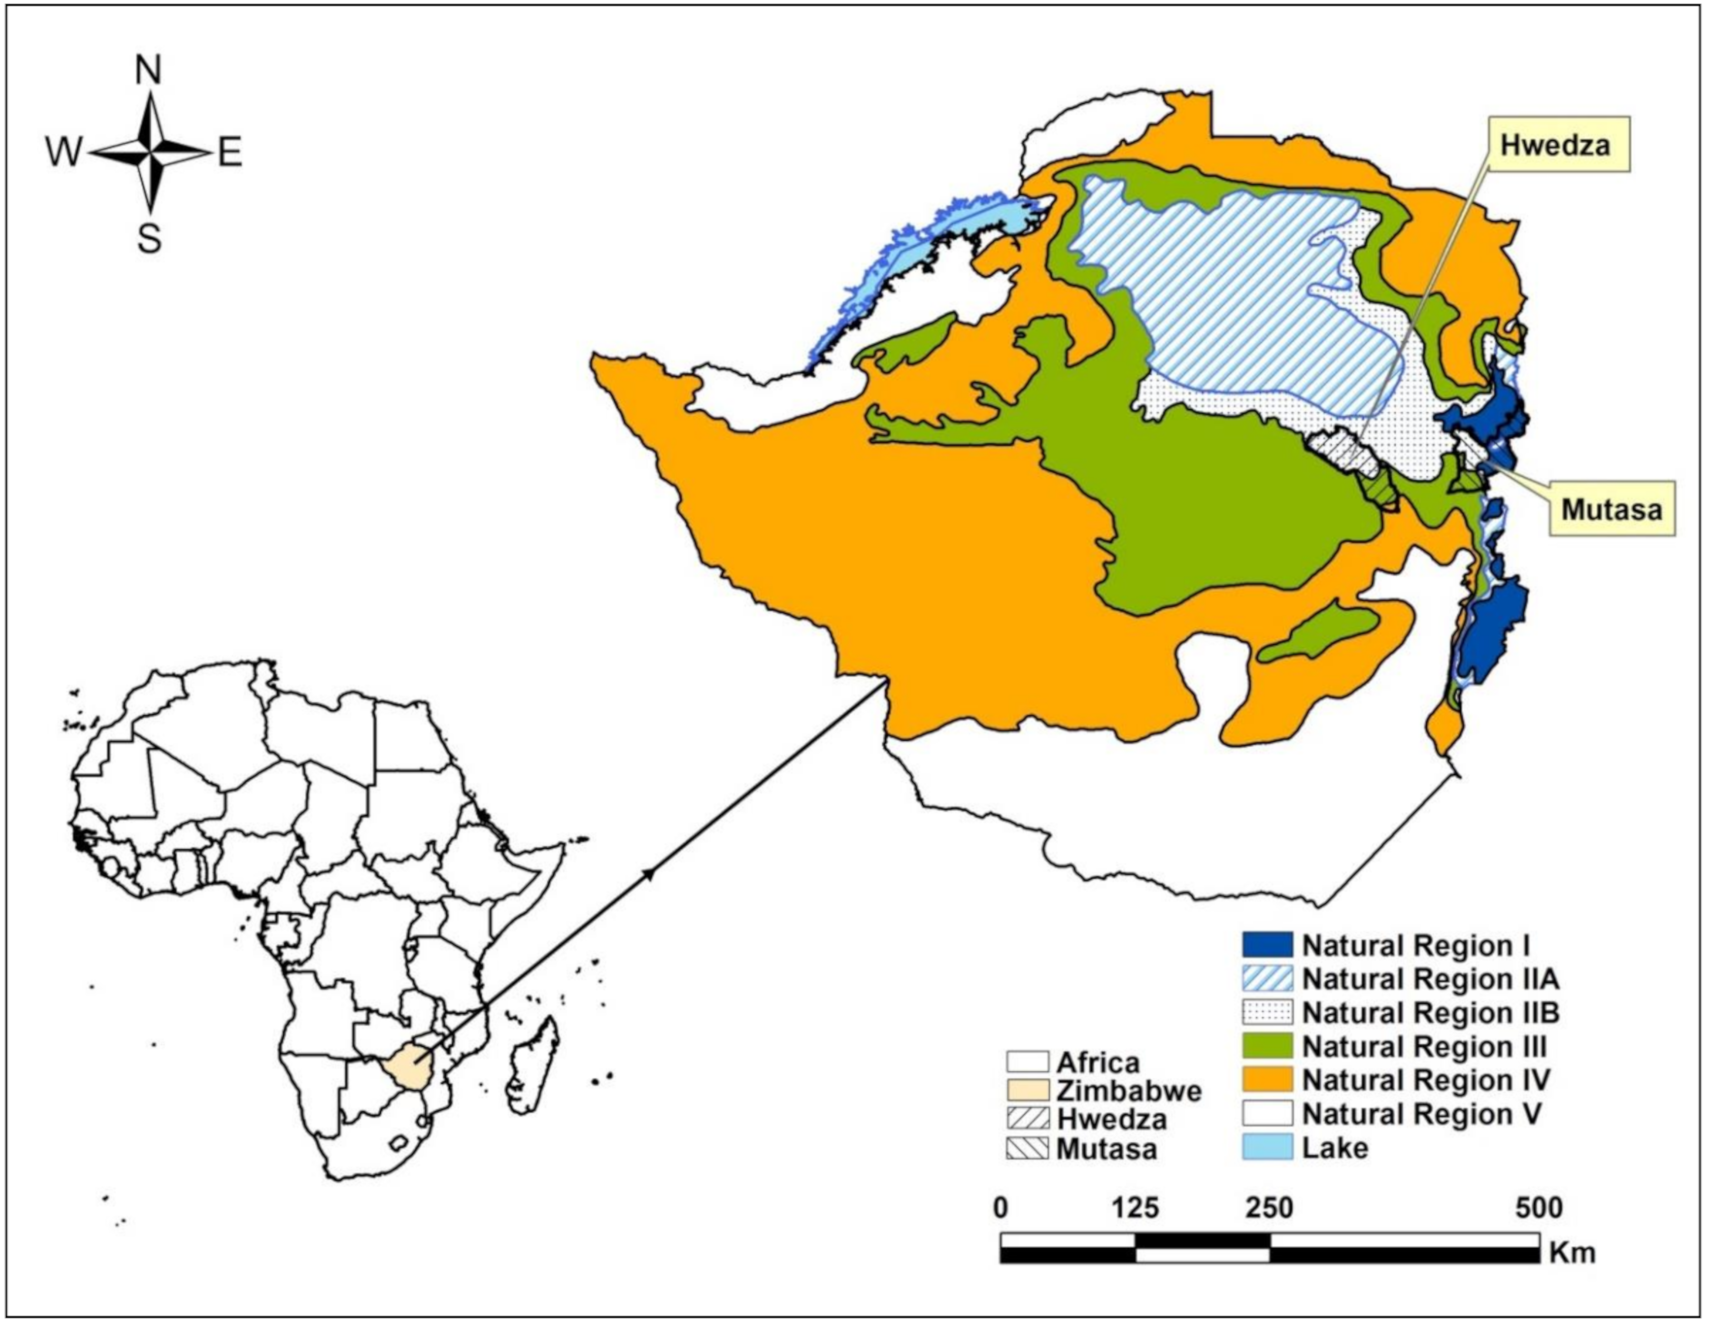
2.1. Study Sites

Field experiments were established in Mutasa and Hwedza Districts in eastern Zimbabwe (Figure 1). The two sites were selected on the basis of differences in agro-ecology. Mutasa District is in agro-ecological zone 1 of the country and receives the highest amounts of rainfall of >1000 mm y−1. Hwedza is in agro-ecological zone 2b to 3 of the country and receives between 650–800 mm y−1. Zimbabwe is divided into 5 agro-ecological regions which receive rainfall between November and April thereby typifying a unimodal rainy season [29]. Field sites in Mutasa were established in Honde Valley (18°35′ S, 32°45′ E; 912 m above sea level—m.a.s.l) which has a unique hot and humid microclimate in most months of the year. The field site in Hwedza was established in Makwarimba Ward (18°41′ S, 31°42′ E; 1380 m.a.s.l) which is a relatively high rainfall area in this district. Both sites are predominated by smallholder farms which are characterized mostly by legume-cereal production. A detailed explanation on crop production in Hwedza and Mutasa and the predominant soil types has been presented earlier [19,25].

2.2. Rationale for Field Selection and Experimental Design

Preliminary soil and crop surveys revealed a soil type effect on baseline plant-available soil Fe concentration and a crop type effect on grain Fe concentration of cereals and cowpea grown on farmers’ fields [25]. Over 80% of surveyed farms had plant-available Fe concentrations above a critical limit of 5.0 mg kg−1 [30]. To ensure Fe was not limiting, experimental field sites were established on relatively fertile farms with plant available soil Fe concentration of >5.0 mg kg−1. Selection of three field sites (one in Hwedza and two in Mutasa) was based on field information from our previous survey in both sites as well as knowledge from government agricultural extension workers (AEWs). Physical and chemical properties of the sites are presented in Table 1. Crops grown were maize, cowpea, and finger millet. These were the main crops sampled during our previous soil and crop surveys [25] and are predominantly grown by smallholder farmers. The four main crops were selected to assess their yield responses and changes in grain Fe concentration.
The field site in Hwedza had four sets of separate plots for maize, cowpea, and two finger millet “seed pools”. One of the field sites in Mutasa had two finger millet “seed pools” planted; each “seed pool” was established as a separate experiment. The maize and cowpea experiments were separate at Mutasa.
Local hybrids of early maturing maize (SIRDA 113) and cowpea (CBC 2) varieties were used. For finger millet, retained seed sourced from farmers was used. Data from our soil and crop surveys showed a wide range in grain Fe concentration of finger millet grown by local smallholder farmers [25]. Two finger millet “seed pools” were used, based on selecting for variation in seed Fe concentration. From 78 “seed pools” (mean grain Fe concentration = 62.3; range = 25–139 mg kg−1) [25], two seed samples were selected for experimentation with initial Fe concentrations of 34.4 and 138.5 mg kg−1. These two finger millet “seed pools” will be presented in this paper as the “low Fe” and “high Fe” finger millet “seed pool”, respectively, based on their initial seed Fe concentration.
Seven treatments were employed in a completely randomized block design and replicated four times. Treatments employed to maize and finger millet are shown in Table 2. Treatments employed to cowpea are shown in Table 3.
The treatments are similar, in terms of N fertilizer application rates and form, to those employed in our earlier paper which assessed effects of N management on grain yield and Zn concentration of maize and cowpea fertilized with soil and foliar Zn [19]. Different N fertilizer application rates and forms were applied to determine whether grain Fe concentration could be increased, as previously reported for Zn [19].
All three crop types were grown in gross plot sizes of 4 m × 3.6 m. The mineral forms of N were compound D (7%N:14%P2O5:7%K2O) and ammonium nitrate (AN), applied as a basal dressing and top-dressing fertilizer, respectively. Cattle manure was used as the form of organic N fertilizer. The N fertilizer rates applied were guided by fertilizer recommendations for maize and legumes in Zimbabwe with 90 kg N and 30 kg N being the optimal rates of N in maize and cowpea, respectively [19,29,31]. Nitrogen treatments were also informed by background knowledge on N rates applied by different farmer social groups [32]. Smallholder farmers broadly fall into three distinct resource/social groups based on their farm-level physical resources, access to crop production inputs, among other criteria, which, in turn, influence their nutrient resource allocation patterns to different fields and crops. Cattle manure used in this study was sourced from smallholder farmers in Hwedza and Mutasa. The cattle manure used in this experiment has similar composition as reported in our earlier work [19]. This is because the experiment was conducted concurrently with work on testing effects of N on grain yield and Zn in maize and cowpea [19]. Chelated Fe fertilizer was applied to all treatments as a foliar (0.1% w/v) solution of Fe ethylene diamine tetra acetic acid (Fe-EDTA; 22% elemental Fe) fertilizer. This rate of Fe applied was guided by literature [33]. Well and borehole water was sourced from host farmers to dilute the Fe-EDTA fertilizer in Hwedza and Mutasa, respectively. Two foliar sprays were applied to maize, at both the tasseling (BBCH-Biologische Bundesanstalt, Bundessortenamt und CHemische Industrie principal growth stage 5) and silking (BBCH principal growth stage 6) stages [34]. Foliar Fe-EDTA was also applied to cowpea at active vegetative growth (Vn) and flowering (R2) stage (https://beanipm.pbgworks.org/cowpea), and to finger millet at stages 26 (vegetative growth) and 54 (flowering stage) of crop development (https://millets.res.in/dus/Fingermillet.pdf). Application of the foliar Fe-EDTA fertilizer was done either in the early or late hours of the day or anytime on a cloudy day [14]. This was to ensure absorption of the fertilizer as the plant stomata will be open. Optimal levels of P and K were supplied as single super phosphate (SSP) and potassium chloride (KCl) as guided by earlier work in similar cropping systems [31,35]. Further details on fertilizer application procedures and general agronomic practices are provided in Manzeke et al. [19]. Grain samples were collected from a net plot of 3.0 m × 1.8 m at physiological maturity (BBCH principal growth stage 9) and analysed according to standard laboratory protocols for Fe and other multi-elements as described in Watts et al. [36] and Joy et al. [37]. Approximately 0.2 g of milled grain sample was digested using a microwave heating system for 90 min and at a pressure of 2 megapascals (MPa) in 2 mL of 70% trace analyses grade HNO3, 1.0 mL of H2O2, and 1 mL of milli-Q water. Digested samples were then analysed using an inductively coupled plasma mass spectrometer (ICP-MS, Agilent 8900 Triple Quad, Santa Clara, CA, USA). Two samples of a certified wheat reference material (National Institute of Standards and Technology-NIST 1567b), two blank and three random sample duplicates, were included in the analyses of every 41 samples to ensure accuracy of measured Fe.
Air-dried and ground (0.5 mm) cattle manure samples were analysed for total Zn and Fe using the aqua regia method. Total N was determined using the Kjeldahl procedure described in Okalebo et al. [38]. Total P was determined using wet digestion with aqua regia by Anderson and Ingram [39] and analysed as described by Murphy and Riley [40]. Exchangeable bases (sodium, Na; potassium, K; magnesium, Mg; and calcium, Ca) were analysed following extraction with 1 M acidified ammonium acetate (NH4OAc) as described by Anderson and Ingram [39]. Organic carbon was determined using the Walkley–Black method [38]. The nutrient composition of cattle manure used is shown in Table 4 and has been presented earlier as Manzeke et al. [19].

2.3. Data Analysis

Data analysis and tested hypotheses are structured in the same way as our earlier work on assessing effects of N management on grain yield and Zn concentration of maize and cowpea grown with Zn [19]. The data from each study site was analysed by analysis of variance (ANOVA), using the open-source R platform [41]. We undertook a separate analysis for each crop at each location. This is because differences between the locations can be expected to be substantial because of the agro-ecological differences between them. These effects are likely not to be additive with treatment effects, which would violate an assumption in the analysis of variance. At any site, crop could not be treated as a factor because there was no replication of crop type within a site, simply one set of contiguous plots used for experiments in each crop.
Treatments T2–T7 constituted a factorial experiment with N rate (45 or 90 for maize and finger millet; 15 or 30 for cowpea) and N application strategy (organic, mineral, or combinations) treated as factors in the analysis. The most powerful way to analyse an experiment is by testing prior hypotheses represented as a set of orthogonal contrasts among treatment means or means of groups of treatments. The effect of the 7 treatments, with 6 degrees of freedom (df), were partitioned into six orthogonal contrasts (as detailed earlier in [19]). The following specific hypotheses were encoded in the contrasts:
1.
N application influences grain yield and grain Fe concentration when Fe fertilizer is also applied. This is contrast C1 tested with 1 df as: T1 vs. (T2,T3,T4,T5,T6,T7) (Table 5).
2.
The effect of applied N on grain yield and grain Fe concentration depends on the total amount of N applied. This is contrast C2 tested with 1 df: (T2,T3,T4) vs. (T5,T6,T7) (equivalent to the main effect of N rate in the factorial subset of treatments) (Table 5).
3.
The effect of applied N on grain yield and grain Fe concentration depends on the application strategy (organic, mineral, or mixed). This was tested with two more specific hypotheses as follows:
3.1.
There are differences in grain yield and grain Fe concentration when N is applied as organic (T3 and T6) or as mixed organic and mineral N fertilizer (T4 and T7). This is contrast C3 with 1 df (Table 5).
3.2.
There are differences in grain yield and grain Fe concentration when N is applied as mineral (T2 and T5) or as organic N (including mixed N treatments) (T3,T4,T6,T7). This is contrast C4 with 1 df (Table 5).
4.
The effect of N application rate on grain yield and grain Fe concentration depends on the strategy. This was tested more specifically as:
4.1.
The difference between the effect of applying sole organic N and applying mixed N depends on whether the overall rate of application of N is high (T6 and T7) or low (T3 and T4); this is contrast C5.
4.2.
The difference between the effect of applying sole mineral N fertilizer and applying sole organic N (including mixed N) fertilizer depends on whether the overall rate of application of N is high (T5,T6,T7) or low (T2,T3,T4); this is contrast C6 with 1 df (Table 5).
A natural loge transformation was conducted in base R [41] when the residuals data were positively skewed. Confidence intervals for treatment means were computed using the residual mean square from the ANOVA output. Graphs were plotted using GraphPad Prism version 9.0.0.

3. Results

3.1. Effect of N Management Strategy and Fe Fertilization on Grain Yields

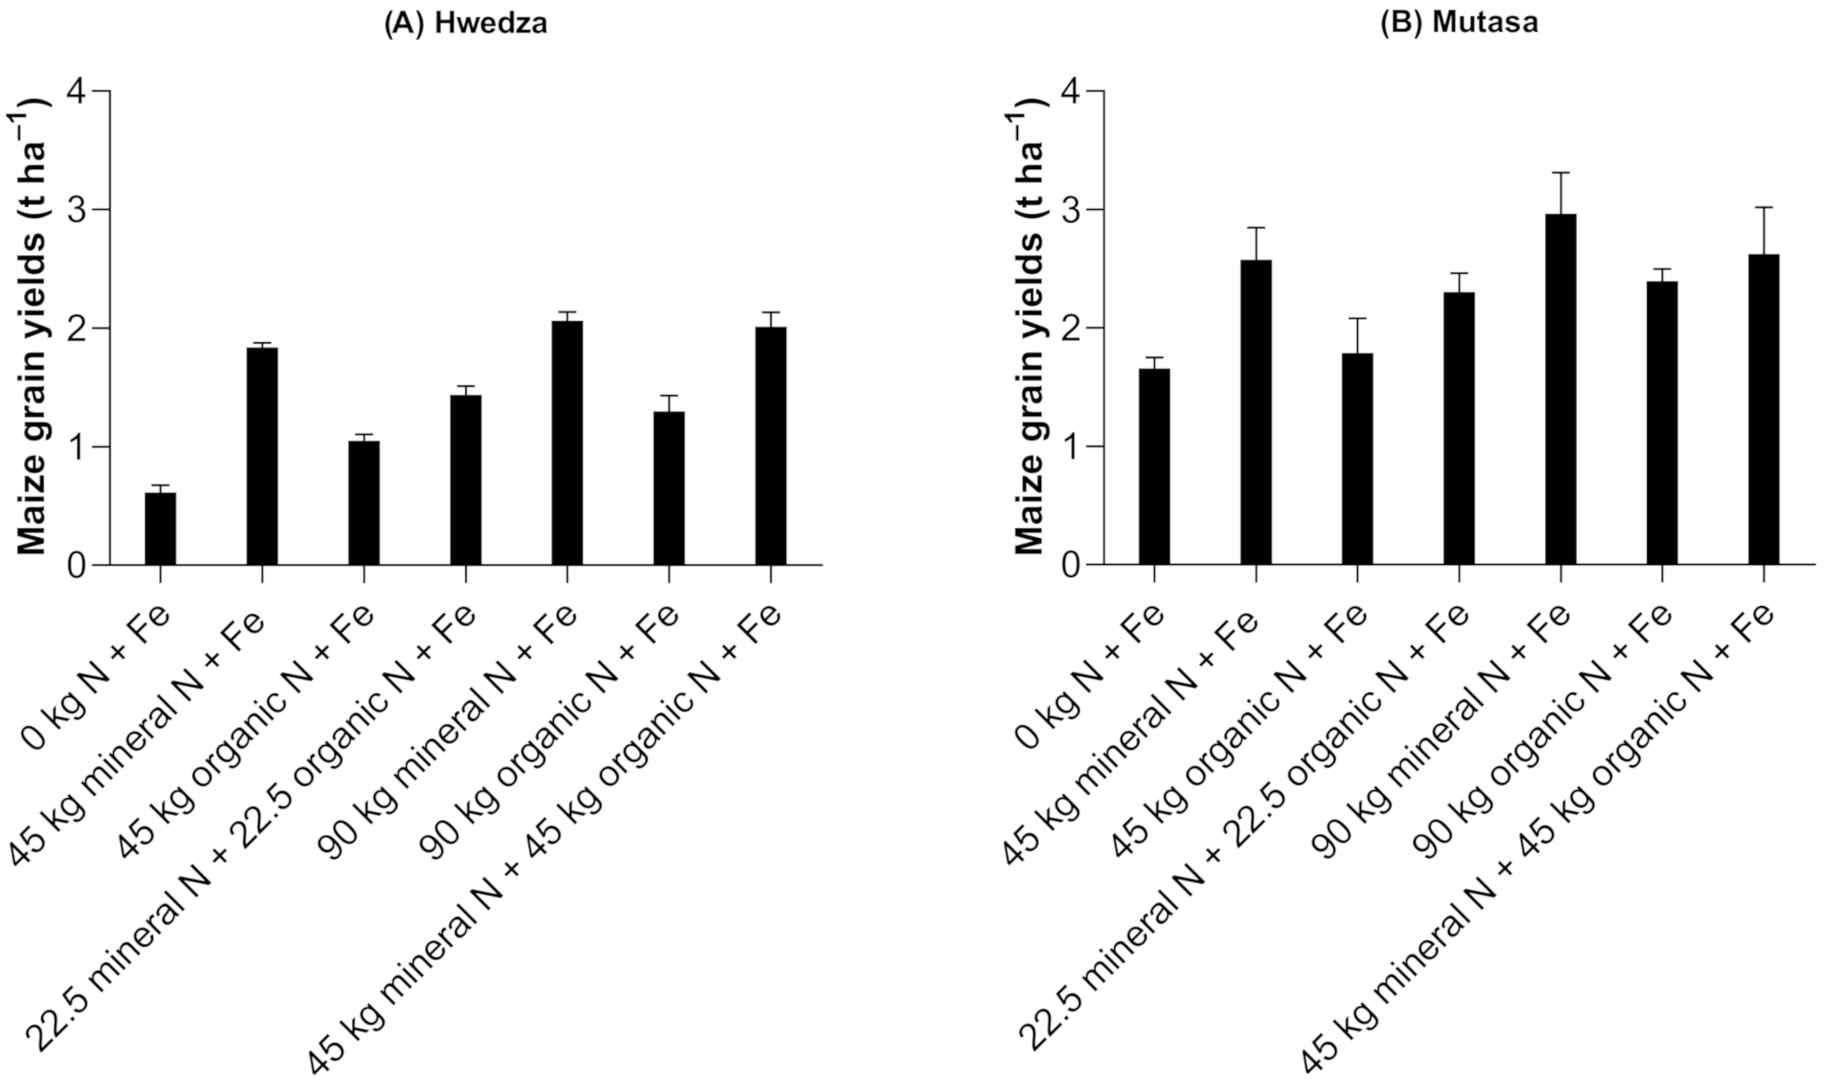
3.1.1. Maize Grain Yields

Application of N fertilizer and Fe significantly increased maize grain yields in Hwedza and Mutasa (p = 0.03; Table 6, C1). Maize grain yields ranged from 0.6 to 2.0 t ha−1 in Hwedza (Figure 2A) and 1.5 to 3.0 t ha−1 in Mutasa District (Figure 2B). There were no significant effects of either high (90 kg ha−1) or low (45 kg ha−1) N fertilizer application on maize grain yields in both study sites (Table 6, C2) despite evidence of highest maize grain yields in treatments receiving 90 kg mineral N ha−1 only. A significant effect on maize grain yields of whether N fertilizer was applied as organic or mixed form was evident in Hwedza alone (C3, p = 0.036 and C4, p = 0.012; Table 6) where co-application of mineral and organic N consistently gave higher mean grain yields than sole organic N fertilizer. For example, at 45 kg N ha−1, mean maize grain yields of 1.4 t ha−1 were attained when N was co-applied as mineral and organic N compared with 1.0 t ha−1 when 45 kg N ha−1 was applied solely as organic N (C3 Table 6; also see Figure 2). In addition, the mineral fertilized treatments consistently out-yielded the mixed and organic N treatments, with yields of up 1.9 t ha−1 compared to 1.4 t ha−1 (C4; Table 6). This difference in maize grain yield was dependent on the rate of N fertilizer applied (C6; Table 6). At low (45 kg ha−1) rates of N application, there was a 0.4 t ha−1 difference in maize grain yield between the sole mineral and co-application of mineral and organic N. At higher (90 kg ha−1) N fertilizer application, comparable grain yields of ~2.0 t ha−1 were measured within these categories (Figure 2). The lack of significant N fertilizer management strategies on maize grain yields in Mutasa (p > 0.05) indicates a potential confounding effect of agroecology on maize productivity. Thus, there was evidence of accelerated crop growth in Mutasa even in treatments receiving low N, with earlier crop physiological maturity (end-March) than in Hwedza (end-April to early May). This could be attributed to the high rainfall and temperatures in this study site which yielded higher maize grain yields in Mutasa compared with Hwedza, even in the control treatments (Figure 2A,B).

3.1.2. Cowpea Grain Yields

Nitrogen fertilizer addition and application strategy had significant effects on cowpea grain yields in Hwedza and Mutasa (Table 7). Cowpea grain yields ranged between 0.1 and 0.6 t ha−1 in Hwedza (Figure 3A) and 0.8 and 1.9 t ha−1 in Mutasa (Figure 3B). Nitrogen fertilizer application more than doubled cowpea grain yields compared with Fe only treatments which yielded 0.1 and 0.8 t ha−1 in Hwedza and Mutasa, respectively (see C1, Table 7; Figure 3A,B). Significant effects of N fertilizer application rate on cowpea grain yields were only evident in Mutasa District (C2, Table 7) where the high N (30 kg ha−1) treatments had significantly larger mean cowpea grain yields of 1.7 t ha−1 compared with the low N (15 kg ha−1) treatments which yielded 1.2 t ha−1 (Figure 3B). At both sites, N fertilizer application strategy had significant effects on cowpea grain yields (C3, Table 7). For example, when N was applied at high (30 kg ha−1) rates, the combination of organic and mineral N fertilized treatments consistently outperformed the sole organic fertilized treatments by ~0.3 t ha−1. In Hwedza, the mineral fertilized treatments consistently out-performed the sole organic and combinations of organic and mineral N treatments by >40% at both low (15 kg ha−1) and high (30 kg ha−1) N rates (C4, Table 7). No similar effects were observed in Mutasa. There were no significant interaction effects of N fertilizer rate and N management strategy on cowpea grain yields (C5 and C6, Table 7).

3.2. Finger Millet Grain Yields

3.2.1. High Fe “Seed Pool”

Co-application of N and Fe fertilizer had effects on the “high Fe” finger millet grain yields in Hwedza (p = 0.0016) and Mutasa (p < 0.0001) districts (C1, Table 8A,B). The “high Fe” finger millet grain yields ranged from 276 to 1123 kg ha−1 in Hwedza and 80 to 262 kg ha−1 in Mutasa (Figure 4A,C). Application of 45 kg mineral N + 45 kg organic N ha−1 consistently had the largest grain yields. Finger millet receiving N and Fe fertilizer yielded mean grain yields of 757 kg ha−1 (Hwedza) and 156 kg ha−1 (Mutasa), which was more than double the grain yields attained when Fe fertilizer was applied alone. There were no significant effects of N fertilizer application rate on the “high Fe” finger millet grain yields in both sites (p > 0.05; C2 Table 8A,B). Nitrogen management strategy had significant effects on finger millet grain yields (C3; Table 8A,B), irrespective of rate. For example, co-application of mineral and organic N fertilizer at low (45 kg ha−1) rates resulted in significantly larger finger millet grain yields of 817 and 217 kg ha−1 in Hwedza and Mutasa, respectively, compared with grain yields of 447 (Hwedza) and 80 (Mutasa) kg ha−1 when sole organic N + Fe was applied (Figure 4A,C). The application of N as mineral fertilizer or organic N (including mixed N) had no significant effects on the “high Fe” finger millet grain yields in both sites (C4; Table 8A,B). Similarly, the “high Fe” finger millet grain yields were independent of N fertilizer application strategy and N rate interaction effects (C5 and C6; p > 0.05; Table 8A,B).

3.2.2. Low Fe “Seed Pool”

Co-application of N and Fe fertilizer had effects on the “low Fe” finger millet grain yields in Hwedza (p < 0.0001) and Mutasa (p = 0.002) Districts (C1, Table 9A,B). The “low Fe” finger millet grain yields ranged between 141–1025 kg ha−1 in Hwedza and 81–189 kg ha−1 in Mutasa (Figure 4B,D). Application of 45 kg mineral N + 45 kg organic N ha−1 had the largest grain yields in Hwedza (Figure 4B). In contrast, sole mineral N applied at 45 kg ha−1 had the largest yields in Mutasa (Figure 4D). Finger millet receiving N and Fe fertilizer yielded mean grain yields of 691 kg ha−1 (Hwedza) and 152 kg ha−1 (Mutasa). The non-N control (Fe only) treatments had mean grain yields of 141 and 81 kg ha−1 in Hwedza and Mutasa, respectively (Figure 4B,D). N fertilizer rate had a significant effect on the “low Fe” finger millet “seed pool” in Mutasa (C2, p = 0.011, Table 9) with no similar effects observed in Hwedza (C2, p = 0.087, Table 9). N management strategy (i.e., mineral, organic, or mixed) had significant effects on the “low Fe” finger millet grain yields in both Hwedza and Mutasa (C3, Table 9). For example, co-application of mineral and organic N fertilizer at high N (90 kg ha−1) rates resulted in significantly larger finger millet grain yields of 1025 and 172 kg ha−1 in Hwedza and Mutasa, respectively, compared with grain yields of 379 (Hwedza) and 80 (Mutasa) kg ha−1 when 90 kg of sole organic N ha−1 + Fe was applied (Figure 4B,D).
There were mixed responses to N fertilizer application form (C4) and interaction effects between N fertilizer application strategy and N rates in both sites. In Hwedza, sole mineral N fertilized treatments yielded 865 kg ha−1 grain yield, out-performing the organic fertilized treatments (including mixed N) which yielded 604 kg ha−1 (C4, p < 0.0001, Table 9). No similar effects were observed in Mutasa (Table 9, p > 0.05).
In Hwedza, the difference between the effect of applying sole mineral N fertilizer and applying sole organic N (including mixed N) fertilizer on the “low Fe” finger millet “seed pool” depended on the overall rate of N application of N (C6, p = 0.019, Table 9). For example, at low N (45 kg ha−1), finger millet grain yields of 915 kg ha−1 were attained when sole mineral N fertilizer was applied with Fe compared with yields of 506 kg ha−1 when sole organic N (including combinations) was applied. In contrast, at 90 kg N ha−1, grain yields of 816 kg ha−1 were attained under the sole mineral N + Fe treatments and were comparable to yields of 702 kg ha−1 when sole organic N (including mixed N) fertilizer + Fe were applied. In Mutasa, the “low Fe” finger millet grain yields were independent of N fertilizer application strategy and N rates interaction effects (C5 and C6, p > 0.05, Table 9).

3.3. Influence of N Fertilization on Grain Fe Concentration of Maize, Cowpea, and Finger Millet

Nitrogen fertilization had significant effects on grain Fe concentration of the low Fe finger millet “seed pool” grown in Hwedza District (p < 0.01, Table 10) but not in Mutasa District. Grain Fe concentration in the low Fe finger millet “seed pool” ranged from 26.4 to 48.4 mg kg−1 (Figure 5). Significant N effect on grain Fe concentration in this “seed pool” were observed between the mineral and (mixed and organic N) treatments (C4, Table 10). For example, the mineral N fertilized treatments consistently had larger grain Fe concentration compared with the sole organic N treatments and the combinations of organic and mineral N fertilized treatments, irrespective of the N rate applied. At 45 kg N ha−1, the mineral fertilized treatments had the largest mean grain Fe concentration of 48.4 mg kg−1 (range 29.7–89.3 mg kg−1), which translated to ~50% larger grain Fe concentration compared with a mean concentration of 32.6 mg kg−1 attained within the sole organic N and combinations of mineral and organic N category. Similarly, at 90 kg N ha−1, the mineral fertilized finger millet had a larger mean grain Fe concentration of 39.4 mg kg−1 compared with a mean concentration of 27.9 mg kg−1 attained within the sole organic N and combinations of mineral and organic N treatments. Overall, the control treatment without any form of N fertilizer had the least grain Fe concentration of 26.4 mg kg−1.
No significant effects of N fertilization on grain Fe concentration were observed in maize, cowpea, and the high Fe finger millet “seed pools” (p > 0.05, Supplementary Material). However, there was a tendency of larger mean grain Fe concentration in crops grown in Mutasa than in Hwedza. For example, maize, cowpea, and finger millet grown in Mutasa had grain Fe concentrations of 32.0 ± 2.7 (range 15.3–72.7 mg kg-1), 62.8 ± 2.6 (range 42.4–98.8 mg kg-1), and 49.1 ± 3.5 (range 12.5–79.6 mg kg-1), respectively, compared with grain Fe concentration of 24.6 ± 1.5 (range 16.5–38.8) mg kg−1 in maize, 50.3 ± 1.0 (range 40.2–59.2) mg kg−1 in cowpea, and 40.0 ± 2.7 (range 12.5–89.3) mg kg−1 in finger millet grown in Hwedza (Supplementary dataset).

4. Discussion

4.1. Nitrogen Management Remains Crucial in Cereal and Legume Grain Yields Even When Fe is Supplied

Nitrogen fertilizers improved cereal and cowpea grain yields. Co-application of mineral N and organic N fertilizer produced the largest maize grain yields at one site (Hwedza), irrespective of N fertilizer rate. The lack of N management effects on maize grain yields in Mutasa compared to Hwedza could be attributed to combined positive effects of higher rainfall, temperature, and relative fertility of the field (i.e., 7.5% soil organic matter-SOM content) on crop productivity which could have confounded any potential effects of N management on grain yield. For example, the control treatment (0N + Fe) had mean maize grain yields of 1.7 t ha−1 which were comparable to the 45 kg organic N treatment which yielded 1.8 t ha−1. In previous research conducted in the medium rainfall area Hwedza [17,19], unfertilized maize plots would produce maize grain yields of <1 t ha−1, even when fertilized with Zn. The effects of N and Fe fertilizer on increasing cowpea yield concur with our earlier work on effects of N and Zn fertilizer management on grain yield and Zn concentration in cowpea [18,19]. Research on N management (i.e., sole organic/mineral applications and combinations thereof) effects on cereal and legume grain yields has been extensively conducted in similar low nutrient input systems [31,42,43,44,45]. In most of these studies, co-application of mineral and organic N fertilizer proved to be the best strategy for improving grain yields of crops grown under nutrient depleted sandy soils.
The largest finger millet grain yields were obtained when N was applied at low rates (45 kg N ha−1) in mineral form or in combinations of mineral and organic N forms. Finger millet grain yields were low when N was applied at higher (90 kg N ha−1) rates possibly due to increased vegetative growth and lodging. Finger millet and other millets are prone to lodging which compromises crop yields. Breeding programs are looking at reducing this undesirable trait to improve millets’ productivity [46]. The smallest finger millet grain yields were attained when no N fertilizer was applied. While finger millet is a low nutrient requiring crop [47], optimal productivity on nutrient depleted soils still requires N fertilization. Rurinda et al. [48] reported that N is required in germination and productivity of finger millet and sorghum grown on nutrient depleted soils. In addition to effects of N on finger millet grain yield, there was evidence of low grain yields in the high rainfall area possibly due to finger millet’s high water use efficiency trait [49], which could potentially limit its establishment (i.e., germination) and productivity in high rainfall areas.

4.2. Grain Fe Nutrition is Governed by Various Agronomic and Site-Specific Factors

Grain Fe concentration was increased by N additions in the low Fe finger millet “seed pool”. Irrespective of rate, mineral N fertilizer yielded significantly larger grain Fe concentration compared to sole organic N, or combined application of mineral and organic N forms. Larger effects of mineral N fertilizer, even at low rates, on uptake of Zn have been reported in maize grown under similar cropping systems with soil and foliar Zn [19]. Smallholder farmers could therefore apply low rates of N and still realize increased grain Fe concentration compared with when no N fertilizer is applied. Studies testing the effects of N on Zn uptake have been conducted earlier in wheat. For example, Kutman et al. [27] reported larger increases in grain Zn concentration in the endosperm of potted wheat grains grown with N. Loading, unloading, and transport of Zn in the plant is largely dependent on N-transporter proteins which carry Zn, and possibly Fe, from the xylem into the phloem and into the grain [50,51].
When comparing Fe-fertilized (field experiments) and non-Fe-fertilized crops from farmers’ fields, Fe fertilization in field experiments increased grain Fe concentrations of maize and cowpea by between 5 and 30% compared with grain grown on farmers’ fields. However, finger millet grown in field experiments had a smaller grain Fe concentration (43.0 mg kg−1) than grains grown in farmers’ fields (62.3 mg kg−1) [25]; while response to external Fe fertilizer application was low in this current field study, potted [22,26] and field [52,53] studies have shown potential to improve grain Fe concentrations of staple crops, for example, wheat and legumes (cowpea and mung bean) grown with Fe fertilization under certain conditions.
A comparison of crop type was not the focus of this study; however, variations in grain Fe concentrations between the crops were apparent. Cowpea had the largest mean grain Fe concentration of 57.4 ± 1.8 mg kg−1 (range 40.2–98.8 mg kg−1), followed by finger millet (mean = 43.0 ± 1.5 mg kg−1; range 12.5–89.3 mg kg−1). Maize had the lowest mean grain Fe concentration of 29.5 ± 1.9 mg kg−1 (range 15.3–72.7 mg kg−1). Zhao et al. [54] reported similarly low mean maize grain Fe concentrations of 17.3 mg kg−1 in 980 maize fields located in four main maize production areas of China. In our earlier survey of 350 fields in smallholder farms in Zimbabwe, grain Fe concentrations differed between crop types [25]. For example, maize and cowpea from farmers’ fields had mean grain Fe concentrations of 28.0 and 43.7 mg kg−1, respectively, while finger millet had the largest mean grain Fe concentration of 62.3 mg kg−1.
The generally low yields of finger millet, averaging <1 t ha−1 and the lack of a yield response of finger millet to external Fe fertilization, indicates that there is potential to improve the Fe nutrition of this crop through crop breeding. Finger millet grain yields of up to 6 t ha−1 can be attained under smallholder conditions [55]. A wide variation in grain Fe concentration of 25–139 mg kg−1 in local finger millet “seed pools” grown on farmers’ fields [25] needs more study to determine factors governing variations in grain Fe concentration (i.e., environment or genotype effect). Millets have potential to improve livelihoods and food nutrition and security (if processed using appropriate home-based approaches) in economically constrained settings of changing climate and emerging pandemics [49,56].
In terms of targeting Fe nutrition to smallholder communities, cowpea and finger millet are potentially better sources of Fe than maize, but current management options would need to be improved. Findings from this study indicated that it is difficult to reach the recommended grain Fe concentration of 88 mg kg−1 in small grains, 107 mg kg−1 in grain legumes and 60 mg kg−1 in maize [57], even with external Fe fertilization. Although most surveyed farms in Hwedza and Mutasa had optimal levels of plant-available soil Fe concentrations [25], Fe availability for plant uptake may be limited by various soil geochemical factors. Iron, which is available for plant uptake as ferrous (Fe2+) or ferric (Fe3+) iron [58], could be impeded by high soil pH, high levels of calcium carbonates (CaCO3), and organic matter content [59], limited soil water availability, or drought [22,60]. However, most of the soil factors are not an issue in smallholder farms hence a need for further investigations to test how Fe could be loaded into grains (i.e., larger foliar Fe fertilizer application rates). In addition, larger mean grain Fe concentrations measured in the high rainfall Mutasa District compared with Hwedza indicate that agro-ecology and variations in landscape potentially influence crop nutrition. Similar trends were observed in the Zn-N field experiments [19] showing that variations in agro-ecology differentially influence Zn and Fe supply. It is therefore imperative to develop micronutrient fertilization guidelines which cater for site-specific fertilizer requirements as guided by variations in soils and agro-ecology. Effects of soil inoculants on uptake and loading of micronutrients into legume grains could be a potential area for investigation to determine contribution of nitrogen- (N2) fixing bacteria (i.e., Rhizobium) to improved grain Fe concentration. While this study did not focus on cowpea nodulation, possible impacts of N fertilization on the nodulation process on the roots of cowpea could also be investigated.

5. Conclusions

Our findings show that different N fertilizer management strategies have the capacity to improve yields of cereals and cowpea. In addition, N fertilizer management improved grain Fe concentration of the low Fe finger millet “seed pool” grown with Fe fertilizer. Although good soil fertility management is essential for yield and grain quality, the effects on grain Fe concentration were less consistent than those reported earlier for Zn. While cowpea and finger millet could potentially be major sources of Fe in smallholder households, their grain Fe concentrations still fall short of adequate nutritional levels, even with good soil fertility management. Integrated agronomic management through linking crop breeding in the context of variations in agro-ecology and farmer management is imperative for improving dietary Fe supply in rural households.

Supplementary Materials

The following are available online at https://www.mdpi.com/2073-4395/11/1/124/s1.

Author Contributions

M.G.M.-K., P.M., F.M., M.R.B., and M.J.W. were responsible for the conceptualization of the study. M.G.M.-K. was responsible for experimental work and data curation; and performed data analysis with R.M.L., M.G.M.-K. wrote the original draft. All authors have read and agreed to the published version of the manuscript.

Funding

Authors acknowledge funding from the Royal Society and Department for International Development (DFID-UK) grant award AQ140000 to conduct work on “Strengthening capacity in soil geochemistry to inform agriculture and health policies”. Additional funding from the International Foundation for Science (IFS) Grant I-3-C-5597-2 on “Testing integrated biofortification as an approach to harvest more grain zinc under contrasting legume-cereal cropping systems in Zimbabwe” awarded to the first author supported this work.

Institutional Review Board Statement

Not applicable.

Informed Consent Statement

Not applicable.

Data Availability Statement

Data from this study are available from the first author upon request.

Acknowledgments

Authors would like to thank Tongai Mtangadura, Vengai Mbanyele, and researchers within the Soil Fertility Consortium for Southern Africa (SOFECSA) research group for teamwork and assistance with field work. We are grateful for the support, guidance and assistance during field work from the District Agricultural Extension Officers (DAEOs), AEWs, and farmers in Hwedza and Mutasa Districts. Laboratory assistance from Lolita Wilson (University of Nottingham) and Elliott M. Hamilton (British Geological Survey) is greatly appreciated.

Conflicts of Interest

The authors declare no conflict of interest.

References

  1. Ems, T.; Lucia, K.; Huecker, M.R. Biochemistry, Iron Aabsorption; StatPearls: Treasure Island, FL, USA, 2020. [Google Scholar]
  2. Abbaspour, N.; Hurrell, R.; Kelishadi, R. Review on iron and its importance for human health. J. Res. Med. Sci. 2014, 19, 164–174. [Google Scholar] [PubMed]
  3. World Health Organization (WHO). Conclusions and recommendations of the WHO consultation on prevention and control of iron deficiency in infants and young children in malaria-endemic areas. Food Nutr. Bull. 2007, 28, S621–S627. [Google Scholar] [CrossRef] [PubMed] [Green Version]
  4. Miller, J.L. Iron deficiency anemia: A common and curable disease. Cold Spring Harb. Perspect. Med. 2013, 3. [Google Scholar] [CrossRef] [PubMed] [Green Version]
  5. ZNSA and ICF. Zimbabwe Demographic and Health Survey 2015; Final Report for Zimbabwe National Statistics Agency (ZIMSTAT) and ICF International: Rockville, MD, USA, 2016; pp. 193–198. [Google Scholar]
  6. Food and Agriculture Organization of the United Nations. Current Worldwide Annual Meat Consumption per Capita; FAO: Rome, Italy, 2013. [Google Scholar]
  7. Kitalyi, A.J. Village Chicken Production Systems in Rural Africa: Household Food Security and Gender Issues. In FAO Animal Production and Health Paper 142; Food and Agriculture Organization: Rome, Italy, 1998; ISBN 92-5-104160-1. [Google Scholar]
  8. Katsidzira, L.; Laubscher, R.; Gangaidzo, I.T.; Swart, R.; Mutasa, R.; Manyanga, T.; Thomson, S.; Ramesar, R.; Matenga, J.A.; Rusakaniko, S. Dietary patterns and colorectal cancer risk in Zimbabwe: A population-based case-control study. Cancer Epidemiol. 2018, 57, 33–38. [Google Scholar] [CrossRef] [PubMed]
  9. Bouis, H.E.; Saltzman, A. Improving nutrition through biofortification: A review of evidence from HarvestPlus, 2003 through 2016. Glob. Food Secur. 2017, 12, 49–58. [Google Scholar] [CrossRef]
  10. Scott, S.; Murray-Kolb, L.E.; Wenger, M.J.; A Udipi, S.; Ghugre, P.S.; Boy, E.; Haas, J.D. Cognitive Performance in Indian School-Going Adolescents Is Positively Affected by Consumption of Iron-Biofortified Pearl Millet: A 6-Month Randomized Controlled Efficacy Trial. J. Nutr. 2018, 148, 1462–1471. [Google Scholar] [CrossRef]
  11. Finkelstein, J.L.; Fothergill, A.; Hackl, L.S.; Haas, J.D.; Mehta, S. Iron biofortification interventions to improve iron status and functional outcomes. Proc. Nutr. Soc. 2019, 78, 197–207. [Google Scholar] [CrossRef]
  12. Fang, Y.; Wang, L.; Xin, Z.; Zhao, L.; An, X.; Hu, Q. Effect of Foliar Application of Zinc, Selenium, and Iron Fertilizers on Nutrients Concentration and Yield of Rice Grain in China. J. Agric. Food Chem. 2008, 56, 2079–2084. [Google Scholar] [CrossRef]
  13. Niyigaba, E.; Twizerimana, A.; Mugenzi, I.; Ngnadong, W.A.; Ye, Y.P.; Wu, B.M.; Hai, J.B. Winter Wheat Grain Quality, Zinc and Iron Concentration Affected by a Combined Foliar Spray of Zinc and Iron Fertilizers. Agronomy 2019, 9, 250. [Google Scholar] [CrossRef] [Green Version]
  14. Zou, C.; Du, Y.; Rashid, A.; Ram, H.; Savasli, E.; Pieterse, P.I.; Ortiz-Monasterio, I.; Yazici, A.; Kaur, C.; Mahmood, K.; et al. Simultaneous biofortification of wheat with zinc, iodine, selenium, and iron through foliar treatment of a micronutrient cocktail in six countries. J. Agric. Food Chem. 2019, 67, 8096–8106. [Google Scholar] [CrossRef] [Green Version]
  15. Godsey, C.B.; Schmidt, J.P.; Schlegel, A.J.; Taylor, R.K.; Thompson, C.R.; Gehl, R.J. Correcting Iron Deficiency in Corn with Seed Row–Applied Iron Sulfate. Agron. J. 2003, 95, 160–166. [Google Scholar] [CrossRef]
  16. Joy, E.J.M.; Stein, A.J.; Young, S.D.; Ander, E.L.; Watts, M.J.; Broadley, M.R. Zinc-enriched fertilisers as a potential public health intervention in Africa. Plant Soil 2015, 389, 1–24. [Google Scholar] [CrossRef] [Green Version]
  17. Manzeke, G.M.; Mtambanengwe, F.; Nezomba, H.; Mapfumo, P. Zinc fertilization influence on maize productivity and grain nutritional quality under integrated soil fertility management in Zimbabwe. Field Crop. Res. 2014, 166, 128–136. [Google Scholar] [CrossRef]
  18. Manzeke, M.G.; Mtambanengwe, F.; Nezomba, H.; Watts, M.J.; Broadley, M.R.; Mapfumo, P. Zinc fertilization increases productivity and grain nutritional quality of cowpea (Vigna unguiculata [L.] Walp.) under integrated soil fertility management. Field Crop. Res. 2017, 213, 231–244. [Google Scholar] [CrossRef]
  19. Manzeke, M.G.; Mtambanengwe, F.; Watts, M.J.; Broadley, M.R.; Lark, R.M.; Mapfumo, P. Nitrogen effect on efficient agronomic zinc biofortification of maize and cowpea in Zimbabwean smallholder farming systems. Agron. J. 2020, 112, 2256–2274. [Google Scholar] [CrossRef]
  20. Cakmak, I. Enrichment of cereal grains with zinc: Agronomic or genetic biofortification? Plant Soil 2008, 302, 1–17. [Google Scholar] [CrossRef]
  21. Kutman, U.B.; Yildiz, B.; Ozturk, L.; Cakmak, I. Biofortification of Durum Wheat with Zinc through Soil and Foliar Applications of Nitrogen. Cereal Chem. J. 2010, 87, 1–9. [Google Scholar] [CrossRef]
  22. Márquez-Quiroz, C.; de la Cruz-Lázaro, E.; Osorio-Osorio, R.; Sánchez-Chávez, E. Biofortification of cowpea beans with iron: Iron´s influence on mineral content and yield. J. soil Sci. Plant Nutr. 2015, 15, 839–847. [Google Scholar] [CrossRef]
  23. Mathers, A.C. Effect of ferrous sulfate and sulfuric acid on grain sorghum yields. Agron. J. 1970, 62, 555–556. [Google Scholar] [CrossRef]
  24. Manzeke, G.M.; Mapfumo, P.; Mtambanengwe, F.; Chikowo, R.; Tendayi, T.; Cakmak, I. Soil fertility management effects on maize productivity and grain zinc content in smallholder farming systems of Zimbabwe. Plant Soil 2012, 361, 57–69. [Google Scholar] [CrossRef]
  25. Manzeke, M.G.; Mtambanengwe, F.; Watts, M.J.; Hamilton, E.M.; Lark, R.M.; Broadley, M.R.; Mapfumo, P. Fertilizer management and soil type influence grain zinc and iron concentration under contrasting smallholder cropping systems in Zimbabwe. Sci. Rep. 2019, 9, 1–13. [Google Scholar] [CrossRef] [PubMed]
  26. Kutman, U.B.; Yildiz, B.; Cakmak, I. Effect of nitrogen on uptake, remobilization and partitioning of zinc and iron throughout the development of durum wheat. Plant Soil 2011, 342, 149–164. [Google Scholar] [CrossRef]
  27. Kutman, U.B.; Yildiz, B.; Cakmak, I.; Yildiz-Kutman, B. Improved nitrogen status enhances zinc and iron concentrations both in the whole grain and the endosperm fraction of wheat. J. Cereal Sci. 2011, 53, 118–125. [Google Scholar] [CrossRef]
  28. Allen, L.H.; Carriquiry, A.L.; Murphy, S.P. Perspective: Proposed Harmonized Nutrient Reference Values for Populations. Adv. Nutr. 2019, 11, 469–483. [Google Scholar] [CrossRef]
  29. FAO. Fertiliser use by crop in Zimbabwe. Land and Plant Nutrition Management Service, Land and Water Development Division; Food and Agricultural Organization of the United Nations: Rome, Italy, 2006; Available online: http://www.fao.org/3/a0395e/a0395e00.htm (accessed on 6 July 2020).
  30. Lindsay, W.L.; Norvell, W.A. Development of a DTPA Soil Test for Zinc, Iron, Manganese, and Copper. Soil Sci. Soc. Am. J. 1978, 42, 421–428. [Google Scholar] [CrossRef]
  31. Kanonge, G.; Mtambanengwe, F.; Nezomba, H.; Manzeke, M.G.; Mapfumo, P. Assessing the potential benefits of organic and mineral fertilizer combinations on legume productivity under smallholder management in Zimbabwe. S. Afr. J. Plant Soil 2015, 32, 241–248. [Google Scholar] [CrossRef]
  32. Mtambanengwe, F.; Mapfumo, P. Organic Matter Management as an Underlying Cause for Soil Fertility Gradients on Smallholder Farms in Zimbabwe. Nutr. Cycl. Agroecosyst. 2005, 73, 227–243. [Google Scholar] [CrossRef]
  33. Yunta, F.; Martín, I.; Lucena, J.J.; Gárate, A. Iron Chelates Supplied Foliarly Improve the Iron Translocation Rate in Tempranillo Grapevine. Commun. Soil Sci. Plant Anal. 2012, 44, 794–804. [Google Scholar] [CrossRef]
  34. Lancashire, P.D.; Bleiholder, H.; Langelüddecke, P.; Stauss, R.; van den Boom, T.; Weber, E.; Witzen-Berger, A. A uniform decimal code for growth stages of crops and weeds. Ann. Appl. Biol. 1991, 119, 561–601. [Google Scholar] [CrossRef]
  35. Kurwakumire, N.; Chikowo, R.; Mtambanengwe, F.; Mapfumo, P.; Snapp, S.S.; Johnston, A.; Zingore, S. Maize productivity and nutrient and water use efficiencies across soil fertility domains on smallholder farms in Zimbabwe. Field Crop. Res. 2014, 164, 136–147. [Google Scholar] [CrossRef]
  36. Watts, M.J.; Middleton, D.R.S.; Marriott, A.L.; Humphrey, O.S.; Hamilton, E.M.; Gardner, A.; Smith, J.A.; McCormack, V.A.; Menya, D.; Munishi, M.O.; et al. Source apportionment of micronutrients in the diets of Kilimanjaro, Tanzania and Counties of Western Kenya. Sci. Rep. 2019, 9, 1–14. [Google Scholar] [CrossRef] [PubMed] [Green Version]
  37. Joy, E.J.; Broadley, M.R.; Young, S.D.; Black, C.R.; Chilimba, A.D.; Ander, E.L.; Barlow, T.S.; Watts, M.J. Soil type influences crop mineral composition in Malawi. Sci. Total. Environ. 2015, 505, 587–595. [Google Scholar] [CrossRef] [PubMed] [Green Version]
  38. Okalebo, J.R.; Gathua, K.W.; Woomer, P.L. Laboratory Methods of Soil and Plant Analysis: A Working Manual, 2nd ed.; Sacred Africa: Nairobi, Kenya, 2002. [Google Scholar]
  39. Anderson, J.M.; Ingram, J.S.I. Tropical soil biology and fertility. In A Handbook of Methods, 2nd ed.; CAB International: Wallingford, UK, 1993. [Google Scholar]
  40. Murphy, J.; Riley, J.P. A modified single solution method for the determination of phosphate in natural waters. Anal. Chim. Acta 1962, 27, 31–36. [Google Scholar] [CrossRef]
  41. R Core Team. R: A Language and Environment for Statistical Computing; R Foundation for Statistical Computing: Vienna, Austria, 2018; Available online: https://www.R-project.org/ (accessed on 10 November 2020).
  42. Nyamangara, J.; Mudhara, M.; Giller, K.E. Effectiveness of cattle manure and nitrogen fertilizer application on the agronomic and economic performance of maize. S. Afr. J. Plant Soil 2005, 22, 59–63. [Google Scholar] [CrossRef] [Green Version]
  43. Dunjana, N.; Nyamugafata, P.; Nyamangara, J.; Mango, N. Cattle manure and inorganic nitrogen fertilizer application effects on soil hydraulic properties and maize yield of two soils of Murewa district, Zimbabwe. Soil Use Manag. 2014, 30, 579–587. [Google Scholar] [CrossRef]
  44. Mtangadura, T.J.; Mtambanengwe, F.; Nezomba, H.; Rurinda, J.; Mapfumo, P. Why organic resources and current fertilizer formulations in Southern Africa cannot sustain maize productivity: Evidence from a long-term experiment in Zimbabwe. PLoS ONE 2017, 12, e0182840. [Google Scholar] [CrossRef] [PubMed]
  45. Mtambanengwe, F.; Mapfumo, P. Effects of Organic Resource Quality on Soil Profile N Dynamics and Maize Yields on Sandy Soils in Zimbabwe. Plant Soil 2006, 281, 173–191. [Google Scholar] [CrossRef]
  46. Jency, J.P.; Rajasekaran, R.; Singh, R.K.; Muthurajan, R.; Prabhakaran, J.; Mehanathan, M.; Prasad, M.; Ganesan, J. Induced mutagenesis enhances lodging resistance and photosynthetic efficiency of kodo millet (Paspalum Scrobiculatum). Agronomy 2020, 10, 227. [Google Scholar] [CrossRef] [Green Version]
  47. Li, P.; Brutnell, T.P. Setaria viridis and Setaria italica, model genetic systems for the Panicoid grasses. J. Exp. Bot. 2011, 62, 3031–3037. [Google Scholar] [CrossRef] [Green Version]
  48. Rurinda, J.; Mapfumo, P.; van Wijk, M.; Mtambanengwe, F.; Rufino, M.C.; Chikowo, R.; E Giller, K. Comparative assessment of maize, finger millet and sorghum for household food security in the face of increasing climatic risk. Eur. J. Agron. 2014, 55, 29–41. [Google Scholar] [CrossRef]
  49. Muthamilarasan, M.; Prasad, M. Small Millets for Enduring Food Security Amidst Pandemics. Trends Plant Sci. 2020. [Google Scholar] [CrossRef] [PubMed]
  50. Waters, B.M.; Chu, H.-H.; DiDonato, R.J.; Roberts, L.A.; Eisley, R.B.; Lahner, B.; Salt, D.E.; Walker, E. Mutations in Arabidopsis Yellow Stripe-Like1 and Yellow Stripe-Like3 Reveal Their Roles in Metal Ion Homeostasis and Loading of Metal Ions in Seeds. Plant Physiol. 2006, 141, 1446–1458. [Google Scholar] [CrossRef] [PubMed] [Green Version]
  51. Borg, S.; Brinch-Pedersen, H.; Tauris, B.; Holm, P.B. Iron transport, deposition and bioavailability in the wheat and barley grain. Plant Soil 2009, 325, 15–24. [Google Scholar] [CrossRef]
  52. Pahlavan-Rad, M.R.; Pessarakli, M. Response of Wheat Plants to Zinc, Iron, and Manganese Applications and Uptake and Concentration of Zinc, Iron, and Manganese in Wheat Grains. Commun. Soil Sci. Plant Anal. 2009, 40, 1322–1332. [Google Scholar] [CrossRef]
  53. Majeed, A.; Minhas, W.A.; Mehboob, N.; Farooq, S.; Hussain, M.; Cheema, S.A.; Rizwan, M.S. Iron application improves yield, economic returns and grain-Fe concentration of mungbean. PLoS ONE 2020, 15, e0230720. [Google Scholar] [CrossRef]
  54. Zhao, Q.-Y.; Xu, S.-J.; Zhang, W.-S.; Zhang, Z.; Yao, Z.; Chen, X.-P.; Zou, C. Identifying key drivers for geospatial variation of grain micronutrient concentrations in major maize production regions of China. Environ. Pollut. 2020, 266, 115114. [Google Scholar] [CrossRef]
  55. Mnyenyembe, P.H. Past and present research on finger millet in Malawi. In Advances in Small Millets; Riley, K.W., Gupta, S.C., Seetharam, A., Mushonga, J.N., Eds.; International Science Publisher: New York, NY, USA, 1994; pp. 29–37. [Google Scholar]
  56. Gabaza, M.; Muchuweti, M.; Vandamme, P.; Raes, K. Can fermentation be used as a sustainable strategy to reduce iron and zinc binders in traditional African fermented cereal porridges or gruels? Food Rev. Int. 2016, 33, 561–586. [Google Scholar] [CrossRef]
  57. Bouis, H.E.; Welch, R.M. Biofortification-A Sustainable Agricultural Strategy for Reducing Micronutrient Malnutrition in the Global South. Crop. Sci. 2010, 50, S20. [Google Scholar] [CrossRef] [Green Version]
  58. Morrissey, J.; Guerinot, M.L. Iron Uptake and Transport in Plants: The Good, the Bad, and the Ionome. Chem. Rev. 2009, 109, 4553–4567. [Google Scholar] [CrossRef] [Green Version]
  59. Nikolić, M.; Nikolic, N.; Kostić, L.; Pavlovic, J.; Bosnic, P.; Stevic, N.; Savic, J.; Hristov, N. The assessment of soil availability and wheat grain status of zinc and iron in Serbia: Implications for human nutrition. Sci. Total. Environ. 2016, 553, 141–148. [Google Scholar] [CrossRef]
  60. Shenker, M.; Chen, Y. Increasing Iron Availability to Crops: Fertilizers, Organo-Fertilizers, and Biological Approaches. Soil Sci. Plant Nutr. 2005, 51, 1–17. [Google Scholar] [CrossRef] [Green Version]
Figure 1. Map showing location of field sites in Hwedza and Mutasa districts where experiments were conducted during the 2016–2018 cropping seasons.
Agronomy 11 00124 g001
Figure 2. Mean maize grain yields (±standard error of means, SEM) in (A) Hwedza and (B) Mutasa.
Agronomy 11 00124 g002
Figure 3. Mean cowpea grain yields (± standard error of means, SEM) in (A) Hwedza and (B) Mutasa.
Agronomy 11 00124 g003
Figure 4. Mean grain yields (± standard error of means, SEM) of two finger millet “seed pools” in (A) Hwedza “High Fe seed pool”; (B) Hwedza “Low Fe seed pool”; (C) Mutasa “High Fe seed pool”; and (D) Mutasa “Low Fe seed pool”. ***, indicate that graphs 4C,D have different y-axes scales to graphs 4A,B.
Agronomy 11 00124 g004
Figure 5. Mean grain Fe concentration of the low Fe finger millet “seed pool” receiving different forms and rates of N and Fe fertilizer in Hwedza District. Bars represent ±SEM. The red point represents the initial seed Fe concentration.
Agronomy 11 00124 g005
Table 1. Physiochemical properties of fields used for maize, cowpea, and finger millet experimentation, crops grown per site, and number of plots per crop type and site.
PropertyHwedzaMutasa
Site 1Site 2
Clay content (%)355055
Sand content (%)553535
Available P (mg kg−1)8.710.315.4
Available N (mg kg−1)21.927.331.4
Available Fe (mg kg−1)9.311.915.4
Total Fe (mg kg−1)9.3 × 1043.9 × 1041.6 × 105
¥ SOM (%)5.07.57.8
Soil pH (0.01 M CaCl2)4.74.44.6
Crops grownMaize, cowpea, and finger milletMaize and cowpeaFinger millet
Number of plots per crop282828
Number of plots per site1125656
, Measured using the diethylene triamine pent-acetic acid (DTPA) method. ¥, SOM, soil organic matter measured using the loss on ignition (LOI) method.
Table 2. Treatments applied to determine the influence of N on maize and finger millet grain yield and Fe concentration.
Treatment CodeTreatment
T10 N ha−1 + Fe
T245 kg mineral N fertilizer ha−1 * + Fe
T345 kg organic N fertilizer ha−1 + Fe
T422.5 kg mineral N fertilizer ha−1 + 22.5 kg organic N fertilizer ha−1 + Fe
T590 kg mineral N fertilizer ha−1 + Fe
T690 kg organic N fertilizer ha−1 + Fe
T745 kg mineral N fertilizer ha−1 + 45 kg organic N fertilizer ha−1 + Fe
* ha−1, per hectare.
Table 3. Treatments applied to determine the influence of optimal N supply on cowpea grain yield and Fe concentration.
Treatment CodeTreatment
T10 N ha−1 * + Fe
T215 kg mineral N fertilizer ha−1 + Fe
T315 kg organic N fertilizer ha−1 + Fe
T47.5 kg mineral N fertilizer ha−1 + 7.5 kg organic N fertilizer ha−1 + Fe
T530 kg mineral N fertilizer ha−1 + Fe
T630 kg organic N fertilizer ha−1 + Fe
T715 kg mineral N fertilizer ha−1 + 15 kg organic N fertilizer ha−1 + Fe
* ha−1, per hectare.
Table 4. Nutrient composition of cattle manure used for field experimentation ¥.
PropertyHwedzaMutasa
a Total Zn (mg kg−1)10.06.0
a Total Fe (g kg−1)10.45.0
b Total N (g kg−1)10.116.1
c Total P (g kg−1)2.30.8
d Total K (g kg−1)4.32.6
d Total Ca (mg kg−1)454401
d Total Mg (mg kg−1)19301196
d Total Na (mg kg−1)257101
e Organic carbon (C, g kg−1)243319
C:N ratio24.119.8
¥, reproduced from Manzeke et al. [19]; a, wet digestion with aqua regia; b, Kjeldahl procedure; c, wet digestion with aqua regia; d 1 M acidified ammonium acetate (NH4OAc), e Walkley–Black method.
Table 5. Orthogonal contrasts tested to show the effect of different N management strategies on maize, two finger millet “seed pools”, and cowpea productivity and grain Fe concentration.
ContrastComparison* df
C10 N versus some N fertilizer application1
C2Low N versus High N fertilizer1
C3Organic N fertilizer versus mixed N fertilizer1
C4Mineral N fertilizer versus (organic N and mixed N) fertilizer1
C5(Organic versus mixed N) fertilizer * (High versus Low N) fertilizer1
C6(Mineral N fertilizer versus (Mixed and organic N)) fertilizer * (High versus Low N) fertilizer1
* df = degrees of freedom.
Table 6. ANOVA contrasts showing effects of different N management strategies on maize grain yields in Hwedza and Mutasa.
A. HwedzaB. Mutasa
ContrastComparisond.fSum Sqp-Valued.fSum Sqp-Value
C10 N vs. some N application13.840.03011.550.039
C2Low N vs. High N 10.910.35510.290.351
C3Organic N vs. mixed N11.390.03610.550.200
C4Mineral N vs. (mixed N and organic N)11.850.01211.250.062
C5(Organic vs. mixed N) ● (High vs. Low N)10.900.95610.860.116
C6(Mineral N vs. (Mixed and organic N)) ● (High vs. Low N)10.040.69410.070.647
BlockBlocking effect21.25n.a.30.30n.a.
ResidualsResiduals183.98n.a.164.972n.a.
vs., versus; ●, interaction between two factors; n.a., not applicable.
Table 7. ANOVA of contrasts showing effects of N management strategies on cowpea grain yields in Hwedza and Mutasa.
A. HwedzaB. Mutasa
ContrastComparisond.fSum Sqp-Valued.fSum Sqp-Value
C10 N vs. some N application10.1590.005911.6150.020
C2Low N vs. High N10.0590.06511.4280.028
C3Organic N vs. mixed N10.2620.00111.1490.046
C4Mineral N vs. (mixed N and organic N)10.1730.00410.00370.904
C5(Organic vs. mixed N) ● (High vs. Low N)10.0110.37810.13350.475
C6(Mineral N vs. (Mixed and organic N)) ● (High vs. Low N)10.0230.22710.40520.219
BlockBlocking effect20.006n.a.34.509n.a.
ResidualsResiduals120.173n.a.180.387n.a.
vs.—versus. ●—interaction between two factors. n.a.—not applicable.
Table 8. ANOVA of contrasts showing effect of N management strategy on grain yields of the high Fe finger millet “seed pool” in Hwedza and Mutasa.
High Fe “Seed Pool”
ContrastComparisonA. HwedzaB. Mutasa
d.fSum Sqp-Valued.fSum Sqp-Value
C10 N vs. some N application1788,8140.001611.1459<0.0001
C2Low N vs. High N 1157,3240.113910.09800.06695
C3Organic N vs. mixed N11,177,8630.0002514.0996<0.0001
C4Mineral N vs. (mixed N and organic N)1161,9640.109110.00300.7373
C5(Organic vs. mixed N) ● (High vs. Low N)1119,0930.165510.00030.9115
C6(Mineral N vs. (Mixed and organic N)) ● (High vs. Low N)194780.68810.04170.2196
BlockBlocking effect352,897n.a.30.0729n.a.
ResidualsResiduals181,025,969n.a.180.4642n.a.
vs., versus. ●, interaction between two factors. n.a., not applicable.
Table 9. ANOVA of contrasts showing effect of N management strategy on grain yields of the low Fe finger millet “seed pool” in Hwedza and Mutasa.
Low Fe “Seed Pool”
ContrastComparisonA. HwedzaB. Mutasa
d.fSum Sqp-Valued.fSum Sqp-Value
C10 N vs. some N application11,036,219<0.000110.210650.002
C2Low N vs. High N 157,4780.08710.762360.011
C3Organic N vs. mixed N11,364,545<0.000111.059830.003
C4Mineral N vs. (mixed N and organic N)1364,418<0.000110.105600.3079
C5(Organic vs. mixed N) ● (High vs. Low N)115,3810.361810.289780.099
C6(Mineral N vs. (Mixed and organic N)) ● (High vs. Low N)1116,3030.01910.00100.998
BlockBlocking effect325,630n.a.30.28180n.a
ResidualsResiduals18316,259n.a.181.726n.a.
vs., versus. ●, interaction between two factors. n.a., not applicable.
Table 10. ANOVA of contrasts showing effect of N management strategy on grain Fe concentration of the low Fe finger millet “seed pool” grown in Hwedza.
ContrastComparisond.fSum Sqp-Value
C10 N vs. some N application10.1610.160
C2Low N vs. High N 10.1610.159
C3Organic N vs. mixed N10.3080.058
C4Mineral N vs. (mixed N and organic N)10.6510.008
C5(Organic vs. mixed N) ● (High vs. Low N)10.0040.822
C6(Mineral N vs. (Mixed and organic N)) ● (High vs. Low N)10.0050.805
BlockBlocking effect30.563n.a.
ResidualsResiduals181.349n.a.
vs., versus. ●, interaction between two factors. n.a., not applicable.
Publisher’s Note: MDPI stays neutral with regard to jurisdictional claims in published maps and institutional affiliations.

