Article

Effect of Water Stress on Grain Yield and Physiological Characters of Quinoa Genotypes

1
Department of Agronomy, Ghazi University, Dera Ghazi Khan 32200, Pakistan
2
College of Life Sciences, Yan’an University, Yan’an 716000, China
3
Department of Agronomy, Muhammad Nawaz Shareef University of Agriculture, Multan 66000, Pakistan
4
Department of Agronomy, University of Agriculture, Faisalabad 38040, Pakistan
5
National Agricultural Research Centre, Islamabad 44000, Pakistan
6
Fujian Provincial Key Laboratory of Crop Molecular and Cell Biology, Oil Crops Research Institute, Center of Legume Crop Genetics and Systems Biology/College of Agriculture, Fujian Agriculture and Forestry University, Fuzhou 350002, China
7
Department of Plant Breeding and Genetics, The University of Haripur, Haripur 22620, Pakistan
8
Directorate of Soil Fertility Research Institute, Lahore 54000, Pakistan
9
Department of Plant Breeding and Genetics, Ghazi University, Dera Ghazi Khan 32200, Pakistan
10
Department of Forestry, Bahauddin Zakariya University, Multan 60800, Pakistan
11
Department of Botany, Ghazi University, Dera Ghazi Khan 32200, Pakistan
*
Authors to whom correspondence should be addressed.
Submission received: 17 August 2021 / Revised: 18 September 2021 / Accepted: 23 September 2021 / Published: 27 September 2021
(This article belongs to the Special Issue Molecular Genetic Improvement of Crop Drought Tolerance)

Abstract

:
Climate change scenarios predict that an extended period of drought is a real threat to food security, emphasizing the need for new crops that tolerate these conditions. Quinoa is the best option because it has the potential to grow under water deficit conditions. There is considerable variation in drought tolerance in quinoa genotypes, and the selection of drought-tolerant quinoa germplasms is of great interest. The main goal of this work is to evaluate the crop yield and characterize the physiology of 20 quinoa genotypes grown under water deficit in a wirehouse. The experiment was a complete randomized design (CRD) factorial with three replications. Seedling growth, i.e., fresh weight (FW), dry weight (DW), root length (RL), shoot length (SL), relative growth rate of root length (RGR-RL), shoot length (RGR-SL), and physiological performance, i.e., chlorophyll content (a and b), carotenoid, leaf phenolic content, leaf proline content, membrane stability index (MSI), and leaf K+ accumulation were evaluated in a hydroponic culture under different water-deficit levels developed by PEG 6000 doses (w/v) of 0% (control), 0.3%, and 0.6%. Yield attributes were evaluated in a pot at three different soil moisture levels, as determined by soil gravimetric water holding capacity (WHC) of 100 (control), 50% WHC (50 % drought stress) and 25% WHC (75% stress). In both experiments, under the water stress condition, the growth (hydroponic study) and yield traits (pot study) were significantly reduced compared to control treatments. On the drought tolerance index (DTI) based on seed yield, genotype 16 followed by 10, 1, 4, 5, 7, and 12 could be considered drought-tolerant genotypes that produced maximum grain yield and improved physiological characteristics under severe water stress conditions in hydroponic culture. In both studies, genotypes 3, 8, 13, and 20 performed poorly and were considered drought-sensitive genotypes with the lowest DTI values under water-stressed conditions. All the studied agronomic traits (grain yield, root and shoot length, shoot fresh and dry weights) and physiological traits (leaf phenolic, proline content, carotenoid, K+ accumulation, membrane stability index, and relative water content) were firmly inter-correlated and strongly correlated with DTI. They can be regarded as screening criteria, employing a large set of quinoa genotypes in a breeding program.

1. Introduction

Quinoa is pseudo-cereal with attractive nutritional properties, and this attribute has dramatically increased its consumption in recent years [1]. This plant is considered to be one of the species that might sustain food security in this century. Quinoa contains essential amino acids and unsaturated fatty acids, and it is rich in magnesium, iron, vitamins, and fibers, while containing high gluten-free protein [2]. Globally, interest in quinoa increased because it shows high genetic variability. This diversity and variability allow the quinoa to grow under severe conditions, e.g., drought [3]. In a climate change scenario, precipitation will decline and the frequency of drought will increase, resulting in a strong impact on agriculture. In this sense, the quinoa plant may be an alternative, climate-resilient, and nutrient-dense crop option [4,5]. Due to considerable variation in drought tolerance in quinoa genotypes, the selection of drought-tolerant quinoa germplasms is of great interest.
Quinoa thrives under a wide range of drought stress due to diversity differentiation in contrasting agro environments. Quinoa shows various morphological and physiological adaptive strategies to drought stress. Its whole-plant response to drought involves changes in root and leaf growth, and in some cases few ontogenic variations [5]. Under the option for drought regimes or rainfed areas where other crops produce low yields or cannot be grown due to a restriction of the root dynamics [6], inhibition of leaf growth improves the water balance and stress tolerance by limiting water loss and ensuring plant survival under water deficit. Under the water stress condition, plants enhanced water uptake by accumulating or synthesizing the solute, which lowers the water potential and increases root growth [6]. Water loss through evaporation is limited by closing the stomata and restricting shoot growth [5,7]. Thus, regulation aimed at shoot growth and thereby transpiration area is an integral part of the drought response of several plants.
Growth is much more sensitive to drought stress than photosynthesis. In stressed plants, growth reduction is not just from carbon starvation; there is a sharp and rapid decrease in leaf elongation rate in many plant species [7,8]. Jacobsen et al. [7] reported that quinoa plants grown under drought stress had reduced their leaf expansion rate when compared to well-watered quinoa plants. In addition to the root system, water absorption by plants also depends on root morphology. Specific root length (SRL; root length/dry matter ratio) is associated with capacity for root elongation [9]. These root architecture traits may vary because of many interacting factors such as growth conditions, drought duration, drought intensity, and plant phenology [10].
Many studies revealed that quinoa evolved an adoptive mechanism to mitigate drought stress through high water use efficiency and high shoot/root ratios. Garrido et al. [11] reported that the GGE biplot showed a significant interaction between genotypes and environment for grain yield, harvest index, and grain yield/m2. Considerable variability was observed among stressed quinoa genotypes for grain yield and water use efficiency. Geerts et al. [12] also found a negative effect of water stress on grain yield and WUE. In all growth stages, physiological processes in green plants, such as photosynthesis, are affected by drought stress [13]. Supplemental irrigation can meet water requirements during periodic drought stresses at physiological growth stages [14]. Drought stress at the grain filling stage can reduce plant yield sustainability by affecting plant leaf water potential [5]. It also reduces the crop fresh and dry weights and leaf area [15,16].
This plant is considered as one of the species that might sustain food security in this century. Quinoa exhibits remarkable tolerance against abiotic stress such as drought [3]. Quinoa displays various adaptive strategies to mitigate abiotic stresses by modifying physiological processes and morphological adaptations [5]. Physiological parameters like transpiration, stomatal conductance, and photosynthesis are decreased by water stress. As for plant growth after ten days under stress, these traits remained stable with high water use efficiency. Due to these characteristics, quinoa has been classified as drought-tolerant. In some studies it is reported that, under water deficit conditions, the accumulation of inorganic chemicals, i.e., K, Ca, and Na, and synthesis of organic solutes like proline and carotenoids are increased to maintain its turgor pressure through osmotic adjustment [7,17]. Due to considerable variation in drought tolerance in quinoa genotypes, the selection of drought-tolerant germplasms is of great interest. Breeding programs should be based on agronomical and crop physiological analyses to develop desirable quinoa cultivars to adopt various environmental conditions. In this scenario, quinoa may be an alternative for arid and semiarid areas where other crops fail to produce good yields [18].
Only a few results of quinoa’s physiological and agronomic responses to drought stress are available in the literature. Therefore, the objective of this research was to study (i) the effect of drought stress to screen the best performing genotypes in terms of growth and grain yield, (ii) to elucidate the relationship between drought tolerance and the physiological and agronomic traits of quinoa genotypes.

2. Materials and Methods

2.1. Plant Material

A total of twenty quinoa genotypes (Table 1) were collected from the University of Agriculture Faisalabad. The drought-tolerant quinoa genotype V7 (6) was used as a check. To evaluate the performance of quinoa genotypes against different levels of water deficit (hydroponic + pot), experiments were conducted in wirehouse (open natural environment), Department of Agronomy, Ghazi University Dera Ghazi Khan, with the following details.

2.2. Hydroponic Culture

A nursery of twenty quinoa genotypes was raised by sowing 50 seeds in polythene bags (8 cm × 6 cm) filled with sand in November 2018 and placed in a wirehouse at ambient conditions. Seedlings of genotypes were transplanted at the two-leaf stage in a hydroponic culture created from iron tubs (118 cm × 88 cm × 30 cm; laminated with polyethylene), filled with 100 L of half-strength Hoagland solution, changed fortnightly [19]. Aeration was provided in a growth medium using air compressors to avoid anoxia. Seedling root and shoot lengths were also recorded before the transplantation. The experimental design was a completely randomized design (CRD) factorial with three replications. After two days of nursery shifting in hydroponic culture, three (0%, 0.3%, and 0.6%) drought stress levels were imposed using polyethylene glycol PEG (Sigma-Aldrich, Steinheim, Germany). Seedlings were allowed to grow in treatment solutions for up to 10 days. After ten days, the response of each genotype against different water stress levels was evaluated based on morphological and physiological traits.

2.3. Morphological Traits

After 10 days in a water stress environment, the performance of seedlings was assessed based on morphological traits such as fresh seedling weight (FW), dry weight (DW), seedling root length (RL), shoot length (SL), relative growth rate of root length (RGR-RL), and relative growth rate of shoot length (RGR-SL). The relative growth rate was calculated using the formula of Gardener et al. [20].
RGR = W2 − W1/T2 − T1
where:
  • W1 = root/shoot length at first harvest.
  • W2 = root/shoot length at second harvest.
  • T2 − T1 = time interval between two harvests (10 days).

2.4. Leaf Biochemical Analysis

Fully expanded young leaves were taken after ten days from each treatment and kept in a biomedical freezer at −30 °C. Within one week, the following biochemical parameters were recorded: chlorophyll contents (chlorophyll a, b and carotenoid) in the leaves were determined following Nagata and Yamashita [21], while free proline and phenolic contents in the leaf samples were measured using the protocol described by Bates et al. [22] using a spectrophotometer (Uv 4000; Pfungstadt, Germany).

2.5. Membrane Stability Index (MSI)

After washing and excluding the leaf midribs, a 200 mg sample of fresh leaf tissue was taken, partitioned into small pieces, and placed in 10 mL distilled water in boiling tubes. At 40 °C, these samples were then heated for ½ h using a water bath, and the solution’s electrical conductivity (EC1) was measured using the conductivity meter. At 100 °C, a second sample for the same treatment was heated for 10 min, and the solution’s electrical conductivity (EC2) was also recorded. The leaf MSI% was computed through the following equation, as described by Premchandra et al. [23].
MSI (%) = [1 − (EC1/EC2)] × 100

2.6. Relative Water Content (RWC)

Fresh leaf samples (0.5 g) (WF) were soaked in water until the weight of the leaves was constant. The saturated leaves were weiged (Ws), and then dried for 24 h at 80 °C for determination of dry weight (Wd). Relative water content (RWC) was calculated by using the formula of Barr and Weatherley [24].
RWC = (Wf − Wd/Ws − Wd) × 100

2.7. Determination of Leaf K+ Concentrations

After applying the water stress to the hydroponic culture, the expanded leaves that emerged under stress conditions were collected and put into the oven for drying. Leaf dry weight was determined. Dried leaves were put into falcon tubes filled with 25 mL of 1% HNO3 solution for digestion on a hot plate at 85 °C for 4 h. One milliliter was taken from the digested solution, and a volume of 10 mL was prepared to measure the K+ concentration in the leaf samples using a flame photometer (Model 360; Sherwood Scientific Ltd, Cambridge, UK) following the methods of Munns and Jame [25] and Shavrukov et al. [26].

2.8. Pot Study

Twenty genotypes were assessed for drought tolerance in a plastic pot (containing 12 kg soil). Chemical and physical characteristics (Table 2) of the soil used were analyzed according to the standard protocols described by the U.S. Salinity Laboratory Staff (1954). Five seeds of each quinoa genotype were grown at three different soil moisture levels, as determined by soil gravimetric water holding capacity (WHC): 100 (control), 50% WHC (50% drought stress), and 25% WHC (75 % stress). The Faran et al. [27] protocol was followed to determine WHC by placing 100 g of dry soil on filter paper and saturating it with 100 mL of water. The saturated weight of the soil was recorded after drainage was stopped. The 100% WHC of the experiment soil was calculated using the given formula
WHC = Weight of saturated drained soil − Weight of dry soil/Weight of dry soil
Similarly, the experiment pots were weighed daily, and water was added to maintain the 50% and 25% WHC status based on soil weight. Each treatment was replicated thrice. The pots were placed in a wire-house under ambient light and temperature in a CRD factorial design. Each pot was supplied with a basal dose of K and P @ 60 kg ha−1 using SOP and DAP fertilizers, while the N dose was supplemented @75 kg ha−1 using a half-dose of urea at the time of sowing (15 November 2019) and a half-dose 70 days after sowing. After the emergence of seedlings, thinning was done to maintain one plant in each pot. Plants were harvested when the stem and seed were dried (120 days after sowing). Data for yield components were recorded at various stages, as given below.

2.9. Biomass and Grain Yield

The plants were tagged in each pot to record the yield-related attributes such as plant height, panicle length, 1000-grain weight, grain yield, and biological yield at maturity. Plants were harvested manually and kept for one week in an open environment for sun-drying. After that, grain and biological yields were determined.

2.10. Drought Tolerance Index (DTI) Based on Seed Grain Yield

The drought tolerance index (DTI) was used to differentiate between the genotypes from a tolerance point of view. It is calculated by using the following equation:
DTI = (Y1/AY1) × (Y2/AY2)
where
  • Y1 = mean of a genotype seed yield at control.
  • AY1 = average mean of all genotypes seed yield at control.
  • Y2 = mean of a genotype seed yield at water stress.
  • AY1 = average mean of all genotypes seed yield at water stress.
When DTI ≥ 1, it indicates the genotype is tolerant (T) to drought. If the DTI < 1, it indicates the genotype is sensitive (S) to drought.

2.11. Statistical Analysis

Quantitative observations of experiments were uploaded in SAS 9.4 (Texas A&M University, College Station, TX, USA) software to deduce the analysis of variance (ANOVA) results. The grain yield data with critical values to compare treatment means were evaluated using the LSD test at the 5% probability level. Furthermore, GGE-biplot software [28] was used to better describe the genotype’s performance in the hydroponic study. GGE-biplot was used to generate the polygon view to describe the performance of genotypes based on the interaction between the entries (genotypes) and testers (traits). The genotypes moved toward the vector traits are considered good and contrary, genotypes were considered poor performers that moved away from the traits vector. The principal components sum, i.e., PC1 and PC2 of the GGE-biplot, explained total variation among the genotypes based on traits. The correlation coefficient between any two traits was approximated by the cosine of the angle between their vectors. On this premise, two traits are positively correlated if the angle between their vectors is acute (<90°), while they are negatively correlated if their vectors are at an obtuse angle (>90°). Software statistic 8.1 was used to determine the correlation between the agronomic and different physiological characteristics.

3. Results

3.1. Quinoa Genotypes Performance in Hydroponic Culture

Significant variations (p ≤ 0.001) were observed among 20 quinoa genotypes for seedling growth traits (FW, DW, RL, SL, RGR-RL, RGR-SL) and physiological traits (Chl a, b, carotenoid, leaf phenolic content, leaf proline content, WUE, and leaf K+) against different levels of water deficit (Table 3).

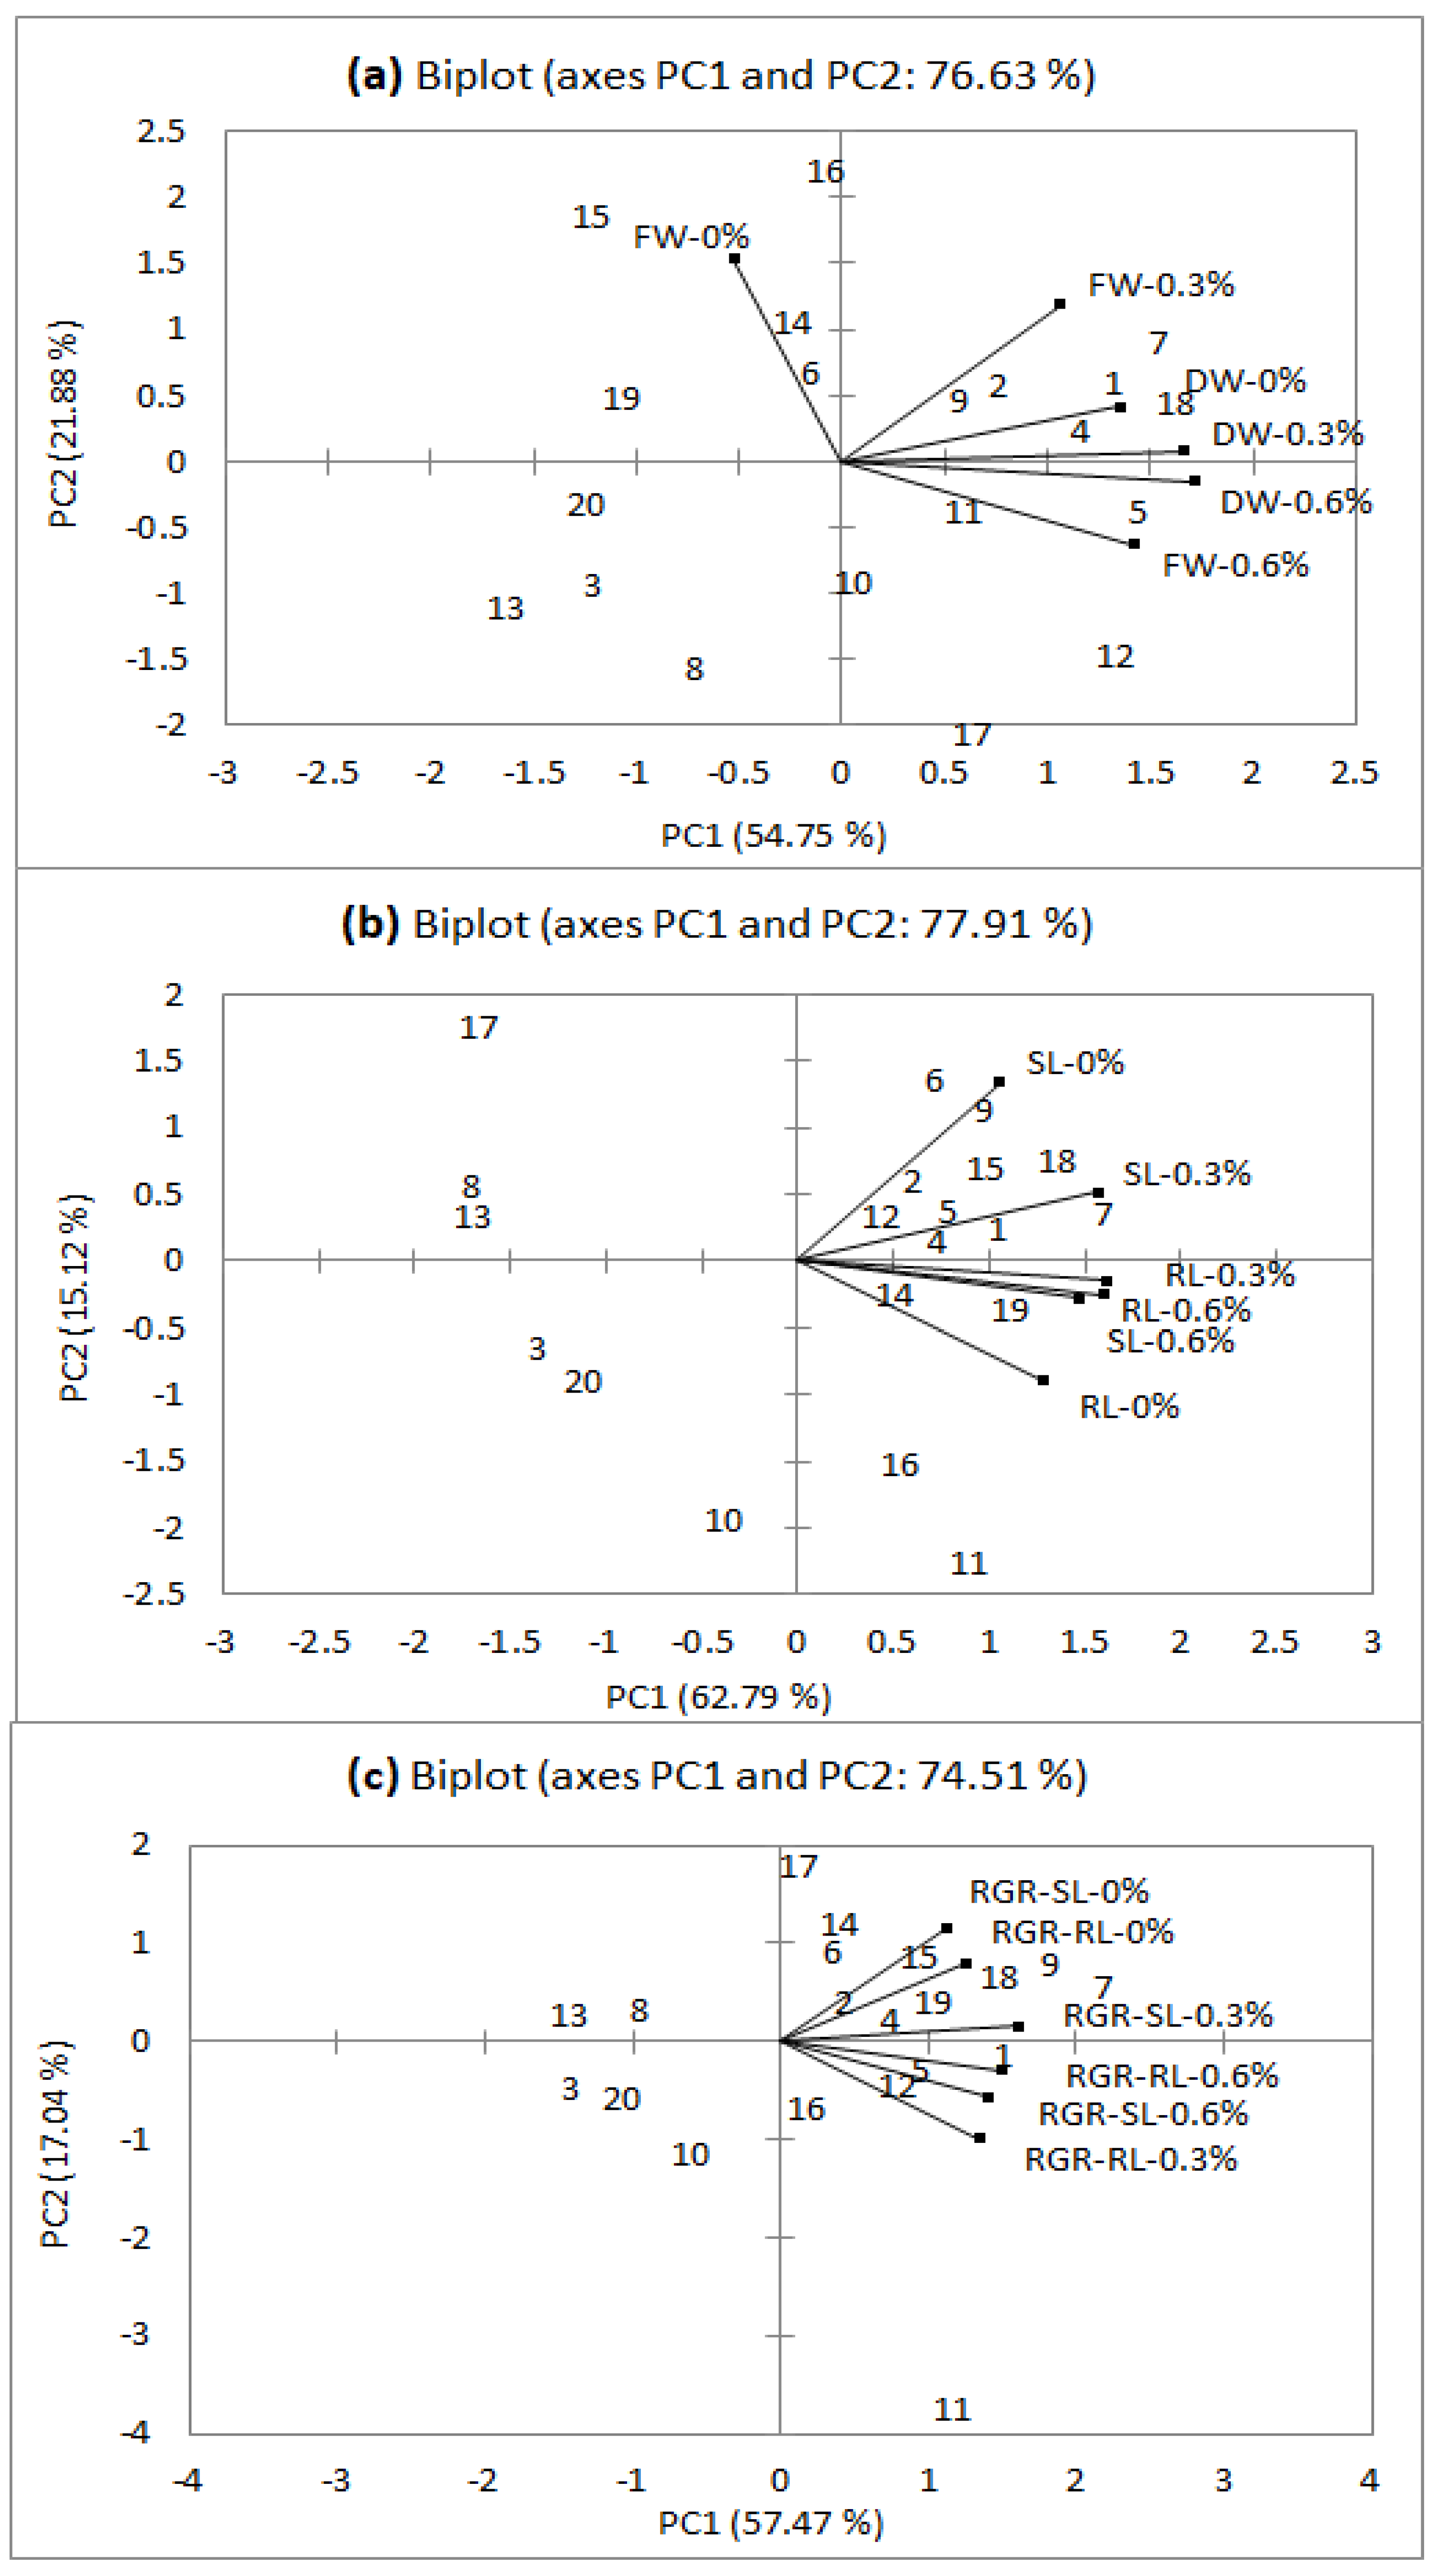
3.1.1. Biplot for Seedling Fresh Weight and Dry Weight

The biplot analysis for the seedling fresh weight (FW) and dry weight (DW) of 20 quinoa genotypes showed statistically significant variation under varying drought levels (0, 50, and 75%) in hydroponic culture (Figure 1a). Principle component (PC1 and PC2) sum explained the 54.75% and 21.88% variation among the genotypes based on FW and DW under varying drought levels (Figure 1a). For the biplot analysis, the genotypes placed on the corners, such as 18, 7, 1, 4, 5, 12, 13, 3, 8, 20 were the most responsive genotypes for FW and DW. Genotype 18 performed best for seedling FW and DW, followed by 7, 1, 4, 5, and 12. While genotype 13 followed by 3, 8, and 20, showed poor performance for FW and DW, as they were located far away from all traits marked on the biplot (Figure 1a). All the traits (FW and DW) showed a positive correlation under water stress levels as the angle between their vectors was acute.

3.1.2. Biplot for Seedling Growth (Root and Shoot Length) and Relative Growth Rates

The biplot analysis for seedling root length (RL), shoot length (SL), relative growth rate of root length (RGR-RL), and relative growth rate of shoot length (RGR-SL) of 20 quinoa genotypes showed statistically significant variation under varying drought levels (0, 50, and 75%) in hydroponic culture (Figure 1b,c). The principle component (PC1 and PC2) sum explained the 77.91% and 74.51% variation among the genotypes based on RL, SL (Figure 1b) and RGR-RL, RGR-SL (Figure 1c), respectively, under water stress levels. For the biplot analysis, genotypes placed on the corners such as 7,18, 19, 1, 15, 5, 4,3, 20, 8, and 13 were the most responsive genotypes for RL, SL, RGR-RL, and RGR-SL (Figure 1b,c). Genotype 7 performed best for RL, SL, RGR-RL, and RGR-SL, followed by 18, 19, 1, 15, 12, and 4, while genotype 3, followed by 20, 10, 13, and 8, showed poor performance for RL, SL, RGR-RL, and RGR-SL, as they were located far away from all traits marked on the biplot (Figure 1b,c). All the traits (RL, SL, RGR-RL, and RGR-SL) showed a positive correlation under different water stress levels as the angle between their vectors was acute.

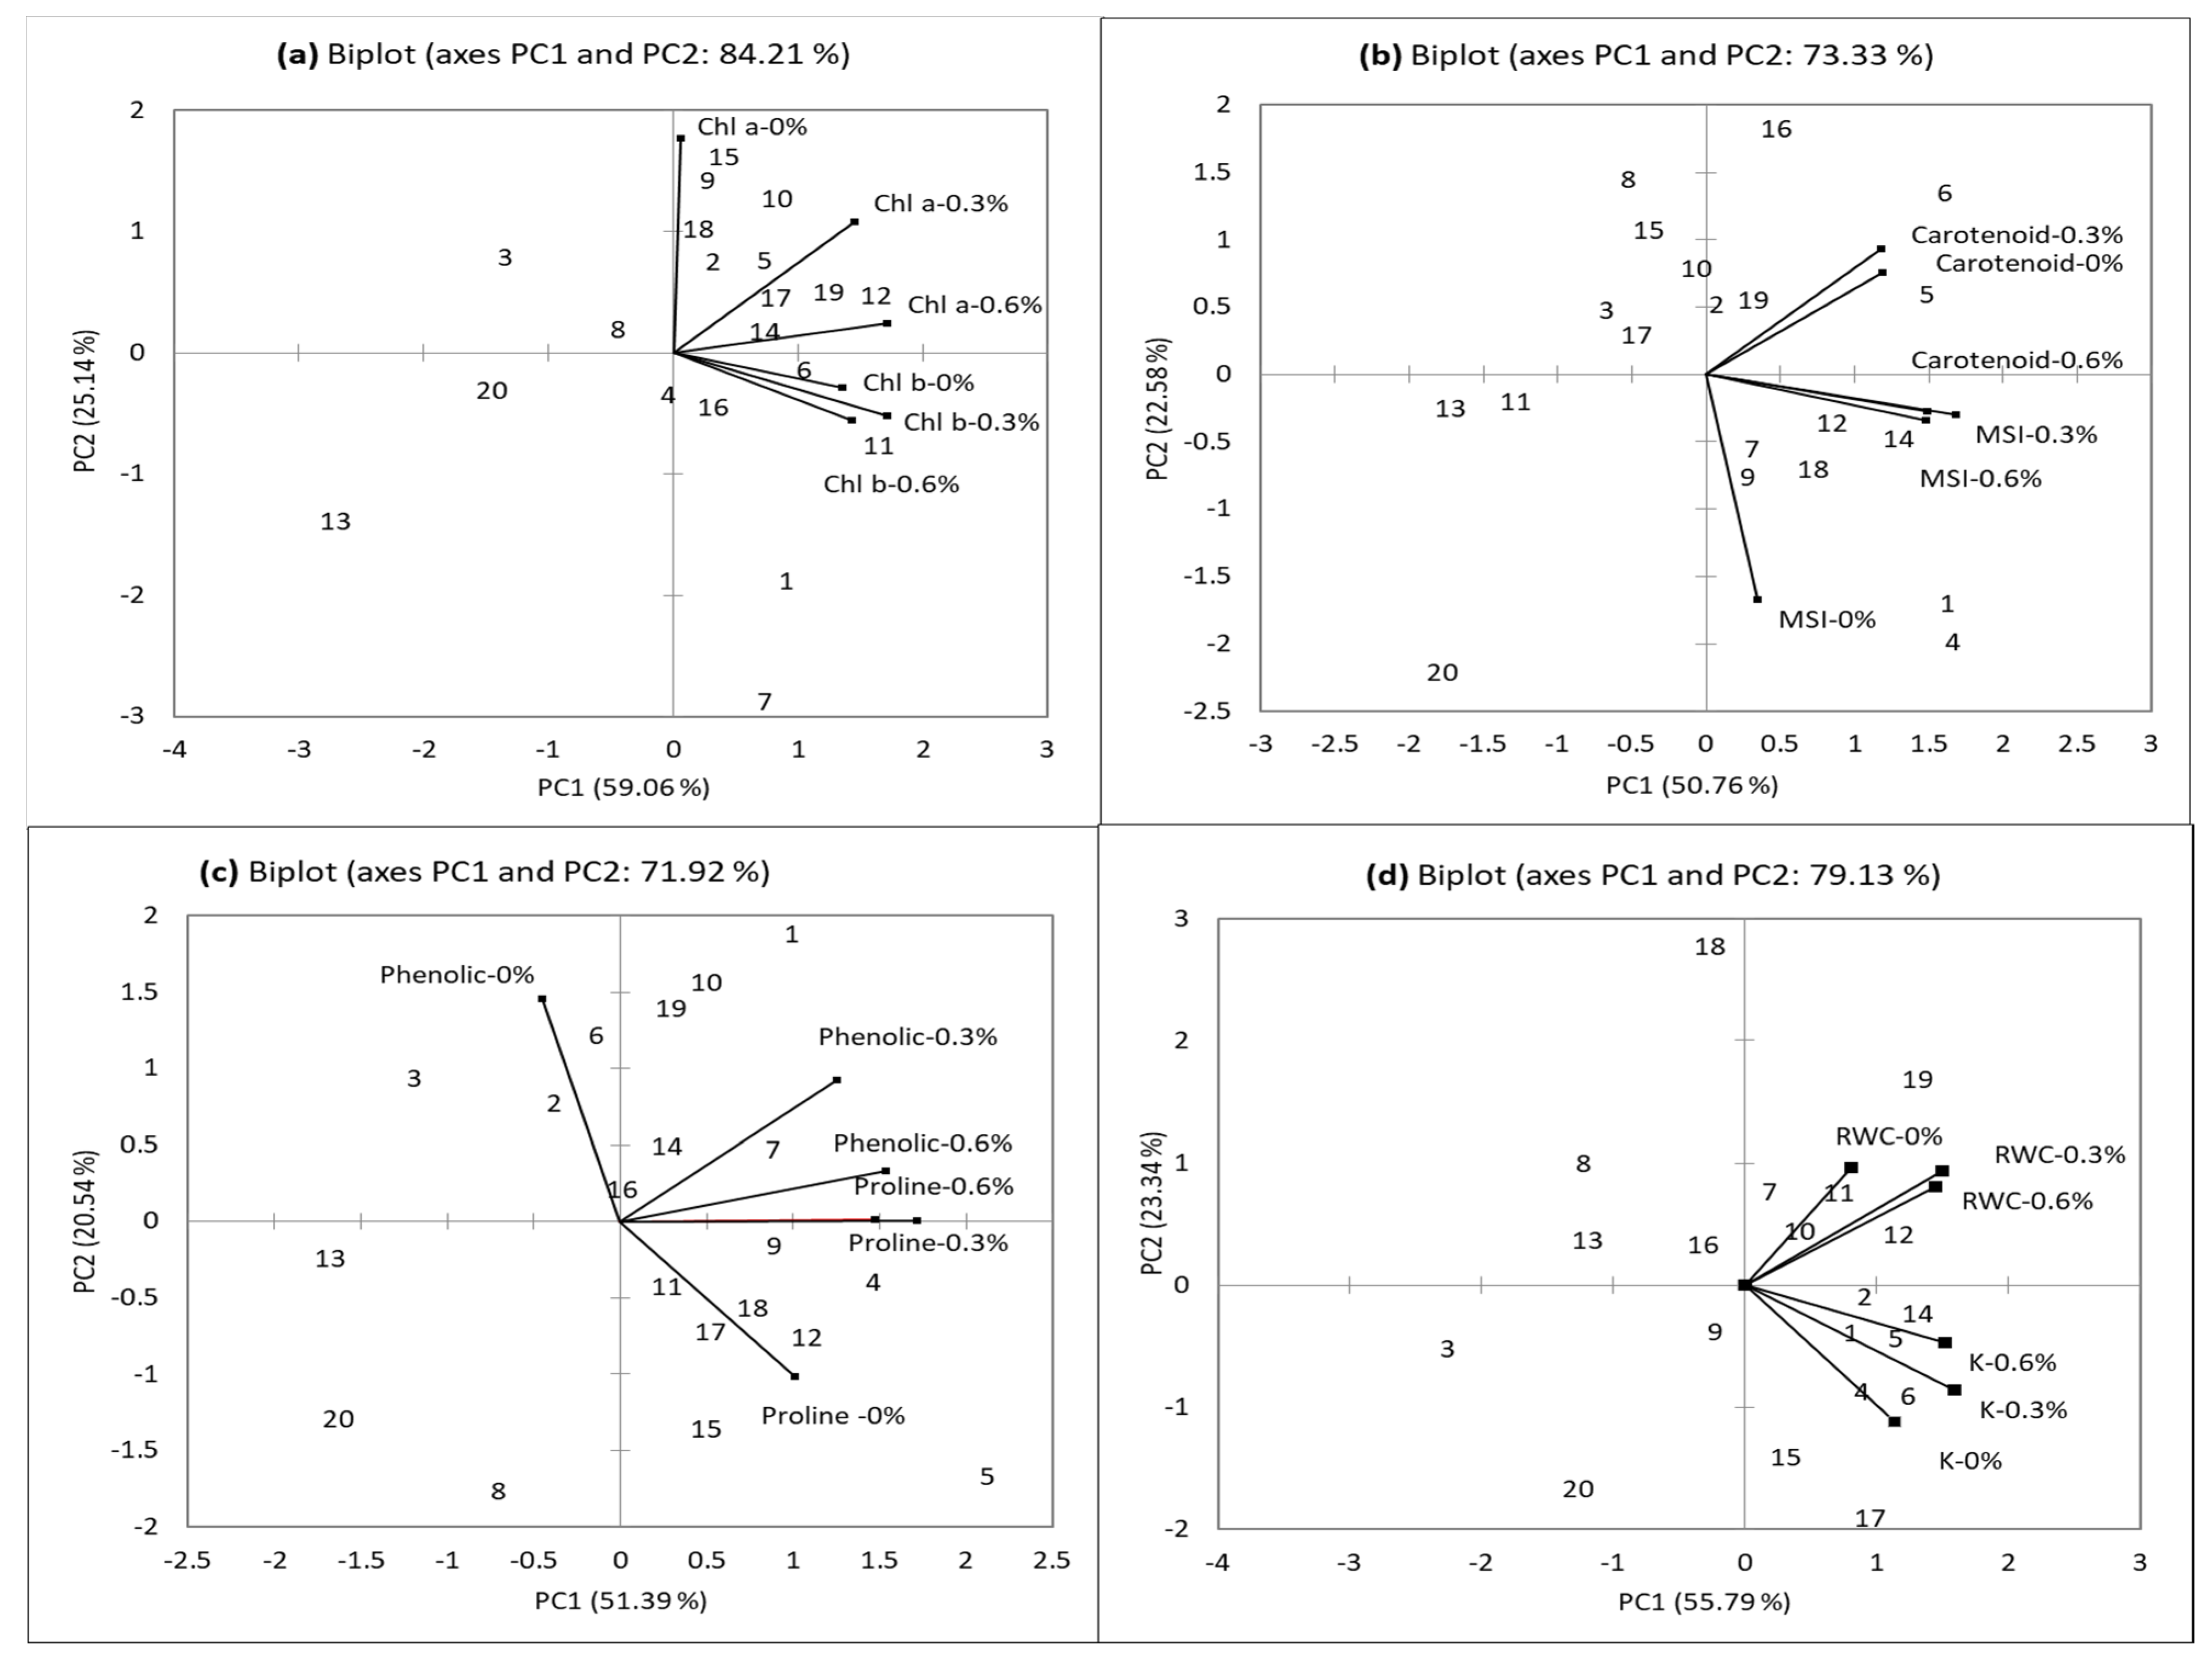
3.1.3. Biplot for Physiological Traits

The biplot analysis for chlorophyll a (Chl a) AND chlorophyll b (Chl b) of the 20 quinoa genotypes showed statistically significant variation under varying water stress levels (0, 50, and 75%) in hydroponic culture (Figure 2a). Among the quinoa genotypes, 84.21% variation was observed in chlorophyll content (a and b) under varying water stress levels (Figure 2a). Genotype 12 performed best for chlorophyll content (a and b), followed by 11,19, 17, 6, 7, and 1. A positive correlation was observed among the chlorophyll contents under various water stress levels (Figure 2a).
Genetic variation 73.33% was recorded among the genotypes for the carotenoid and membrane stability index (Figure 2b). Among the genotypes, 14 performed best and showed the maximum value of carotenoid and MSI, followed by 12, 18, 1, 4, 6, and 7. Under various water stress levels, a significant positive correlation was found among the MSI and carotenoid traits (Figure 2b). The maximum values of leaf phenolic content and leaf proline content were observed in genotype 4, followed by 12, 7, 9, 18, 1, 17, and 11, under different water stress levels (Figure 2c). A 71.92% variation was revealed among the genotypes for leaf phenolic content and leaf proline content under varying water stress levels (Figure 2c). Biplot analysis for leaf K+ accumulation and RWC of 20 quinoa genotypes showed statistically significant variation under varying drought levels (0, 50, and 75%) in hydroponic culture (Figure 2d). The principle component (PC1 and PC2) sum explained the 79.31% variation among the genotypes based on leaf K+ accumulation and RWC (Figure 2d) under water stress levels. For the biplot analysis, the genotypes placed on the corners, such as 14, 12, 5,6, 17, 1, 2, 3, 20, 13, 18, and 8 were the most responsive genotypes for leaf K+ accumulation and RWC (Figure 2d). Genotype 14 performed best for leaf K+ accumulation and RWC, followed by 12, 5, 6, 17, 1, 10, and 4. All the traits (leaf K+ accumulation and RWC) showed a positive correlation under drought levels as the angle between their vectors was acute (Figure 2d), while genotype 20, followed by 13, 3, and 8 showed poor performance for all physiological traits, as they were located far away from all traits marked on the biplots (Figure 2a–d).

3.2. Result of Pot Study

3.2.1. Yield Related Attributes

Statistically significant differences (p < 0.001) were recorded among the genotypes (G), water stress levels (WSL), and their interaction (G * WSL) concerning yield-related attributes (Table 3), except the non-significant difference interaction of plant height and biological yield. Under water deficit conditions, a significant decrease in plant height and panicle length was recorded, compared with the control plants (Table 4 and Table 5). Plant height and panicle length were drastically reduced by increasing the water stress (Table 4). Maximum plant height was recorded in the 18 genotype, followed by 12, 5, 17, 19, 6, 16, 2, and 4, while the maximum value of panicle length was recorded in the 6 genotype, followed by 12 4, 1, 5, 16, and 4. Under water deficit performance, genotype 20, followed by 8, 13, and 3 were very poor for plant height and panicle length (Table 4).
In water stress regimes, significant variations were observed among the treatments, genotypes, and their interaction (p < 0.001) for 1000 grain weight, grain yield, and biological yield (Table 4). Thousand-grain weight, grain yield, and biological yield were significantly reduced by increasing the water stress (Table 5). Reduced grain yield, biological yield, and 1000 grain weight were observed in plants matured in the water stress medium, as compared than in control (Table 4). With water stress at 50%, genotype 1, followed by 6, 7, 5, 16, 2, 18, 4, and 15 produced maximum grain yield (Table 4), while genotype 1 had the highest grain yield followed by 12, 5, 6, 4, 7, 2, and 16 at the 75% water stress level (Table 5). The maximum number for biological yield was found in genotype 14, followed by 1, 4, 16, 2, 6, 17, 5, and 11 at 50% water stress treatment. While at 75% water stress treatment, genotype 1 was followed by 6, 2, 4, 17, 16, 5, and 12 (Table 5). Furthermore, the maximum value of 1000-grain weight was found in genotype 6, followed by 1, 7, 5, 16, 2, 4, 17, and 15 at 50% water stress treatment (Table 4). Moreover, genotype 12, followed by 5, 6, 4, 1, 7, 2, and 16, had the highest 1000-grain weight at the 75% water stress level. Overall, among the genotypes, 20, 3, 13, and 8 had poor yield-related attributes and produced less biomass and seeds under a water stress regime (Table 4).

3.2.2. Drought Tolerance Index (DTI) Based on Seed Grain Yield

A significant difference (p < 0.001) was found among the genotypes based on the drought tolerance index (DTI) estimate (Table 5). The maximum value for DTI was recorded in genotype 16, followed by 10, 1, 4, 5, 7, 6, 5, and 12, which was statistically at the bar and could be considered drought-tolerant (Table 5). On the other hand, genotype 8 and 20 had the lowest values for DTI, followed by 13, 3, 19, and 14, and were thus considered drought-sensitive genotypes (Table 5).

3.2.3. Correlation among the Traits

A significant positive correlation was recorded among genotypes for the grain yield and different physiological characteristics (Table 6). Genotypes that produced high grain yield were strongly linked with improved physiological traits, i.e., DTI, MSI, RWC, leaf chlorophyll content (a, b), and leaf K+ accumulation (Table 6). All the growth (SL, RL, SFW, SDW), agronomic (GY, BY, 1000 WT, PL), and physiological (e.g., leaf phenolic, leaf proline) traits were significantly positively correlated with each other (Table 6).

4. Discussion

Adopting quinoa to the cultivated and natural ecosystem has made this plant an outstanding model for studying development patterns and interspecific and intraspecific variations in the growth and responses of root and shoot architecture systems to water deficits. The physiological adaptability that allows this plant to grow under drought and other severe stress conditions represents an invaluable opportunity and offers immense potential in the face of present and future climate challenges [5]. As the most important stress, drought stress affects more than 10% of arable lands and reduces the yield production of most crop species by over 50% worldwide [29]. Plant tolerance to drought stress varies depending on plant species, and even among genotypes of the same species [30].
Growth traits (Figure 1a–c) and yield traits (Table 4 and Table 5) of all quinoa genotypes decreased under drought stress regimes, as compared to under control conditions in both studies. Genotypes with low grain yields had poor growth and physiology characteristics (Figure 2a–d). At the flowering and vegetative growth stages, water deficit led to significantly lower grain yield and total dry matter [14]. Quinoa shows drought tolerance and has a remarkable agronomic characteristic under drought stress [31], as found in this study (Table 4 and Table 5). It is clear from this result that all quinoa genotypes produced a grain yield under the very high drought stress condition (Table 4 and Table 5). The genotypes with high grain yield were also linked to improved growth traits (Table 6), and thus were ranked as drought-tolerant genotypes (Figure 2a–d). The study of correlation is an important step in developing a breeding program of quinoa [31]. Grain yield also showed a strong link with DTI value and improved other physiological characteristics (Table 6). After ten days under stress, the transpiration, stomatal conductance, and photosynthesis traits, an plant growth of quinoa remained stable, with high water use efficiency [7,17].
Quinoa responds to drought stress through stress tolerance and stress avoidance mechanisms [4,5]. The objective of the stress avoidance mechanism is to balance water uptake and water loss. In response to the osmotic effect (drought stress), the quinoa plant maintains its turgor by accumulating a variety of inorganic ions (e.g., K+, Na+, Cl) or organic molecules (proline and glycine betain), the so-called compatible solutes [32]. The accumulation of organic chemicals, i.e., proline, leaf phenolic, inorganic K+ solute, was also improved in quinoa under drought stress conditions, as confirmed in this study (Figure 2a–d). The accumulation of compatible solutes lowers tissue water potential and improves root growth. Drought escape or tolerance is mainly achieved through low osmotic potential and tissue elasticity [17]. Water loss through evaporation is limited by closing the stomata [7,17]. The drought tolerance of quinoa has been attributed to its deep root system and the presence of leaf vesicles containing calcium oxalate, which could reduce transpiration [7]. The stress tolerance mechanisms of quinoa include the detoxification of reactive species (ROS) and the accumulation of protective proteins, e.g., LEA (late embryogenesis abundant) and solutes (proline, leaf phenolic). Proline has a dual role as both an osmoprotectant and an osmolyte [33,34].
Growth is a more sensitive stage under the drought stress condition. In the rainfed area, plant growth was severely affected due to a restricting of the root dynamics [6]. Drought stress caused carbon starvation and reduced the rate of leaf elongation [5]. The stressed plants closed their stomata to avoid water loss, resulting in limited shoot growth [5], as reported in this study (Figure 1a–c). Inhibition of leaf growth improves water balance and stress tolerance by limiting water loss to ensure plant survival under water deficit [34]. As reported, water use efficiency improved in drought-tolerant genotypes (Figure 2d). Enhancing shoot growth is the main contributing factor in boosting the plant performance under drought conditions. This reduces evapotranspiration and aligns with enhanced root growth for better water uptake [33,34]. Enhanced shoot growth is a contributing factor in boosting plant performance under water-limiting conditions. This reduces evapotranspiration and is also coordinated with enhanced root growth and better water uptake. In addition, under drought conditions, the uptake of water by plants depends on root anatomy and morphology. Specific root length (SRL: root length/dry matter ratio) is associated with the capacity for root elongation. These traits of root architecture and morphology vary because of interaction factors such as drought duration, drought intensity, growth conditions, and plant phenology [35]. Drought stress affects the stomatal aperture of leaves and cell turgidity, resulting in a decrease in CO2 assimilation and transpiration rates, which inhibits leaf metabolism [36,37]. Stomatal conductance, leaf water potential, leaf area index, leaf growth, and the expansion of quinoa plants decreased as water stress increased [38]. Many studies reported that leaf area development was more sensitive to soil drying in many crops, including quinoa [39]. Plants subjected to drought stress during the flowering and vegetative stages had significantly reduced grain yield and total dry matter [14].
However, the quinoa plant has shown an outstanding ability to balance water loss and water uptake, and thus avoid water deficits. Quinoa enhances water uptake in various ways, such as accumulation of the solute, which lowers the tissue’s water potential; by closing the stomata, which restricts shoot growth and increases the speed of leaf senescence; and through modulating the root architecture. Quinoa genotypes produce attractive grain yields in arid areas, and possibly the leaf stomatal conductance is associated with increased yields and heat stress prevention. The biomass of the quinoa crop is also closely related to the rate of transpiration [40]. Garrido et al. [11] found a significant interaction between quinoa genotypes and the environment (drought stress) for the grain yield and harvesting index. Drought stress negatively affected total grain yield and water use efficiency [12]. Under harsh water stress conditions, drought-tolerant genotypes showed superiority over the more sensitive quinoa genotypes in seed yield due to superiority in seed yield per plant and its components such as branches per plant, leaf area, and chlorophyll index [31]. Leaf chlorophyll contents significantly decreased with decreasing the soil moisture, as reported by Jacobsen et al. [7].
Spehar and Santos [41] found a significant positive association between panicle length and grain yield, as confirmed in this study (Table 6). This indicates that selecting these traits may result in more productive genotypes [42]. Plants with good branching characteristics tend to develop a large inflorescence. Inflorescence length was also positively associated with plant height, indicating that lines with greater plant height developed longer panicles [43,44]. Plant height and shoot dry weight decreased significantly in drought stress as compared to control [44,45].

5. Conclusions

The highest drought tolerance was exhibited by genotype 16, followed by 10, 1, 4, 5, 7, 6, 5, and 12. Seed yield per plant of drought-tolerant (T) genotypes was more significant than in the sensitive (S) genotypes. The superiority of drought-tolerant genotypes over the sensitive genotypes under water stress was due to improved physiological characteristics. Better biochemical attributes are of paramount importance for quinoa plant fitness under water stress. High seed yield was linked to improved chlorophyll content (a, b, and carotenoid) and growth attributes. Furthermore, drought-tolerant genotypes also maintained the integrity of membrane stability, which was linked with enhanced accumulation of proline and leaf phenolic content. The current investigation identified the highest drought-tolerant genotypes under severe water stress, which could be used in a future breeding program to improve quinoa drought tolerance.

Author Contributions

Conceptualization, M.S.S.; methodology, M.S.S. and S.I.; formal analysis, M.B.H., M.M.M. and A.R.; investigation, M.B.H., M.M.M., A.R., J.I., M.A.Q., A.B., J. and A.B.G.; writing—original draft preparation, M.S.S., M.B.H., M.M.M., A.R., J.I., S.K., M.A.Q. and A.B.; writing—review and editing, M.S.S., X.W., S.I., M.B.H., M.M.M., A.R., J.I., S.K., M.A.Q., S.F. and A.B.; supervision, M.M.M., A.R., J.I., M.A.Q., A.B. and A.B.G.; funding acquisition, X.W., S.F. and A.R. All authors have read and agreed to the published version of the manuscript.

Funding

The publication of the present work is supported by the Natural Science Basic Research Program of Shaanxi Province (Grant No. 2018JQ5218) and the National Natural Science Foundation of China (51809224), Top Young Talents of Shaanxi Special Support Program.

Institutional Review Board Statement

Not applicable.

Informed Consent Statement

Not applicable.

Data Availability Statement

The data reported in this study will be available from the corresponding author on a reasonable request.

Acknowledgments

The authors are thankful to Higher Education Commission (HEC), Pakistan, for financial support to accomplish this research.

Conflicts of Interest

The authors declare no conflict of interest.

References

  1. Akram, M.Z.; Basra, S.M.A.; Hafeez, M.B.; Khan, S.; Nazeer, S.; Iqbal, S.; Saddiq, M.S.; Zahra, N. Adaptability and yield potential of new quinoa lines under agroecological conditions of Faisalabad-Pakistan. Asian J. Agric. Biol. 2021, 2, 1–8. [Google Scholar]
  2. Maradini-Filho, A. Quinoa: Nutritional aspects. J. Nutraceuticals Food Sci. 2017, 2, 1–5. [Google Scholar]
  3. Hinojosa, L.; González, J.A.; Barrios-Masias, F.H.; Fuentes, F.; Murphy, K.M. Quinoa abiotic stress responses: A review. Plants 2018, 7, 106. [Google Scholar] [CrossRef] [PubMed] [Green Version]
  4. Bazile, D.; Bertero, H.D.; Nieto, C. State of the Art Report on Quinoa around the World in 2013; FAO: Roman, Italy, 2015; Available online: https://agritrop.cirad.fr/575489/1/document_575489.pdf (accessed on 1 August 2021).
  5. Azurita Silva, A.; Jacobsen, S.-E.; Razzaghi, F.; Álvarez Flores, R.; Ruiz, K.B.; Morales, A.; Silva Ascencio, H. Quinoa drought responses and adaptation. In State of the Art Report on Quinoa around the World; FAO: Roma, Italy, 2015; pp. 157–171. [Google Scholar]
  6. Jha, P.K.; Ines, A.V.; Singh, M.P. A multiple and ensembling approach for calibration and evaluation of genetic coefficients of CERES-maize to simulate maize phenology and yield in Michigan. Environ. Model. Softw. 2021, 135, 104901. [Google Scholar] [CrossRef]
  7. Jacobsen, S.-E.; Liu, F.; Jensen, C.R. Does root-sourced ABA play a role for regulation of stomata under drought in quinoa (Chenopodium quinoa Willd.). Sci. Hortic. 2009, 122, 281–287. [Google Scholar] [CrossRef] [Green Version]
  8. Skirycz, A.; Inzé, D. More from less: Plant growth under limited water. Curr. Opin. Biotechnol. 2010, 21, 197–203. [Google Scholar] [CrossRef] [PubMed]
  9. Roumet, C.; Urcelay, C.; Díaz, S. Suites of root traits differ between annual and perennial species growing in the field. New Phytol. 2006, 170, 357–368. [Google Scholar] [CrossRef]
  10. Nicotra, A.; Babicka, N.; Westoby, M. Seedling root anatomy and morphology: An examination of ecological differentiation with rainfall using phylogenetically independent contrasts. Oecologia 2002, 130, 136–145. [Google Scholar] [CrossRef]
  11. Garrido, M.; Silva, P.; Silva, H.; Muñoz, R.; Baginsky, C.; Acevedo, E. Evaluación del rendimiento de nueve genotipos de quinua (Chenopodium quinoa Willd.) j bajo diferentes disponibilidades hídricas en ambiente mediterráneo. Idesia 2013, 31, 69–76. [Google Scholar] [CrossRef] [Green Version]
  12. Geerts, S.; Raes, D.; Garcia, M.; Mendoza, J.; Huanca, R. Crop water use indicators to quantify the flexible phenology of quinoa (Chenopodium quinoa Willd.) in response to drought stress. Field Crop. Res. 2008, 108, 150–156. [Google Scholar] [CrossRef]
  13. Zhao, B.; Ma, B.-L.; Hu, Y.; Liu, J. Source–sink adjustment: A mechanistic understanding of the timing and severity of drought stress on photosynthesis and grain yields of two contrasting oat (Avena sativa L.) genotypes. J. Plant Growth Regul. 2021, 40, 263–276. [Google Scholar] [CrossRef]
  14. Jha, P.K.; Kumar, S.N.; Ines, A.V. Responses of soybean to water stress and supplemental irrigation in upper Indo-Gangetic plain: Field experiment and modeling approach. Field Crop. Res. 2018, 219, 76–86. [Google Scholar] [CrossRef]
  15. Alghabari, F.; Ihsan, M.Z. Effects of drought stress on growth, grain filling duration, yield and quality attributes of barley (Hordeum vulgare L.). Bangladesh J. Bot. 2018, 47, 421–428. [Google Scholar] [CrossRef]
  16. Anjum, S.A.; Ashraf, U.; Zohaib, A.; Tanveer, M.; Naeem, M.; Ali, I.; Tabassum, T.; Nazir, U. Growth and development responses of crop plants under drought stress: A review. Zemdirbyste 2017, 104, 267–276. [Google Scholar] [CrossRef]
  17. Jensen, C.; Jacobsen, S.-E.; Andersen, M.; Nunez, N.; Andersen, S.; Rasmussen, L.; Mogensen, V. Leaf gas exchange and water relation characteristics of field quinoa (Chenopodium quinoa Willd.) during soil drying. Eur. J. Agron. 2000, 13, 11–25. [Google Scholar] [CrossRef]
  18. Jellen, E.N.; Maughan, P.J.; Bertero, D.; Munir, H. Prospects for quinoa (Chenopodium Quinoa Willd.) improvement through biotechnology. In Biotechnology of Neglected and Underutilized Crops; Springer: Berlin, Germany, 2013; pp. 173–201. [Google Scholar]
  19. Hoagland, D.R.; Arnon, D.I. The water-culture method for growing plants without soil. In California Agricultural Experiment Station; Circular 347; University of California: Berkeley, CA, USA, 1950. [Google Scholar]
  20. Gardner, F.; Pearce, R.; Mitchell, R. Physiology of Crop Plants, 2nd ed.; Iowa State University Press: Ames, IA, USA, 1985. [Google Scholar]
  21. Nagata, M.; Yamashita, I. Simple method for simultaneous determination of chlorophyll and carotenoids in tomato fruit. Nippon Shokuhin Kogyo Gakkaishi 1992, 39, 925–928. [Google Scholar] [CrossRef] [Green Version]
  22. Bates, L.S.; Waldren, R.P.; Teare, I. Rapid determination of free proline for water-stress studies. Plant Soil 1973, 39, 205–207. [Google Scholar] [CrossRef]
  23. Premachandra, G.S.; Saneoka, H.; Ogata, S. Cell membrane stability, an indicator of drought tolerance, as affected by applied nitrogen in soyabean. J. Agric. Sci. 1990, 115, 63–66. [Google Scholar] [CrossRef]
  24. Barrs, H.; Weatherley, P. A re-examination of the relative turgidity technique for estimating water deficits in leaves. Aust. J. Biol. Sci. 1962, 15, 413–428. [Google Scholar] [CrossRef] [Green Version]
  25. Munns, R.; James, R.A. Screening methods for salinity tolerance: A case study with tetraploid wheat. Plant Soil 2003, 253, 201–218. [Google Scholar] [CrossRef]
  26. Shavrukov, Y.; Langridge, P.; Tester, M. Salinity tolerance and sodium exclusion in genus Triticum. Breed. Sci. 2009, 59, 671–678. [Google Scholar] [CrossRef] [Green Version]
  27. Faran, M.; Farooq, M.; Rehman, A.; Nawaz, A.; Saleem, M.K.; Ali, N.; Siddique, K.H. High intrinsic seed Zn concentration improves abiotic stress tolerance in wheat. Plant Soil 2019, 437, 195–213. [Google Scholar] [CrossRef]
  28. Yan, W. GGEbiplot—A windows application for graphical analysis of multi environment trial data and other types of two-way data. Agron. J. 2001, 93, 1111–1118. [Google Scholar] [CrossRef] [Green Version]
  29. Bartels, D.; Sunkar, R. Drought and salt tolerance in plants. Crit. Rev. Plant Sci. 2005, 24, 23–58. [Google Scholar] [CrossRef]
  30. Mukami, A.; Ngetich, A.; Mweu, C.; Oduor, R.O.; Muthangya, M.; Mbinda, W.M. Differential characterization of physiological and biochemical responses during drought stress in finger millet varieties. Physiol. Mol. Biol. Plants 2019, 25, 837–846. [Google Scholar] [CrossRef] [PubMed]
  31. Al-Naggar, A.; Abd El-Salam, R.; Badran, A.; El-Moghazi, M.M. Drought tolerance of five Quinoa (Chenopodium quinoa Willd.) genotypes and its association with other traits under moderate and severe drought stress. Asian J. Adv. Agric. Res. 2017, 3, 1–13. [Google Scholar] [CrossRef]
  32. Adolf, V.I.; Jacobsen, S.-E.; Shabala, S. Salt tolerance mechanisms in quinoa (Chenopodium quinoa Willd.). Environ. Exp. Bot. 2013, 92, 43–54. [Google Scholar] [CrossRef]
  33. Shabala, L.; Mackay, A.; Tian, Y.; Jacobsen, S.E.; Zhou, D.; Shabala, S. Oxidative stress protection and stomatal patterning as components of salinity tolerance mechanism in quinoa (Chenopodium quinoa). Physiol. Plant. 2012, 146, 26–38. [Google Scholar] [CrossRef]
  34. Claeys, H.; Inzé, D. The agony of choice: How plants balance growth and survival under water-limiting conditions. Plant Physiol. 2013, 162, 1768–1779. [Google Scholar] [CrossRef] [PubMed]
  35. Kranner, I.; Minibayeva, F.V.; Beckett, R.P.; Seal, C.E. What is stress? Concepts, definitions and applications in seed science. New Phytol. 2010, 188, 655–673. [Google Scholar] [CrossRef]
  36. Khan, S.; Basit, A.; Hafeez, M.B.; Irshad, S.; Bashir, S.; Bashir, S.; Maqbool, M.M.; Saddiq, M.S.; Hasnain, Z.; Aljuaid, B.S. Moringa leaf extract improves biochemical attributes, yield and grain quality of rice (Oryza sativa L.) under drought stress. PLoS ONE 2021, 16, e0254452. [Google Scholar] [CrossRef]
  37. Li, Z.; Su, X.; Chen, Y.; Fan, X.; He, L.; Guo, J.; Wang, Y.; Yang, Q. Melatonin improves drought resistance in maize seedlings by enhancing the antioxidant system and regulating abscisic acid metabolism to maintain stomatal opening under PEG-induced drought. J. Plant Biol. 2021, 64, 299–312. [Google Scholar] [CrossRef]
  38. Fghire, R.; Anaya, F.; Ali, O.I.; Benlhabib, O.; Ragab, R.; Wahbi, S. Physiological and photosynthetic response of quinoa to drought stress. Chil. J. Agric. Res. 2015, 75, 174–183. [Google Scholar] [CrossRef] [Green Version]
  39. Sun, Y.; Liu, F.; Bendevis, M.; Shabala, S.; Jacobsen, S.E. Sensitivity of two quinoa (Chenopodium quinoa Willd.) varieties to progressive drought stress. J. Agron. Crop Sci. 2014, 200, 12–23. [Google Scholar] [CrossRef]
  40. González, J.; Bruno, M.; Valoy, M.; Prado, F. Genotypic variation of gas exchange parameters and leaf stable carbon and nitrogen isotopes in ten quinoa cultivars grown under drought. J. Agron. Crop Sci. 2011, 197, 81–93. [Google Scholar] [CrossRef]
  41. Spehar, C.R.; Santos, R.L.d.B. Agronomic performance of quinoa selected in the Brazilian Savannah. Pesqui. Agropecu. Bras. 2005, 40, 609–612. [Google Scholar] [CrossRef]
  42. Mignone, C.; Bertero, H. Identificación del período crítico de determinación del rendimiento en quínoas de nivel del mar. In Proceedings of the Congreso Internacional de la Quinua, Iquique, Chile, 23–27 October 2007; pp. 23–26. [Google Scholar]
  43. Bhargava, A.; Shukla, S.; Rajan, S.; Ohri, D. Genetic diversity for morphological and quality traits in quinoa (Chenopodium quinoa Willd.) germplasm. Genet. Resour. Crop Evol. 2007, 54, 167–173. [Google Scholar] [CrossRef]
  44. Yang, A.; Akhtar, S.; Amjad, M.; Iqbal, S.; Jacobsen, S.E. Growth and physiological responses of quinoa to drought and temperature stress. J. Agron. Crop Sci. 2016, 202, 445–453. [Google Scholar] [CrossRef]
  45. Raza, A.; Charagh, S.; Sadaqat, N.; Jin, W. Arabidopsis thaliana: Model plant for the study of abiotic stress responses. In The Plant Family Brassicaceae; Springer: Singapore, 2020; pp. 129–180. [Google Scholar]
Figure 1. A “Which is best for what” vector view of genotypes by traits of growth attributes such as (a) FW, DW; (b) RL, SL; and (c) RGR-RL, RGR-SL, under varying water deficit conditions. See Table 1 for codes of the genotypes.
Agronomy 11 01934 g001
Figure 2. A “Which is best for what” vector view of genotypes by physiological traits such as (a) Chl a, Chl b; (b) carotenoid, MSI; (c) leaf phenolic, leaf proline; and (d) RWC, leaf K+ accumulation, under varying water deficit conditions. See Table 1 for codes of the genotypes.
Agronomy 11 01934 g002
Table 1. Quinoa genotypes and their origin.
Code No.Accession No.Plant NameOrigin
1Ames 1372418GRUnited States, New Mexico
2Ames 1372649ALCUnited States, New Mexico
3Ames 1372923PUnited States, New Mexico
4Ames 1373142TESUnited States, New Mexico
5Ames 1373517GRUnited States, New Mexico
6Ames 13737V7United States, New Mexico
7Ames 137426PUnited States, New Mexico
8Ames 13744409United States, New Mexico
9Ames 13747APELAWABolivia
10Ames 13750A5PUnited States, New Mexico
11PI 433232-Chile
12PI 478414R-70Bolivia, La Paz
13PI 478415R-71Bolivia, La Paz
14PI 478418R-132Bolivia, Potosi
15PI 510536Quiona Negra (Spain)Peru
16PI 510549Yulaj K’oyto (Quechua)Peru
17PI 614880QQ065Chile, Los Lagos
18PI 614887QQ63Chile, Bio-Bio
19PI 614888QQ61Chile, Bio-Bio
20PI 665283Col.#6197United States, Colorado
Table 2. Physical and chemical characteristics of soil used in the study.
CharacteristicsUnitsValue
Sand%51.1
Silt%26.1
Clay%18.2
Textural class-Sandy clay loam
Saturation percentage%30.0
pH-7.6
ECdS m−11.31
Available phosphorous (olson)mg kg−13.31
Extractable potassium (NH4OAC)mg kg−181.0
Organic matter%0.72
Total nitrogen%0.07
Table 3. Mean square values (p < 0.05) for yield-related traits, growth, and physiological characteristics of quinoa genotypes under varying water-deficit conditions both in hydroponic and pot studies.
Hydroponic Study
SourceGWSLG * WSL
Degree of freedom19238
Seedling fresh weight (g)2.100 n.s.260.675 **1.956 n.s.
Seedling dry weight (g)1.7969 **43.9225 **0.3442 **
Root length (cm)83.17 **1655.57 **12.61 **
Shoot length (cm)36.343 **968.110 **9.193 n.s.
Relative growth rate of root length0.00121 **0.00093 **0.00038
Relative growth rate of shoot length0.00020 **0.00463 **0.00006 *
Chlorophyll a0.00099 *0.04190 **0.00029 n.s.
Chlorophyll b0.01063 **0.87907 **0.00187 n.s.
Carotenoid0.7644 **45.667 **0.275 **
Leaf phenolic0.00298 **0.16672 **0.00161 **
Leaf proline0.1579 **15.2162 **0.0455 **
Membrane stability index0.00019 **0.03517 **0.00009 **
Water use efficiency138.6 **25,152.4 **35.6 **
K+ in leaf267.63 **4667.54 **36.30 **
Pot Study
SourceGWSLGN * WSL
Degree of freedom19238
Plant height (cm)5.659 **433.068 ** 3.448 **
Panicle length (cm)1.927 **102.050 **0.310 n.s.
1000 grain weight (g)0.3159 **52.7254 **0.1827 *
Grain yield plant−1 (g)0.4065 **88.6783 **0.2133 **
Biological yield plant−1 (g)8.44 **1093.09 **4.51 n.s.
Drought tolerance index (DTI)0.06933 ***0.00024 n.s.0.00438 n.s.
G = genotypes, WSL = water stress level; * = significant (<0.05), ** = more significant (<0.01), *** = highly significant (<0.00), n.s. = non-significant.
Table 4. Yield parameters of quinoa genotypes under varying water deficit conditions.
GenotypePlant Height (cm)1000 Grain Weight (g)Grain Yield Plant−1 (g)
0%50%75%0%50%75%0%50%75%
Ames 13724 (1)14.33 b–f13.33 e–j9.00 q–t2.98 b–i2.73 e–m1.43 r–u4.39 d–k4.55 b–h2.62 qr
Ames 13726 (2)15.33 a–e13.33 e–j9.33 o–t2.91 c–j2.55 g–n1.41 r–u4.25 f–l4.07 h–m2.43 rs
Ames 13729 (3)14.00 c–g11.00 k–q8.00 r–t2.85 d–l2.08 n–q1.20 r–u4.37 e–k3.60 m–p2.22 r–t
Ames 13731 (4)14.00 c–g13.50 d–i10.17 l–r3.29 b–d2.48 i–n1.46 r–u4.81 b–e4.00 i–m2.48 rs
Ames 13735 (5)15.33 a–e13.17 e–k10.67 l–q3.11 b–e2.68 e–m1.52 r–u4.63 b–f4.20 f–l2.54 rs
Ames 13737 (6)15.67 a–d12.33 f–l10.33 l–q2.91 c–j2.75 e–l1.51 r–u4.43 c–i4.27 f–k2.53 rs
Ames 13742 (7)14.33 b–f11.17 j–q9.17 p–t3.10 b–f2.71 e–m1.43 r–u4.62 b–f4.23 f–l2.45 rs
Ames 13744 (8)14.00 c–g10.33 l–q7.83 st2.87 d–l1.58 q–t1.08 tu4.39 d–k3.10 pq1.85 t
Ames 13747 (9)15.33 a–e10.33 l–q9.17 p–t3.07 b–g2.36 l–n1.15 s–u4.59 b–g3.88 k–m2.10 r–t
Ames 13750 (10)15.33 a–e11.50 h–o9.67 n–t4.01 a2.15 n–p1.15 s–u5.53 a3.67 m–o2.10 r–t
PI 433232 (11)13.67 c–h11.67 h–n10.17 l–r3.42 bc2.21 m–o1.05 u4.94 bc3.73 l–n2.07 st
PI 478414 (12)14.67 b–e14.00 c–g10.50 l–q3.01 b–h2.35 l–n1.59 q–t4.53 b–h3.87 k–m2.61 qr
PI 478415 (13)17.00 a9.50 n–t7.67 st3.10 b–f1.72 o–r1.204.62 b–g3.24 n–p2.06 st
PI 478418 (14)14.00 c–g11.00 k–q9.83 m–s3.08 b–f2.21 m–o1.25 r–u4.60 b–g3.73 l–n2.29 r–t
PI 510536 (15)15.67 a–d9.67 n–t10.33 l–q3.38 b–d2.38 k–n1.24 r–u4.90 b–d3.90 j–m2.26 r–t
PI 510549 (16)15.83 a–c12.00 g–m10.50 l–q3.48 b2.58 f–n1.29 r–u5.00 b4.10 g–m2.31 r–t
PI 614880 (17)16.33 ab11.33 i–p11.00 k–q3.10 b–f2.40 j–n1.10 tu4.62 b–g3.92 i–m2.11 r–t
PI 614887 (18)15.33 a–e12.33 f–l12.00 g–m3.15 b–e2.52 h–n1.30 r–u4.67 b–f4.04 h–m2.26 r–t
PI 614888 (19)15.33 a–e11.67 h–n11.50 h–o3.20 b–e2.15 n–p1.11 tu4.72 b–f3.67 m–o2.13 r–t
PI 665283 (20)15.00 a–e9.83 m–s7.50 t2.90 c–k1.65 p–s1.01 u4.42 d–j3.17 o–p1.83 t
CVCsG * WSL = 2.1889G * WSL = 0.5234G * WSL = 0.5233
Table 5. Yield parameters of quinoa genotypes and drought tolerance index (DTI) based on seed yield under water deficit conditions.
GenotypePanicle Length (cm)Biological Yield Plant−1 (g)DTI
0%50%75%Mean0%50%75%Mean50%75%Mean
Ames 13724 (1)6.175.174.105.14 a–c19.8315.611.0015.5 a1.12 (T)1.13 (T)(T) 1.10 a–c
Ames 13726 (2)6.004.833.734.85 a–e17.3314.6710.5714.2 a–d0.97 (S)0.98 (S)(S) 0.97 b–e
Ames 13729 (3)6.334.002.834.38 ef17.0014.508.9013.5 d–f0.88 (S) 0.92 (S)(S) 0.90 d–f
Ames 13731 (4)6.175.504.005.22 ab16.8314.3310.4013.9 a–e1.07 (T)1.14 (T)(T) 1.10 a–c
Ames 13735 (5)6.335.004.005.11 a–d19.3316.0010.3315.2 ab1.09 (T)1.12 (T)(T) 1.10 a–c
Ames 13737 (6)6.335.834.175.44 a19.0015.8310.6715.2 a1.06 (T)1.07 (T)(T) 1.06 a–c
Ames 13742 (7)5.334.003.834.38 ef17.6715.6710.0014.4 a–e1.09 (T)1.08 (T)(T) 1.09 a–c
Ames 13744 (8)5.673.832.504.00 fg18.3312.676.3312.4 f0.76 (S) 0.77 (S)(S) 0.76 f
Ames 13747 (9)6.004.503.174.55 b–f19.5714.3310.1714.7 a1.00 (T)0.92 (S)(S) 0.95 c–e
Ames 13750 (10)5.504.173.174.27 e–g19.6714.338.7314.2 a–e1.13 (T)1.11 (T)(T) 1.12 ab
PI 433232 (11)6.334.503.174.66 b–f16.0016.078.7713.6 c–f1.03 (T)0.97 (S)(T) 1.00 a–e
PI 478414 (12)6.675.004.575.41 a17.3314.6710.3314.1 a–e0.98 (S)1.13 (T)(T) 1.05 a–c
PI 478415 (13)6.003.833.004.27 e–g18.2713.007.8313.0 d–f0.84 (S) 0.91 (S)(S) 0.86 ef
PI 478418 (14)6.334.833.334.83 a–e17.3315.109.8714.1 a–d0.96 (S)1.00 (T)(S) 0.97 b–e
PI 510536 (15)6.004.003.504.50 c–f18.1715.3310.0014.5 a–e1.07 (T)1.05 (T)(T) 1.06 a–c
PI 510549 (16)6.174.933.674.92 a–e18.3315.6710.3714.8 a–c1.15 (T)1.10 (T)(T) 1.12 a
PI 614880 (17)6.334.833.334.83 a–e16.3315.1710.4014.0 a–e1.01 (T)0.93 (S)(S) 0.96 c–e
PI 614887 (18)6.004.333.174.5 c–f18.3313.839.6313.9 a–e1.05 (T)1.00 (T)(T) 1.02 a–d
PI 614888 (19)5.834.333.174.44 d–f16.3311.679.6712.6 b–f0.97 (T)0.96 (S)(S) 0.96 c–e
PI 665283 (20)5.333.172.503.67 g18.6714.177.0713.3 ef0.78 (T)0.77 (S)(S) 0.77 f
Mean6.04 a4.53 b3.44 c 18.0 a12.7 b9.55 c 1.000.99
CVCsG = 0.6908
WSL = 0.2676
G = 1.8344
WSL = 0.7105
G = 0.1471
T = Tolerant, S = Sensitive
Table 6. Correlation among grain yield, seedling growth traits, and different physiological traits.
TraitsYield Traits Growth TraitsPhysiological Traits
GYBYPL1000 WtRLSLSFWSDWK+RWCMSIChl aChl bChl cPhenolProline
BY0.80 ***
PL0.80 ***0.77 **
1000 Wt0.980.800.80
RL0.72 **0.77 **0.67 **0.71 **
SL0.65 **0.68 **0.63 **0.65 **0.66 **
SFW0.68 **0.66 **0.60 **0.60 **0.68 **0.65 **
SDW0.66 **0.69 **0.67 **0.63 **0.64 **0.67 **0.64 **
K+0.74 **0.74 **0.73 **0.73 **0.68 **0.60 **0.59 **0.63 **
RWC0.90 ***0.73 **0.78 **0.87 ***0.71 **0.65 **0.71 **0.66 **0.76 **
MSI0.83 ***0.81 ***0.80 ***0.83 ***0.71 **0.70 **0.76 **0.74 **0.73 **0.86 ***
Chl a0.64 **0.63 **0.62 **0.63 **0.51 **0.46 *0.43 *0.57 **0.65 **0.71 **0.63 **
Chl b0.82 ***0.77 **0.75 **0.81 ***0.68 **0.58 **0.61 **0.64 **0.76 **0.86 ***0.82 ***0.83 ***
Chl c0.83 ***0.73 **0.75 **0.57 **0.62 **0.57 **0.63 **0.66 **0.71 **0.85 ***0.77 **0.71 **0.83 ***
Phenol0.64 **0.61 **0.53 **0.63 **0.51 **0.52 **0.56 **0.53 **0.48 *0.65 **0.68 **0.51 **0.63 **0.55 **
Proline0.78 **0.72 **0.66 **0.78 **0.64 **0.63 **0.68 **0.68 **0.57 **0.78 **0.82 ***0.52 **0.73 **0.66 **0.82 ***
DTI0.99 ***0.74 **0.66 **0.98 ***0.70 **0.58 **0.60 **0.59 **0.52 **0.580.21 *0.42 *0.51 **0.58 **0.69 **0.71 **
*** High correlations (values between 0.8 and 1). ** Moderate correlations (values between 0.5 and 0.7). * Low or uncorrelated correlations (values less than 0.4). Grain yield (GY), biological yield (BY), panicle length (PL), 1000 grain weight (1000 Wt), shoot length (SL), root length (RL), shoot fresh weight (SFW), root fresh weight (RFW), leaf potassium accumulation (K+), relative water content (RWC), membrane stability index (MSI), chlorophyll content a (Chl a), chlorophyll content b (Chl b), carotenoid (Chl c), and drought tolerance index (DTI).
Publisher’s Note: MDPI stays neutral with regard to jurisdictional claims in published maps and institutional affiliations.

