Article

Yield Stability and Genotype Environment Interaction of Water Deficit Stress Tolerant Mung Bean (Vigna radiata L. Wilczak) Genotypes of Bangladesh

by
Mohammad Rafiqul Islam
1,
Bikash Chandra Sarker
2,
Mohammad Ashraful Alam
3,
Talha Javed
4,5,
Mohammad Jahangir Alam
6,
Mohammad Shahin Uz Zaman
6,
Mohammad Golam Azam
6,
Rubab Shabbir
4,7,
Ali Raza
8,
Muhammad Habib-ur-Rahman
9,10,
Eldessoky S. Dessoky
11 and
Mohammad Sohidul Islam
12,*
1
Agronomy Division, Regional Agricultural Research Station, BARI, Ishwardi, Pabna 6620, Bangladesh
2
Department of Agricultural Chemistry, Hajee Mohammad Danesh Science and Technology University, Dinajpur 5200, Bangladesh
3
Plant Breeding Division, Spices Research Centre, BARI, Bogura 5810, Bangladesh
4
College of Agriculture, Fujian Agriculture and Forestry University, Fuzhou 350002, China
5
Department of Agronomy, University of Agriculture Faisalabad, Faisalabad 38040, Pakistan
6
Plant Breeding Division, Pulses Research Centre, BARI, Ishwardi, Pabna 6620, Bangladesh
7
Seed Science and Technology, University of Agriculture Faisalabad, Faisalabad 38040, Pakistan
8
Fujian Provincial Key Laboratory of Crop Molecular and Cell Biology, Oil Crops Research Institute, Center of Legume Crop Genetics and Systems Biology/College of Agriculture, Fujian Agriculture and Forestry University (FAFU), Fuzhou 350002, China
9
Institute of Crop Science and Resource Conservation (INRES), Crop Science, University of Bonn, 53115 Bonn, Germany
10
Department of Agronomy, MNS-University of Agriculture, Multan 60000, Pakistan
11
Department of Biology, College of Sciene, Taif University, P.O. Box 11099, Taif 21944, Saudi Arabia
12
Department of Agronomy, Hajee Mohammad Danesh Science and Technology University, Dinajpur 5200, Bangladesh
*
Author to whom correspondence should be addressed.
Submission received: 7 September 2021 / Revised: 16 October 2021 / Accepted: 20 October 2021 / Published: 25 October 2021
(This article belongs to the Special Issue Molecular Genetic Improvement of Crop Drought Tolerance)

Abstract

:
Water deficit stress is a critical abiotic constraint to mung bean production that affects plant growth and development and finally reduces crop yield. Therefore, a field experiment was conducted at five diverse environments using four water stress-tolerant genotypes, namely BARI Mung-8, BMX-08010-2, BMX-010015, and BMX-08009-7, along with two popular cultivated varieties (check) of BARI Mung-6 and BARI Mung-7 to evaluate more stable tolerant genotypes across the country. Stability analysis was performed based on the grain yield. The combined analysis of variance showed significant variations among genotypes, environments, and their interactions. The AMMI analysis of variance indicated that genotype accounted for 91% of the total sum of squares for grain yield, followed by genotype × environment interaction (5%), and environment (4%). Partitioning of interaction indicated that the first three interaction principal components (IPCA1–IPCA3) were highly significant (p ≤ 0.01). Using these significant IPCAs, AMMI stability parameters and non-parameter indices BMX-010015 was found stable across the environment based on yield traits and grain yield. The BMX-08010-2 genotype also showed significant regression coefficient (bi) more than unity, and non-significant deviation from regression (S2di) values, indicating suitable for a favorable environment considering grain yield. So, based on the stability analysis (Eberhart and Russell), additive main effects, and multiplicative interactions (AMMI) analysis, the BMX-010015 and BMX-08010-2 could be suitable for having tolerance to water deficit stress.

1. Introduction

Mung bean (Vigna radiata L. Wilczak) is one of the important pulse crops in Bangladesh due to its short duration, adaptation to various cropping systems, because it increases tenant farmers’ income, and improves soil fertility by fixing atmospheric nitrogen through nodulation in roots [1]. Despite its colossal significance, the area and production of mung bean are declining due to several abiotic and biotic constraints, poor crop management practices, and the non-availability of quality seeds of improved varieties to farmers [2]. Abiotic stresses affecting mung bean production include drought, heat, waterlogging, and salinity. Drought and salinity stress are more prominent that affect the growth and productivity of crops [3] by producing reactive oxygen species (ROS) [4], and osmotic stress [5] that ultimately causes oxidative damage in plant cells [6]. Osmotic stress leads to many physiological changes, including membrane, DNA, and protein damages, decreased photosynthetic activities [7], and nutrient imbalance in plants [8,9]. However, to cope with stresses, plants have evolved both enzymatic antioxidant such as superoxide dismutase (SOD), catalase (CAT), and guaiacol peroxidase (GOPX) [6], and non-enzymatic antioxidants, such as tocopherols [10], betalain [11], ascorbic acids [12], carotenoids [13], betacyanin [14], betaxanthin [15], chlorophyll a [16,17], chlorophyll b [18], beta-carotene [19], phenolic and flavonoids such as hydroxybenzoic acids [20], hydroxycinnamic acids [21], flavanols [22], flavonols [23], flavones [24], flavanones [25], with high radical quenching capacity [26]. Abiotic stress-induced plant evolved mechanisms to enhance the concentration of these antioxidants [27], and detoxify the ROS. Various biotic and abiotic factors are responsible for the low yield of mung beans. Among the abiotic stresses, water scarcity stands prominent during Kharif-I subjected to the summer season (16 March to 30 June) due to less precipitation coupled with high temperature. A prolonged dry period with a high temperature significantly reduces the seed yield of grain legumes. The use of water deficit stress-tolerant genotypes could be the best and the cheapest method to manage the stress. However, drought stress is one of the main stresses that assigns 26% of the whole stresses to itself [28]. It was noticed that water scarcity alone causes 70% of agricultural yield loss globally [29]. Mung bean is a water stress-sensitive crop, and a 40–60% grain yield reduction due to water deficit stress is very common [30]. With that point of view, few drought-tolerant mung bean genotypes viz., BARI Mung-8, BMX-08010-2, BMX-010015, and BMX-08009-7 had been identified [31], but the performance of yield and stability across locations are still unexplored. Thus, identifying genotype-environment interaction (GEI) in specific or broad environments is essential to evaluate the yield performance of different mung bean genotypes accurately. In addition, it is required to assess crop genotypes at diverse locations to evaluate their performance for more site-specific management due to changing climate [32].
Yield is a complex quantitative characteristic controlled by multiple genes, influenced by genotype, its environment, and genotype × environment (GE) interactions [1]. A variety or genotype is considered to be more adaptive and stable if it gives a high mean yield with a low degree of fluctuation in yields when grown over diverse environments [33]. Thus, the GEI is a demanding issue for plant breeders and plays a major role in developing improved varieties [32]. In any crop improvement program, the stable performance of genotypes is an important task [27,28]. Fluctuation in genotypic performance across the environments resulted from significant GE interaction and affects breeding programs [34]. Evaluating crop performance across the environments is immensely important in selecting high-yielding and stable genotypes [35,36]. Crops yielding ability and stable performances over the environments are important in identifying genotypes for a wide range of environments [37]. There are several methods employed worldwide to identify stable genotypes [37,38,39,40]. The joint regression [41], and Additive Main effect and Multiplicative Interaction (AMMI) [42] models have been employed successfully in different crops to study stability parameters. Several studies were conducted earlier on G × E interactions on different traits of mung bean, but the information of G × E in water deficit stress-tolerant of mung bean was not available. Hence, this study had been the pioneer report from Bangladesh. Therefore, the present investigation was carried out to find out the more stable tolerant mung bean genotypes based on yield stability across environments using joint regression [41] and AMMI [42] model. These findings might be helpful for both breeders and farmers to choose appropriate genotypes for sustainable mung bean production.

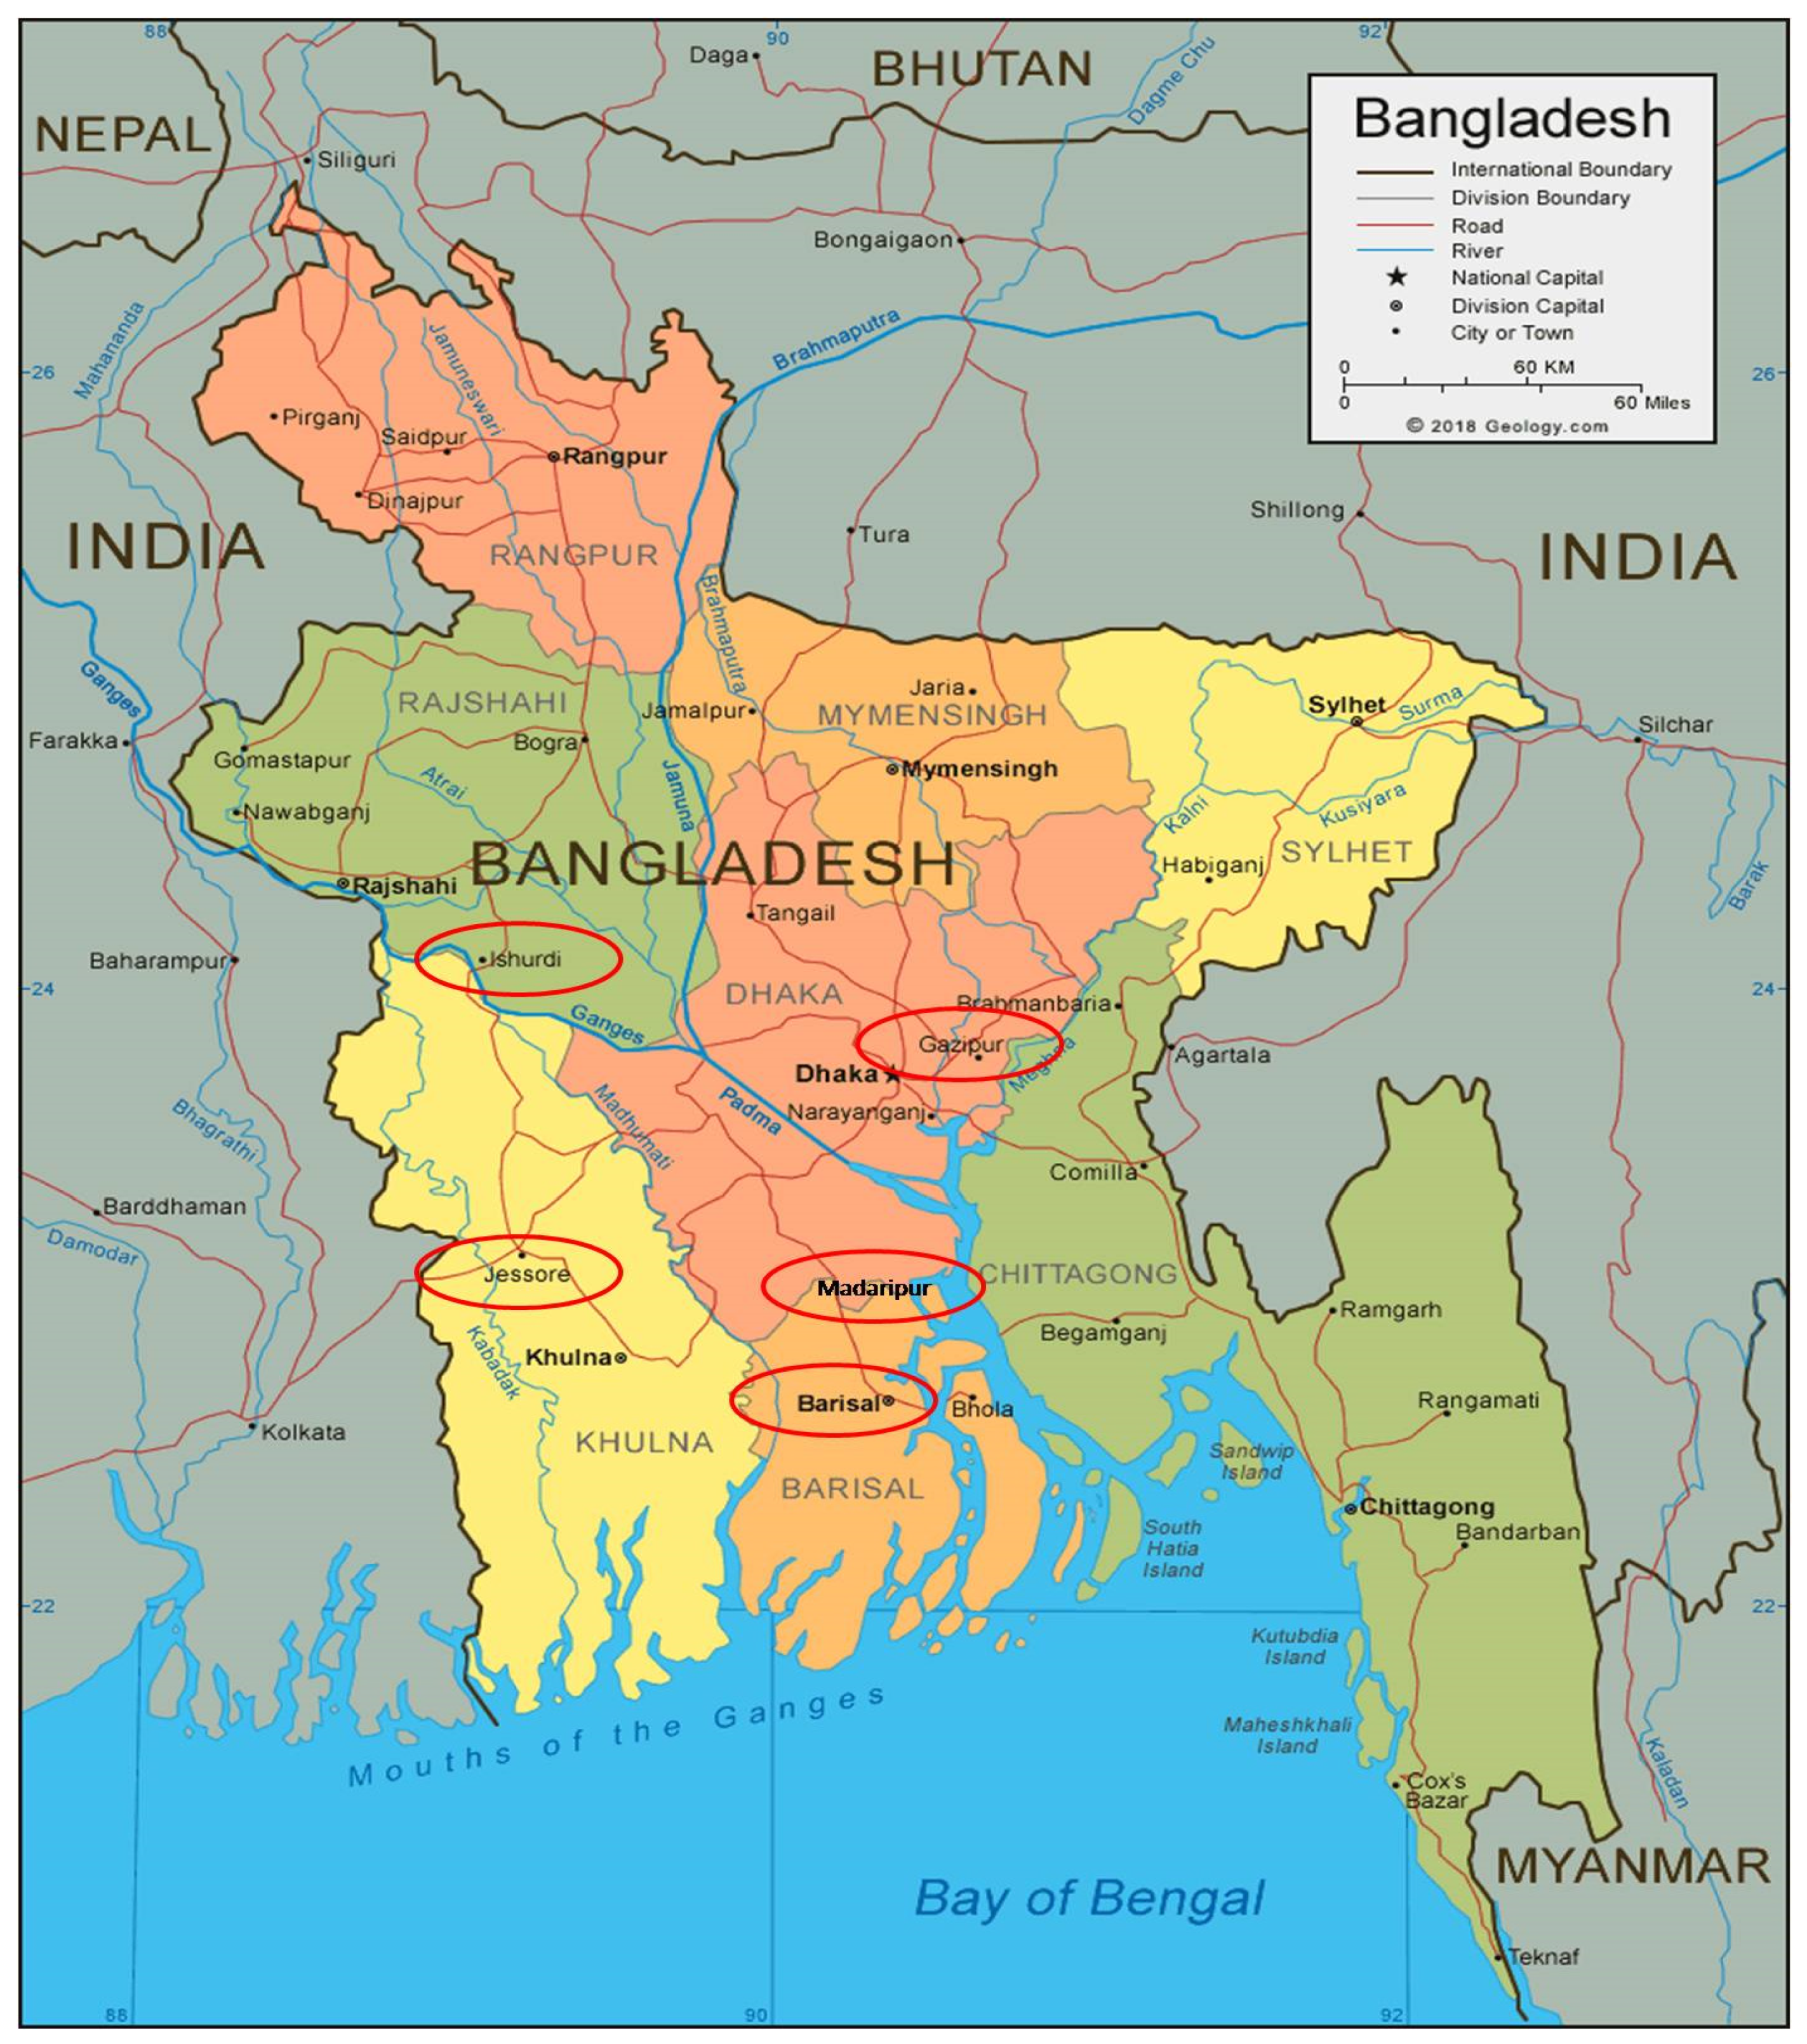
2. Materials and Methods

The four most water deficit stress-tolerant genotypes, namely BARI Mung-8, BMX-08010-2, BMX-010015, and BMX-08009-7 had been identified in the previous study [31] based on the germination and seedling growth traits under polyethylene glycol (PEG 6000) induced stresses. The description of the experimental materials used in that study has been presented in Table 1. To assess the performances of these selected genotypes across the environments, the present study was designed with two promising cultivated varieties BARI Mung-6 and BARI Mung-7 (popular cultivated varieties in Bangladesh) evaluated at five different environments of Bangladesh viz., Ishurdi, Gazipur, Barishal, Madaripur, and Jashore during Kharif-I season, 2019. The locations varied significantly in their climate, altitude from the sea level, geographical position, and soil texture (Table 2). The exact location is presented in Figure 1. The experiment was laid out in a Randomized Complete Block (RCB) design with three replications and spacing of 40 cm between rows with continuous seeding. Each entry was sown in 4 rows of 4 m long plot. The spacing between the two plots was 50 cm. The crop was fertilized with 20-17-18-10-2 kg of N-P-K-S-B ha−1 in the form of urea, triple superphosphate, muriate of potash, gypsum, and boric acid, respectively [43]. All the fertilizers were applied during the final land preparation and thoroughly mixed with soil. The date of the sowing ranged from 13 February 2019 to 26 March 2019 at a different location. Seeds were sown in the rows carefully by hands at 3 cm depth and then covered with soil. Post-sowing irrigation was given to ensure seed germination. After seedling establishment (20 days after sowing: DAS), mung bean plants were thinned out for keeping plant to plant distance of 6–7 cm. Other management practices prevailing with the local requirements were done at each site. Each of the genotypes was investigated from seedling to harvest, and compared with check varieties. Depending on the different locations and genotypes, the crop was harvested two times, the first pickings were done at 60–70 DAS, and the second was made in 70–85 DAS, respectively. From each plot, 10 plants were selected randomly to compute data. Data on different parameters, e.g., days to flowering, days to maturity, pods plant−1, 100-grain weight were recorded from those selected 10 plants of each unit plot. Grain yield data were recorded from the whole plot and converted into kg ha−1.

Statistical Analysis

Data were analyzed by using MS Excel and the R platform [44]. Analysis of variance was performed from the mean data of all environments to track out the appearance of GEI and to allocate the deviation due to genotype, environment, and genotype × environment interaction. Stability analysis was carried out to estimate different parameters based on the AMMI model [38] using GEA-R (version 2.0), a statistical program that used the R platform. Stability analysis provided a common outline of the response patterns of the genotypes to environmental change [32]. AMMI stability value (ASV) was estimated to quantify the genotypes based on their yield stability [45]. The AMMI model can be written as
Y ij = μ + G i + E j + k = 1 n λ k α i k γ j k + θ i j
where Yij was the yield of the ith genotype in the jth environment, Gi was the ith genotype mean deviation, Ej was the jth environment mean deviation, λk was the square root of the eigenvalue of the PCA axis k, αik and γjk are the principal component scores for PCA axis k of the ith genotype and the jth environment, respectively, and Өij was residual, n is the number of PCA axes retained in the model.
Significance test for PCA axes had been attained by following the method [46].
The ASV described by [45] was calculated as follows:
AMMI   stability   value   ( ASV )   = [ ( SS IPCA 1 ) ( SS IPCA 2 ) × ( IPCA 1 score ) ] 2 + [ IPCA 2 score ] 2
where SS (IPCA1)/SS (IPCA2) was the weight given to the IPCA1 value by dividing the IPCA1 sum of squares by the IPCA2 sum of squares. The higher the IPCA score, either negative or positive, the more specifically adapted a genotype to certain environments. Lower ASV scores indicated a more stable genotype across the environments.
The parameters of stability indices like regression coefficient (bi), deviation from regression (S2di), and phenotypic index (Pi) were calculated according to methods described by Eberhart and Russel [41]. The equation has been given below:
bi = [YijIj/I2]
where Ij is the sum of the product of environmental index (Ij) with the corresponding mean of that genotype of each environment. The phenotypic index may be used to determine a genotype’s superiority (Pi). The better genotype is the one with a less Pi value, which remained among the most productive in a given set of locations.
S 2 di = [   j δ 2 ij / ( e 2 ) S 2 e / r ]
where, S2e = estimated pooled error, and r = number of replication
δ 2 ij = [ δ 2 vi bi   YijIj ]  
which is the variance of the mean over different environments with regard to individual genotypes.
Pi = Y ¯ i Y ¯
where, Y ¯ i = mean of the ith genotype over the environment, Y ¯ = overall mean
Significance of differences among bi value and unity was tested by t-test, between S2di and zero by F-test. The environmental index (Ij) is defined as the deviation of the mean of all the genotypes at a given environment from the overall mean. An environmental index can be calculated to determine which environmental factors contribute to poor, fair, or ideal growth conditions. The environmental index reflects the adequacy of an environment to exhibit a specific characteristic. The positive and negative environmental indices (Ij) indicate the characteristics of favorable and unfavorable environments, respectively. A positive environmental index indicates the increased grain yield, whereas a negative index indicates the decreased grain yield.

3. Results and Discussion

3.1. Chemical Properties of the Initial Soil of Five Studied Locations

The initial soil analysis reports of five studied locations are given in Table 3. The soil pH showed above 7 in Ishurdi, Jashore, and Madaripur locations, whereas the pH of 6.8 and 6.25 were obtained in Barishal and Gazipur locations, respectively. The organic matter content (%) of more than 1 was observed in all the sites except for Barishal (0.92%). The status of total N was very low at all locations, and that was below the critical level (CL). The amount of K was above the CL in Ishurdi, Jashore, and Madaripur locations, and it was below the CL in Barishal and Gazipur locations. The P content was above the CLat all the locations except for Gazipur. The amount of S was above the CL at all locations. Based on the CL, the Zn content was above the CL in Ishurdi and Madaripur locations. Gazipur site showed the Zn level below the CL, whereas the other two sites showed the Zn content up to the mark of the CL. The B content was just below the CL in Jashore, Madaripur, and Gazipur. Besides this, a higher amount of B over the CL was observed at the other two locations.

3.2. Variation in Phenology as Influenced by Different Environments

There was significant variation among the entries regarding days to flower and days to maturity (Table 4 and Table 5, respectively). The environmental and genotypic means for the days to flowering ranged from 37.83 to 41.17, and 37.00 to 43.00, respectively. The genotypes BARI Mung-8 and BMX-08010-2 flowered earlier than the two checks varieties over the location, showing the lowest phenotypic index (Pi) based on genotype mean (Table 4). The Ishurdi location holds the poor environment index (Ij), while Gazipur was the rich one indicating that the environment of Ishurdi location might have forced the plants to enter the reproductive phase earlier. Consequently, when days to maturity were considered, the genotype BARI Mung-6 took the minimum days to reach maturity, while the genotype BMX-08009-7 took a little bit longer time (Table 5). The maximum Ij was recorded in Barishal and the minimum in Madaripur, indicating that Madaripur location provided the most suitable environment for days to maturity, followed by Ishurdi location. The genotypes BARI Mung-6, BARI Mung-7, and BARI Mung-8 exhibited a negative Pi, while other genotypes showed positive pi value. Stability parameters ‘bi’ and ‘S2di’ were estimated for the studied traits following Eberhart and Russell model [41]. Regression coefficient ‘bi’ was used to consider identifying stable genotypes [47]. A genotype with a ‘bi’ of <1.0 value has shown above-average stability and is adapted simply to low-performing environments. On the other hand, a cultivar with a ‘bi’ value of >1.0 shows below-average stability and is adapted easily to high-performing environments. Likewise, a cultivar with ‘bi’ value of equal to 1.0 has the average stability and is well or poorly adapted to all environments depending on having a high or low mean performance, respectively [47]. According to Eberhart and Russel [41], the genotype is expressed as stable when it is shown the regression co-efficient of unity (bi = 1), and a non-significant or minimum deviation from the regression (S2di = 0). In relation to days to flowering and maturity, the germplasm BMX-010015 gave a significant bi value closer to unity, and a non-significant S2di, indicating a greater adaptation to all the locations/environments. Other genotypes showed a significant value of bi and S2di, indicating they cannot be addressed as stable following those parameters.

3.3. Environmental Impact on Yield Attributing Traits

The number of pods plant−1 varied significantly in all the locations (Table 6). From the mean values of the locations, the highest mean value for the number of pods plant−1 was recorded in the BMX 08010-2 genotype followed by the BARI Mung-6. The environment of the Madaripur location was the favorable one which showed the highest Pi, while Brishal possessed the lowest value. The genotypes BMX-08009-7 had a positive Pi, a non-significant bi, and S2di values, indicating that this genotype was stable over the tested locations for the pods plant−1. The genotype BARI Mung-6 showed the positive Pi values along with significant bi (<1), and non-significant S2di values, indicating this genotype is suitable for the poor environment. Two genotypes namely BARI Mung-8 and BARI Mung-7 had negative Pi, a non-significant bi, and significant S2di values designating as unstable genotypes across the environments. However, the genotypes BMX-010015 and BMX-08010-2 having significant bi and S2di values for the number of pods plant−1 suggested that it may be acceptable for the adverse environment.
In the case of the 100-grain weight, BARI Mung-7 showed the maximum grain weight at Ishurdi, Gazipur, Barishal, and Madaripur (Table 7). Besides, considering mean values, it also exhibits the highest 100-grain weight compared to all genotypes and locations. The Barishal location showed the negative Ij, while Madaripur was at the higher end. The genotype BMX-010015 displayed a negative Pi with a significant bi (>1), and non-significant S2di value, indicating that this genotype performs better for the 100-grain weight under a favorable environment. Two genotypes BARI Mung-6 and BARI Mung-8 showed positive and negative pi, respectively, and non-significant S2di values with significant bi (<1), indicating these genotypes were stable in a poor environment.

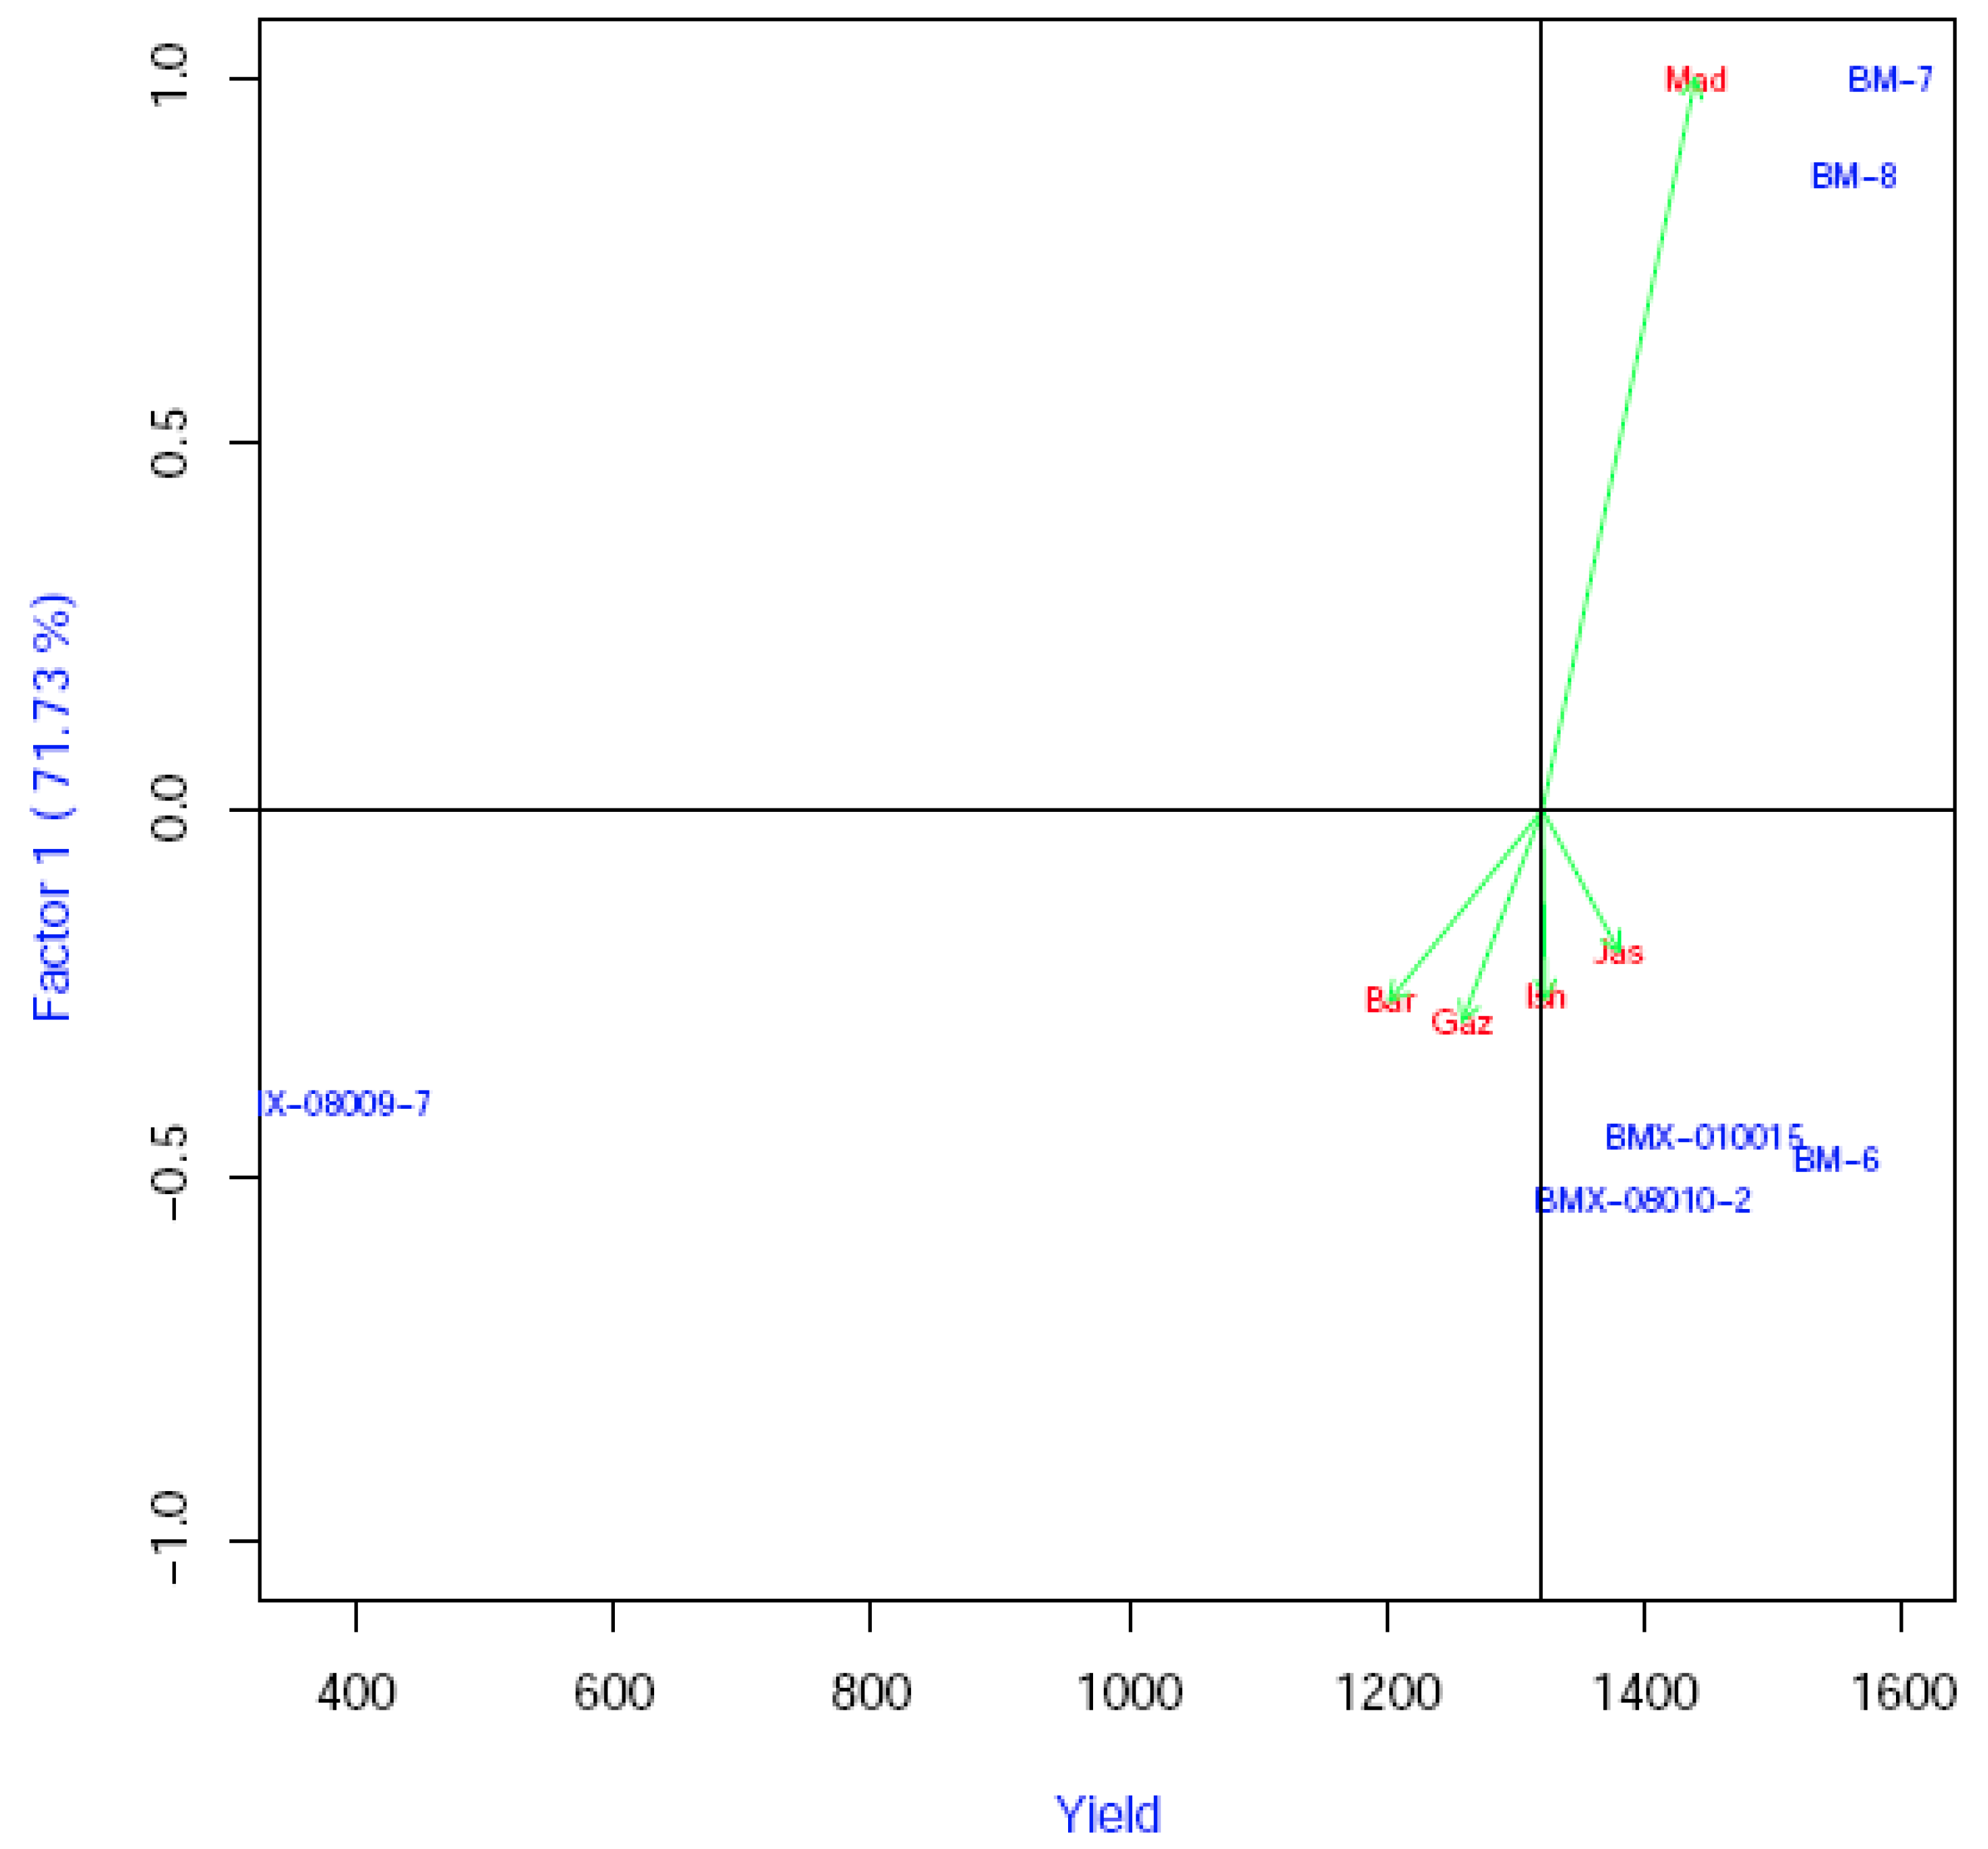
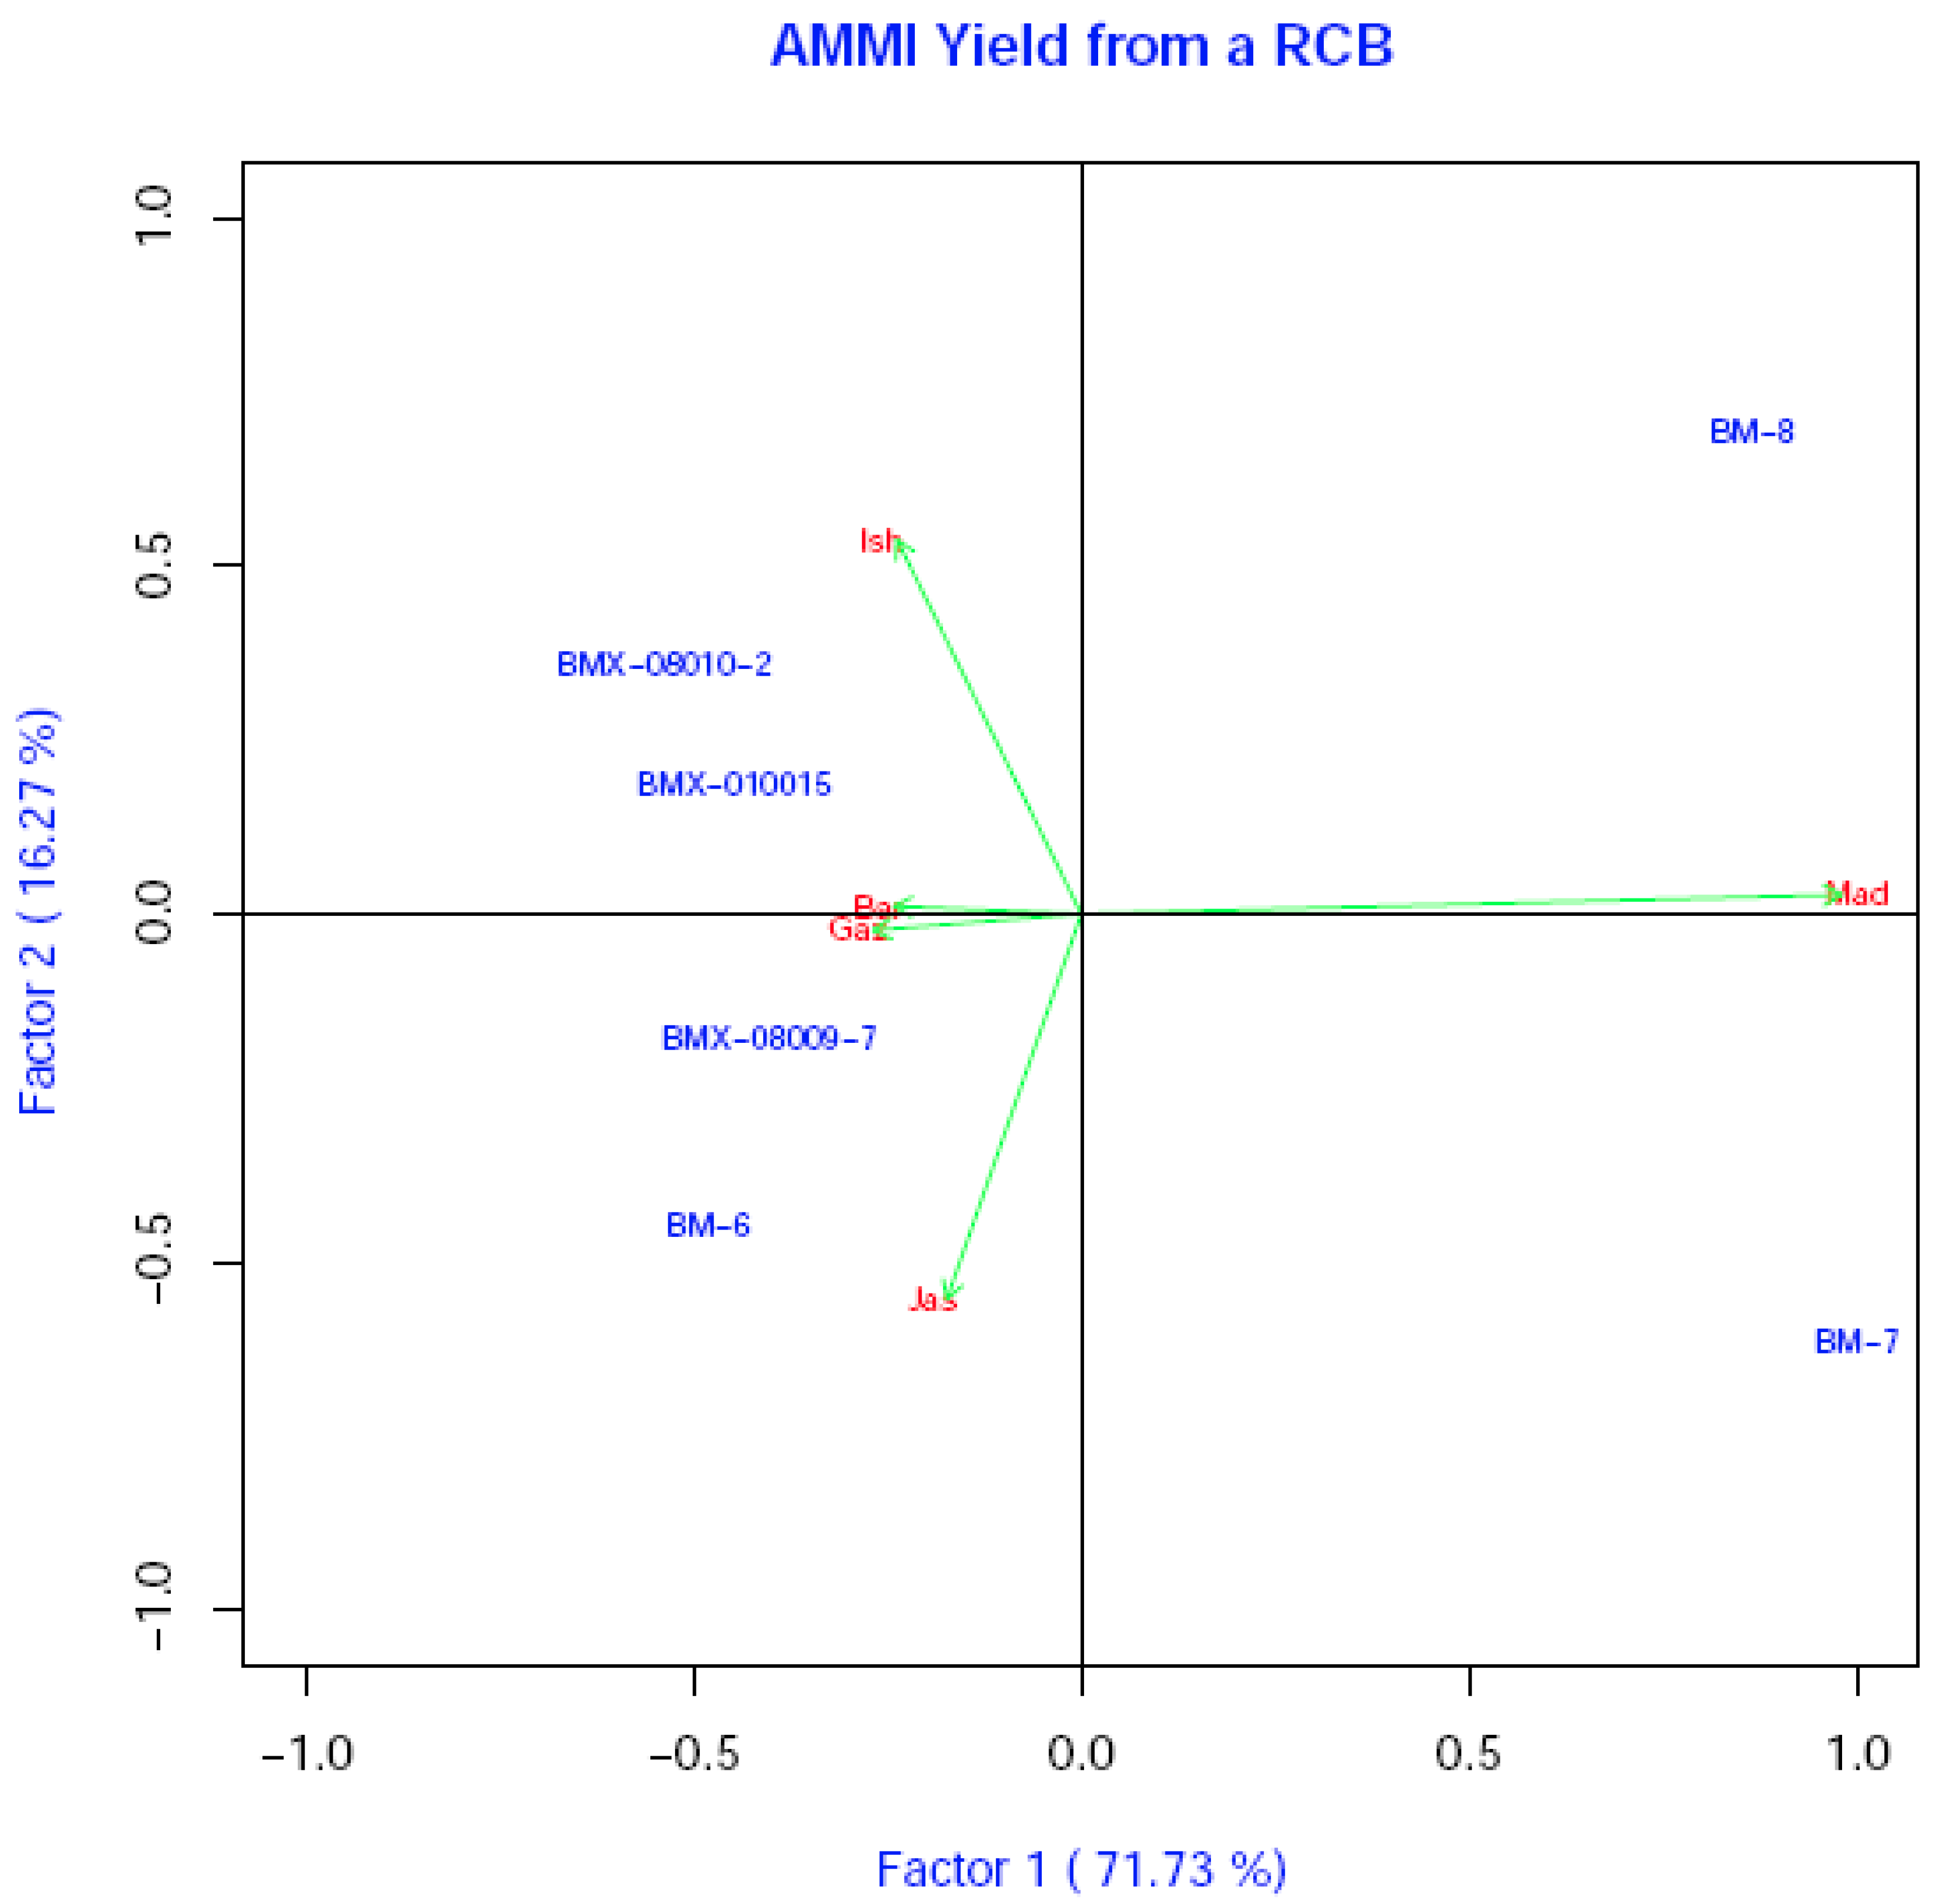
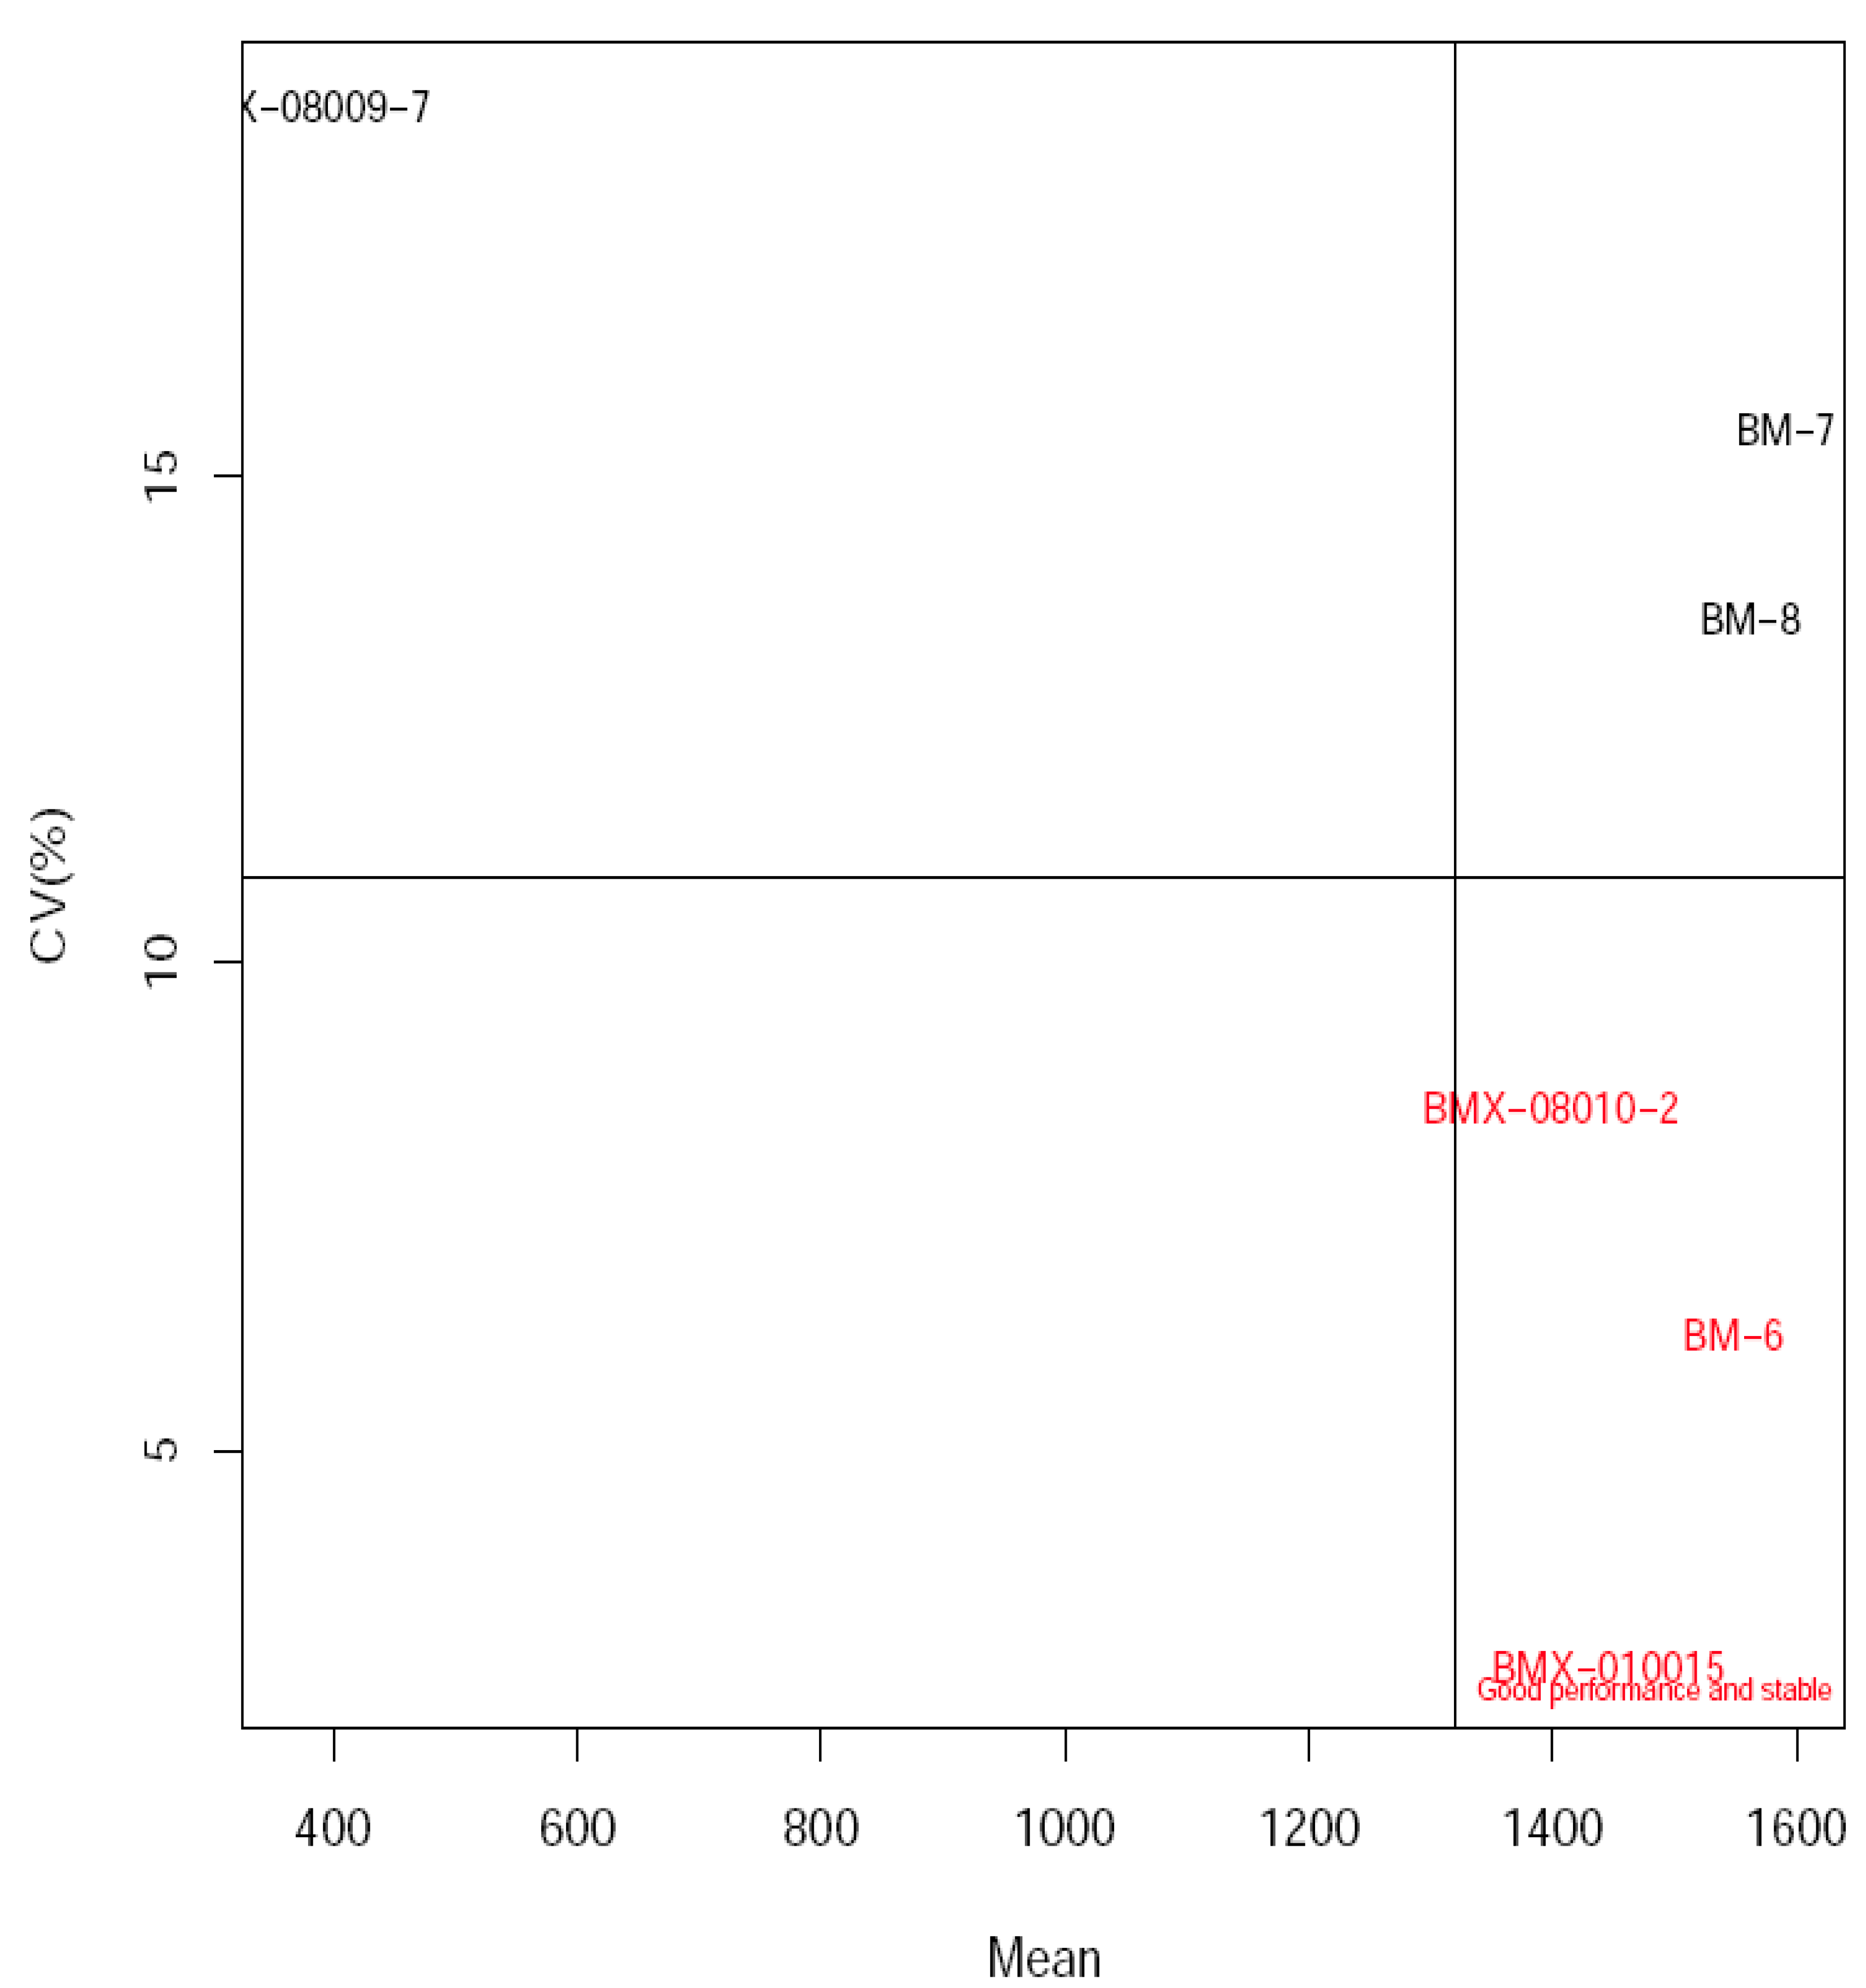
3.4. Estimation of Grain Yield Stability and Genotype Environment Interaction

The grain yield data were subjected to stability analysis following the AMMI model to study the performance of the genotypes across the environments. The analysis of variance (AMMI model) revealed that genotypes (G), environments (E), and G × E were significantly (p ≤ 0.01) varied (Table 8). The significant G × E interaction suggests that the grain yield of genotypes varied across the environments and also reflected the existence of environmental effects in the GE interaction. This furthermore showed that the genotypes were not only genetically variable, but some of them also have different responses to variable environments [48]. Similar findings were also found in mung bean wherein a significant variation among the genotypes, environments, and the GEI for the grain yield [49,50,51]. The highest portion (91.03%) of the treatment sum of the square was explained by the genotypic effects, while the least variation was explained by environmental effects (3.53%). The interaction effect is explained by 5.44% of the total grain yield variation. This was an indication that the genotypic influence was a major factor for the yield performance of the mung bean. The sum of squares of the genotypes was larger than that of G × E, which determined differences in genotypic response across the environments. In the earlier study reported significant GEI for the grain yield of mung bean genotypes evaluated under different environments [49]. The interaction term was further partitioned into AMMI interaction principle components, and four terms of AMMI were extracted from the decomposition of GEI by this method, where the first three AMMI components were found significant following F-statistics. The first two AMMI interaction PCs explained 88% of the total interaction effect, of which 71.74 and 16.27% were explained by PC1 and PC2, respectively (Table 8). The significance of G × E interaction for the grain yield, the use of AMMI analysis was effective for selecting promising genotypes for specific locations or environmental conditions [52,53,54,55].
The grain yield of the studied genotypes varied from one location to another (Table 9). It might be due to the existence of significant GEI. The mean values for grain yield varied from 375.20 to 1591.71 kg ha−1 among the genotypes. The highest mean yield was recorded from the BARI Mung-7 followed by the BARI Mung-8, but those were region-centric (Figure 2), and the lowest mean value for the grain yield was obtained from BMX-08009-7. This variation might be due to the genetic potential of the genotypes. No advanced lines (water stress-tolerant) out yielded over the check varieties considering locations, but the genotypes BMX-010015 and BMX 08010-2 contributed considerable grain yield. Concerning the environments, the Madaripur location was a relatively better mung bean growing area, showing an average grain yield of 1439.16 kg ha−1 followed by the Jashore (1379.83 kg ha−1) location. The least average grain yield (1201.72 kg ha−1) was found at the Barishal location.
Among the tested entries, the performance of the genotypes for stability parameters was presented in Table 9. In entire the genotypes, the positive Pi reflected higher grain yield, while the negative Pi reflected lower yield. The highest Pi was recorded in the BARI Mung-7 genotype followed by BARI Mung-8. Madaripur showed the highest Ij followed by Jashore and Ishurdi. The BMX-010015 genotype displayed the positive Pi with non-significant bi (closer to unity) and S2di values, demonstrating stability in all tested environments. Besides, the genotype BMX-08010-2 displayed the positive Pi with a significant bi (>1), and non-significant S2di values, representing a better performance of this genotype in a favorable environment. The remaining genotypes showed the significant bi and S2di values for the grain yield indicating unstable over the tested location. The ASV was estimated for the studied genotypes, and the lowest ASV showing genotypes were considered as the most stable ones. The ASV was the distance from the origin (0, 0) of the biplot graph of the IPCA1 scores against the IPCA2 scores [45]. The calculated ASV varied from 1.78 to 4.45 (Table 9). The higher ASV value reflected that the BARI Mung-7 and BARI Mung-8 had a higher value, and they were not suitable across the environments. These two genotypes could produce more grain yield in favorable environments under high input conditions. The genotypes BMX-010015 and BMX-08010-2 showed low ASV values with considerable grain yield having good stability performance across the environments. In an earlier study reported that the genotypes with a high ‘bi’ value indicated better responsiveness to a favorable environment, whereas the genotypes with a low ‘bi’ value indicated the genotype suited to a poor environment [56]. Based on the yield stability index (Table 9), the BMX-08010-2 genotype performed better with a CV value of 8.51%. Results displayed that only stability cannot be the basis for screening and selection of genotypes to release, as some genotypes were stable for poor grain yield across environments [57], and selecting them would cause the development of a genotype that was consistently the least grain yielding.
The AMMI biplot was produced by portraying the first multiplicative term against the grain yield representing a clear picture of the grain yield variation as explained through GE interaction. In AMMI 1 biplot, the IPCA 1 scores of genotypes and environments were plotted against their respective means for the grain yield. The genotypes and environments became high grain yielding as they become far away to the right side of the ordinate, and they become low yielding as they become far away to the left side of the ordinate [58]. In the present study, the AMMI 1 plot represented that the environment of the Madaripur (Mad) location was the highest yielding environment, while Barishal (Bar) location was the least performing one (Figure 2). Accordingly, BARI Mung-7, which is situated far away to the right side of the ordinate, was the high yielding genotype. Besides this, the genotype BMX-08009-7, which was situated far away to the left side of the ordinate, was the low grain yielding genotype (Figure 2 and Table 9).
AMMI 2 biplot represents the stability of environments and genotypes and also is used to illustrate the magnitude of G × E. In AMMI 2 biplot, the IPCA 1 and IPCA 2 scores of genotypes and environments were plotted against each other. Under the study, the IPCA I component accounted for 71.73% of G x E interaction, while the IPCA 2 accounted for 16.27%. The plot also clearly showed that the genotypes BMX-010015 and BMX-08010-2 were closer to the center than the higher grain yielding ones. The genotype BMX-08009-7 was the closest to the center and low grain yielding but was not a suitable one. The genotypes BARI Mung-7 and BARI Mung-8 were region-centric and confirmed the earlier assumption (Figure 3). The genotypes near the center indicated minimal interaction with environments, and away from the origin in the biplot, indicating that the genotypes were more sensitive to the environmental effects [56]. Our results indicated that the genotypes BMX-010015 and BMX-08010-2 were moderate grain yielding genotypes, and obsessed wide adaptation to tested environments, whereas the genotypes BARI Mung-7 and BARI Mung-8 were high grain yielding and well adapted to specific environments.
In Figure 4, the CV (%) of each genotype was portrayed against the genotypes’ mean grain yield. From the figure, it was clear that the genotypes BARI Mung-6, BMX-010015, and BMX-08010-2 were performed well and were stable, and they were suitable across the cultivated locations (CV = 4–1010%). However, the genotype BMX-010015 exhibited more stability showing a CV (%) of below 5. On the contrary, the genotypes BMX-08009-7, BARI Mung-7, and BARI Mung-8 showed un-stability due to high variability (CV > 10%) as compared to other genotypes. The CV was classified as low variability (CV = 5% or less), moderate variability (CV = 5–10%) and the highest variability for the value of greater than this [59].
The GGE biplot (“which-won-where”) is the most effective tool for mega-environment analysis in a variety of trials [60]. It quantifies the G × E interaction and provides a meaningful interpretation of multi-environmental trial data [49]. The application of GGE biplot to the mung bean multi-environmental yield trial facilitated the visual comparison and identification of the winning genotype concerning the tested environments. GGE biplot also represents both genotype main effects and genotype × environment interaction effects, which were two important sources of variations relevant to genotype evaluation [36]. GGE biplot is used for the yield data by using the graphical display of the G × E pattern with many advantages. The grain yield of each cultivar in a tested environment is a result of the main genotypic effect, main environmental effect, and genotype × environment interaction in biplot analysis [57]. In the present study, Figure 5 shows the mega-environments and includes genotypes and top-performing ones in each mega-environment. Four sector mega-environments were found from the results, and five studied environments only fall within two mega-environments. It was revealed that two more probable mega-environments were not utilized. Ishurdi, Jashore, Barishal, and Gazipur fall in one mega-environment and Madaripur alone formed a mega-environment which was the highest grain yielding mega-environment. In this experiment, the PCs of the GGE model (two-axis) explained 98.81% of the variation in G + GE (Figure 5). Nevertheless, BARI Mung-7 and BARI Mung-8 genotypes were found better for Madaripur location and the genotype BARI Mung-7 was the topmost performing genotype. Conversely, the genotypes BMX-010015 and BARI Mung-6 were found suitable for the other four locations in which BARI Mung-6 was superior performing one to BMX-010015. The BMX-08010-2 genotype falls nearer to this mega-environment but falls in the other environment. On the other hand, the genotype BMX-08009-7 falls in the sectors without any mega environments and was the low-yielding genotype.
From the above discussion, it was quite clear that the genotypes BMX-010015 and BMX-08010-2 were found stable but moderate grain yielders, whereas the BARI Mung-7 and BARI Mung-8 varieties were better grain yielders but region-specific. In an earlier study [31], the genotypes BARI Mung-8, BMX-010015, BMX-08009-7, and BMX-08010-2 were found tolerant to water deficit stress. But the genotype BARI Mung-8 was region-centric and was suitable for the Madaripur environment only. The other two genotypes BMX-010015 and BMX-08010-2 were moderate yielders with some sort of tolerance to water deficit conditions and were suitable for cultivation across the environments, especially under limited water conditions. The genotype BARI Mung-6 was identified as a good yielder with less tolerance to water deficit stress, but that was not suitable for the recommendation to limited water environments. In contrast, the genotype BMX-08009-7 was tolerant to water deficit stress but not suitable for the recommendation due to low yielding performance. Overall, genetic, inheritance pattern and transcriptional regulatory mechanism behind the overall improvement in growth, physiology and yield stability under different stressors is also important for sustainability perspectives [61,62,63,64,65].

4. Conclusions

Water deficit stress is becoming an increasing reality in many areas of Bangladesh. Crop variety having the ability to exhibit tolerance to water deficit stress along with stable yielding performance over the environments has a clear benefit over susceptible ones. The present study attempted to assess the regional adaptability of mung bean genotypes which was previously identified as water deficit stress-tolerant through a series of selection with the high yielding check varieties. Testing for stability was also intended to judge the competitiveness in performance under drought stress as well as normal growing conditions to affirm the genotypes as suitable for across the environment with superior performance over the existing variety. A large proportion of the total grain yield variation across the environments accounted by genotypes indicated it as the most important source of variation, while GEI term also explained a certain share of the total variability. Different stability indices, rankings, and depiction from multiple biplots, it was clearly assumed that the BMX-010015 was the broadly adapted genotype across the environments. However, the genotype BMX-08010-2 adapted to a favorable environment showing its significant bi (>1) and non-significant S2di values. Though, the existing varieties were higher yielders but not suitable for water deficit conditions or region-centric in nature. The identified BMX-010015 and BMX-08010-2 genotypes could be used as tolerant genotypes to moisture deficit stress over the existing cultivars. Apart from this, the tolerant genotypes could be used as parents for hybridization in mung bean improvement programs to develop water deficit stress-tolerant variety for resource-poor farmers.

Author Contributions

Conceptualization, M.S.I. and M.R.I.; methodology, B.C.S.; software, M.A.A.; validation, T.J., M.H.-u.-R. and M.S.I.; formal analysis, M.A.A.; investigation, M.R.I.; resources, M.S.I.; data curation, T.J., M.H.-u.-R., M.G.A. and M.S.I.; writing—original draft preparation, M.S.I. and M.R.I.; writing—review and editing, T.J., R.S., A.R., M.S.U.Z., M.H.-u.-R., E.S.D., B.C.S., M.A.A., M.J.A. and M.G.A.; supervision, M.S.I.; project administration, M.S.I.; funding acquisition, T.J. All authors have read and agreed to the published version of the manuscript.

Funding

The authors are highly grateful to Taif University Researchers Supporting Project Number (TURSP-2020/85), Taif, Saudi Arabia for funding the current work.

Institutional Review Board Statement

Not applicable.

Informed Consent Statement

Not applicable.

Data Availability Statement

Not applicable.

Acknowledgments

The authors are highly grateful to Taif University Researchers Supporting Project Number (TURSP-2020/85), Saudi Arabia. The authors thank Ayman EL Sabagh and Mehmet Firat Baran (Siirt University, Turkey), Manzer H. Siddiqui and Saud Alamri (King Saud University, Saudi Arabia) and Ahmet Celik (Adiyaman University, Turkey) for helpful suggestions and critically reviewing the manuscript.

Conflicts of Interest

The authors declare no conflict of interest.

References

  1. Tomooka, N.; Lairungreeng, C.; Nakeeraks, P.; Egawa, Y.; Thavarasook, C. Production of mung bean and black gram. In Mung Bean and the Genetic Resources; TARC: Tohoku, Japan, 1991. [Google Scholar]
  2. Chauhan, Y.; Douglas, S.; Rachaputi, C.; Agius, R.C.N.; Martin, P.; King, W.K. Physiology of mungbean and development of the mungbean crop model. In Proceedings of the 1st Australian Summer Grains Conference Australia, Gold Coast, QLD, Australia, 21–24 June 2010; pp. 21–24. [Google Scholar]
  3. Sarker, U.; Oba, S. Salinity stress enhances color parameters, bioactive leaf pigments, vitamins, polyphenols, flavonoids and antioxidant activity in selected Amaranthus leafy vegetables. J. Sci. Food Agric. 2019, 99, 2275–2284. [Google Scholar] [CrossRef]
  4. Sarker, U.; Oba, S. Catalase, superoxide dismutase and ascorbate-glutathione cycle enzymes confer drought tolerance of Amaranthus tricolor. Sci. Rep. 2018, 8, 16496. [Google Scholar] [CrossRef] [PubMed] [Green Version]
  5. Sarker, U.; Oba, S. The Response of Salinity Stress-Induced A. tricolor to Growth, Anatomy, Physiology, Non-Enzymatic and Enzymatic Antioxidants. Front. Plant Sci. 2020, 11, 559876. [Google Scholar] [CrossRef]
  6. Sarker, U.; Oba, S. Drought Stress Effects on Growth, ROS Markers, Compatible Solutes, Phenolics, Flavonoids, and Antioxidant Activity in Amaranthus tricolor. Appl. Biochem. Biotechnol. 2018, 186, 999–1016. [Google Scholar] [CrossRef] [PubMed]
  7. Sarker, U.; Oba, S. Response of nutrients, minerals, antioxidant leaf pigments, vitamins, polyphenol, flavonoid and antioxidant activity in selected vegetable amaranth under four soil water content. Food Chem. 2018, 252, 72–83. [Google Scholar] [CrossRef]
  8. Sarker, U.; Oba, S. Drought stress enhances nutritional and bioactive compounds, phenolic acids and antioxidant capacity of Amaranthus leafy vegetable. BMC PlantBiol. 2018, 18, 258. [Google Scholar] [CrossRef] [Green Version]
  9. Sarker, U.; Islam, M.T.; Oba, S. Salinity stress accelerates nutrients, dietary fiber, minerals, phytochemicals and antioxidant activity in Amaranthus tricolor leaves. PLoS ONE 2018, 13, e0206388. [Google Scholar] [CrossRef] [Green Version]
  10. Sarker, U.; Oba, S. Nutritional and bioactive constituents and scavenging capacity of radicals in Amaranthus hypochondriacus. Sci. Rep. 2020, 10, 19962. [Google Scholar] [CrossRef]
  11. Sarker, U.; Oba, S. Color attributes, betacyanin, and carotenoid profiles, bioactive components, and radical quenching capacity in selected Amaranthus gangeticus leafy vegetables. Sci. Rep. 2021, 11, 11559. [Google Scholar] [CrossRef] [PubMed]
  12. Sarker, U.; Oba, S. Nutrients, minerals, pigments, phytochemicals, and radical scavenging activity in Amaranthus blitum leafy vegetables. Sci. Rep. 2020, 10, 3868. [Google Scholar] [CrossRef] [Green Version]
  13. Sarker, U.; Oba, S. Leaf pigmentation, its profiles and radical scavenging activity in selected Amaranthus tricolor leafy vegetables. Sci. Rep. 2020, 10, 18617. [Google Scholar] [CrossRef] [PubMed]
  14. Sarker, U.; Hossain, M.M.; Oba, S. Nutritional and antioxidant components and antioxidant capacity in green morph Amaranthus leafy vegetable. Sci. Rep. 2020, 10, 1336. [Google Scholar] [CrossRef] [PubMed]
  15. Sarker, U.; Oba, S. Nutraceuticals, antioxidant pigments, and phytochemicals in the leaves of Amaranthus spinosus and Amaranthus viridis weedy species. Sci. Rep. 2019, 9, 20413. [Google Scholar] [CrossRef] [Green Version]
  16. Sarker, U.; Oba, S. Protein, dietary fiber, minerals, antioxidant pigments and phytochemicals, and antioxidant activity in selected red morph Amaranthus leafy vegetable. PLoS ONE 2019, 14, e0222517. [Google Scholar] [CrossRef] [Green Version]
  17. Sarker, U.; Islam, T.; Rabbani, G.; Oba, S. Antioxidant leaf pigments and variability in vegetable amaranth. Genetika 2018, 50, 209–220. [Google Scholar] [CrossRef] [Green Version]
  18. Sarker, U.; Oba, S. Variability in total antioxidant capacity, antioxidant leaf pigments and foliage yield of vegetable amaranth. J. Int. Agr. 2018, 17, 1145–1153. [Google Scholar] [CrossRef] [Green Version]
  19. Sarker, U.; Oba, S. Antioxidant constituents of three selected red and green color Amaranthus leafy vegetable. Sci. Rep. 2019, 9, 18233. [Google Scholar] [CrossRef] [Green Version]
  20. Sarker, U.; Oba, S. Augmentation of leaf color parameters, pigments, vitamins, phenolic acids, flavonoids and antioxidant activity in selected Amaranthus tricolor under salinity stress. Sci. Rep. 2018, 8, 12349. [Google Scholar] [CrossRef] [Green Version]
  21. Sarker, U.; Oba, S. Nutraceuticals, phytochemicals, and radical quenching ability of selected drought-tolerant advance lines of vegetable amaranth. BMC Plant Biol. 2020, 20, 564. [Google Scholar] [CrossRef]
  22. Sarker, U.; Hossain, M.N.; Iqbal, M.A.; Oba, S. Bioactive Components and Radical Scavenging Activity in Selected Advance Lines of Salt-Tolerant Vegetable Amaranth. Front. Nutr. 2020, 7, 587257. [Google Scholar] [CrossRef]
  23. Sarker, U.; Oba, S. Phenolic profiles and antioxidant activities in selected drought-tolerant leafy vegetable amaranth. Sci. Rep. 2020, 10, 18287. [Google Scholar] [CrossRef]
  24. Sarker, U.; Oba, S. Polyphenol and flavonoid profiles and radical scavenging activity in leafy vegetable Amaranthus gangeticus. BMC Plant Biol. 2020, 20, 499. [Google Scholar] [CrossRef] [PubMed]
  25. Sarker, U.; Oba, S.; Daramy, M.A. Nutrients, minerals, antioxidant pigments and phytochemicals, and antioxidant capacity of the leaves of stem amaranth. Sci. Rep. 2020, 10, 3892. [Google Scholar] [CrossRef] [Green Version]
  26. Sarker, U.; Islam, T.; Rabbani, G.; Oba, S. Phenotypic divergence in vegetable amaranth for total antioxidant capacity, antioxidant profile, dietary fiber, nutritional and agronomic traits. Acta Agric. Scand. Soil Plant Sci. 2018, 68, 67–76. [Google Scholar] [CrossRef]
  27. Levitt, J. Response of Plants to Environmental Stress: Chilling, Freezing, and High Temperature Stress; Academic Press: New York, NY, USA, 1980; pp. 26–54. [Google Scholar]
  28. Mirzaei, A.; Rahim, N.; Parvaneh, V.; Meysam, M. Effects of Drought Stress on Qualitative and Quantitative Traits of Mung bean. Int. J. Biol. Food Vet. Agril. Eng. 2014, 8, 144–148. [Google Scholar]
  29. Boyer, J.S. Plant productivity and environment. Science 1982, 218, 443–448. [Google Scholar] [CrossRef]
  30. Sadasivan, R.; Natrajaratnam, N.; Dabu, R.; Muralidharan, V.; Rangasmay, S.R.S. Response of Mung bean cultivars to soil moisture stress at different growth phases. In Proceedings of the Second International Symposium, Bangkok, Thailand, 16–20 November 1987; AVRDC: Shanhua, Taiwan, 1988; pp. 260–262. [Google Scholar]
  31. Islam, M.R. Improving Mung bean Productivity under Drought Stress through Screening of Genotypes and Potassium Application. Ph.D. Thesis, Department of Agronomy, Hajee Mohammad Danesh Science and Technology University (HSTU), Dinajpur, Bangladesh, 2020. [Google Scholar]
  32. Akhtar, L.H.; Kashif, M.; Ali, M.; Aziz, T. Stability analysis for grain yield in Mung bean (Vigna radiata L. Wilczek) grown in different agro-climatic regions. Emir. J. Food Agri. 2010, 22, 490–497. [Google Scholar] [CrossRef]
  33. Kulsum, U.; Sarker, U.; Karim, A.; Mian, K. Additive main effects and multiplicative interaction (AMMI) analysis for yield of hybrid rice in Bangladesh. Trop. Agr. Develop. 2012, 56, 53–61. [Google Scholar]
  34. Pham, H.N.; Kang, M.S. Interrelationships among repeatability of several stability statistics estimated from international maize trials. Crop Sci. 1988, 28, 925–928. [Google Scholar] [CrossRef]
  35. Fikere, M.; Tadesse, T.; Letta, T. Genotype-environment interactions and stability parameters for grain yield of faba beans (Vacia faba L.) genotypes grown in south eastern Ethiopia. Int. J. Sustain. Crop Prod. 2008, 3, 80–87. [Google Scholar]
  36. Yan, W.; Cornelius, P.L.; Crossa, J.; Hunt, L.A. Two Types of GGE Biplots for Analyzing Multi-environment Trial Data. Crop Sci. 2001, 41, 656–663. [Google Scholar] [CrossRef] [Green Version]
  37. Piepho, H.P. Methods for comparing the yield stability of cropping systems. J. Agron. Crop Sci. 1998, 180, 193–213. [Google Scholar] [CrossRef]
  38. Becker, H.C.; Leon, J. Stability analysis in plant breeding. Plant Breed. 1988, 101, 1–23. [Google Scholar] [CrossRef]
  39. Lin, C.S.; Binns, M.R.; Lefkovitch, L.P. Stability analysis; where do we stand? Crop Sci. 1986, 26, 894–900. [Google Scholar] [CrossRef] [Green Version]
  40. Westcott, B. Some methods of analyzing genotype-environment interaction. Heredity 1986, 56, 243–253. [Google Scholar] [CrossRef] [Green Version]
  41. Eberhart, S.A.; Russell, W.A. Stability parameters for comparing varieties. Crop Sci. 1966, 6, 36–40. [Google Scholar] [CrossRef] [Green Version]
  42. Gauch, H.G. Statistical Analysis of Regional Yield Trials: AMMI Analysis of Factorial Designs, 1st ed.; Elsevier Science: Amsterdam, The Netherlands, 1992. [Google Scholar]
  43. BARI (Bangladesh Agricultural Research Institute). Krishi Projukyi Hatboi (Handbook on Agro-Technology), 7th ed.; Farm Technology Group: Gazipur, Bangladesh, 2017. [Google Scholar]
  44. R Core Team. R: A Language and Environment for Statistical Computing. R Foundation for Statistical Computing, Vienna, Austria, 2019. Available online: http://www.R-project.org/ (accessed on 23 August 2021).
  45. Purchase, J.L.; Hatting, H.; van Deventer, C.S. Genotype × environment interaction of winter wheat (Triticum aestivum L.) in South Africa: II. Stability analysis of yield performance. S. Afr. J. Plant Soil. 2000, 17, 101–107. [Google Scholar] [CrossRef]
  46. Gollob, H.F. A statistical model which combines features of factor analytic and analysis of variance techniques. Psychometrika 1968, 33, 73–115. [Google Scholar] [CrossRef] [PubMed]
  47. Finlay, K.W.; Wilkinson, G.N. The analysis of adaptation in a plant breeding program. Aust. J. Agric. Res. 1963, 14, 742–754. [Google Scholar] [CrossRef] [Green Version]
  48. Atta, B.M.; Tariq, M.S.; Ghulam, A.; Muhammad, A.H. Genotype x environment interaction for grain yield in kabuli chickpea (Cicer arietinum L.) Genotypes Developed through mutation breeding. Pak. J. Bot. 2009, 41, 1883–1890. [Google Scholar]
  49. Asfaw, A.; Gurum, F.; Alemayehu, F.; Rezene, Y. Analysis of multi-environment grain yield trials in Mung bean Vigna radiata (L.) Wilczek based on GGE Bipot in Southern Ethiopia. J. Agr. Sci. Technol. 2012, 14, 389–398. [Google Scholar]
  50. Hussain, A.; Fatima, N. A bibliometric analysis of the ‘Chinese librarianship: An International Electronic Journal, (2006–2010)’. Chin. Librariansh. Int. Electron. J. 2011, 31, 1–14. [Google Scholar]
  51. Waniale, A.; Wanyera, N.; Talwana, H. Morphological and agronomic traits variations for Mung bean variety selection and improvement in Uganda. Afr. Crop Sci. J. 2014, 22, 123–136. [Google Scholar]
  52. Tarakanovas, P.; Ruzgus, V. Additive main effect and multiplicative interaction analysis of grain yield of wheat varieties in Lithuania. Agro. Res. 2006, 4, 91–98. [Google Scholar]
  53. Misra, R.C.; Das, S.; Patnaik, M.C. AMMI model analysis of stability and adaptability of late duration finger millet (Eleusinecoracana) genotypes. World Appl. Sci. J. 2009, 6, 1650–1654. [Google Scholar]
  54. Das, S.; Misra, R.C.; Patnaik, M.C.; Das, S.R. Genotype x environment interaction, adaptability and yield stability of mid—Early rice genotypes. Indian J. Agric. Res. 2010, 44, 104–111. [Google Scholar]
  55. Khan, A.A.; Alam, M.A.; Kabir, M.R. AMMI analysis for stability and environmental effects on grain yield of eight spring wheat varieties (Triticum aestivum L.) in Bangladesh. Bull. Inst. Trop Agri. Kyushu Univ. 2014, 37, 93–103. [Google Scholar]
  56. Win, K.S.; Kyi, W.; Than, D.M.; Nyo, M.H.; Tun, S. Genotype by environment interaction and stability analysis of seed yield, agronomic characters in Mung bean (Vigna radiata L. Wilczek) genotypes. Int. J. Adv. Res. 2018, 6, 926–934. [Google Scholar] [CrossRef] [Green Version]
  57. Yan, W.; Kang, M.S. GGE Biplot Analysis: A Graphical Tool for Breeders, Geneticists and Agronomists; CRC Press: Boca Raton, FL, USA, 2003. [Google Scholar]
  58. Yan, W.; Tinker, N.A. Biplot analysis of multi-environment trial data: Principles and applications. Can. J. Plant Sci. 2006, 86, 623–645. [Google Scholar] [CrossRef] [Green Version]
  59. Varma, P.N. Studies on Yield and Stress Tolerance in Green Gram. Master’s Thesis, Department of Plant Breeding and Genetics, Odisha University of Agriculture and Technology, Bhubaneswar, India, 2016. [Google Scholar]
  60. Yan, W.; Kang, M.S.; Ma, B.; Wood, S.; Cornelius, P.L. GGE Biplot vs. AMMI Analysis of Genotype-by environment Data. Crop Sci. 2007, 47, 643–655. [Google Scholar] [CrossRef]
  61. Mahmood, T.; Wang, X.; Ahmar, S.; Abdullah, M.; Iqbal, M.S.; Rana, R.M.; Yasir, M.; Khalid, S.; Javed, T.; Mora-Poblete, F.; et al. Genetic potential and inheritance pattern of phenological growth and drought tolerance in cotton (Gossypium hirsutum L.). Front. Plant Sci. 2021, 12, 915. [Google Scholar]
  62. Chowdhury, M.K.; Hasan, M.A.; Bahadur, M.M.; Islam, M.; Hakim, M.; Iqbal, M.A.; Javed, T.; Raza, A.; Shabbir, R.; Sorour, S.; et al. Evaluation of drought tolerance of some wheat (Triticum aestivum L.) genotypes through phenology, growth, and physiological indices. Agronomy 2021, 11, 1792. [Google Scholar] [CrossRef]
  63. Javed, T.; Shabbir, R.; Ali, A.; Afzal, I.; Zaheer, U.; Gao, S.J. Transcription factors in plant stress responses: Challenges and potential for sugarcane improvement. Plants 2020, 9, 491. [Google Scholar] [CrossRef] [PubMed]
  64. Shabbir, R.; Javed, T.; Afzal, I.; Sabagh, A.E.; Ali, A.; Vicente, O.; Chen, P. Modern biotechnologies: Innovative and sustainable approaches for the improvement of sugarcane tolerance to environmental stresses. Agronomy 2021, 11, 1042. [Google Scholar] [CrossRef]
  65. Raza, A.; Charagh, S.; Sadaqat, N.; Jin, W. Arabidopsis thaliana: Model plant for the study of abiotic stress responses. In The Plant Family Brassicaceae; Springer: Singapore, 2020; pp. 129–180. [Google Scholar]
Figure 1. The geographical location of five experimental sites (within the red circle) in Bangladesh.
Agronomy 11 02136 g001
Figure 2. AMMI 1 Biplot displaying AMMI PCA I against the grain yield. The genotypes BM-6, BM-7, and BM-8 stand for BARI Mung-6, BARI Mung-7, and BARI Mung-8, respectively, and the environments Ish, Gaz, Jas, Bar, and Mad stand for Ishurdi, Gazipur, Jashore, Barishaland Madaripur, respectively.
Agronomy 11 02136 g002
Figure 3. AMMI 2 biplot displaying AMMI PCA II against AMMI PCA I. The genotypes BM-6, BM-7, and BM-8, stands for BARI Mung-6, BARI Mung-7, and BARI Mung-8, respectively, and the environments Ish, Gaz, Jas, Bar, and Mad stands for Ishurdi, Gazipur, Jashore, Barishaland Madaripur, respectively.
Agronomy 11 02136 g003
Figure 4. Biplot displaying CV (%) against mean grain yield. The genotypes BM-6, BM-7, and BM-8 stand for BARI Mung-6, BARI Mung-7, and BARI Mung-8, respectively.
Agronomy 11 02136 g004
Figure 5. GGE Biplot displaying the position of genotypes and environments. The genotypes BM-6, BM-7, and BM-8 stand for BARI Mung-6, BARI Mung-7, and BARI Mung-8, respectively, and the environments Ish, Gaz, Jas, Bar, and Mad stands for Ishurdi, Gazipur, Jashore, Barishal, and Madaripur, respectively.
Agronomy 11 02136 g005
Table 1. Illustration of the experimental material used in the study.
S. No.GenotypesDistinctionPedigreeRemark
1BARI Mung-8STSelection from the local collection (LM-101)RV
2BMX-08010-2STBARI Mung-6 × BMX-9902-2AL
3BMX-010015STNM-94 × BARI Mung -3AL
4BMX-08009-7STBARI Mung-6 × BU Mung-2AL
5BARI Mung-6CheckNM-36 × VC-2768A (AVRDC)RV
6BARI Mung-7CheckVC-3960A-88 × VC-6173CRV
ST = Stress tolerant; RV = Released variety; AL = Advanced line.
Table 2. Salient features of the study sites along with their climatic condition during 2019.
LocationVariable
Monthly Total Rainfall(mm)Monthly Average Temperature (°C)
Altitude (m)Geographical
Position
Soil TextureMarchAprilMayJune MarchAprilMayJune
Ishurdi16.0024° 03′ N
89° 05′ E
CL27.261.9127.1167.9Tmax
Tmin
32.2
17.8
34.1
22.9
35.7
25.7
34.9
26.2
Jashore6.1023° 17′ N
89° 21′ E
CL85.0155.0152.0155.0Tmax
Tmin
32.2
19.3
34.9
23.4
36.7
26.2
36.0
26.7
Barishal2.1022° 48′ N
90° 37′ E
SC38.078.30125.40173.8Tmax
Tmin
31.6
20.5
33.1
23.0
34.8
26.0
33.2
26.6
Madaripur7.0023°10 N
90°12′ E
SL52.3117.2229.1370.9Tmax
Tmin
31.6
20.5
33.1
23.7
32.9
25.1
31.7
25.9
Gazipur14.0022° 46′ N
90° 39′ E
SCL126.0112.0233.6185.0Tmax
Tmin
32.0
20.0
33.5
22.3
35.3
25.3
34.1
26.5
CL = Clay loam; SC = Silty clay; SL = Silty loam; SCL = Silty clay loam; Tmax = maximum temperature; Tmin = minimum temperature.
Table 3. Chemical properties of initial soil sample (0–15 cm soil depth) of the five experimental sites.
LocationpHOM
(%)
Total N (%)Exchangeable K meq 100 g Soil−1PSZnB
µg g−1
Ishurdi7.361.100.0600.3131.1210.751.430.35
Jashore7.61.170.0650.1813.0014.000.560.16
Barishal6.80.920.0800.0712.0010.200.600.54
Madaripur7.41.450.0650.1616.0018.301.100.16
Gazipur6.251.090.0870.087.4110.070.260.17
Critical level (CL)--0.120.1210100.600.20
Table 4. Performance of mung bean genotypes for days to flowering at different environments during summer (Kharif-I) season, 2019.
EntriesDays to FloweringPibiS2di
IshGazJasBarMadMean
BMX-0100154341384038400.600.75 *10.64
BMX-08009-73848404545433.600.56 ***5.78 **
BMX-08010-2373840354038−1.401.48 **4.54 ***
BARI Mung-6344336413839−0.400.66 **2.87 ***
BARI Mung-73940423436390.000.40 ***14.57 **
BARI Mung-8363739343637−2.402.1512.63
Mean37.8341.1739.1738.1738.8339.40
Environmental index (Ij)−1.571.77−0.23−1.23−0.57
CV (%)1.652.601.902.794.60-
LSD (0.05)2.122.423.532.432.81-
* = Significant at p ≤ 0.05; ** = Significant at p ≤ 0.01; *** = Significant at p ≤ 0.001; Ish = Ishurdi; Gaz = Gazipur; Jas = Jashore; Bar = Barishal; Mad = Madaripur; CV = Coefficient of variation; LSD = Least significant difference, Pi = Phenotypic index; bi = Regression coefficient; S2di = Deviation from regression.
Table 5. Performance of mung bean genotypes for days to maturity at different environments during summer (Kharif-I) season, 2019.
EntriesDays to MaturityPibiS2di
IshGazJasBarMadMean
BMX-0100157067697066683.630.75 ***2.46
BMX-08009-76470707466694.631.59 ***3.16 ***
BMX-08010-26363646468640.031.62 ***16.47 ***
BARI Mung-6616460665661−3.370.17 **3.03 ***
BARI Mung-7616363606062−2.170.46 ***12.84 **
BARI Mung-8616162616062−2.771.39 ***1.13 ***
Mean63.3364.6764.6765.8362.6764.37
Environmental index (Ij)−1.030.300.301.47−1.700.00
CV (%)1.942.000.802.777.07-
LSD (0.05)2.732.662.863.894.08-
** = Significant at p ≤ 0.01; *** = Significant at p ≤ 0.001; Ish = Ishurdi; Gaz = Gazipur; Jas = Jashore; Bar = Barishal; Mad = Madaripur; CV = Coefficient of variation; LSD = Least significant difference, Pi = Phenotypic index; bi = Regression coefficient; S2di = Deviation from regression.
Table 6. Performance of mung bean genotypes for pods plant−1 at different environments study during summer (Kharif-I) season, 2019.
EntriesPods Plant−1PibiS2di
IshGazJasBarMadMean
BMX-01001526.2117.4221.3119.4220.220.910.042.89 ***26.52 ***
BMX-08009-722.1226.3222.1011.4325.2221.400.530.7520.25
BMX-08010-225.6423.2524.0018.624.2723.152.280.11 ***10.61 **
BARI Mung-613.1425.2225.179.6438.0322.241.37−0.43 ***7.93
BARI Mung-719.4417.0517.8024.2018.0719.31−1.561.2419.76 ***
BARI Mung-819.9717.5818.3316.6018.6018.22−2.651.4531.42 ***
Mean21.0921.1421.4516.6524.0720.87
Environmental index (Ij)0.220.270.58−4.223.19
CV (%)12.5510.1610.916.2411.18-
LSD (0.05)4.982.593.348.943.61-
** = Significant at p ≤ 0.01; *** = Significant at p ≤ 0.001; Ish = Ishurdi; Gaz = Gazipur; Jas = Jashore; Bar = Barishal; Mad = Madaripur; CV = Coefficient of variation; LSD = Least significant difference, Pi = Phenotypic index; bi = Regression coefficient; S2di = Deviation from regression.
Table 7. Performance of mung bean genotypes for 100-grain weight at different environment studies during summer (Kharif-I) season, 2019.
Entries100 Grain WeightPibiS2di
IshGazJasBarMadMean
BMX-0100154.474.344.294.424.524.41−0.022.44 ***0.08
BMX-08009-73.84.635.003.135.304.37−0.061.320.16 ***
BMX-08010-23.913.433.554.523.933.87−0.560.640.45 ***
BARI Mung-64.473.925.033.405.444.450.02−0.08 ***−0.08
BARI Mung-75.124.644.975.945.605.250.821.68 **0.59 ***
BARI Mung-84.153.673.784.754.804.23−0.200.002 ***0.06
Mean4.324.114.444.364.934.43
Environmental index (Ij)−0.11−0.330.01−0.070.50
CV (%)2.011.531.482.457.28-
LSD (0.05)0.890.410.081.050.62-
** = significant at p ≤ 0.01; *** = significant at p ≤ 0.001; Ish = Ishurdi; Gaz = Gazipur; Jas = Jashore; Bar = Barishal; Mad = Madaripur; CV = Coefficient of variation; LSD = Least significant difference, Pi = phenotypic index; bi = regression coefficient; S2di = deviation from regress.
Table 8. Analysis of variance (AMMI model) for genotypes evaluate at different environments during summer (Kharif-I) season, 2019.
SVDFSSMSS% Treatment
SS
% Interaction
SS
Cumulative
%
Gen516496312.73299263 **91.03
Env4640406.65160101.7 **3.53
Gen x Env20985227.2149261.36 **5.44
IPCA I8706752.7088344.09 ** 71.7471.74
IPCA II6160280.9526713.49 ** 16.2788.00
IPCA III4109876.2827469.07 ** 11.1599.16
IPCA IV28317.284158.639 ns 0.84100
Residuals60110366.841839.45
AMMI = Additive main effect and multiplicative interaction; SV = Sources of variation; DF = Degrees of freedom; SS = Sum of squares; MSS = Mean sum of squares; Gen = Genotype; Env = Environment; IPCA = Interaction principle component axis. ** = significant at p ≤ 0.01; ns, no significance.
Table 9. Genotypes performance for yield stability evaluated at different environments.
EntriesIshGazJasBarMadMeanPibiS2diASVYSIRBYRBASVCV(%)
BMX-0100151483.271434.801478.921383.681448.301446.07125.660.297804.831.986422.78
BMX-08009-7327.14455.74424.73283.96394.41375.20−945.210.30 *11,548.75 **1.7876118.81
BMX-08010-21549.441299.881493.911278.861372.241398.9978.580.65 **21,838.872.399548.51
BARI Mung-61531.481482.661712.741478.511533.331548.20227.790.57 ***597.2057 ***2.166336.18
BARI Mung-71455.671433.481708.751387.671969.621591.71271.302.41 ***4988.177 *4.4571615.48
BARI Mung-81589.961443.451459.941397.651917.041562.28241.871.78 **13,323.05 ***3.8872513.55
Mean1322.831258.341379.831201.721439.161320.41
Ei (Ij)2.42−62.0759.42−118.69118.75
CV (%)3.203.001.682.764.10-
LSD (0.05)54.4048.5429.7442.6175.84-
* = Significant at p ≤ 0.05; ** = Significant at p ≤ 0.01; *** = Significant at p ≤ 0.001; Ish = Ishurdi; Gaz = Gazipur; Jas = Jashore; Bar = Barishal; Mad = Madaripur; Ei = Environmental index; CV = Coefficient of variation; LSD = Least significant difference; ASV = AMMI stability value; YSI = Yield stability index; RBY = Rank based on yield; RBASV = Rank based on ASV; CV = Coefficient of variation; Pi = Phenotypic index; bi = Regression coefficient; S2di = Deviation from regression.
Publisher’s Note: MDPI stays neutral with regard to jurisdictional claims in published maps and institutional affiliations.

