
Estimation of Daily Reference Evapotranspiration from NASA POWER Reanalysis Products in a Hot Summer Mediterranean Climate


1
LEAF—Linking Landscape, Environment, Agriculture and Food—Research Center, Associated Laboratory TERRA, Instituto Superior de Agronomia, Universidade de Lisboa, Tapada da Ajuda, 1349-017 Lisboa, Portugal
2
INESC TEC—INESC Technology and Science, 4200-465 Porto, Portugal
*
Author to whom correspondence should be addressed.
Agronomy 2021, 11(10), 2077; https://0-doi-org.brum.beds.ac.uk/10.3390/agronomy11102077
Submission received: 14 September 2021
/
Revised: 12 October 2021
/
Accepted: 15 October 2021
/
Published: 18 October 2021
(This article belongs to the Special Issue Advances in Irrigation Technology and Adaptation to Climate Change)
Abstract
:This study aims at assessing the accuracy of estimating daily reference evapotranspiration (ETo) computed with NASA POWER reanalysis products. Daily ETo estimated from local observations of weather variables in 14 weather stations distributed across Alentejo Region, Southern Portugal were compared with ETo derived from NASA POWER weather data, using raw and bias-corrected datasets. Three different methods were used to compute ETo: (a) FAO Penman-Monteith (PM); (b) Hargreaves-Samani (HS); and (c) MaxTET. Results show that, when using raw NASA POWER datasets, a good accuracy between the observed ETo and reanalysis ETo was observed in most locations (R2 > 0.70). PM shows a tendency to over-estimating ETo with an RMSE as high as 1.41 mm d−1, while using a temperature-based ET estimation method, an RMSE lower than 0.92 mm d−1 is obtained. If a local bias correction is adopted, the temperature-based methods show a small over or underestimation of ETo (–0.40 mm d−1 ≤ MBE < 0.40 mm d−1). As for PM, ETo is still underestimated for 13 locations (MBE < 0 mm d−1) but with an RMSE never higher than 0.77 mm d−1. When NASA POWER raw data is used to estimate ETo, HS_Rs proved the most accurate method, providing the lowest RMSE for half the locations. However, if a data regional bias correction is used, PM leads to the most accurate ETo estimation for half the locations; also, when a local bias correction is performed, PM proved the be the most accurate ETo estimation method for most locations. Nonetheless, MaxTET proved to be an accurate method; its simplicity may prove to be successful not only when only maximum temperature data is available but also due to the low data required for ETo estimation.
1. Introduction
Recurring water scarcity, along with higher competition for the available water resources, requires the knowledge of accurate water consumption. Evapotranspiration (ET) has become a synonym of consumptive use. Knowledge of ET is required for water resources projects planning and operation, being involved in problems of water supply and water management, as well as in the economics of multipurpose water projects for irrigation, power, water transportation, flood control, municipal and industrial water uses, and wastewater reuse systems [1]. Agricultural water management requires the accurate estimation of crop water requirements, demanding to accurately estimate crop evapotranspiration (ETc). A widely accepted method to estimate ETc at the field level consists of the approach proposed by Allen et al. [2] based on the combination of the reference evapotranspiration (ETo) with a crop coefficient. Thus, ETo becomes one of the key elements to estimate irrigation requirements. Also, it allows for numerous applications such as water management, irrigation system design and management, irrigation scheduling, and crop modeling [3,4,5,6,7,8,9,10]. Also, it has been widely used as an indicator to assess climate hazards, such as droughts, in different climates [11,12,13,14]. ETo is defined by Allen et al. [2] as the rate of evapotranspiration from a hypothetical reference crop with an assumed crop height equal to 0.12 m, a fixed daily canopy resistance of 70 s m−1, and an albedo of 0.23, closely resembling an extensive surface of green grass of uniform height, actively growing, completely shading the ground and with adequate water supply. There is a vast number of empirical, semi-empirical, and physically-based equations available to estimate ETo, based on weather variables, such as maximum (Tmax) and minimum (Tmin) temperatures, wind speed (u), relative humidity (RH), and solar radiation (Rs). When complete databases of weather data are available, the Food and Agriculture Organization (FAO) recommends as the standard method to estimate ETo, the FAO-56 Penman-Monteith equation (PM) [2]. The method is well documented and has been extensively validated in many regions and climates around the world [15,16]. Is it highly regarded as a robust ETo estimator when compared with other methods [17,18,19,20,21,22,23], and it can be used globally without the need for additional parameters calibration.
Droogers and Allen [19] concluded that, if accurate weather data collection can be expected, the PM equation is advisable; if the availability and/or reliability of data is limited, a temperature-based method should be considered. Different temperature-based methods to estimate ETo are available in the literature [24,25,26,27,28,29]. These methods can be widely applied since most weather stations collect these data [24]. From those, the Hargreaves–Samani (HS) [24] equation is the most widely used, where only data of maximum and minimum air temperature and extra-terrestrial radiation (Ra) are required. Rodrigues and Braga [30] compared PM with HS and another 8 different temperature-based methods in order to determine the best model based on the weather conditions of fourteen locations in Alentejo, Southern Portugal. This study has shown that Hargreaves–Samani (HS) method proved to be an accurate estimator of ETo for that region (root mean square error, RMSE, averaging 0.84 mm day−1). Recently, Rodrigues and Braga [31] proposed a method (MaxTET) to estimate ETo only from maximum temperature, facilitating, even more, the estimations since only one weather variable (Tmax) is required.
Reanalysis and gridding weather data from global atmospheric models are considered as one of the meteorological data sources that can be used to cope with insufficient observations [32]. This approach, referred to as “reanalysis” [33], is based on numerical weather data assimilation systems that use a variety of atmospheric and sea surface observations to provide for long-term atmospheric and land surface variables [34]. There are several historical reanalysis datasets available that provide daily reanalysis data [35,36,37,38,39,40]. Due to the user-friendly platform, available data, and ease of use, one that stands out is the National Aeronautics and Space and Administration Prediction of Worldwide Energy Resource (NASA POWER) [40]. Available for a resolution of 0.5° latitude by 0.5° longitude globally, the NASA POWER’s website (https://power.larc.nasa.gov/, accessed on 1 November 2020) provides daily data of near-surface air temperature, relative humidity, rainfall, solar radiation, and wind speed and direction. All datasets result from simulations of numerical weather prediction models based on a set of meteorological observations. However, the ease of use of NASA POWER, when compared with other providers, allows to easily access data since it is available in three different forms: (1) a single point, where a time series of data is made available based on the registered coordinate (single latitude and longitude) selected by the user; (2) a regional endpoint, that produces a time series dataset based on a bounding box of latitude and longitude coordinates defined by the user; and (3) the global endpoint that returns long-term climatological averages for the entire globe. If data proves to be accurate, its user-friendly interface, when compared to other reanalysis products, allows any end-user to easily have access to near-real-time sound weather data from anywhere around the globe.
In order to improve its accuracy, reanalysis data may require corrections using observation-based datasets in order to amend for anomalies that arise from land surface modeling [41]. Recent studies aimed to evaluate the performance of NASA POWER data [32,41,42,43,44,45,46,47]. Those studies showed that there is a significant agreement between NASA POWER reanalysis and observed data for most weather parameters (mostly air temperature and solar radiation). However, Rodrigues and Braga [46] concluded that a bias correction of NASA POWER reanalysis products tends to significantly improve the goodness of fit when compared with land-observed data.
Despite the high importance of ETo in the field of irrigated agriculture, there are only a few studies available that demonstrate the accuracy and goodness of fit of ETo estimations derived from NASA POWER datasets [45,47], especially for the Mediterranean regions [43]. Monteiro et al. [45], for Brazilian conditions, found that estimation ETo PM when using NASA POWER data led to an RMSE averaging 3.5 mm d−1, while Negm et al. [44], for Sicily, estimated an RMSE varying from 0.68 to 1.27 mm d−1 and a mean bias error (MBE) that varied between −0.39 and 0.73 mm d−1. For India, Srivastava et al. [48] found better agreement when comparing ground-level data with reanalysis data (RMSE = 0.35 mm d−1). However, none of them assess improvement of ETo estimations when using NASA POWER’s bias-corrected data.
The objective of this paper is to assess the accuracy of daily ETo estimations from NASA POWER datasets, with and without bias correction of raw weather data, using PM, HS, and MaxTET methods in the Alentejo region, Southern Portugal, when compared with PM ETo derived from ground observed weather datasets. The three estimation methods were selected based to compare the method regarded as the most accurate (PM), but more demanding on data, with two temperature-based methods: the well-established HS method and the simpler but pragmatic and expedited MaxTET method.
2. Materials and Methods
2.1. Data
Daily weather datasets were collected from 14 ground weather stations from the Irrigation Operation and Technology Center (COTR). The weather stations were selected to ensure regular distribution throughout the Alentejo. This region was selected due to its semi-arid Mediterranean climate of the hot and dry season in the summer and mild temperature associated with annual rainfall in winter. The region is prone to desertification, where water availability is crucial to achieving farming sustainability and resilience. Daily weather data include maximum and minimum air temperatures (Tmax and Tmin, °C), relative humidity (RH, %), wind speed (u2, m s−1), and solar radiation (Rs, MJ m−2 d−1). All data is daily validated by a team of experienced technicians, assuring its quality and feasibility, using the techniques described by Allen et al. [2]. Table 1 presents the period of data and mean daily PM reference evapotranspiration for the irrigation season and for the peak month of July. A more comprehensive characterization of the region and the weather station locations are presented by Rodrigues and Braga [31].
The NASA POWER reanalysis products selected for the current study cover a regular grid with a spatial resolution of 0.5° × 0.5° latitude-longitude. The same weather parameters, as collected by the ground weather stations, for the same period of observations, were collected from NASA POWER from the nearest grid point of the target location. Besides the raw NASA POWER data, two additional datasets were used in this study. Following the bias correction equations proposed by Rodrigues and Braga [46], two corrected datasets were obtained for each location: a regionally bias-corrected set; and a locally bias-corrected data series.
This study was conducted using data from April to October, the period that covers the growing season (hereby named irrigation season) of the main crops in Alentejo, where irrigation is essential to maintain profitable crop yields.
2.2. Reference Evapotranspiration (ETo)
The computation of the daily reference evapotranspiration (ETo) was performed using the ETo Tool application proposed by Rodrigues and Braga [49]. The application includes several methods to compute ETo depending on the available weather data. However, to estimate ETo, and based on the conclusions drawn by Rodrigues Braga [46], where a bias correction of NASA POWER weather datasets proved to significantly improve the accuracy of reanalysis products, only three different methods (Table 2) were selected to evaluate the impact of adopting reduced weather datasets. Those three different methods were selected based on the requirement of different levels of weather variables: PM where a full weather dataset is required; HS where only Tmax and Tmin need to be used; and MaxTET, where only Tmax is mandatory. This will allow us to better understand which method would lead to the best results when the user opts for a dataset with or without a bias correction, and with more or less data availability.
2.3. Evaluation Criteria
The accuracy of ETo computed by each method (Table 1) from NASA POWER reanalysis data was assessed by comparing those results with the ones computed by PM equation for the observed data, through the performance indicators provided by the ETo Tool application [49], namely:
- The coefficients of regression and determination, relating the relating the observed (Oi) and NASA POWER (Pi) dataset, b and R2 respectively, are defined as:
Values of b near 1 indicate that Oi and Pi are statistically close, while b > 1 suggests overestimation and b < 1 underestimation. An R2 near 1.0 indicates that most of the variance of the observed values is explained by the model. Henseler et al. [50] define that R2 values of 0.25, 0.50, and 0.75 match weakly, moderately, and significantly fit, respectively.
- The root mean square error, RMSE, and its normalization, NRMSE, which characterizes the variance of the estimation error:
The RMSE measures overall discrepancies between observed and estimated values, thus should be as small as possible, while the NRMSE defines the ratio between the RMSE and the mean of observations.
- The mean bias error, MBE, and its normalization, NMBE, that measures the systematic error between the NASA POWER and observed values:
The MBE intends to indicate the model bias, allowing to quantify the average over- or underestimation of the model. The NMBE defines the ratio between the MBE and the mean of observations.
- The Nash and Sutcliffe [51] modeling efficiency, EF, that is the ratio of the mean square error to the variance of the first dataset, subtracted from unity:
EF provides an indication of the relative magnitude of the mean square error (MSE = RMSE2) relative to the observed data variance [52]. The best value is EF = 1.0 that represents a perfect match between Pi and Oi and EF close to 1 means that the “noise” is negligible relative to the “information”, implying that alternative-based values of ETo are good estimators of PM ETo values.
3. Results and Discussion
3.1. Accuracy Assessment of Daily ETo Estimates Using NASA POWER Data without Bias Correction
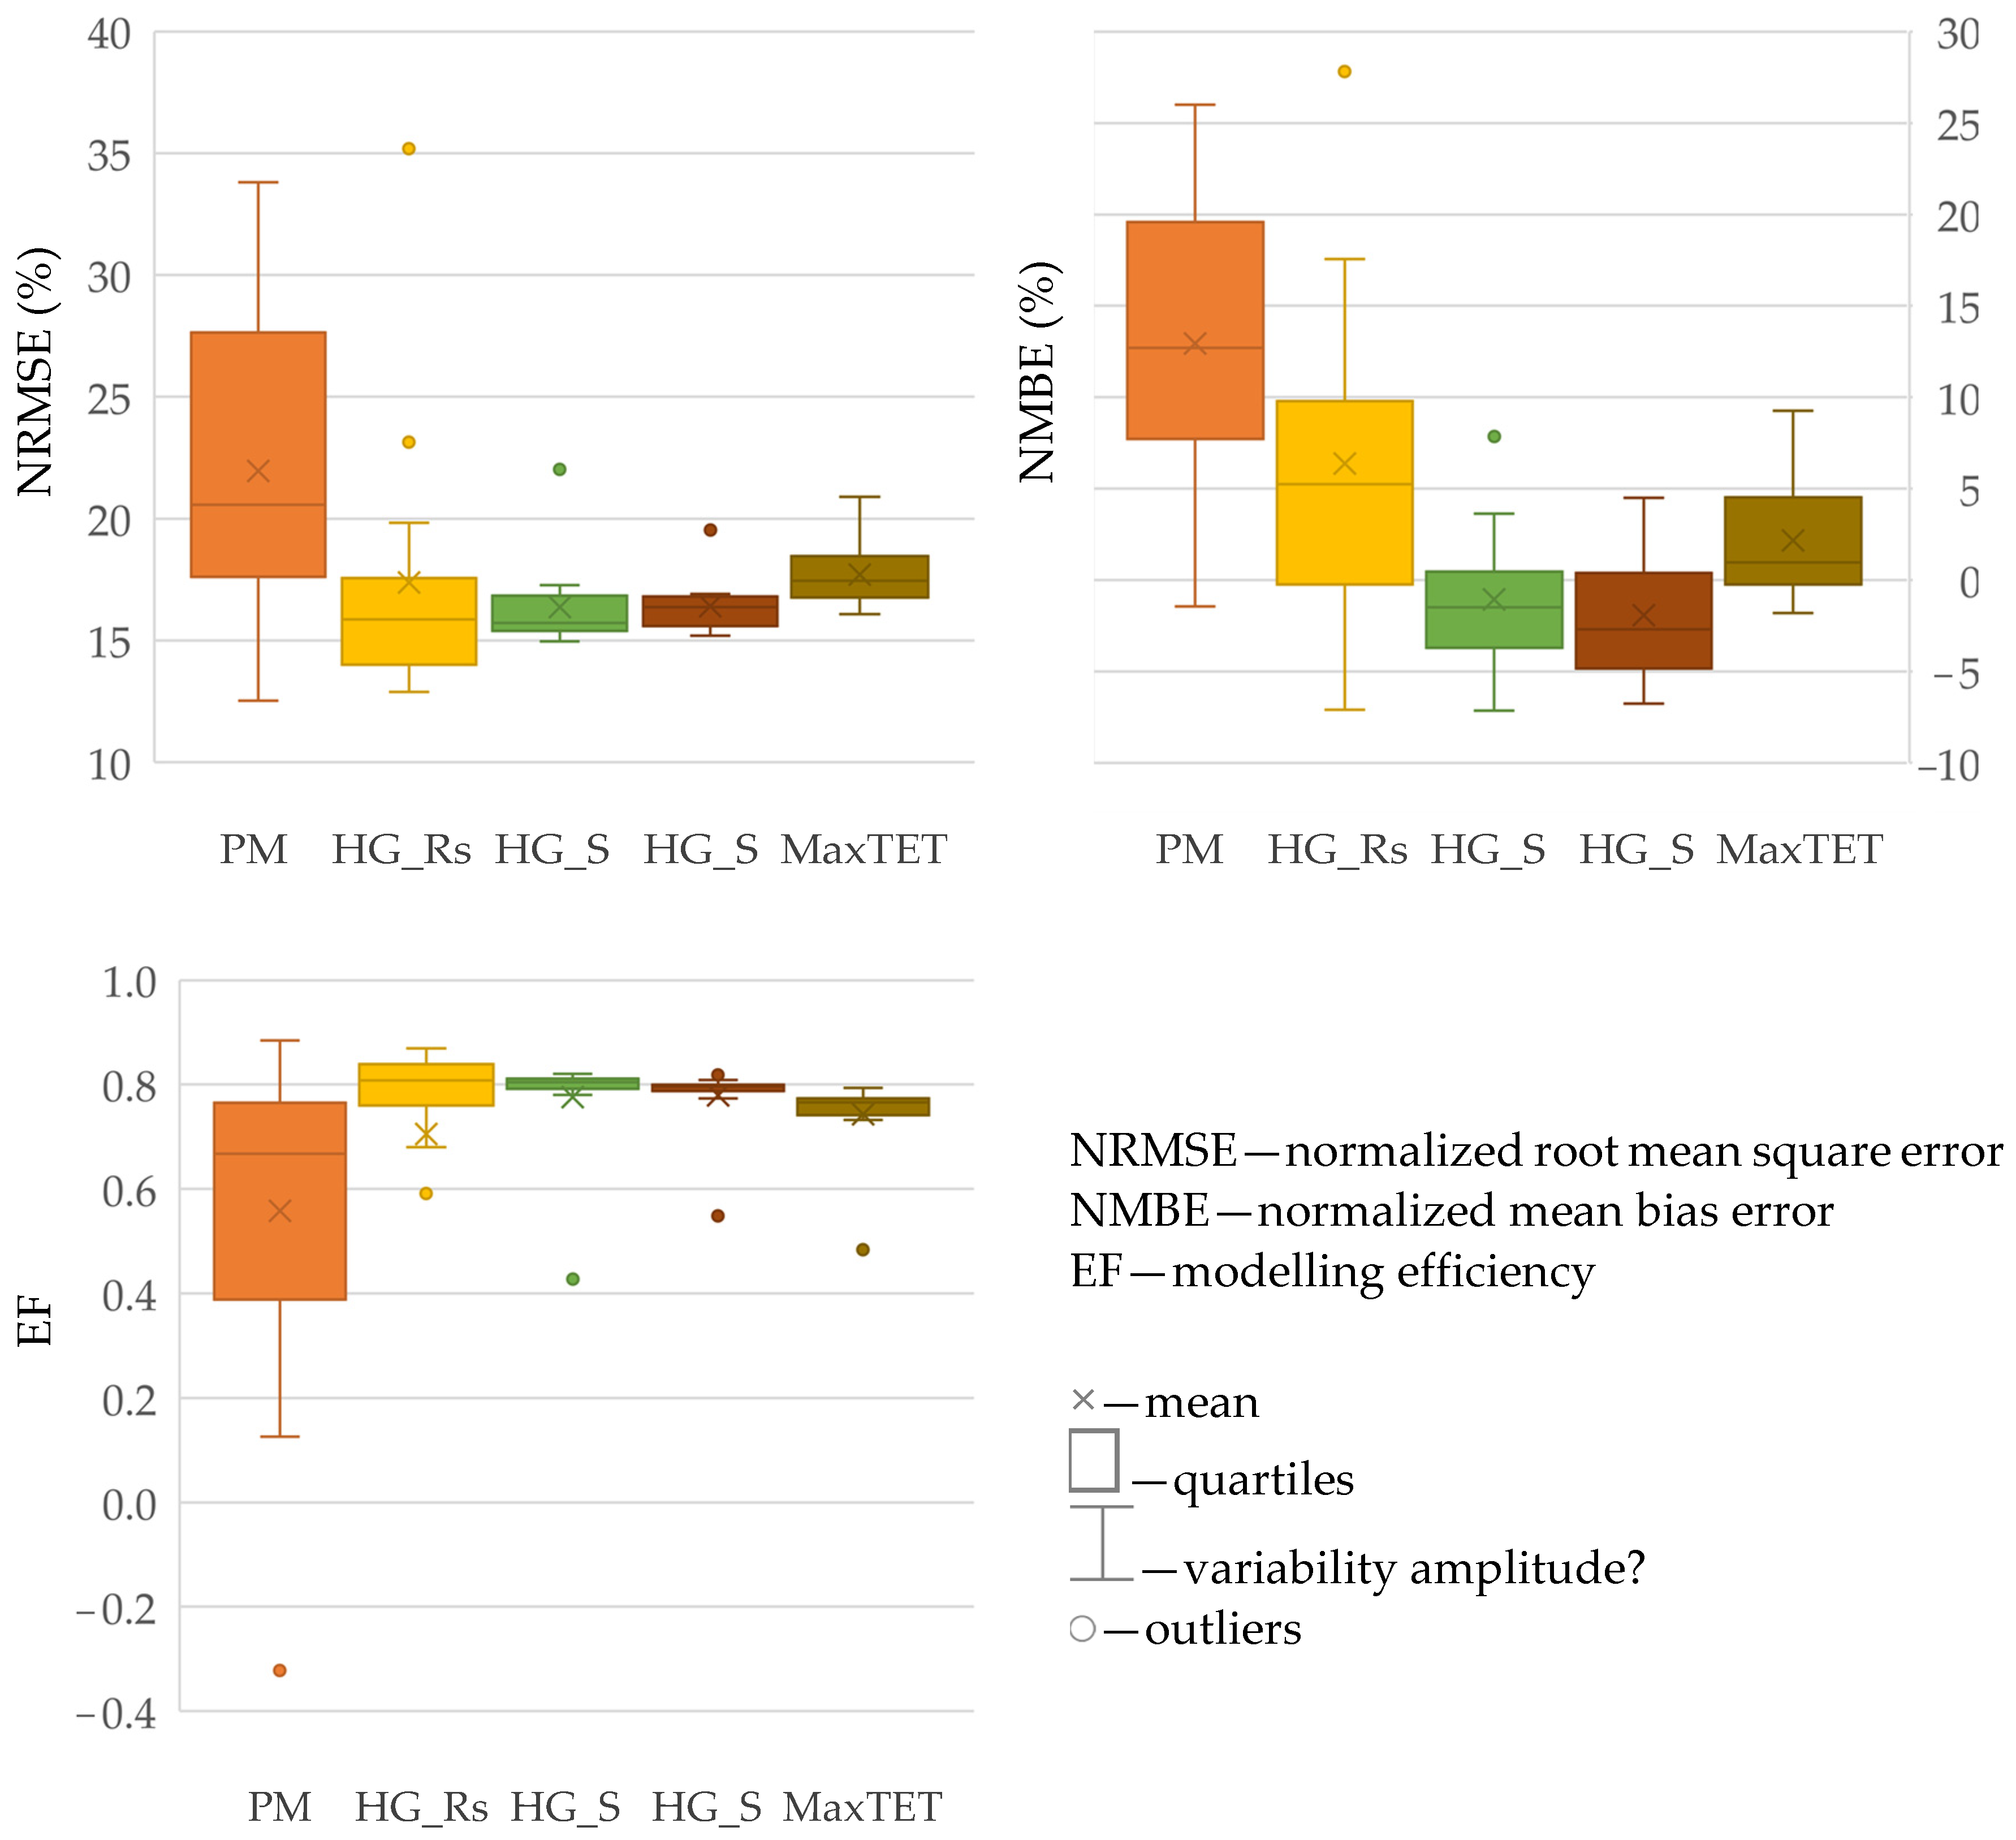
For each location, daily ETo was computed with raw NASA POWER data relative to the nearest grid point and compared with ETo PM from observed data. Table 3 presents the frequencies of the various statistical accuracy indicators shows for all the ETo estimation methods. Full results are presented in Supplementary Table S1. A good accuracy between daily observed ETo and NASA POWER ETo estimated with all methods was observed in most locations (R2 > 0.70). However, a tendency for over-estimating ETo PM was observed, with b > 1.05 in for most locations (12 out 14). Actually, NRMSE and NMBE (Figure 1), when computing ETo from the PM method, led to worst results than when estimating reference evapotranspiration when using the temperature-based methods; in fact, PM proved to be inefficient (EF < 0.75, Figure 1) for more than half of the locations. These can be explained due to low accuracy in RH and u2 estimation by NASA POWER, as discussed by Rodrigues and Braga [46]. Similar results were found by Negm et al. [44] for Sicily, with RMSE varying from 0.68 to 1.27 mm d−1 and MBE varying between −0.39 and 0.73 mm d−1. Comparable results were also found by Paredes et al. [53], for Portugal, when estimating ETo PM from ERA-Interim data. When estimating ETo PM from ERA5-Land and UERRA MESCAN-SURFEX data, Pelosi et al. [54] also found similar NRMSE, averaging 17% and 22% for each data source, respectively. HS_Rs led to slightly better results, with half the locations showing a b close to 1.0 (0.95 ≤ b < 1.05). Despite leading to RMSE higher than 0.70 mm d−1 for most locations, the remaining methods, HS_S, HS_M, and MaxTET, tend to efficiently estimate ETo for most locations (EF > 0.75, Figure 2), indicating that the mean square errors were generally smaller than the observed ETo variance. These results are in agreement with the ones obtained in previous studies for similar climates [55,56,57], where the HS method was compared with PM for ETo estimations. As for the MaxTET method, Rodrigues and Braga [30] obtained similar RMSE values when comparing observed-based ETo estimation using that procedure with PM ETo computations. Figure 2 also shows that both HS_S and HS_M lead to low underestimation (NMBE close to 0%) for most locations, while MaxTET tends to slightly overestimate NASA POWER ETo.
Thus, although computing ETo without a bias correction leads to acceptable results, it is appropriate to assess the accuracy of NASA ETo estimation with bias correction, as analyzed in the next sections.
3.2. Accuracy Assessment of Daily ETo Estimates with Bias Corrected NASA POWER Data
Table 4 and Table 5 show that, when computing daily ETo from bias-corrected NASA POWER data, the accuracy of estimation increases when compared with the results obtained from raw NASA POWER reanalysis weather variables (Table 4). Full results are presented in Supplementary Tables S2 and S3 for ETo derived from regionally and locally bias-corrected NASA POWER data, respectively. When a regional bias correction is performed, RMSE and MBE tend to decrease for NASA POWER based PM and HS_Rs ETo estimations; however, for this dataset, HS_S, HS_M, and MaxTET tend to overestimate ETo for most locations (MBE > 0 mm d−1 for more than 12 locations). Nonetheless, when computing ETo from locally bias-corrected NASA POWER weather data, the temperature-based methods show small over or underestimation of ETo—0.95 ≤ b < 1.05 and −0.40 mm d−1 ≤ MBE < 0.40 mm d−1. As for PM, ETo is still underestimated for 13 locations (MBE < 0 mm d−1).
Despite these results, PM shows a significant improvement when computing ETo from regionally and locally bias-corrected NASA POWER data, leading to RMSE lower than 0.70 mm d−1 for 8 and 11 locations, respectively. Paredes et al. [53,58] found that when bias correcting PM ETo, mean RMSE tends to be lower. Srivastava et al. [59] also concluded that when imposing a probabilistic bias correction to NCEP reanalysis datasets substantially improves PM ETo estimations. Similar accuracy is found for HS_Rs, with 8 and 10 locations having an RMSE that ranges from 0.50 to 0.70 mm d−1, for the same datasets, respectively. However, for HS_S, HS_M, and MaxTET methods, there is no significant RMSE improvement when adopting the bias-corrected NASA POWER datasets. Similar results were obtained by Rodrigues and Braga [31] when estimating ETo from observed data using temperature-based methods.
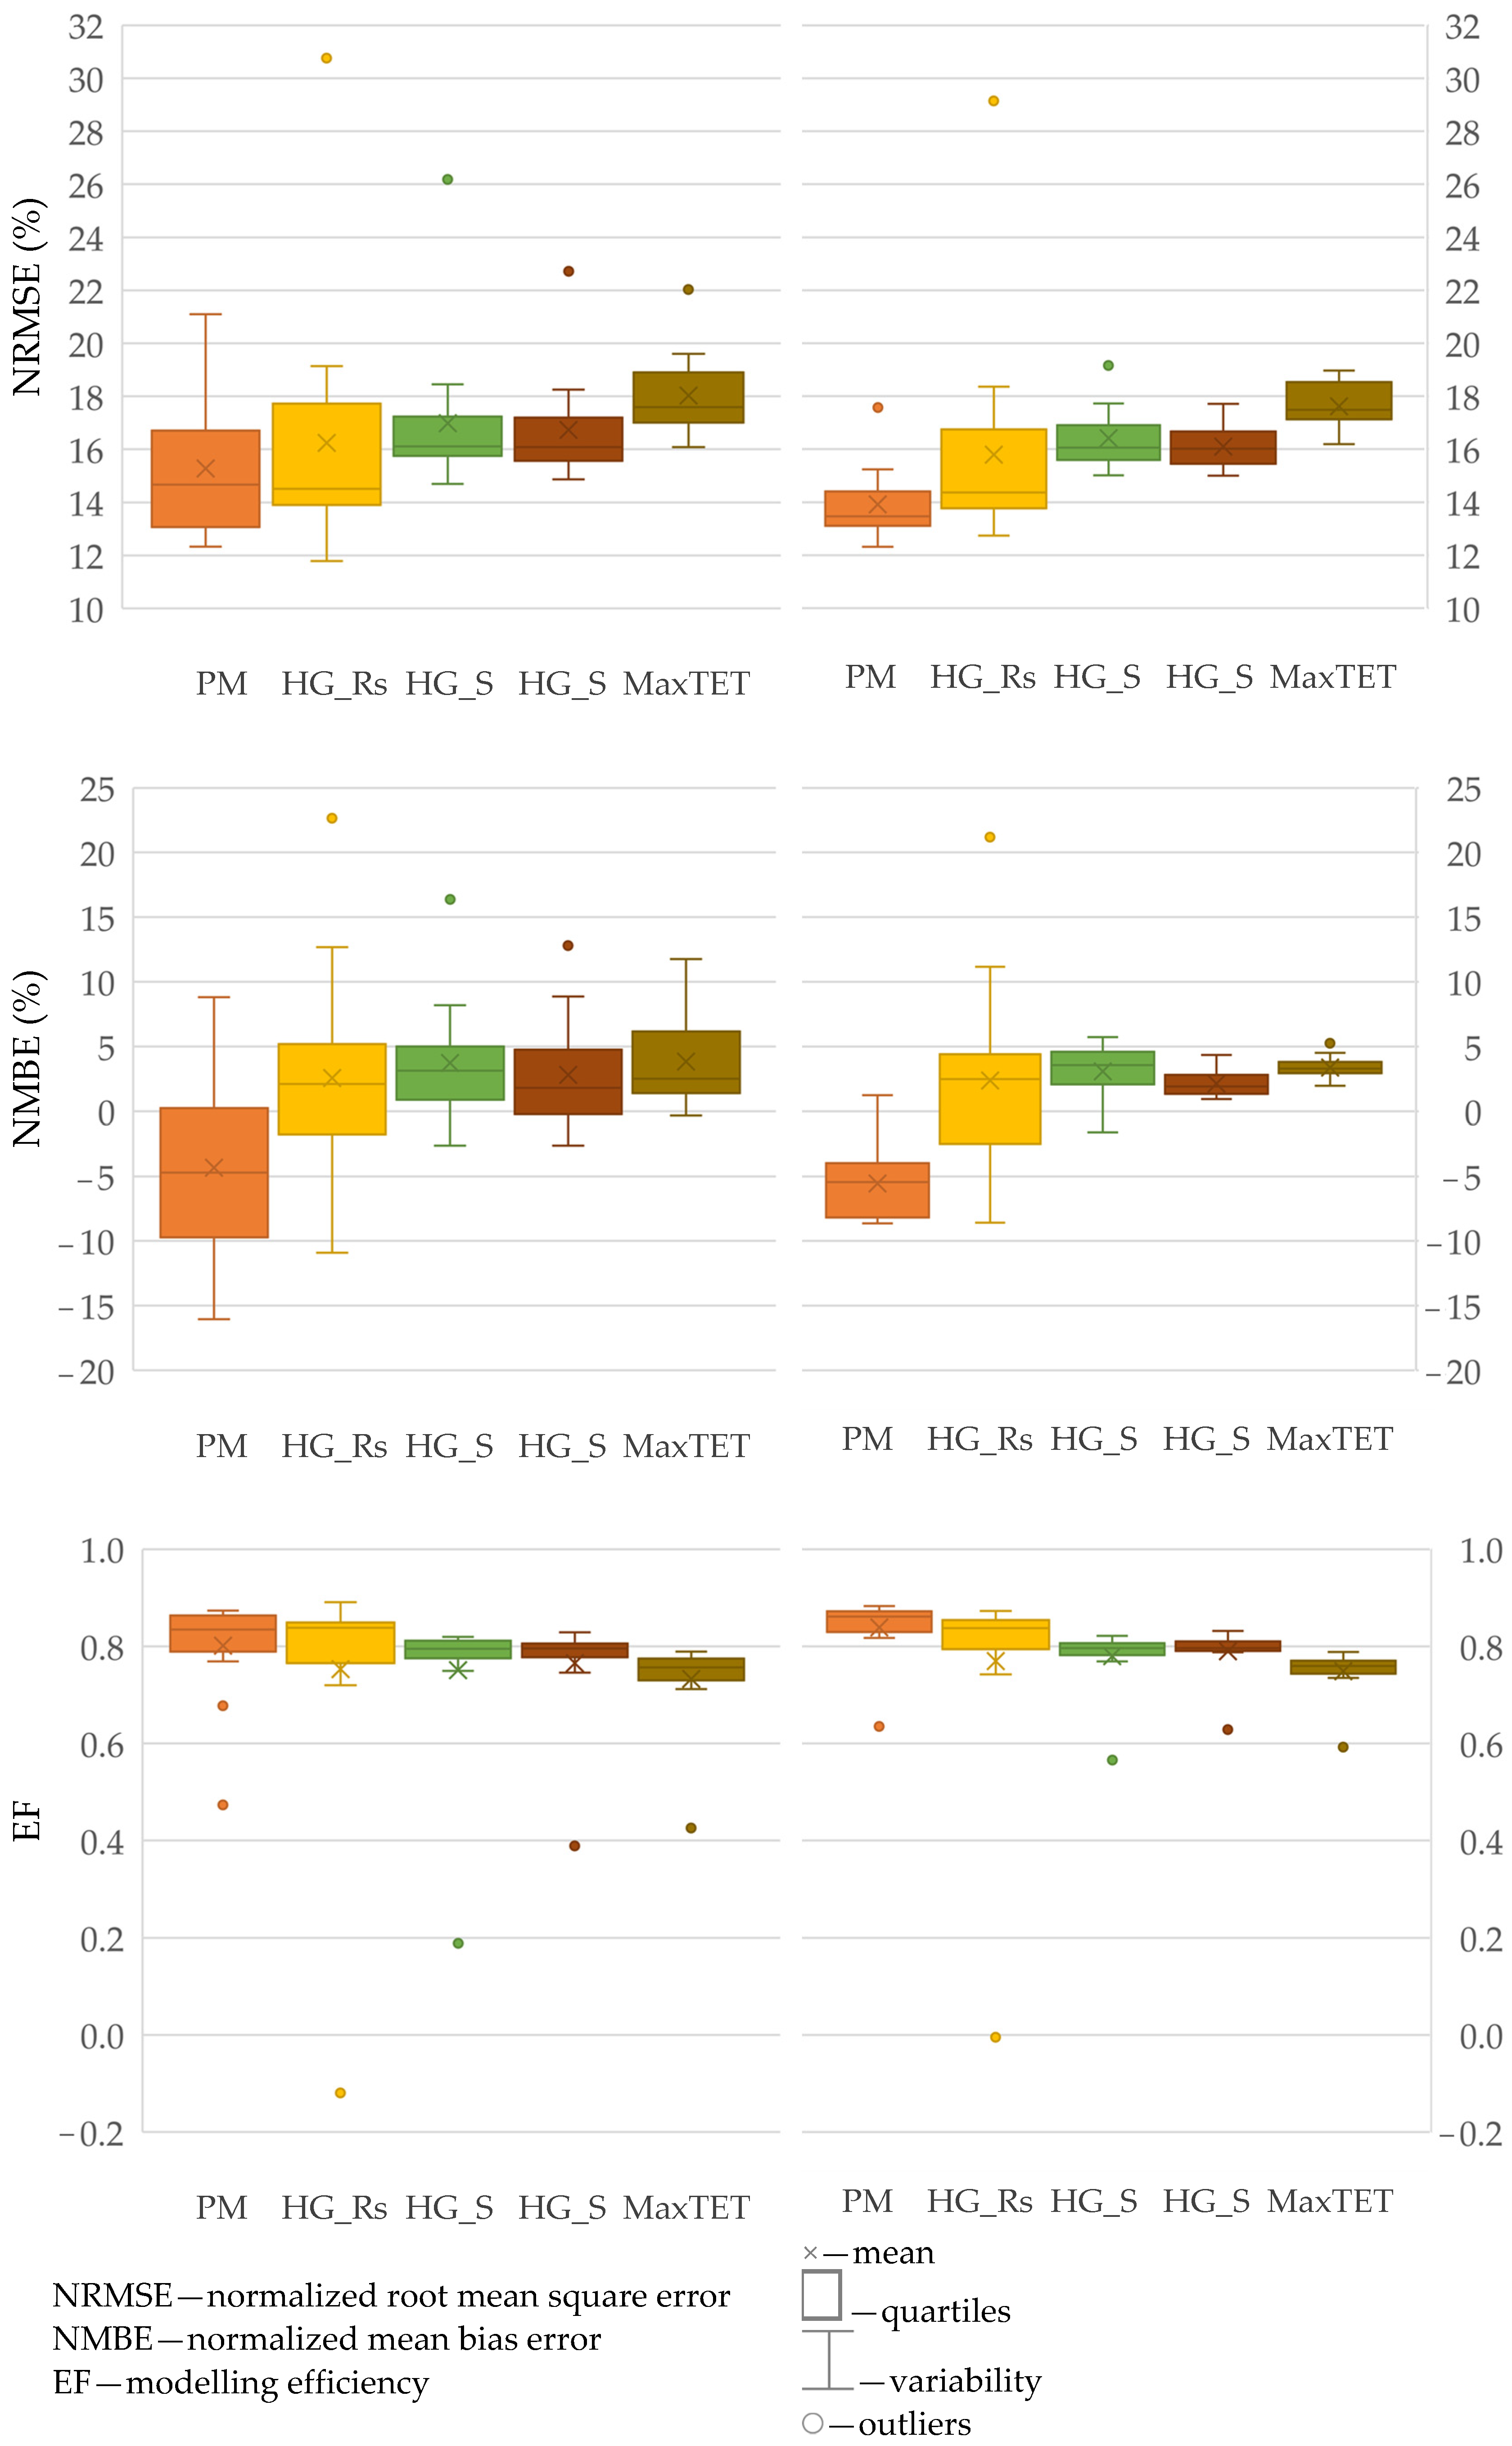
Figure 2 shows box plots of normalized root mean square error, normalized mean bias error, and modeling efficiency for both regionally and locally bias-corrected NASA POWER data using all methods and relative to all locations. Results show that, when computing daily ETo from locally bias-corrected data, the estimations tend to improve both in terms of estimation error (NRMSE and NMBE) and modeling efficiency (EF). All methods showed improved and smaller ranges for all accuracy indicators, especially for PM. Despite not being so significant as for PM, the accuracy for the temperature-based methods is worth noting, especially for the HS_S, HSM, and MaxTET. It can be concluded that ETo estimation based on NASA POWER datasets can be improved when bias correcting reanalysis weather datasets. Similar conclusions were drawn by Duhan et al. [60]; the authors found that after applying bias correction, satellite-based data can be used to estimate potential evapotranspiration.
3.3. Most Accurate Daily ETo Estimation Methods Per Location from NASAPOWER Data with and without Bias Correction
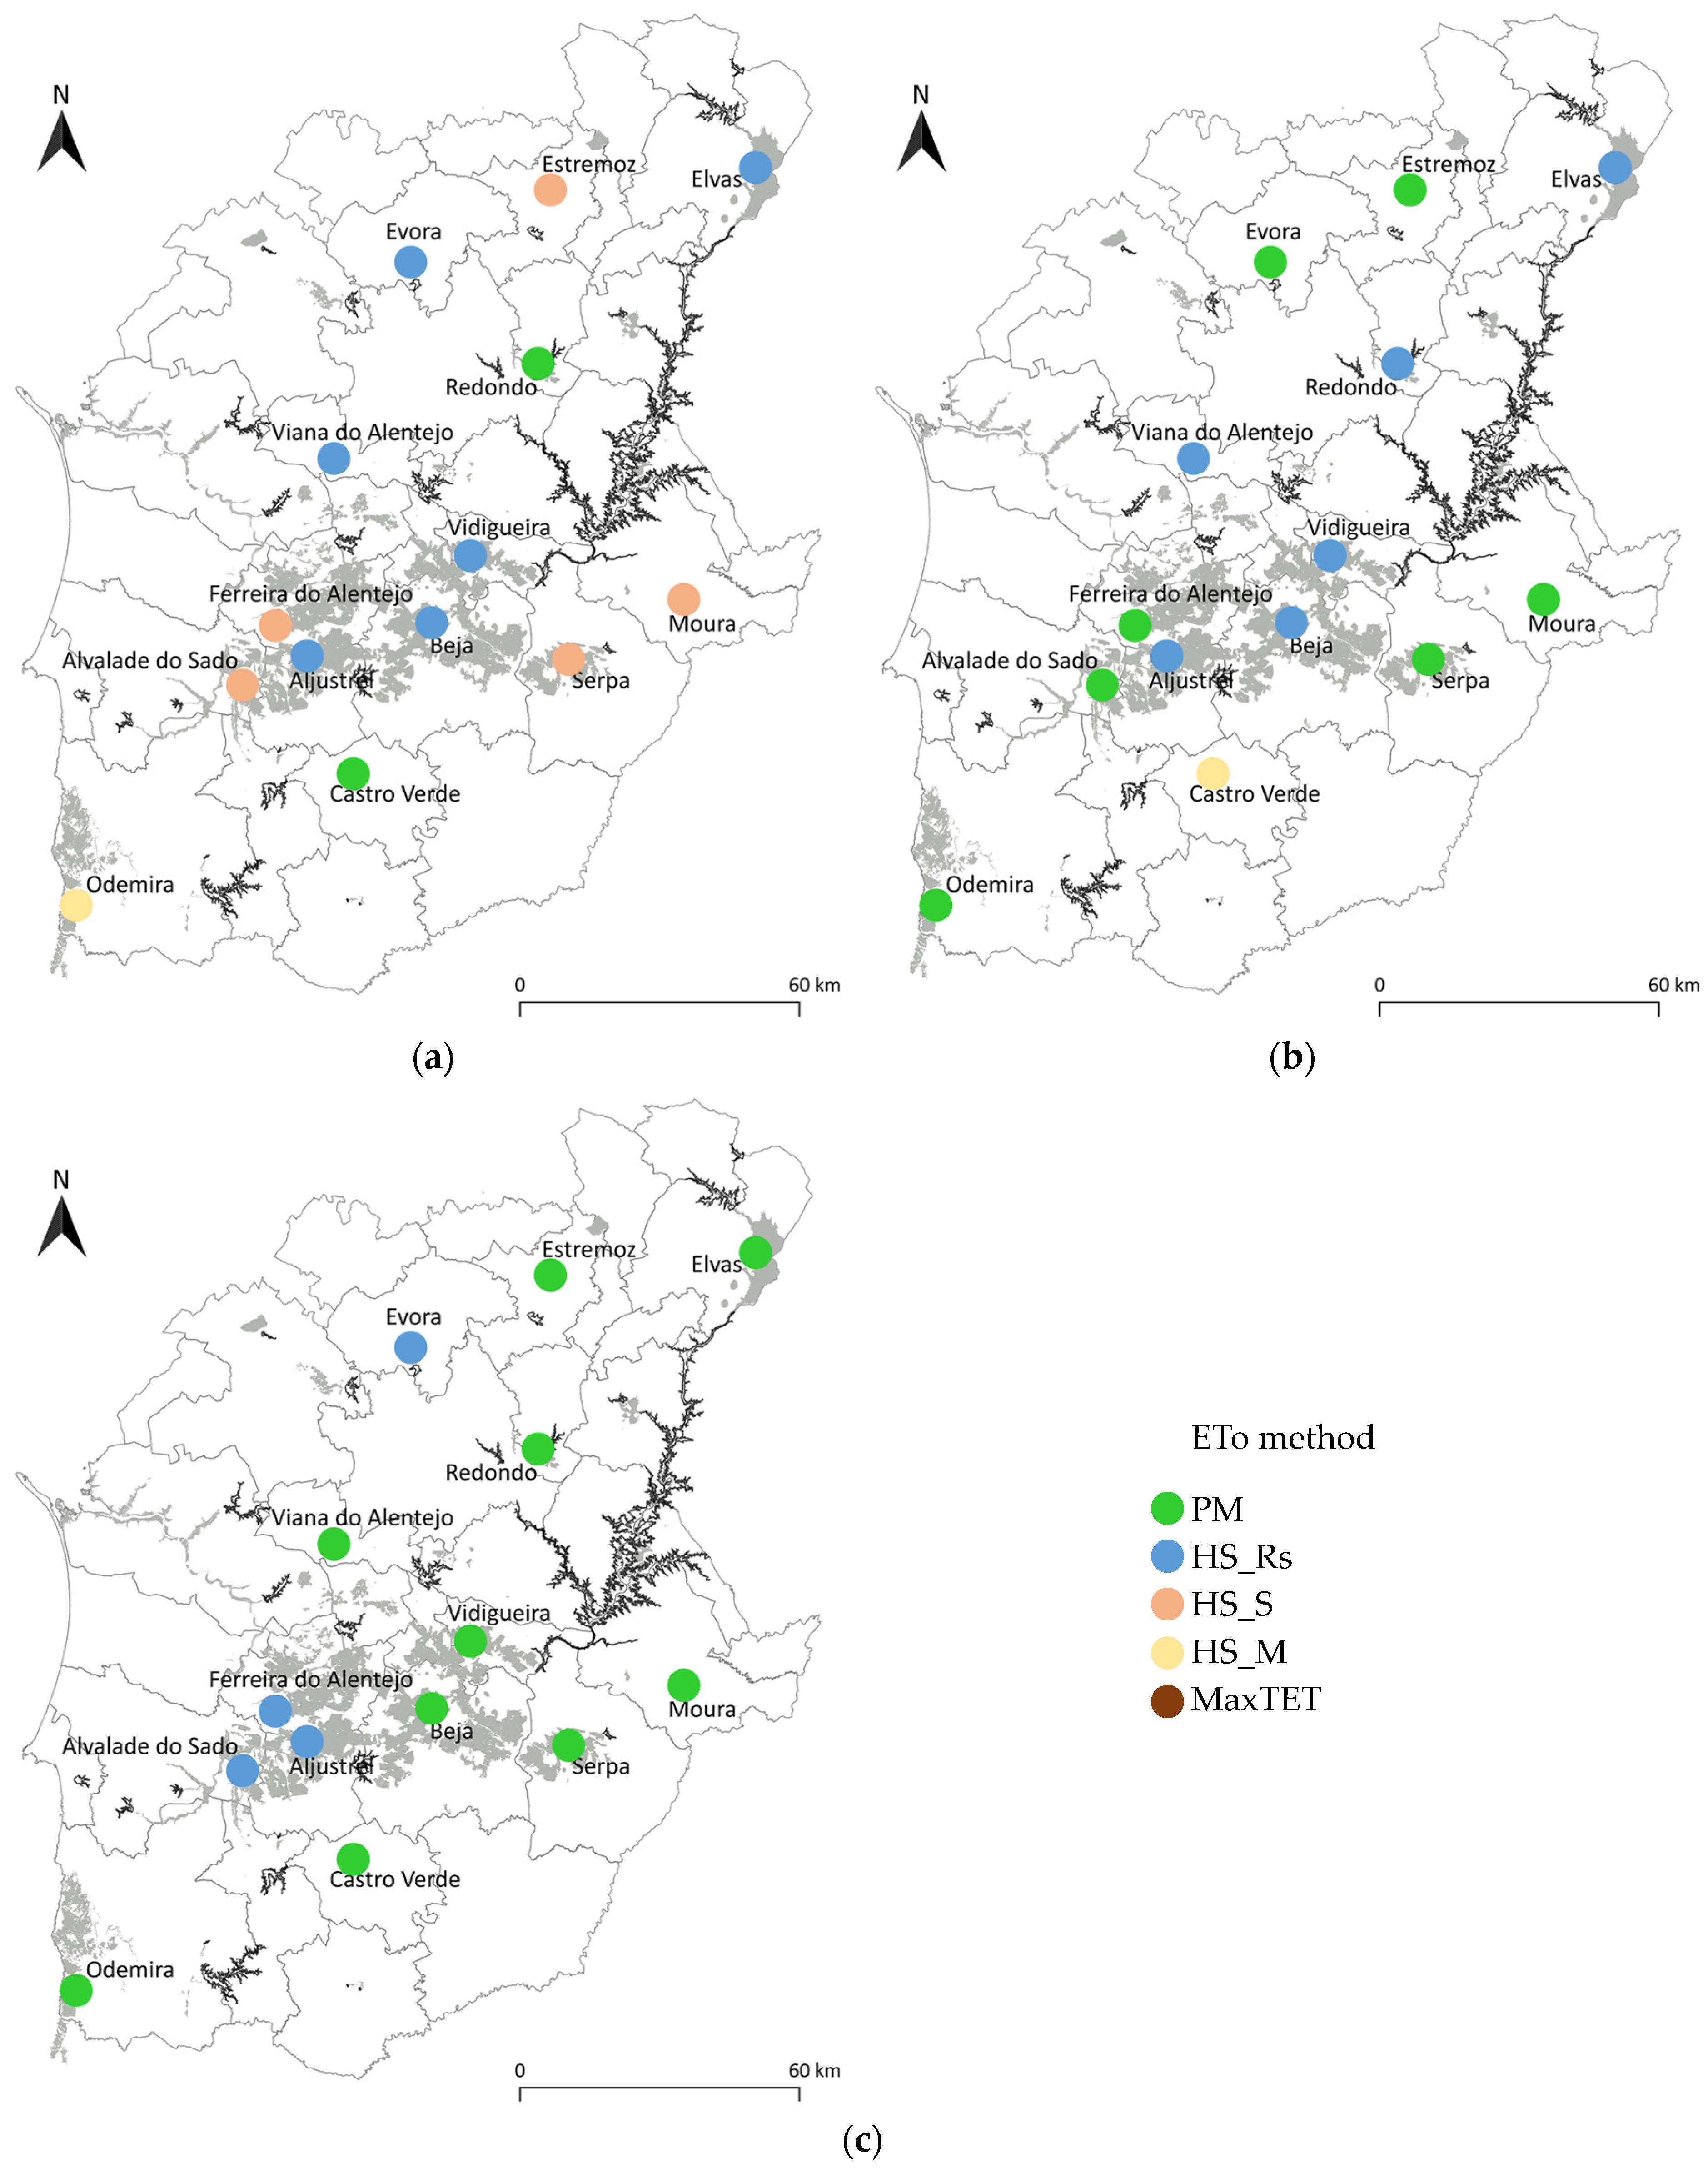
Based on the results presented in Supplementary Tables S1–S3, Figure 3 presents the most accurate ETo estimation method for each location with uncorrected bias, regional bias correction, and local bias correction. Each method was selected based on the lowest RMSE obtained for each location.
When NASA POWER raw data is used to estimate ETo, HS_Rs is the most accurate method, providing the lowest RMSE for half the locations; HS_S proves to be the second-best, leading to the lower RMSE for five locations. It can be concluded the impact of small to average accuracy between observed and reanalysis relative humidity and wind speed data, as concluded by Rodrigues and Braga [46], leads to lower accuracy when estimating ETo using the PM method from NASA POWER. Contrarily, and since NASA POWER’s maximum and minimum temperatures and solar radiation showed high accuracy with observed data, the HS method proved to be the most accurate to estimate ETo based on reanalysis data.
If a data regional bias correction is adopted, PM leads to the most accurate ETo estimation for half the locations, followed by HS using Rs, leading to the best results for six locations. On the other hand, when a local bias correction is performed, PM proved the be the most accurate ETo estimation method for 10 locations. This behavior can be explained due to, as discussed by Rodrigues and Braga [46], the improvement of maximum and minimum temperatures is not substantial, leading to low improvements when estimating ETo from temperature-based methods. Contrarily, a bias correction tends to significantly increase the accuracy of estimation of both relative humidity and wind speed [46]; this can explain the improvement of performance ETo estimation when adopting PM when comparing bias-corrected with raw NASA POWER weather datasets.
4. Conclusions
This study aimed to evaluate the accuracy of daily reference evapotranspiration (ETo) estimations derived from NASA POWER datasets when using three different methods—PM, HS, and MaxTET. and two approaches to estimate ETo from bias-corrected NASA POWER weather data.
Results show that even when using raw NASA POWER datasets, a good accuracy between observed ETo and NASA POWER’s ETo estimated with all methods was observed in most locations with R2 higher than 0.70. and RMSE lower than 1.41 mm d−1. When adopting raw datasets, temperature-based methods show higher accuracy than PM, with HS_Rs proving to be the most accurate method, providing the lowest RMSE for half the locations.
When estimating ETo from bias-corrected NASA POWER data, the estimation errors (RMSE and MBE) tend to decrease. If a local bias correction is adopted, HS and MaxTET methods show a small over or underestimation of ETo. If data regional bias correction is used, PM leads to the most accurate ETo estimation for half the locations; also, when a local bias correction is performed, PM proved the be the most accurate ETo estimation method for 10 locations, with an RMSE never higher than 0.77 mm d−1. Nonetheless, MaxTET proved to be an accurate method; its simplicity may prove to be successful not only when only maximum temperature data is available but also due to the low data required for ETo estimation.
Regardless of the estimation errors, the results of this study showed that the NASA POWER reanalysis products are suitable to estimate ETo over areas where most of the climate variables may not be available.
Supplementary Materials
The following are available online at https://0-www-mdpi-com.brum.beds.ac.uk/article/10.3390/agronomy11102077/s1, Table S1: Accuracy metrics relative to NASA POWER reference evapotranspiration without bias correction for all 14 locations, Table S2: Accuracy metrics relative to NASA POWER reference evapotranspiration with regional bias correction for all 14 locations, Table S3: Accuracy metrics relative to NASA POWER reference evapotranspiration with local bias correction for all 14 locations.
Author Contributions
Conceptualization, G.C.R. and R.P.B.; methodology, G.C.R. and R.P.B.; Data analysis, G.C.R.; Writing—Original draft preparation, G.C.R.; Writing—Review and editing, G.C.R. and R.P.B. All authors have read and agreed to the published version of the manuscript.
Funding
This research received no external funding.
Data Availability Statement
Weather data was obtained from COTR and are available at http://www.cotr.pt/servicos/sagranet.php (accessed on 1 November 2020) with the permission of COTR.
Acknowledgments
Authors acknowledge FCT—Fundação para a Ciência e a Tecnologia, I.P.—LEAF Research Centre (Ref. UIDB/04129/2020) and COTR—Irrigation Operation and Technology Center.
Conflicts of Interest
The authors declare no conflict of interest.
References
- Jensen, M.E.; Allen, R.G. (Eds.) Evaporation, Evapotranspiration, and Irrigation Water Requirements; American Society of Civil Engineers: Reston, VA, USA, 2016. [Google Scholar]
- Allen, R.G.; Pereira, L.S.; Raes, D.; Smith, M. Crop evapotranspiration. In Guidelines for Computing Crop Water Requirements. Irrigation and Drainage Paper 56; FAO: Rome, Italy, 1998; p. 300. [Google Scholar]
- Doorenbos, J.; Pruitt, W.O. Guidelines for predicting crop-water requirements. In FAO Irrigation and Drainage Paper No. 24, 2nd ed.; FAO: Rome, Italy, 1977; 156p. [Google Scholar]
- Wright, J.L.; Jensen, M.E. Development and evaluation of evapotranspiration models for irrigation scheduling. Trans. ASAE 1978, 21, 0088–0091. [Google Scholar] [CrossRef]
- Jensen, M.E.; Burman, R.D.; Allen, R.G. Evapotranspiration and Irrigation Water Requirements; ASCE: Reston, VA, USA, 1990. [Google Scholar]
- Allen, R.G.; Wright, J.L.; Pruitt, W.O.; Pereira, L.S.; Jensen, M.E. Water requirements. In Design and Operation of Farm Irrigation Systems, 2nd ed.; Hoffman, G.J., Evans, R.G., Jensen, M.E., Martin, D.L., Elliot, R.L., Eds.; ASABE: St. Joseph, MI, USA, 2007; pp. 208–288. [Google Scholar]
- Howell, T.A.; Evett, S.R.; Tolk, J.A.; Schneider, A.D. Evapotranspiration of full-, deficit-irrigated, and dryland cotton on the Northern Texas High Plains. J. Irrig. Drain. Eng. 2004, 130, 277–285. [Google Scholar] [CrossRef]
- Steduto, P.; Hsiao, T.C.; Raes, D.; Fereres, E. AquaCrop—The FAO crop model to simulate yield response to water: I. Concepts and underlying principles. Agron. J. 2009, 101, 426–437. [Google Scholar] [CrossRef] [Green Version]
- Rodrigues, G.C.; Pereira, L.S. Assessing economic impacts of deficit irrigation as related to water productivity and water costs. Biosyst. Eng. 2009, 103, 536–551. [Google Scholar] [CrossRef] [Green Version]
- Paredes, P.; Rodrigues, G.C.; Alves, I.; Pereira, L.S. Partitioning evapotranspiration, yield prediction and economic returns of maize under various irrigation management strategies. Agric. Water Manag. 2014, 135, 27–39. [Google Scholar] [CrossRef]
- Beguería, S.; Vicente-Serrano, S.M.; Reig, F.; Latorre, B. Standardized precipitation evapotranspiration index (SPEI) revisited: Parameter fitting, evapotranspiration models, tools, datasets and drought monitoring. Int. J. Climatol. 2014, 34, 3001–3023. [Google Scholar] [CrossRef] [Green Version]
- McEvoy, D.J.; Huntington, J.L.; Mejia, J.F.; Hobbins, M.T. Improved seasonal drought forecasts using reference evapotranspiration anomalies. Geophys. Res. Lett. 2016, 43, 377–385. [Google Scholar] [CrossRef] [Green Version]
- Zeng, Z.; Wu, W.; Zhou, Y.; Li, Z.; Hou, M.; Huang, H. Changes in reference evapotranspiration over Southwest China during 1960–2018: Attributions and implications for drought. Atmosphere 2019, 10, 705. [Google Scholar] [CrossRef] [Green Version]
- Paulo, A.A.; Rosa, R.D.; Pereira, L.S. Climate trends and behaviour of drought indices based on precipitation and evapotranspiration in Portugal. Nat. Hazards Earth Syst. Sci. 2012, 12, 1481–1491. [Google Scholar] [CrossRef]
- Allen, R.G.; Clemmens, A.J.; Burt, C.M.; Solomon, K.; O’Halloran, T. Prediction accuracy for project wide evapotranspiration using crop coefficients and reference evapotranspiration. J. Irrig. Drain. Eng. 2005, 131, 24–36. [Google Scholar] [CrossRef] [Green Version]
- Allen, R.G.; Pruitt, W.O.; Wright, J.L.; Howell, T.A.; Ventura, F.; Snyder, R.; Itenfisu, D.; Steduto, P.; Berengena, J.; Yrisarry, J.B.; et al. A recommendation on standardized surface resistance for hourly calculation of reference ETo by the FAO56 Penman-Monteith method. Agric. Water Manag. 2006, 81, 1–22. [Google Scholar] [CrossRef]
- Trajkovic, S. Temperature-based approaches for estimating reference evapotranspiration. J. Irrig. Drain. Eng. 2005, 131, 316–323. [Google Scholar] [CrossRef]
- Adeboye, O.B.; Osunbitan, J.A.; Adekalu, K.O.; Okunade, D.A. Evaluation of FAO-56 Penman-Monteith and temperature based models in estimating reference evapotranspiration using complete and limited data, application to Nigeria. Agric. Eng. Int. 2009, XI, 1–25. [Google Scholar]
- Sentelhas, P.C.; Gillespie, T.J.; Santos, E.A. Evaluation of FAO Penman—Monteith and alternative methods for estimating reference evapotranspiration with miss-ing data in Southern Ontario, Canada. Agric. Water Manag. 2010, 97, 635–644. [Google Scholar] [CrossRef]
- Mohawesh, O.E.; Talozi, S.A. Comparison of Hargreaves and FAO56 equations for estimating monthly evapotranspiration for semi-arid and arid environments. Arch. Agron. Soil Sci. 2012, 58, 321–334. [Google Scholar] [CrossRef]
- Cobaner, M.; Citakoğlu, H.; Haktanir, T.; Kisi, O. Modifying Hargreaves–Samani equation with meteorological variables for estimation of reference evapotranspiration in Turkey. Hydrol. Res. 2017, 48, 480–497. [Google Scholar] [CrossRef]
- Song, X.; Lu, F.; Xiao, W.; Zhu, K.; Zhou, Y.; Xie, Z. Performance of 12 reference evapotranspiration estimation methods compared with the Penman-Monteith method and the potential influences in northeast China. Meteorol. Appl. 2019, 26, 83–96. [Google Scholar] [CrossRef] [Green Version]
- Paredes, P.; Fontes, J.C.; Azevedo, E.B.; Pereira, L.S. Daily reference crop evapotranspiration in the humid environments of Azores islands using reduced data sets: Accuracy of FAO-PM temperature and Hargreaves-Samani methods. Theor. Appl. Climatol. 2018, 134, 595–611. [Google Scholar] [CrossRef]
- Droogers, P.; Allen, R.G. Estimating reference evapotranspiration under inaccurate data conditions. Irrig. Drain. Syst. 2002, 16, 33–45. [Google Scholar] [CrossRef]
- Hargreaves, G.H.; Samani, Z.A. Reference crop evapotranspiration from temperature. Appl. Eng. Agric. 1985, 1, 96–99. [Google Scholar] [CrossRef]
- Baier, W.; Robertson, G.W. Estimation of latent evaporation from simple weather observations. Can. J. Plant Sci. 1965, 45, 276–284. [Google Scholar] [CrossRef]
- Berti, A.; Tardivo, G.; Chiaudani, A.; Rech, F.; Borin, M. Assessing reference evapotranspiration by the Hargreaves method in north-eastern Italy. Agric. Water Manag. 2014, 140, 20–25. [Google Scholar] [CrossRef]
- Schendel, U. Vegetations Wasserverbrauch und Wasserbedarf; Habilitation: Kiel, Germany, 1967; p. 137. [Google Scholar]
- Trajkovic, S. Hargreaves versus penman-monteith under humid conditions. J. Irrig. Drain. Eng. 2007, 133, 38–42. [Google Scholar] [CrossRef]
- Rodrigues, G.C.; Braga, R.P. Estimation of reference evapotranspiration during the irrigation season using nine temperature-based methods in a hot-summer Mediterranean climate. Agriculture 2021, 11, 124. [Google Scholar] [CrossRef]
- Rodrigues, G.C.; Braga, R.P. A Simple procedure to estimate reference evapotranspiration during the irrigation season in a hot-summer Mediterranean climate. Sustainability 2021, 13, 349. [Google Scholar] [CrossRef]
- Aboelkhair, H.; Mostafa, M.; El Afandi, G. Assessment of agroclimatology NASA POWER reanalysis datasets for temperature types and relative humidity at 2 m against ground observations over Egypt. Adv. Space Res. 2019, 64, 129–142. [Google Scholar] [CrossRef]
- Trenberth, K.E.; Toshio, K.; Kazutoshi, O. Progress and prospects for reanalysis for weather and climate. Eos Trans. Am. Geophys. Union 2008, 89, 234–235. [Google Scholar] [CrossRef]
- Sheffield, J.; Gopi, G.; Eric, F.W. Development of a 50-year high-resolution global dataset of meteorological forcings for land surface modeling. J. Clim. 2006, 19, 3088–3111. [Google Scholar] [CrossRef] [Green Version]
- Schneider, D.P.; Deser, C.; Fasullo, J.; Trenberth, K.E. Climate data guide spurs discovery and understanding. Eos Trans. Am. Geophys. Union 2013, 94, 121–122. [Google Scholar] [CrossRef]
- Dee, D.P.; Uppala, S.M.; Simmons, A.J.; Berrisford, P.; Poli, P.; Kobayashi, S.; Andrae, U.; Balmaseda, M.A.; Balsamo, G.; Bauer, P.; et al. The ERA-Interim reanalysis: Configuration and performance of the data assimilation system. Q. J. R. Meteorol. Soc. 2011, 137, 553–597. [Google Scholar] [CrossRef]
- Kobayashi, S.; Ota, Y.; Harada, Y.; Ebita, A.; Moriya, M.; Onoda, H.; Onogi, K.; Kamahori, H.; Kobayashi, C.; Miyaoka, K.; et al. The JRA-55 reanalysis: General specifications and basic characteristics. J. Meteorol. Soc. Jpn. Ser. II 2015, 93, 5–48. [Google Scholar] [CrossRef] [Green Version]
- Kanamitsu, M.; Ebisuzaki, W.; Woollen, J.; Yang, S.K.; Hnilo, J.J.; Fiorino, M.; Potter, G.L. Ncep–doe amip-ii reanalysis (r-2). Bull. Am. Meteorol. Soc. 2002, 83, 1631–1644. [Google Scholar] [CrossRef]
- Rienecker, M.M.; Suarez, M.J.; Gelaro, R.; Todling, R.; Bacmeister, J.; Liu, E.; Bosilovich, M.G.; Schubert, S.D.; Takacs, L.; Kim, G.K.; et al. MERRA: NASA’s modern-era retrospective analysis for research and applications. J. Clim. 2011, 24, 3624–3648. [Google Scholar] [CrossRef]
- Chandler, W.S.; Hoell, J.M.; Westberg, D.; Zhang, T.; Stackhouse, P.W., Jr. NASA prediction of worldwide energy resource high resolution meteorology data for sustainable building design. In Proceedings of the Solar 2013 Conference of American Solar Energy Society, Baltimore, MD, USA, 16–20 April 2013. [Google Scholar]
- Sheffield, J.; Ziegler, A.D.; Wood, E.F.; Chen, Y. Correction of the high-latitude rain day anomaly in the NCEP–NCAR reanalysis for land surface hydrological modeling. J. Clim. 2004, 17, 3814–3828. [Google Scholar] [CrossRef] [Green Version]
- White, J.W.; Hoogenboom, G.; Stackhouse, P.W.; Hoell, J.M. Evaluation of NASA satellite- and assimilation model-derived longterm daily temperature data over the continental US. Agric. For. Meteorol. 2008, 148, 1574–1584. [Google Scholar] [CrossRef] [Green Version]
- Bai, J.; Chen, X.; Dobermann, A.; Yang, H.; Cassman, K.; Zhang, F. Evaluation of NASA satellite- and model-derived weather data for simulation of maize yield potential in China. Agron. J. 2010, 102, 9–16. [Google Scholar] [CrossRef]
- Negm, A.; Jabro, J.; Provenzano, G. Assessing the suitability of American National Aeronautics and Space Administration (NASA) agro-climatology archive to predict daily meteorological variables and reference evapotranspiration in Sicily, Italy. Agric. For. Meteorol. 2017, 244, 111–121. [Google Scholar] [CrossRef]
- Monteiro, A.L.; Sentelhas, P.C.; Pedra, G.U. Assessment of NASA/POWER satellite-based weather system for Brazilian conditions and its impact on sugarcane yield simulation. Int. J. Climatol. 2018, 38, 1571–1581. [Google Scholar] [CrossRef]
- Rodrigues, G.C.; Braga, R.P. Evaluation of NASA POWER reanalysis products to estimate daily weather variables in a hot summer mediterranean climate. Agronomy 2021, 11, 1207. [Google Scholar] [CrossRef]
- Ndiaye, P.M.; Bodian, A.; Diop, L.; Deme, A.; Dezetter, A.; Djaman, K.; Ogilvie, A. Trend and sensitivity analysis of reference evapotranspiration in the Senegal river basin using NASA meteorological data. Water 2020, 12, 1957. [Google Scholar] [CrossRef]
- Srivastava, P.K.; Singh, P.; Mall, R.K.; Pradhan, R.K.; Bray, M.; Gupta, A. Performance assessment of evapotranspiration estimated from different data sources over agricultural landscape in Northern India. Theor. Appl. Climatol. 2020, 140, 145–156. [Google Scholar] [CrossRef]
- Rodrigues, G.C.; Braga, R.P. A simple application for computing reference evapotranspiration with various levels of data availability—ETo tool. Agronomy 2021. submitted. [Google Scholar]
- Henseler, J.; Ringle, C.; Sinkovics, R. The use of partial least squares path modeling in international marketing. In New Challenges to International Marketing; Emerald Group Publishing Limited: Bingley, UK, 2009; Volume 20, pp. 277–320. [Google Scholar]
- Nash, J.E.; Sutcliffe, J.V. River flow forecasting through conceptual models part I—A discussion of principles. J. Hydrol. 1970, 10, 282–290. [Google Scholar] [CrossRef]
- Legates, D.R.; McCabe, G.J., Jr. Evaluating the use of “goodness-of-fit” measures in hydrologic and hydroclimatic model validation. Water Resour. Res. 1999, 35, 233–241. [Google Scholar] [CrossRef]
- Paredes, P.; Martins, D.S.; Pereira, L.S.; Cadima, J.; Pires, C. Accuracy of daily estimation of grass reference evapotranspi-ration using ERA-Interim reanalysis products with assessment of alternative bias correction schemes. Agric. Water Manag. 2018, 210, 340–353. [Google Scholar] [CrossRef]
- Pelosi, A.; Terribile, F.; D’Urso, G.; Chirico, G.B. Comparison of ERA5-Land and UERRA MESCAN-surfex reanalysis data with spatially interpolated weather observations for the regional assessment of reference evapotranspiration. Water 2020, 12, 1669. [Google Scholar] [CrossRef]
- Tabari, H.; Talaee, P.H. Local calibration of the Hargreaves and Priestley-Taylor equations for estimating reference evapotranspiration in arid and cold climates of Iran based on the Penman-Monteith model. J. Hydrol. Eng. 2011, 16, 837–845. [Google Scholar] [CrossRef]
- Raziei, T.; Pereira, L.S. Estimation of ETo with Hargreaves—Samani and FAO-PM temperature methods for a wide range of climates in Iran. Agric. Water Manag. 2013, 121, 1–18. [Google Scholar] [CrossRef]
- Akhavan, S.; Kanani, E.; Dehghanisanij, H. Assessment of different reference evapotranspiration models to estimate the actual evapotranspiration of corn (Zea mays L.) in a semiarid region (case study, Karaj, Iran). Theor. Appl. Climatol. 2019, 137, 1403–1419. [Google Scholar] [CrossRef]
- Paredes, P.; Trigo, I.; de Bruin, H.; Simões, N.; Pereira, L.S. Daily grass reference evapotranspiration with Meteosat Second Generation shortwave radiation and reference ET products. Agric. Water Manag. 2021, 248, 106543. [Google Scholar] [CrossRef]
- Srivastava, P.K.; Islam, T.; Gupta, M.; Petropoulos, G.; Dai, Q. WRF dynamical downscaling and bias correction schemes for NCEP estimated hydro-meteorological variables. Water Resour. Manag. 2015, 29, 2267–2284. [Google Scholar] [CrossRef]
- Duhan, D.; Singh, D.; Arya, S. Effect of projected climate change on potential evapotranspiration in the semiarid region of central India. J. Water Clim. Chang. 2021, 12, 1854–1870. [Google Scholar] [CrossRef]
Figure 1.
Box plots (Box and whiskers) of normalized root mean square error, normalized mean bias error and modelling efficiency when comparing daily ETo estimated from raw (non-bias-corrected) NASA POWER data using all methods with ETo-PM estimated from observed weather data relative to all locations.

Figure 2.
Box plots (Box and whiskers) of normalized root mean square error, normalized mean bias error and modelling efficiency when comparing daily ETo-PM estimated from observed weather data with ETo estimated from regionally (on the left) and locally (on the right) bias corrected NASA POWER data using all methods and relative to all locations.

Figure 3.
Most accurate daily ETo estimation method for each location with (a) uncorrected bias, (b) regional bias correction and (c) local bias correction.
Figure 3.
Most accurate daily ETo estimation method for each location with (a) uncorrected bias, (b) regional bias correction and (c) local bias correction.


Table 1.
Weather stations range of the weather data series and means and standard deviations of reference evapotranspiration (ETo).
Table 1.
Weather stations range of the weather data series and means and standard deviations of reference evapotranspiration (ETo).
| Weather Station | Period | ETo (mm day−1) | pETo (mm day−1) |
|---|---|---|---|
| Aljustrel | 2001–2019 | 4.7 (±1.7) | 6.4 (±1.1) |
| Alvalade do Sado | 2001–2019 | 4.8 (±1.7) | 6.4 (±1.0) |
| Beja | 2001–2019 | 5.0 (±1.8) | 6.8 (±1.0) |
| Castro Verde | 2001–2019 | 5.3 (±2.0) | 7.3 (±1.2) |
| Elvas | 2001–2019 | 4.9 (±1.8) | 6.8 (±0.9) |
| Estremoz | 2006–2019 | 4.2 (±1.5) | 5.7 (±0.8) |
| Évora | 2002–2019 | 4.5 (±1.6) | 6.1 (±1.0) |
| Ferreira do Alentejo | 2001–2019 | 4.5 (±1.6) | 6.0 (±1.0) |
| Moura | 2001–2019 | 4.4 (±1.6) | 6.1 (±0.8) |
| Odemira | 2002–2019 | 3.8 (±1.1) | 4.4 (±0.9) |
| Redondo | 2001–2019 | 5.1 (±1.9) | 7.0 (±1.1) |
| Serpa | 2004–2019 | 4.8 (±1.7) | 6.5 (±0.9) |
| Viana do Alentejo | 2006–2019 | 4.8 (±1.7) | 6.4 (±1.1) |
| Vidigueira | 2007–2019 | 4.8 (±1.7) | 6.5 (±0.9) |
p—peak month (July).
Table 2.
Method used to estimate ETo and the parameters applied in each equation.
| Method | Code | Reference | Equation | Parameters |
|---|---|---|---|---|
| FAO Penman-Monteith | PM | [2] | H, ϕ, Tavg, Tmax, Tmin, RH, u, n | |
| Hargreaves-Samani | HS_Rs | [25] | ETo = 0.0135 × 0.408Rs × (Tavg + 17.8) | Tmax, Tmin, Rs |
| HS_S1; HS_M2 | ETo = 0.0135 × kRs × 0.408Ra × (Tavg + 17.8) × (Tmax − Tmin)0.5 | Tmax, Tmin, kRs, ϕ | ||
| MaxTET | - | [31] | ETo = kTmax × Tmax | Tmax, kTmax |
ETo is the reference crop evapotranspiration (mm d−1), Rn is the net radiation (MJ m−2 day−1), G is the soil heat flux (MJ m−2 day−1), γ is the psychrometric constant (kPa °C−1), es is the saturation vapor pressure (kPa), ea is the actual vapor pressure (kPa), Δ is the slope of the saturation vapor pressure-temperature curve (kPa °C−1), u2 is the mean daily wind speed at 2 m (m s−1), H is the elevation (m), ϕ is the latitude (rad), Tmax is the maximum air temperature (°C), Tmin is the minimum air temperature (°C), Tavg is the average air temperature (°C), RH is the average relative humidity (%), Ra is the extra-terrestrial radiation (MJ m−2 d−1), Rs is the solar radiation (MJ m−2 day−1), P, and kRs and kTmax are experimental coefficients. 1 HS method adopting a Seasonal kRs; 2 HS method adopting a Monthly kRs.
Table 3.
Distribution of the statistical accuracy indicators when comparing daily ETo estimated from raw (non-bias-corrected) NASA POWER data with ETo-PM estimated from observed weather data relative to all locations.
Table 3.
Distribution of the statistical accuracy indicators when comparing daily ETo estimated from raw (non-bias-corrected) NASA POWER data with ETo-PM estimated from observed weather data relative to all locations.
| Accuracy Indicator | Intervals | Number of Stations Per ETo Method | Accuracy Indicator | Intervals | Number of Stations Per ETo Method | ||||||||
|---|---|---|---|---|---|---|---|---|---|---|---|---|---|
| PM | HS_Rs | HS_S | HS_M | MaxTET | PM | HS_Rs | HS_S | HS_M | MaxTET | ||||
| b | ], 0.85] | 0 | 0 | 0 | 0 | 0 | RMSE (mm d−1) | ], 0.50] | 0 | 0 | 0 | 0 | 0 |
| [0.85, 0.95] | 0 | 1 | 4 | 6 | 0 | [0.50, 0.70] | 1 | 4 | 3 | 1 | 0 | ||
| [0.95, 1.05] | 2 | 7 | 9 | 8 | 13 | [0.70, 0.90] | 5 | 8 | 10 | 13 | 13 | ||
| [1.05, 1.15] | 7 | 4 | 1 | 0 | 1 | [0.90, 1.10] | 4 | 1 | 1 | 0 | 1 | ||
| [1.15, [ | 5 | 2 | 0 | 0 | 0 | [1.10, [ | 4 | 1 | 0 | 0 | 0 | ||
| R2 | ], 0.60] | 0 | 0 | 0 | 0 | 0 | MBE (mm d−1) | ], −0.40] | 0 | 0 | 0 | 0 | 0 |
| [0.60, 0.70] | 0 | 1 | 1 | 1 | 1 | [−0.40, 0.00] | 1 | 4 | 10 | 11 | 4 | ||
| [0.70, 0.80] | 1 | 1 | 2 | 2 | 13 | [0.00, 0.40] | 3 | 6 | 4 | 3 | 10 | ||
| [0.80, 0.90] | 13 | 12 | 11 | 11 | 0 | [0.40, 0.80] | 6 | 3 | 0 | 0 | 0 | ||
| [0.90, 1.00] | 0 | 0 | 0 | 0 | 0 | [0.80, [ | 4 | 1 | 0 | 0 | 0 | ||
Table 4.
Distribution of the statistical accuracy indicators when comparing daily ETo estimated from regionally bias corrected NASA POWER data with ETo-PM estimated from observed weather data relative to all locations.
Table 4.
Distribution of the statistical accuracy indicators when comparing daily ETo estimated from regionally bias corrected NASA POWER data with ETo-PM estimated from observed weather data relative to all locations.
| Accuracy Indicator | Intervals | Number of Stations Per ETo Method | Accuracy Indicator | Intervals | Number of Stations Per ETo Method | ||||||||
|---|---|---|---|---|---|---|---|---|---|---|---|---|---|
| PM | HS_Rs | HS_S | HS_M | MaxTET | PM | HS_Rs | HS_S | HS_M | MaxTET | ||||
| b | ], 0.85] | 1 | 0 | 0 | 0 | 0 | RMSE (mm d−1) | ], 0.50] | 0 | 0 | 0 | 0 | 0 |
| [0.85, 0.95] | 5 | 2 | 1 | 0 | 0 | [0.50, 0.70] | 8 | 8 | 2 | 1 | 0 | ||
| [0.95, 1.05] | 6 | 9 | 11 | 11 | 12 | [0.70, 0.90] | 4 | 4 | 11 | 13 | 11 | ||
| [1.05, 1.15] | 2 | 2 | 2 | 3 | 2 | [0.90, 1.10] | 1 | 1 | 1 | 0 | 3 | ||
| [1.15, [ | 0 | 1 | 0 | 0 | 0 | [1.10, [ | 1 | 1 | 0 | 0 | 0 | ||
| R2 | ], 0.60] | 0 | 0 | 0 | 0 | 0 | MBE (mm d−1) | ], −0.40] | 4 | 1 | 0 | 0 | 0 |
| [0.60, 0.70] | 0 | 1 | 1 | 1 | 1 | [−0.40, 0.00] | 7 | 4 | 1 | 4 | 1 | ||
| [0.70, 0.80] | 1 | 1 | 4 | 4 | 13 | [0.00, 0.40] | 3 | 7 | 11 | 8 | 12 | ||
| [0.80, 0.90] | 12 | 12 | 9 | 9 | 0 | [0.40, 0.80] | 0 | 1 | 2 | 2 | 1 | ||
| [0.90, 1.00] | 1 | 0 | 0 | 0 | 0 | [0.80, [ | 0 | 1 | 0 | 0 | 0 | ||
Table 5.
Distribution of the statistical accuracy indicators when comparing daily ETo estimated from locally bias corrected NASA POWER data with ETo-PM estimated from observed weather data relative to all locations.
Table 5.
Distribution of the statistical accuracy indicators when comparing daily ETo estimated from locally bias corrected NASA POWER data with ETo-PM estimated from observed weather data relative to all locations.
| Accuracy Indicator | Intervals | Number of Stations Per ETo Method | Accuracy Indicator | Intervals | Number of Stations Per ETo Method | ||||||||
|---|---|---|---|---|---|---|---|---|---|---|---|---|---|
| PM | HS_Rs | HS_S | HS_M | MaxTET | PM | HS_Rs | HS_S | HS_M | MaxTET | ||||
| b | ], 0.85] | 0 | 0 | 0 | 0 | 0 | RMSE (mm d−1) | ], 0.50] | 0 | 0 | 0 | 0 | 0 |
| [0.85, 0.95] | 10 | 1 | 0 | 0 | 0 | [0.50, 0.70] | 11 | 10 | 2 | 3 | 0 | ||
| [0.95, 1.05] | 4 | 11 | 14 | 14 | 14 | [0.70, 0.90] | 3 | 3 | 12 | 11 | 12 | ||
| [1.05, 1.15] | 0 | 1 | 0 | 0 | 0 | [0.90, 1.10] | 0 | 0 | 0 | 0 | 2 | ||
| [1.15, [ | 0 | 1 | 0 | 0 | 0 | [1.10, [ | 0 | 1 | 0 | 0 | 0 | ||
| R2 | ], 0.60] | 0 | 0 | 0 | 0 | 0 | MBE (mm d−1) | ], −0.40] | 2 | 1 | 0 | 0 | 0 |
| [0.60, 0.70] | 0 | 1 | 1 | 1 | 1 | [−0.40, 0.00] | 11 | 5 | 2 | 0 | 0 | ||
| [0.70, 0.80] | 1 | 1 | 4 | 4 | 13 | [0.00, 0.40] | 1 | 6 | 12 | 14 | 14 | ||
| [0.80, 0.90] | 11 | 12 | 9 | 9 | 0 | [0.40, 0.80] | 0 | 1 | 0 | 0 | 0 | ||
| [0.90, 1.00] | 2 | 0 | 0 | 0 | 0 | [0.80, [ | 0 | 1 | 0 | 0 | 0 | ||
Publisher’s Note: MDPI stays neutral with regard to jurisdictional claims in published maps and institutional affiliations. |
© 2021 by the authors. Licensee MDPI, Basel, Switzerland. This article is an open access article distributed under the terms and conditions of the Creative Commons Attribution (CC BY) license (https://creativecommons.org/licenses/by/4.0/).
Share and Cite
MDPI and ACS Style
Rodrigues, G.C.; Braga, R.P. Estimation of Daily Reference Evapotranspiration from NASA POWER Reanalysis Products in a Hot Summer Mediterranean Climate. Agronomy 2021, 11, 2077. https://0-doi-org.brum.beds.ac.uk/10.3390/agronomy11102077
AMA Style
Rodrigues GC, Braga RP. Estimation of Daily Reference Evapotranspiration from NASA POWER Reanalysis Products in a Hot Summer Mediterranean Climate. Agronomy. 2021; 11(10):2077. https://0-doi-org.brum.beds.ac.uk/10.3390/agronomy11102077
Chicago/Turabian StyleRodrigues, Gonçalo C., and Ricardo P. Braga. 2021. "Estimation of Daily Reference Evapotranspiration from NASA POWER Reanalysis Products in a Hot Summer Mediterranean Climate" Agronomy 11, no. 10: 2077. https://0-doi-org.brum.beds.ac.uk/10.3390/agronomy11102077
Note that from the first issue of 2016, this journal uses article numbers instead of page numbers. See further details here.