Article

Does Leaf Waxiness Confound the Use of NDVI in the Assessment of Chlorophyll When Evaluating Genetic Diversity Panels of Wheat?

1
Department of Plant Agriculture, University of Guelph, 50 Stone Road East, Guelph, ON N1G 2W1, Canada
2
Ottawa Research and Development Centre, Agriculture and Agri-Food Canada, 960 Carling Ave, Ottawa, ON K1A 0C6, Canada
*
Author to whom correspondence should be addressed.
Submission received: 26 January 2021 / Revised: 26 February 2021 / Accepted: 27 February 2021 / Published: 5 March 2021
(This article belongs to the Special Issue Wheat Breeding: Procedures and Strategies – Series Ⅱ)

Abstract

:
Ground and aerial-based high throughput phenotyping platforms (HTPPs) to evaluate chlorophyll-related traits have been utilized to predict grain yield in crops including wheat (Triticum aestivum L.). This study evaluated chlorophyll-related and other physiological and yield traits in a panel of 318 Nepali spring wheat genotypes, termed the Nepali Wheat Diversity Panel (NWDP). Field experiments were conducted using an alpha-lattice design in Nepal and Canada. Chlorophyll-related traits were evaluated with a Soil Plant Analysis Development (SPAD) meter and the normalized difference vegetation index (NDVI) using a handheld GreenSeeker and an Unmanned Aerial Vehicle (UAV). Relative leaf epicuticular waxiness was recorded using visual assessments. There was a significant positive association (p < 0.001) between waxiness and SPAD-based chlorophyll estimates, and both of these traits displayed a significant positive relationship with grain yield. However, unexpectedly, NDVI derived from both GreenSeeker and UAV was negatively associated with waxiness and grain yield. The results obtained after segregating the trait means into groups based on waxiness scores and breeding history of genotypes indicated that waxiness along with precipitation could be affecting the multispectral reflectance. These results suggest that caution should be taken when evaluating a large and diverse wheat population for leaf chlorophyll using high-throughput NDVI methods.

1. Introduction

Wheat (Triticum aestivum L.) is the source of ~20% of global calories [1], demonstrating its importance for global food security. As the world’s population is approaching ~10 billion in the next 30 years [2], wheat breeders have a tremendous challenge ahead to develop high yielding wheat varieties at a greater pace. However, as a consequence of climate change, factors such as drought can hinder or reverse progress in improving wheat grain yield [3]. The intensity, frequency, and duration of drought [4] along with the growth stage at which the drought events occur [5] are responsible for losses in grain yield. Globally, ~37% of wheat is grown in semi-arid regions with limited soil moisture [6,7]. Understanding the physiological traits associated with stress tolerance plays a critical role in generating new high-yielding, climate-resilient wheat varieties [7,8,9].
Photosynthesis promotes growth and development [10,11]. Although significant yield improvement in crops in the past few decades has been achieved without improved photosynthesis, improving photosynthesis is expected to contribute significantly to further increases in crop productivity [10]. Drought, among other environmental factors, limits photosynthesis [12,13]; photosynthetic efficiency is considered one of the key indicators of the plant response to water stress and other physiological stresses [9,14]. Different abiotic stresses including drought adversely affect the photosystem II reaction center by disrupting electron transport, which results in reduced CO2 assimilation [15,16]. Developing crop varieties with higher photosynthetic potential can improve crop yield and resistance to drought and other abiotic factors.
Chlorophyll has been used to characterize photosynthetic potential and responses to biotic and abiotic stresses [17,18,19,20]. Changes in the photosynthetic capacity usually parallel changes in chlorophyll content [21]. Compared to measurements of gas exchange, measurements of chlorophyll and chlorophyll parameters have been found to be more practical when assessing photosynthetic responses in plants [22,23]. Therefore, chlorophyll parameters such as chlorophyll content [23], Normalized Difference Vegetative Index (NDVI) [24], and chlorophyll fluorescence [22] have been used to appraise the contribution of chlorophyll to improved photosynthetic efficiency.
At present, many plant phenotyping methods and facilities have been established globally. With the advancements in high throughput phenotyping platforms (HTPPs), characterization of a large number of genotypes for chlorophyll-related parameters using non-destructive, reflectance, and transmittance based methods have become feasible [9,25,26]. Chlorophyll content, as estimated using the Soil-Plant Analysis Development (SPAD) meter, has been widely used in wheat [23,25]. Studies have shown that SPAD estimates are positively associated with increased photosynthesis [23], resulting in a positive association with grain yield [27]. Similarly, evaluation of wheat genotypes for variation in NDVI has been commonly used to assess the efficiency of photosynthetic parameters and grain yield [28]. NDVI has also been used for water stress assessment at different growth stages of various crops [29]. In a research context, NDVI is often measured using handheld or tractor-mounted equipment such as GreenSeeker; more recently, Unmanned Aerial Vehicles (UAVs) are becoming popular [24,30]. Many studies reveal a close positive association between NDVI and photosynthetic parameters such as chlorophyll content index and also grain yield [23,24,26].
Apart from these chlorophyll related traits, shoot waxiness is another physiological trait that is regarded as important for abiotic stress tolerance and grain yield [31]. Deposition of wax on the cuticle gives a light bluish-gray or bluish-white color to plant tissues and it is one of the distinct cuticular properties of some plant species including wheat [32]. Although cuticular wax deposition may not be the sole factor, increased waxiness decreases water loss through transpiration, contributing to drought tolerance [33,34,35,36,37,38]. A study reported significantly higher epicuticular wax in a recombinant inbred line (RIL) population when grown under moisture deficit conditions [36]. Leaf waxes may reduce leaf temperatures, resulting in cooler canopies [38]. Many studies in the past have shown a positive association between cuticular wax and grain yield in different crops including wheat [36,39,40,41].
To investigate the above traits, a diversity panel of Nepali spring wheat genotypes, termed the Nepali Wheat Diversity Panel (NWDP), was assembled including landraces, released varieties, and advanced breeding lines [42]. Wheat is a very important crop for food security in Nepal: it is the third most important cereal crop in Nepal in terms of area and production with almost 22% of the total acreage under production [43]. Moisture stress is a common problem for wheat cultivation in Nepal [44] because ~42% of the crop is grown under rain-fed conditions [43] and during the dry season which receives less than 10% of the annual rainfall [45]. Climatic predictions suggest that drought is one of the key challenges to improving wheat production in most of the wheat-growing areas in the country [44,45,46]. Therefore, assessment of the NWDP for traits related to drought tolerance is relevant. The results obtained from these analyses can potentially provide information on genetic variation for target traits for further utilization in breeding programs.
This study was conducted to evaluate 318 accessions from the NWDP for: (i) variation in the above physiological traits and grain yield; and (ii) the association among these physiological traits and also with grain yield. This study focuses on one unexpected result, namely a negative association between NDVI and leaf wax, which has implications for the use of NDVI for measuring leaf chlorophyll in wheat diversity panels.

2. Materials and Methods

2.1. Plant Materials

A diversity panel of 320 spring wheat genotypes, the Nepali Wheat Diversity Panel (NWDP) (Supplementary Materials Table S1), was assembled for the study [42]. The panel includes 167 Nepali landraces, 116 CIMMYT (International Maize and Wheat Improvement Center) advanced breeding lines, and 34 commercially released Nepali wheat varieties. The landraces in the diversity panel represented 29 districts of Nepal, and these were collected during different germplasm expeditions during the 1970s to 1990s. The seeds of the landraces were provided by National Agriculture Genetic Resource Centre (NAGRC), a body under Nepal Agricultural Research Council (NARC), Kathmandu, Nepal. Similarly, seeds of the Nepali released varieties were provided by the National Wheat Research Program (NWRP), NARC, Nepal, and the advanced breeding lines were provided by CIMMYT, El Batan, Mexico. These three seed sources also correspond to the breeding history of the genotypes included in the NWDP. Three high-latitude spring wheat varieties were also included in the panel as the two major field experiments were conducted in the Canadian environment; these were: Norwell, a bread wheat cultivar developed in Eastern Canada; Pasteur, a high yielding cultivar developed in the Netherlands and grown in Canada; and AC Carberry [47], a high-quality bread wheat developed in Western Canada, obtained from the wheat breeding laboratory, University of Guelph, Guelph, Canada.

2.2. Field Trials

Four field trials were conducted to evaluate the diversity panel. In the 2016 growing season, field trials were conducted at the University of Guelph Research Station at Elora, Ontario (43°38′23.0” N 80°24′11.0” W). The trial was planted on May 11 and harvested on September 5. Similarly, the second field trial was conducted during the 2017 growing season at the same research station (43°38′10.4” N 80°24′07.6” W). During this season, planting was done on May 16 and the plots were harvested on August 29. The remaining two field trials were conducted in Nepal during the 2016 and 2017 wheat growing seasons at the Nepal Agriculture Research Council (NARC) Research Station located at Khumaltar, Lalitpur, Nepal (27°39′12.3” N 85°19′33.7” E) and the National Wheat Research Program (NWRP) station located at Bhairahawa, Rupandehi, Nepal (27°31′53.5” N 83°27′32.2” E). The field experiment at Khumaltar, Lalitpur, Nepal was a collaboration with the Agricultural Botany Division (ABD) of NARC, while NWRP, NARC supported the field experiment at NWRP, Bhairahawa. The planting and harvesting dates for the trial at the NARC station in Khumaltar were 23 November 2016, and 5 May 2017. Similarly, seed planting in NWRP, Bhairahawa, was done on 30 November 2016, while the plots were harvested on 19 April 2017. The experiments were conducted using an alpha lattice design [48] with two complete blocks and 20 incomplete blocks with 32 accessions (two accessions were excluded from the analysis due to a high level of seed mixture observed in the field trials). At the Elora Research Station, each of the experimental plots was a six-row plot (1 m × 3 m) with 17.8 cm row spacing, and the plot to plot distance was maintained at 0.5 m, with 1 m between the ranges. At the Nepal sites, due to limitations in the availability of seed, 2 m long 2-row plots with 20 cm row-to-row spacing were used.

2.3. Field Data Collection

Phenotyping of chlorophyll parameters was done using both reflectance- and transmittance-based methods. At the Elora Research Station, data on chlorophyll parameters were collected using handheld machines for both 2016 and 2017 field trials and UAV only in the 2017 trial. The SPAD estimates were recorded using a SPAD 502Plus Chlorophyll Meter (Spectrum Technologies, Plainfield, IL, USA) in all the four field experiments. The operation of the SPAD meters is based on the illuminating system which has diodes emitting red (650 nm) and infrared (940 nm) radiation that passes through a leaf to a photodiode receptor. The SPAD values were measured in the central part of three randomly selected representative flag leaves in each plot: the three readings were averaged into one reading. The first data was recorded when the genotypes reached Zadoks stage 31 once a week until three weeks prior to maturity (for most of the genotypes) at the Elora Research Station with a major focus on vegetative and reproductive growth stages. In the NARC Research Station at Khumaltar, Nepal, two reading were taken 10 days apart at the vegetative stage (Zadoks stage 37 and 45 approximately), and one reading during the reproductive phase (Zadoks stage 50), while at NWRP Research Station at Bhairahawa, one reading was taken during the vegetative stage (Zadoks stage 39). The area under the SPAD curve (AUSC) was generated for three experiments (excluded NWRP which had only one reading) using the following formula:
AUSC = i = 1 n = 1 [ ( S ( i + 1 ) + S i 2 ) ] ( T ( i + 1 ) T i )
where Si = SPAD value estimate on the ith date; Ti = ith day; n = number of dates of recording the SPAD value.
NDVI was computed using the handheld GreenSeekerTM (NTech Industries, Inc. Boulder, CO, USA), a reflectance-based multispectral sensor unit that measures the reflectance of red and infrared radiation from the plot. The reading was taken by holding the device at ~1.5 m from the ground level from the middle of the plot. NDVI has values between 0 and 1.0, and is calculated as the difference in infrared and red reflectance, divided by their sum [49]:
NDVI = R NIR R R R NIR + R R
where NDVI = Normalized difference vegetative index; RNIR = Near-infrared radiation; RR = Visible red spectrum.
A total of five readings were taken until three weeks before maturity at one-week intervals at the Elora Research Station in both the 2016 and 2017 growing seasons. The NDVI readings were taken the day following the SPAD readings. Four NDVI readings, two before anthesis (at an approximate average of Zadoks stages 37 and 45) and two after anthesis (at an approximate average of Zadoks stages 50 and 58) were taken at the NARC Research Station at Khumaltar, while three readings, two before (Zadoks stages 37 and 45) and one after anthesis (Zadoks stage 50) were taken at the NWRP Research Station at Bhairahawa. The area under the NDVI curve (AUNC) was generated using the following formula:
AUNC = i = 1 n = 1 [ ( N ( i + 1 ) + N i 2 ) ] ( T ( i + 1 ) T i )
where Ni = NDVI estimate on the ith date; Ti = ith day; N = number of dates of recording the NDVI value.
Deveron UAS (Toronto, ON, Canada) performed an unmanned aerial vehicle (UAV) flight on 26 July 2017, over the experiment at the Elora Research Station using the platform DJI Matrice 100 (DJI, Shenzhen, China). The maturity of the trial was between Zadoks stages 50 and 58. The UAV flight was at an altitude of 30 m to capture the spectral reflectance by a RedEdgeTM narrow-band multispectral camera (MicaSense, Washington, WA, USA). The multispectral camera captured five bands including blue (480 nm), green (560 nm), red (670 nm), red edge (720 nm), and near-infrared (840 nm). Pix4d software (Pix4d, Lausanne, Switzerland) was used to process the images from each of the wavelengths, and five geo-referenced ortho-mosaics of the flight for each wavelength was generated. An image of a calibration panel with a known reflectance (blue 0.70, green 0.71, red 0.71, near-infrared 0.66, and red edge 0.70) was taken before the UAV flight to adjust the variation in light conditions. ArcGIS (Esri, CA, USA) software was used to generate the NDVI map by using the Map Algebra Tool in ArcGIS. Similarly, to avoid the reflectance generated by the background soil, a threshold of >0.3 was used. The Python code as described by Haghighattalab et al. (2016) [50] was used to generate shapefiles for extracting the plot-level data. To ensure better plot coverage, the shapefiles were manually curated after importing them into ArcGIS software. NDVI sum values were extracted for each unit plot using Zonal Statistic which involves the following formula:
NDVIdr = i = 1 N NDVIi
where in, the NDVIdr (NDVI measured using a UAV/drone) indicates the sum of all NDVI values from the pixels in each experimental unit that exceeded the threshold value 0.3, and this value represents the greenness of the vegetation within each experimental unit.
Data on waxiness was recorded by visual assessment using the CIMMYT protocol [51] after all genotypes reached Zadoks stage 50. Wax deposition on the plants (leaves, stems, and spikes) was observed on the whole plot. To train the eyes, plots with the highest and least waxiness were identified. Based on this observation, individual plots were rated using a scale from 0 (none) to 10 (total cover), thus providing a relative scale for each site and season. Data could not be collected from the NWRP site in Nepal due to technical reasons.
At the Elora Research Station, harvesting was done using a Wintersteiger plot combine harvester (Wintersteiger AG; Ried im Innkreis, Austria). The grain yield data were recorded at the harvest time with a HarvestMaster Grain Gage (Juniper Systems, Inc., Logan, UT, USA) fixed on the combine. The grains were dried and the grain weight was taken again to confirm the quality of the data taken from the combine. In the Nepal field trials, plots were harvested and threshed manually. The grain was dried, and the yield per plot was recorded. In all field experiments, grain yield was recorded as kg/plot and later converted into kg/ha.

2.4. Phenotypic Data Analysis

The phenotypic data collected from the field were analyzed using PROC MIXED in SAS version 9.4 (SAS Institute, Cary, NC, USA). The Shapiro–Wilk test was conducted in PROC UNIVARIATE to test the normality of the residuals. To ensure that all the data points were independent and random, PROC SGPLOT was used to construct studentized-residuals by predictor plots. The studentized residuals produced by genotype x treatment combinations were considered outliers when > 3.5 and <− 3.5. These outliers were removed from the dataset after confirming that they were true outliers. Least-square (LS) means were generated for each genotype. Analysis of variance and correlation were analyzed using PROC ANOVA and PROC CORR commands, respectively. The correlation plots were generated using the R platform and Minitab 19 trial version.

3. Results

3.1. The Response of Traits to Different Growing Environments

The combined ANOVA analysis showed a significant difference (p ≤ 0.0001) among the genotypes in the NWDP for AUNC, NDVIdr, AUSC, waxiness, and grain yield (Supplementary Materials Table S2). The interaction effect of genotype by environment (G × E) was significant for all of the above traits except for NDVIdr, which was recorded only at the Elora Research Station during the 2017 season. These results demonstrated that the genotypes in the study performed differently in the four environments in which the experiments were conducted.

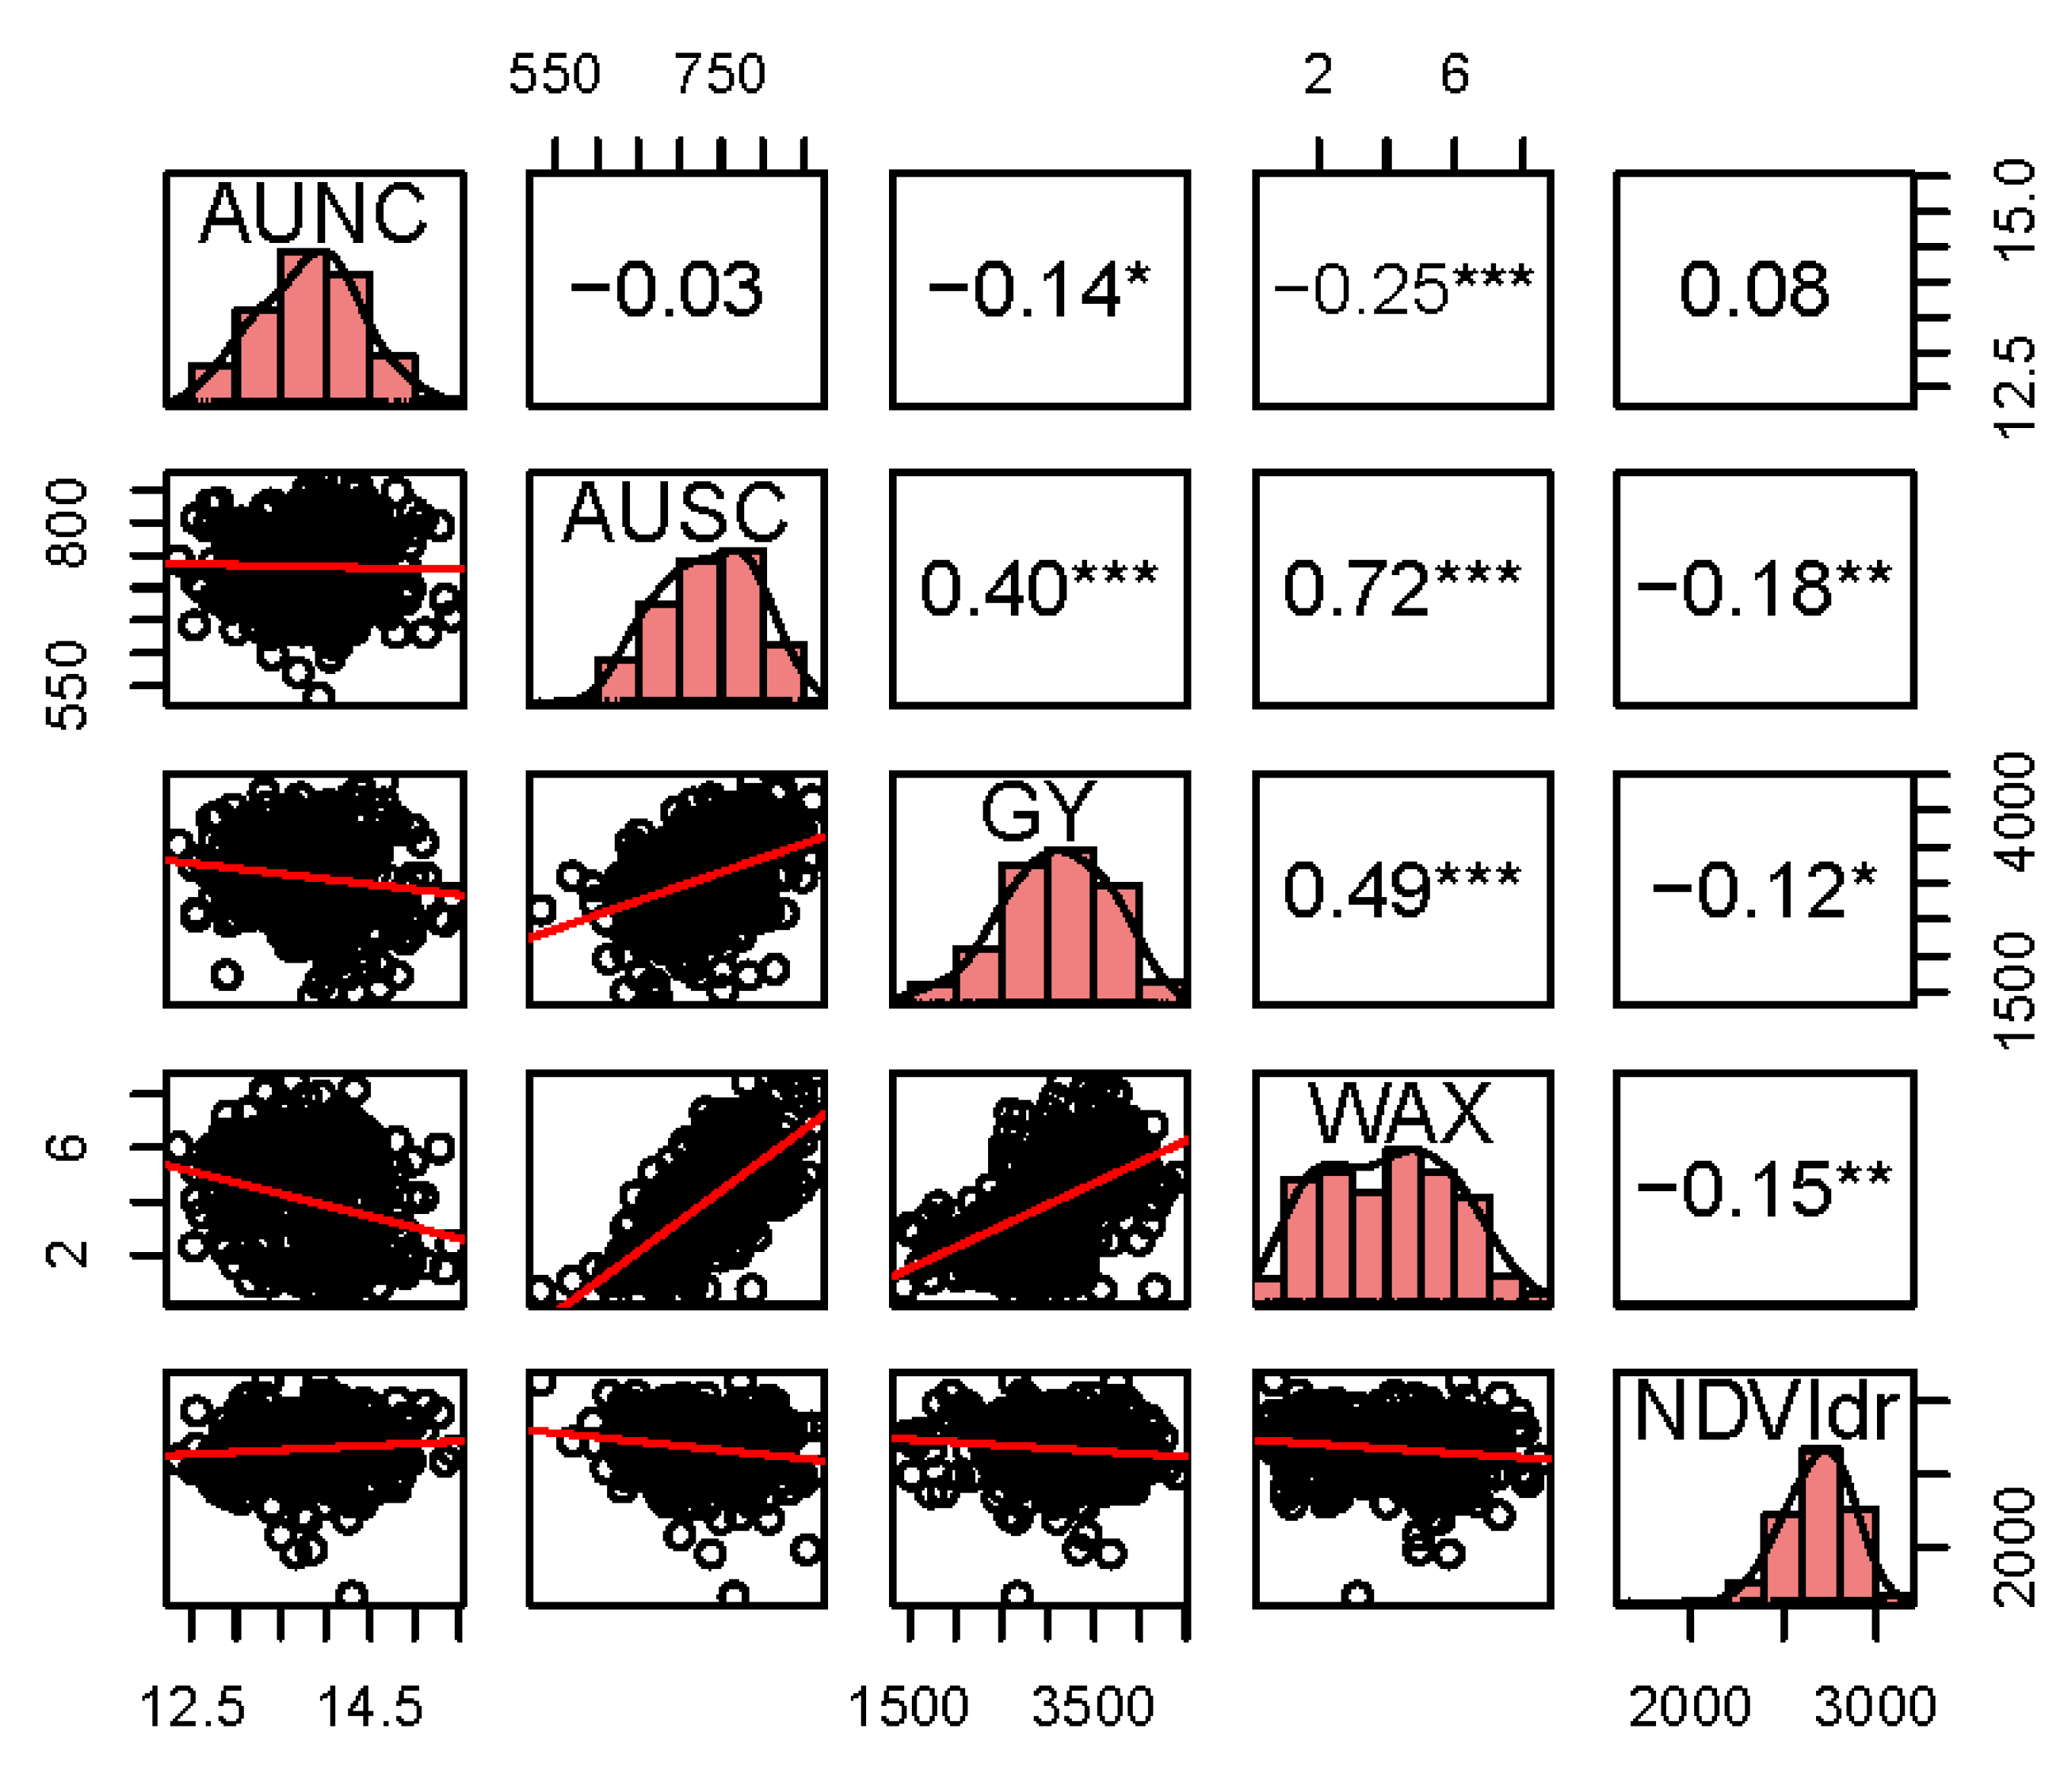
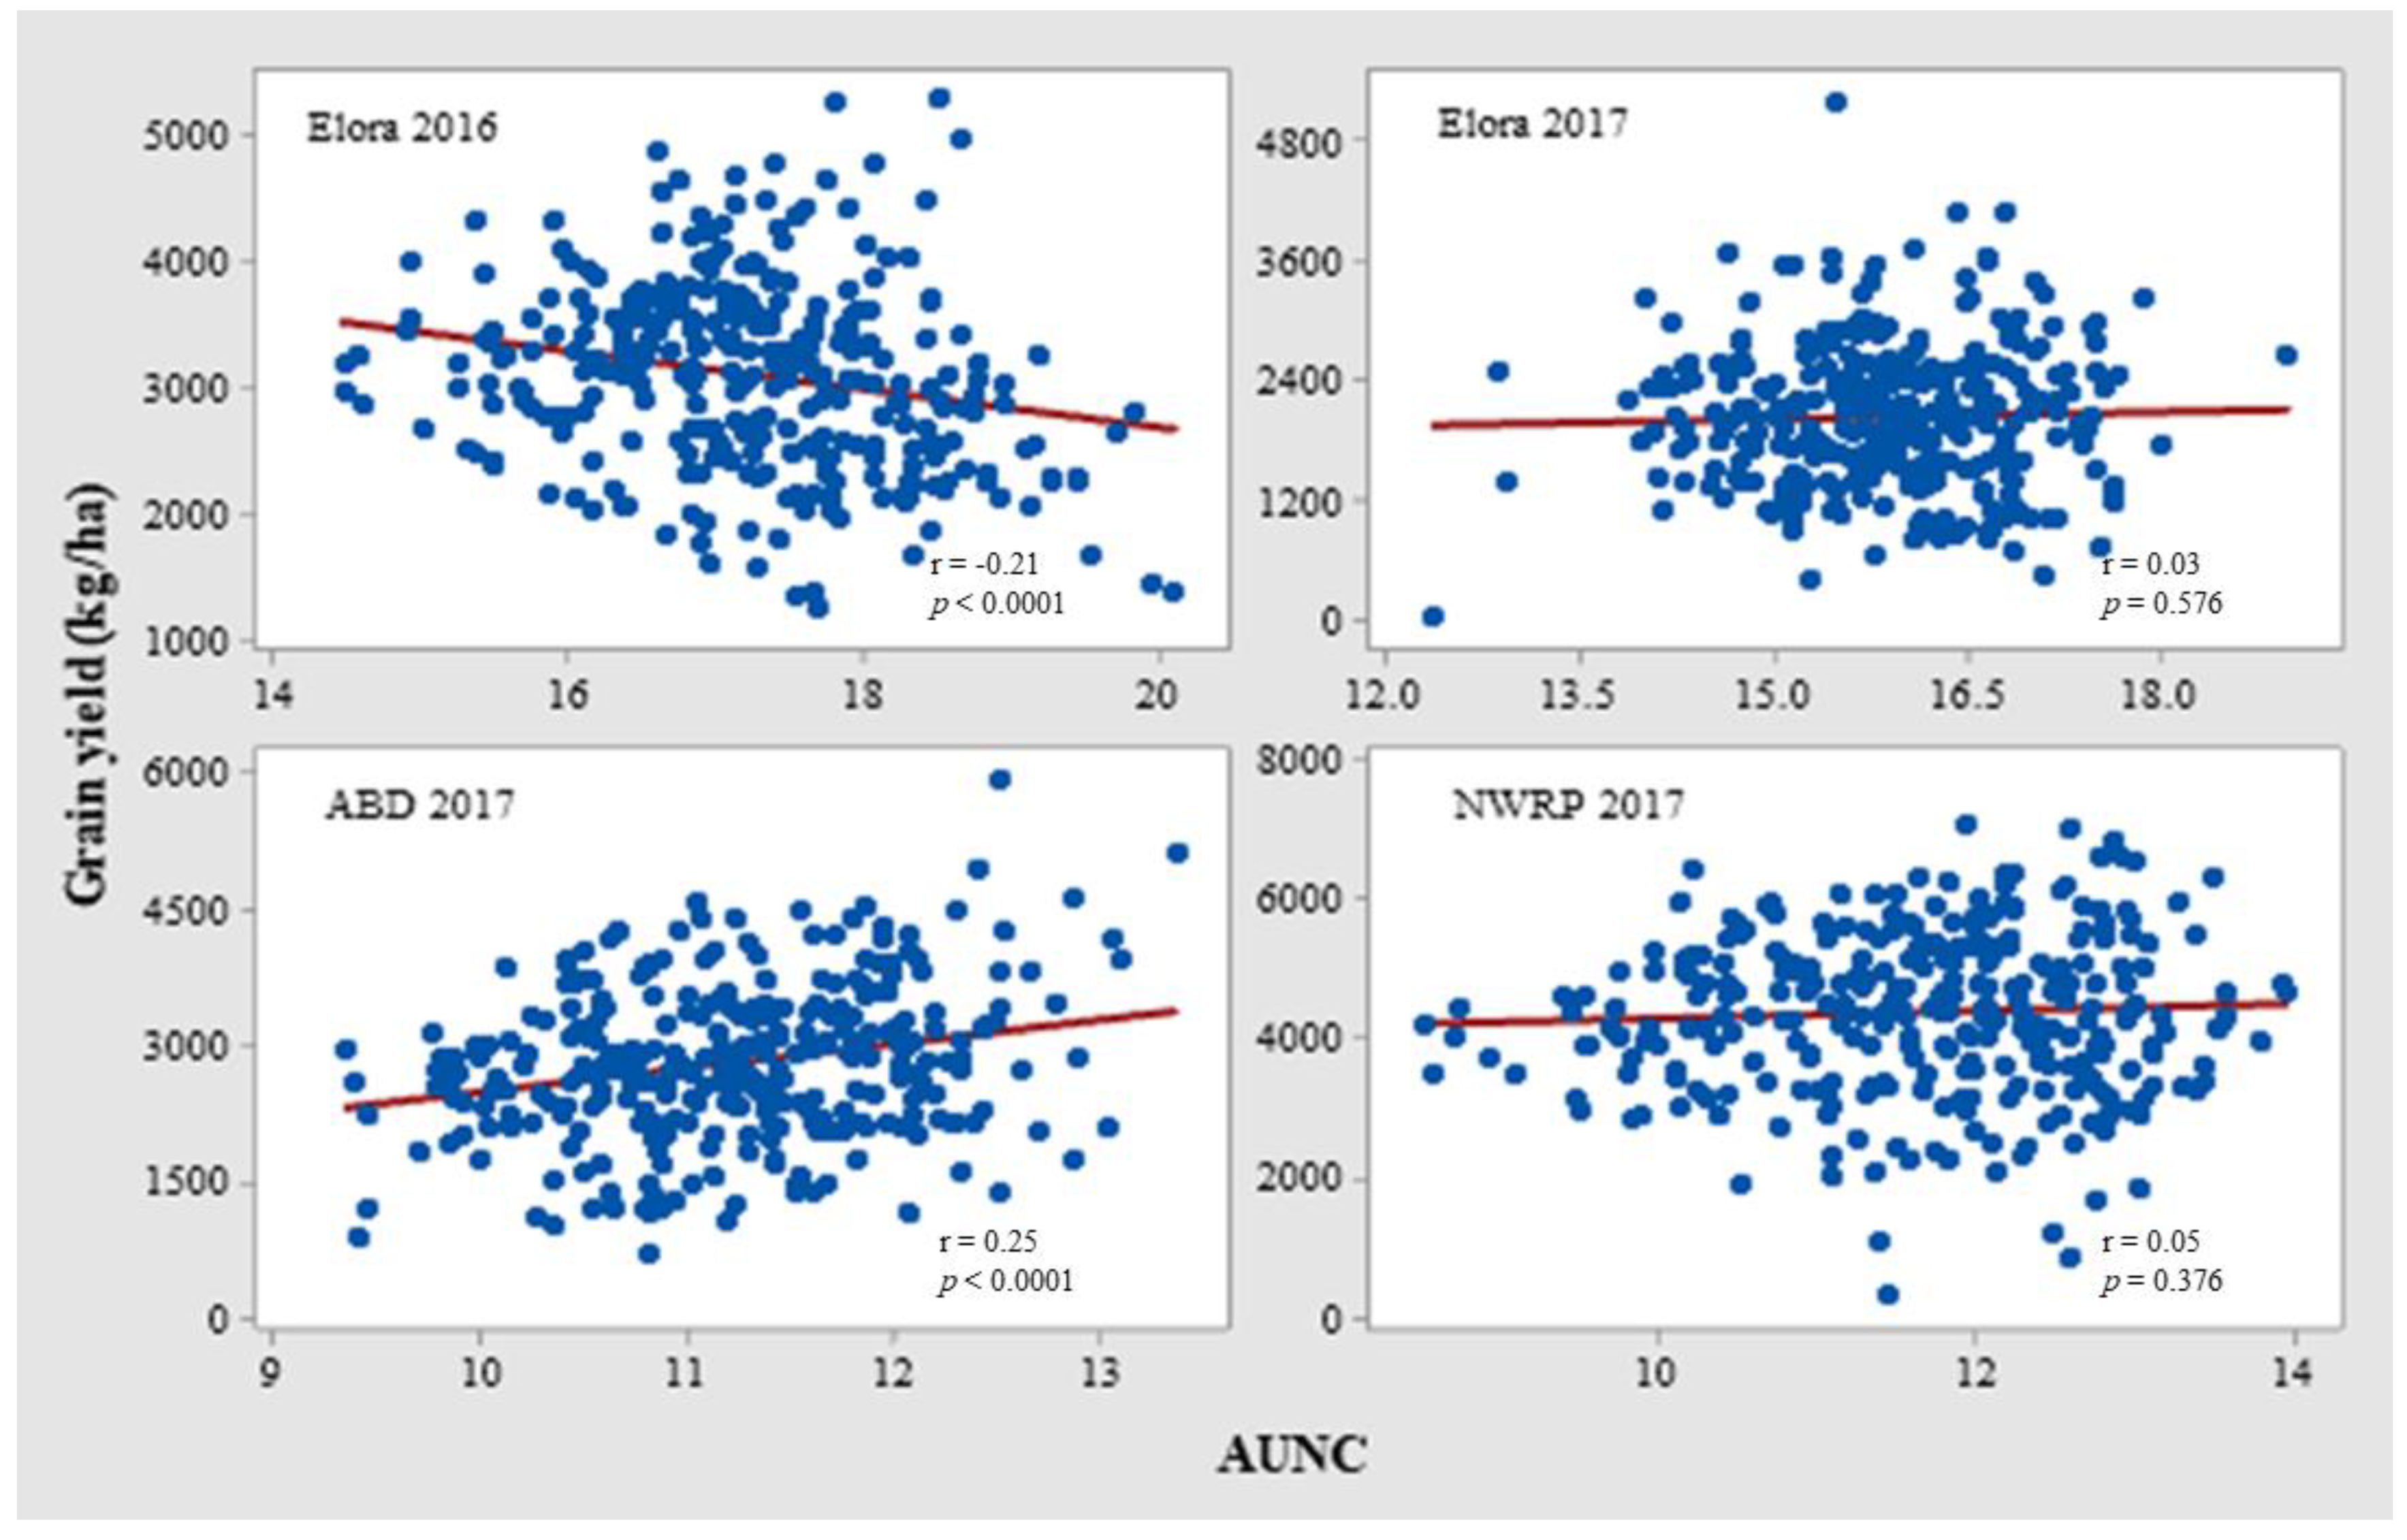
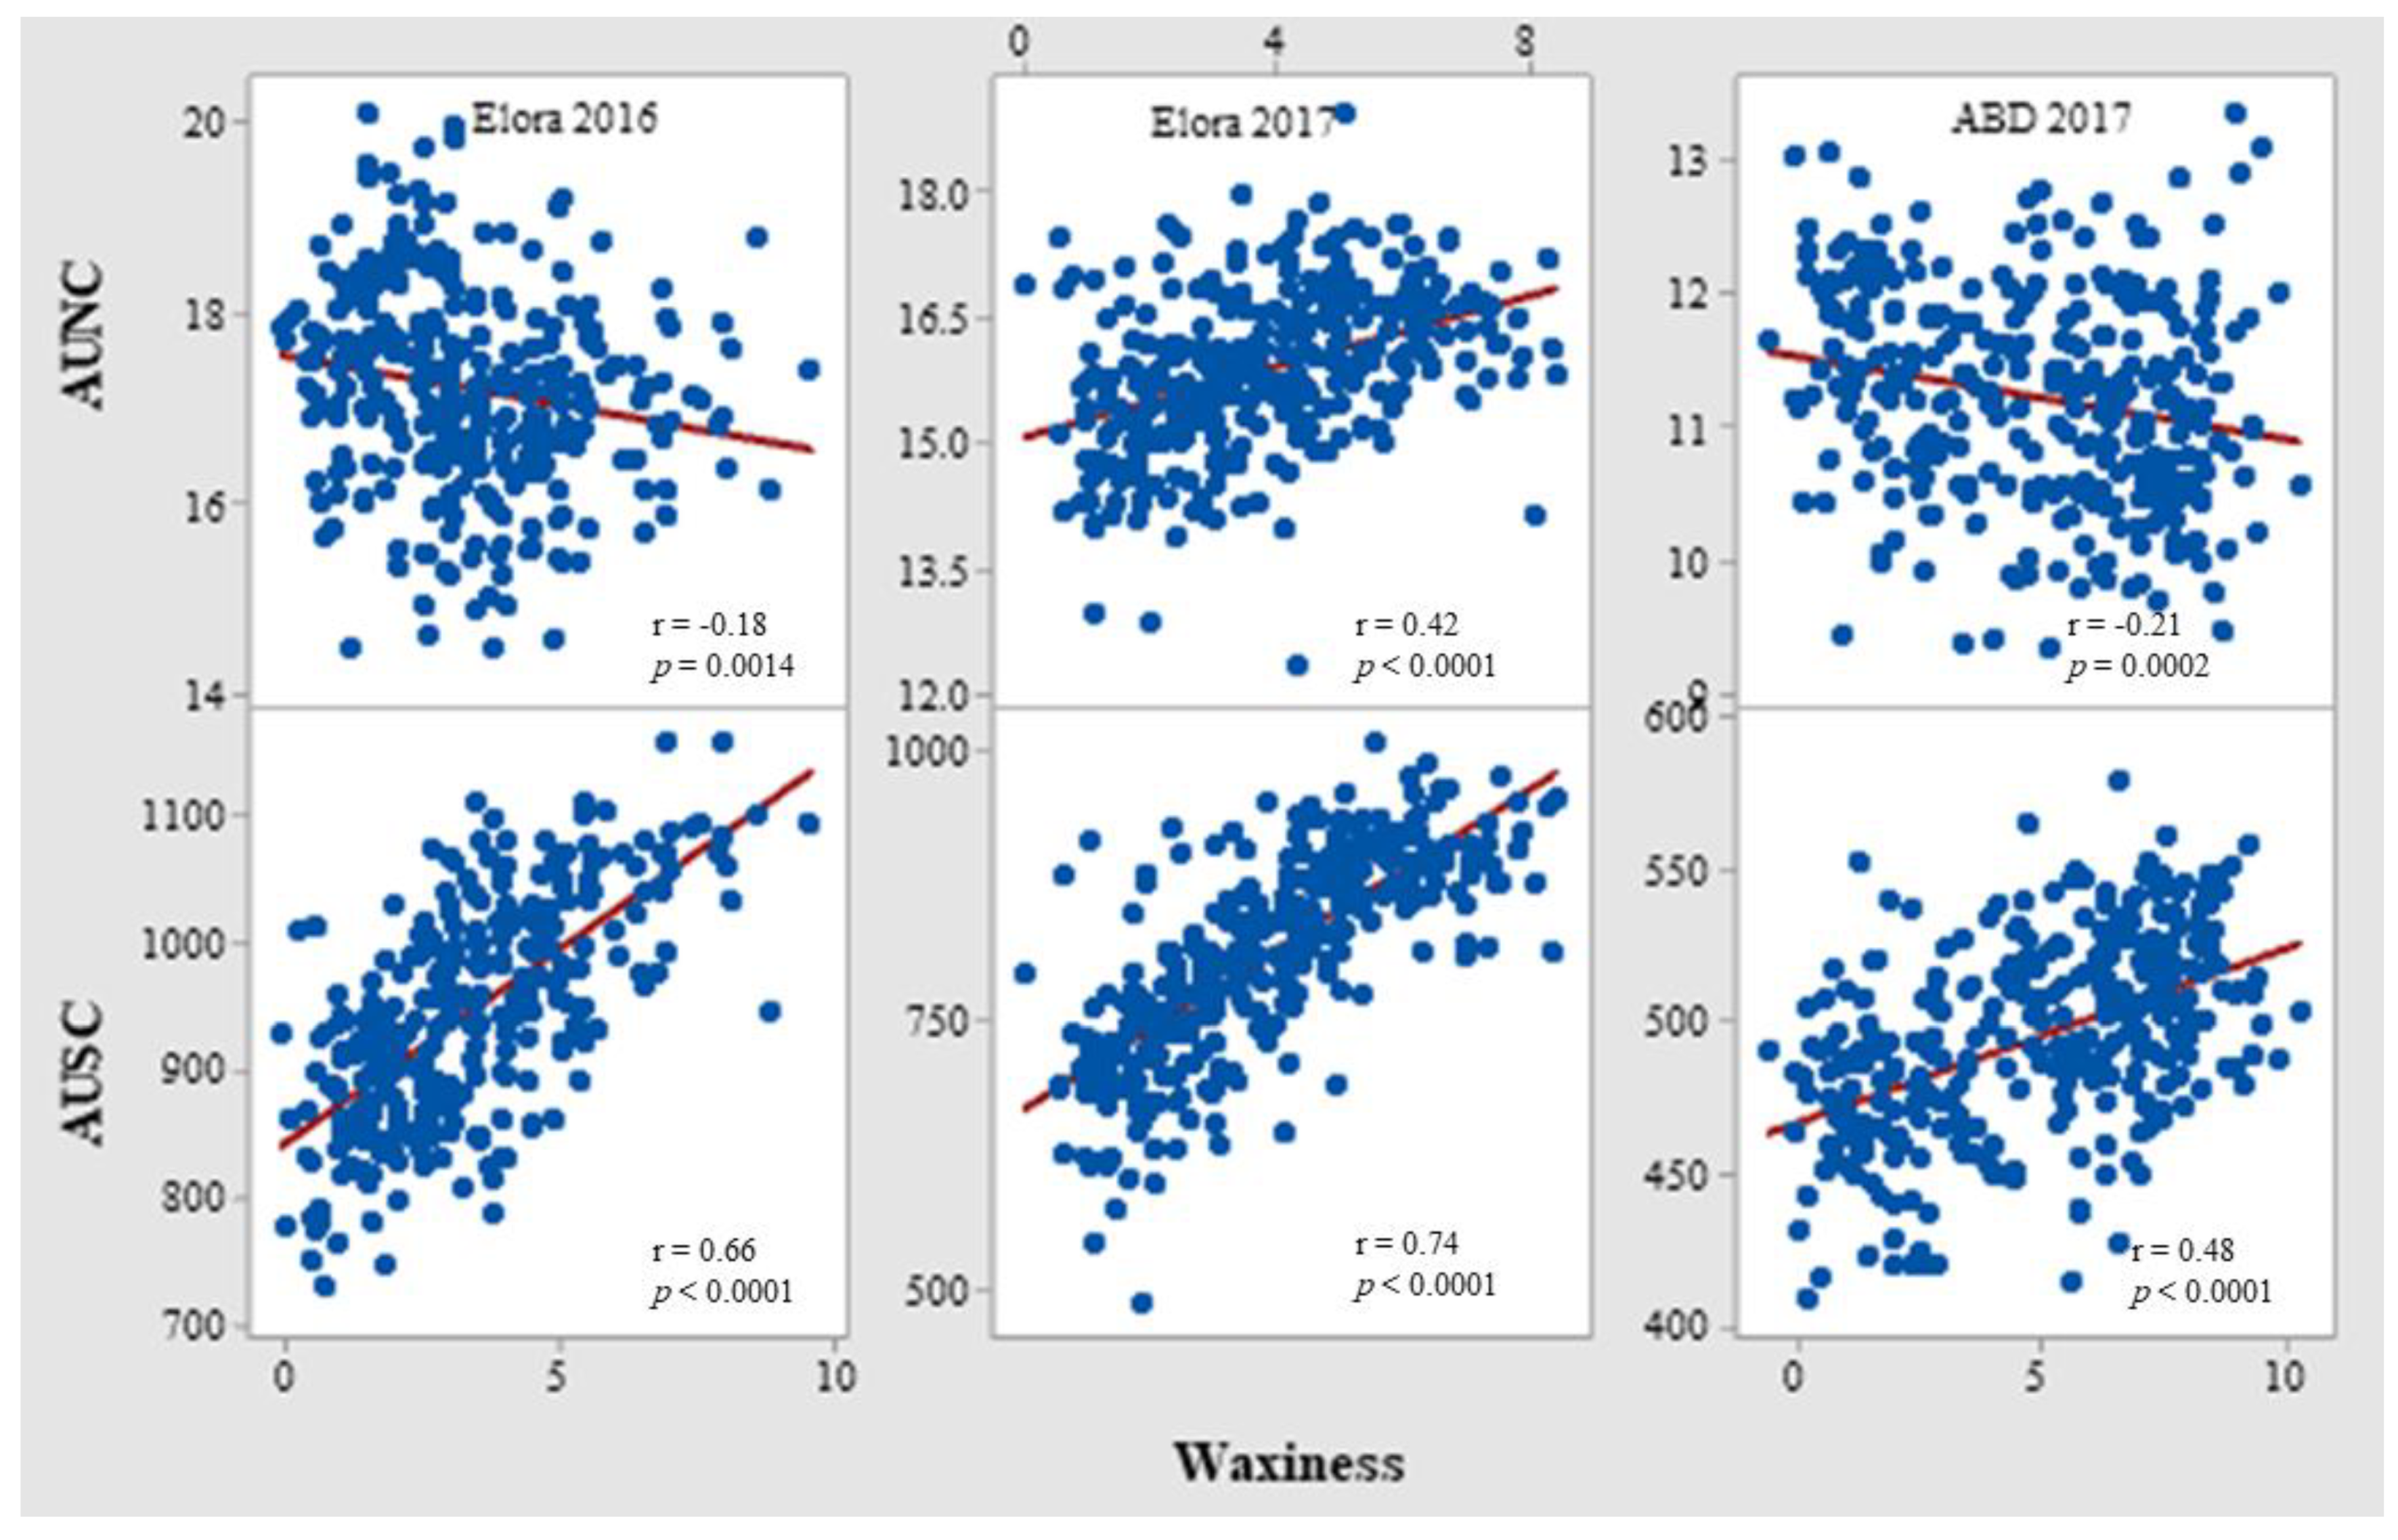
3.2. Correlation of Chlorophyll-Related Traits with Waxiness and Grain Yield

Correlation analysis was performed for each trait using trait means calculated using the data from all four field experiments. The results showed a significant positive association between grain yield (p ≤ 0.0001) and AUSC (r = 0.40), and grain yield and waxiness (r = 0.49) (Figure 1). However, a significant negative association (p ≤ 0.05) was observed between grain yield and AUNC, and waxiness and AUNC, which was unexpected. Similarly, NDVIdr showed a significant negative association with AUSC (p ≤ 0.001), grain yield (p ≤ 0.05), and waxiness (p ≤ 0.001), which was also not expected.

3.3. Principal Component Analysis

Principal component analysis (PCA) was performed using the data on chlorophyll-related traits, waxiness, and grain yield recorded for all field experiments to assess the association among these traits. It was found that the first two principal components accounted for 44.73% of the variation (Figure 2). The bi-plot generated using these first two principal components showed that component 1, which explained 34.18% of the variation, was positively associated with grain yield, AUSC, and waxiness. In contrast to this, AUNC (except AUNC for Elora 2017) was negatively correlated with component 1. This result supports the results from correlation analysis related to the unexpected negative association of AUNC with grain yield and waxiness, and the negative association of NDVIdr with grain yield, AUSC, and waxiness. The bi-plot also shows that there was little overlap of landraces and the modern varieties/advanced lines with the CIMMYT lines: the released cultivars were more associated with high grain yield, while the majority of the landraces occupied space in the lower yielding area of the biplot (Figure 2).

3.4. Within Trial Correlation Analysis

Due to the high G x E interaction observed, correlation analysis was performed separately for each individual field experiment (Table 1). Positive correlations were observed for waxiness and AUSC, and waxiness and grain yield, across all three sites where waxiness ratings were performed (no data was available for waxiness at the NWRP, Nepal site). The 2016 Elora Research Station (ERS) results showed a negative correlation between AUNC and grain yield, and between AUNC and waxiness. Whereas waxiness and AUNC were positively correlated in 2017 at the Elora Research Station, there was no significant correlation between AUNC and grain yield. Surprisingly, NDVIdr was negatively correlated with AUNC, AUSC, and waxiness (Table 1).
In the case of the data obtained from the ABD (Nepal) site, a significant positive association of AUNC with grain yield was observed, but again, the correlation between AUNC and waxiness was negative. For the NWRP (Nepal) site, grain yield did not show any association with AUNC (Table 1); specifically, the association of AUNC with grain yield (Figure 3), and the association of waxiness with AUNC and AUSC (Figure 4), indicated the need for further analysis.
Due to the confounding results observed, further detailed correlation analysis was performed for the data from the two experiments at the Elora Research Station. The data from the ABD (Nepal) and NWRP (Nepal) sites were excluded from this analysis due to fewer NDVI measurements and lack of waxiness data from the NWRP (Nepal) site. For this analysis, the data were segregated into three groups based on waxiness scores as follows: group 1 (no or low waxiness with scores <2; group 2 (medium waxiness) with scores ≥2 and <5; group 3 (high waxiness) with scores above ≥5 (Table 2 and Table 3). The low waxiness group 1 was composed mainly of landraces: in 2016, 82 of 88 genotypes were landraces; in 2017, 60 of 69 genotypes were landraces. In contrast, CIMMYT lines dominated the high waxiness group 3; in this group, there were only 28 landraces out of 130 genotypes for the 2016 trial, and 38 landraces out of 144 genotypes in the 2017 trial. The results from the 2016 data analysis showed no association of AUNC with grain yield or waxiness in groups 1 and 3, but AUNC had a negative correlation with grain yield and waxiness for group 2 (Table 2), which contains a mixture of genotypes from all three breeding history groups. Using the 2017 data, no association was observed between AUNC with grain yield or waxiness or NDVIdr with grain yield or waxiness (Table 3).
As an alternative approach, the data from two field experiments at the Elora Research Station were segregated into three groups based on the breeding history (3 Canadian varieties excluded): landraces, commercial varieties, and CIMMYT lines. The results from the 2016 data showed a negative association between grain yield and waxiness in the landrace group, while no association was observed in the other two groups (Table 2). In the landrace group, a negative association between waxiness with AUNC and NDVIdr was observed from the results of the 2017 experiment (Table 3). There was no association between AUNC or NDVIdr with grain yield and waxiness in the commercial variety and CIMMYT groups except for a positive association between AUNC and waxiness for the CIMMYT lines. These results suggest that the confounding effect may be coming from the landraces which consist of a large number of genotypes with no or low waxiness and relatively low yield.
In addition, a positive association between waxiness and AUSC was consistently observed both for the combined analysis or when the data were analyzed by site or stratified by waxiness scores or breeding history (Table 1, Table 2 and Table 3). Grain yield was found to positively correlate with AUSC in three of the four test environments.

4. Discussion

Though the original purpose of this study was simply to characterize the NWDP for physiological traits to help future breeding efforts, there was an unexpected finding pertaining to the relationship between wax and NDVI as a measure of leaf chlorophyll. Based on the literature, it was expected that leaf wax and chlorophyll would positively correlate across the Nepali Wheat Diversity Panel. Epicuticular wax has been shown to protect the photosynthetic apparatus (photosystem II/chlorophyll) from high radiation and high temperature damage [33,34,37,38,52,53]. Indeed, consistent with this expectation, leaf chlorophyll as measured using SPAD (AUSC) was positively and consistently associated with waxiness across all the field trials. This association between waxiness and SPAD was consistent even when the panel was grouped by waxiness score or by breeding history. The relationship between AUNC and waxiness varied between environments, showing a weakly negative correlation in Elora 2016 and ABD2017, but a weakly positive correlation in Elora 2017. Within the sub-groups for waxiness or breeding history, the relationship was not any more consistent. In Elora 2017, where the overall correlation between waxiness and AUNC was positive, no significant correlation was found within the waxiness sub-groupings, and a negative relationship in the Landrace sub-group and a positive relationship in the CIMMYT lines sub-group. In 2016, where the overall correlation between waxiness and AUNC was negative, a similar trend to that of 2017 was seen within the sub-groupings; however, only the correlation in the Landrace group was statistically significant. Could cuticular wax confound the NDVI measurements in at least a subset of wheat genotypes?

4.1. Does Wax Interfere with NDVI?

Plants absorb ~70% of the solar radiation that they receive [54]. The radiation reflected is affected by various leaf properties such as pubescence and epicuticular waxiness, leaf angle, and leaf moisture content along with other optical and biochemical properties [55,56]. According to Holmes et al. (2002) [57], leaves with higher waxiness reflected more UV and longer wavelength radiation as compared to less waxy counterparts in a study that included a range of species. Another study conducted on forty-four plant species reported that plant leaf epicuticular properties and different environmental stress factors affect reflectance [58]. Since NDVI is based on reflectance, epicuticular wax and other traits may be confounding. The other factors that potentially complicate NDVI measurements are calibration, atmospheric transmission, and canopy architecture [59]; differences in types of genotypes and growth stages [60]; water regimes and nitrogen fertilization [60,61]; leaf properties such as the age of leaf [56], side of the leaf [62] and timing of NDVI measurements [28,30]. The limitation of this current study is that the other environmental factors were not assessed except for the weather records at each study site. The findings of this study suggest that waxiness scores may be affecting the NDVI reading although it was not possible to quantify the size of the effect. Similar to this result, a previous study on winter wheat also suggested that epicuticular wax could be one of the genotype-specific characters that potentially affect spectral reflectance, resulting in unexpected NDVI scores [63].
Wheat grain yield was previously shown to be positively associated with waxiness [36,39,40,41], NDVI [28], and SPAD measurements [18,23,27], and the expectation was that similar results would be observed in the current study. Here, although waxiness and AUSC had significant positive associations with grain yield in both field experiments during 2016 and 2017 seasons at the Elora Research Station, negative and positive associations between waxiness and AUNC during the 2016 and 2017 seasons, respectively, demanded further analysis. The other question raised was, why did the association between waxiness and NDVI vary between years? One possible explanation is related to moisture since moisture availability affects wax deposition [36,41]. Wax deposition is usually highest during drought-stress, contributing to improved water conservation by reducing the heat load on plant leaves [64]. There was a severe summer drought in the 2016 summer season which extended until the beginning of the reproductive stage [65] (Supplementary Materials Table S3 (weather data)), perhaps resulting in more wax deposition in “waxy genotypes.” By contrast, in 2017, Elora received a high amount of precipitation (uniform throughout the season), which perhaps decreased epicuticular wax on all genotypes including the “waxy genotypes.” Foley et al. (2006) [66] revealed that the near infra-red (NIR) wavelength was affected immediately by small changes in leaf water content, in a study where they examined the foliar spectra (350–2500 nm) of five tree species. While moisture availability affects spectral reflectance, the differential deposition of wax suggested in this study in response to moisture stress appears to be further complicating the relationship.
Both NDVI (AUNC) and SPAD (AUSC) are proxies for chlorophyll content. Therefore, the extent to which epicuticular wax may be interfering with NDVI was further validated by calculating the discrepancy in the association between waxiness and AUNC, and waxiness and AUSC (Table 4). The lowest discrepancy was in the low wax group 1 compared to the higher wax groups 2 and 3, consistent with wax interfering with NDVI measurements. However, the discrepancy was highest among landraces compared to commercial and CIMMYT lines in both years (Table 4). This observation is consistent with Morgounov et al. (2014) [60] who stated that differences in types of genotypes in a diversity panel may affect NDVI measurements; indeed, the landrace group was more genetically diverse than the other groups as evaluated using a molecular marker based population structure analysis of the NWDP [67]. It is hypothesized that waxiness, along with other associated factors such as seasonal precipitation and diversity of the genetic resources, confounded the correlations in this study.

4.2. UAV versus NDVI Measurements

In the Elora 2017 experiment, AUNC and NDVIdr exhibited a negative association, even though these are similar reflectance measurements but taken by different instruments. The expectation was to observe a positive association between these two readings. It has been shown that the positive correlation between NDVI and grain yield becomes stronger when UAVs are used compared to ground-based platforms such as Greenseeker NDVI [25,68] and that UAVs are more precise [69,70]. The advantage of using UAVs over ground-based platforms may be that they overcome the confounding effects of short term environmental variation (since handheld NDVI measurements take time for many plots), while UAVs allow measurements from many plots in a short span of time [25,50]. Although the UAV data in this study was scant, it did not noticeably improve the correlation with grain yield compared to handheld NDVI data. Earlier studies have shown that plant growth stage and time of NDVI measurement may affect the correlation between NDVI and grain yield [28,30]. Specifically, in wheat, the sensitivity of ground-based sensors such as in GreenSeeker has been found to be higher at early growth stages and at the senescence stage, while the sensitivity of UAV-based platforms has not been appraised [25]. In this study, NDVI was recorded 5 times during the crop season beginning at an early vegetative stage while the UAV was flown over the field only once after all the genotypes had begun heading. When NDVI readings from each of the five measurements using GreenSeeker were correlated with NDVIdr data, a significant negative association was observed between NDVIdr and the last three readings, including the final handheld NDVI reading which was taken only two days after the UAV flight (Supplementary Material Tables S4 and S5). This needs further evaluation to explain the unexpected association between NDVIdr and ground-based NDVI measurement using the GreenSeeker.

4.3. Grain Yield and its Association with Physiological Traits

Chlorophyll related traits are measured when characterizing germplasm to identify potential genotypes for breeding programs since chlorophyll has been shown to positively correlate with rates of photosynthesis and grain yield [10,71]. SPAD values are used to estimate chlorophyll content, and a positive association between SPAD (AUSC) and grain yield has been reported in many studies [18,23,72,73]. Here, chlorophyll measurements using SPAD (AUSC) were positively correlated with grain yield across two field experiments (Elora 2016 and ABD (Nepal) sites) but no correlation was observed at Elora 2017. The key factor confounding this association at Elora 2017 may have been the high Fusarium head blight (FHB) disease pressure during that year compared to 2016 (data is not shown), likely since 2017 was a wetter year which is more conducive to this disease. FHB directly reduces yield and tends to affect the wheat heads only without impact on the leaf tissue where the SPAD measurements were taken.
Waxiness is an important trait that protects plants from different biotic and abiotic stresses. Waxiness particularly contributes to drought stress tolerance by minimizing water loss through transpiration [33,34,36,37,38]. Many studies in the past have shown a positive association between epicuticular waxiness and grain yield [32,37]. A significant positive correlation between waxiness and grain yield was observed in the present study as expected.
NDVI is considered a reliable tool for estimating crop biomass and grain yield by assessing photosynthetically active radiation at the crop canopy level [25,27,68,74,75,76]. Therefore, the significant negative association observed between NDVI (AUNC) and grain yield at Elora 2016 was unexpected. To ensure the validity of this result, correlations between grain yield and NDVI values from individual time points were calculated (Supplementary Material Table S6). The results showed that four time points across both years showed a significant negative association, with only two that were positive (and weak). This individualized data is consistent with the overall and surprising conclusion of the negative association of these two traits. NDVIdr measurements taken with a UAV at Elora 2017 also did not show any significant association with grain yield (Supplementary Material Table S4). These results are incongruous with many earlier studies which reported NDVI to be positively correlated with grain yield [25,30,75,77]. However, some studies have also reported a negative association between NDVI and wheat grain yield, consistent with the current study [60,68,78]. When the study population was segregated into three groups based on waxiness scores and seed source (breeding history), the correlation between NDVI and grain yield was not significant except for the medium wax group (group 2) in 2016 (where a negative association was observed). Since wax groups positively correlated with grain yield, the argument here is also that epicuticular wax along with other environmental factors affected the NDVI readings.

4.4. Should NDVI Be Used in Future Diversity Studies for Wheat Grain Yield?

Many studies have shown the superiority of NDVI and other vegetative indices over SPAD in terms of wheat grain yield predictions especially under stressed conditions [68,79]. Despite this, positive associations of vegetative indices such as NDVI with SPAD values have been reported [68]. Therefore, based on the availability of machines/tools, SPAD or NDVI measurements are both common when evaluating a set of germplasm. However, the results in the present study suggest that NDVI may not be always superior to SPAD in terms of its ability to predict grain yield in wheat. Prasad et al. (2009) [80] also indicated that vegetation based NDVI may not be an effective breeding tool to identify higher biomass producing wheat genotypes compared to other spectral reflectance indices such as water-based indices and pigment-based indices. Furthermore, NDVI may not be appropriate for screening genotypes under extreme environmental conditions. For example, despite observing a strong positive association between NDVI and wheat grain yield under favorable conditions, the association was poor under severe drought conditions [81]. The NDVI platforms may differ in their sensitivity and capacity to discriminate between diverse wheat genotypes [82]. Samborski et al. (2015) [63] suggested that developing correction coefficients may not be very helpful for individual genotypes considering the practical challenges. A shortage of quality hyperspectral data can hinder accurate assessment and prediction of yield or any other important traits [76]. Combined, the literature and the current findings suggest caution should be used when using NDVI to predict wheat grain yield when a diverse genetic population is involved and when the environmental conditions are highly variable. On the other hand, while NDVI still is a commonly used tool to identify improved yield with a narrower genetic base, such as a breeding population, use of other vegetative indices such as Normalized Difference Red Edge (NDRE) may be another option. The performance of NDRE has been found to be better than NDVI considering its limitations associated with absorption of NDVI by the upper canopy and also its saturation at its maximum value during latter growth stages of the crop [83].

5. Conclusions

Chlorophyll-related parameters such as SPAD readings and spectral reflectance indices such as NDVI are commonly used to predict grain yield, appraise fertilizer requirements, and also to evaluate germplasm in breeding programs for abiotic stress tolerance. The findings from this study suggest that NDVI may not always be an effective predictor of wheat grain yield and that caution should be used when using this trait to evaluate diversity panels. Waxiness, high genetic diversity in the study panel, and environmental factors such as differential precipitation may confound NDVI measurements, raising valid questions as to the reliability of NDVI for predicting grain yield under these circumstances. It is already accepted that leaf epicuticular properties like waxiness affect reflectance measurements, although the extent of the effect is not clearly understood. This should be an area of further investigation, particularly since selection for higher waxiness in wheat has become common considering its advantages in abiotic stress tolerance and grain yield. Segregating the genotypes in a breeding population based on maturity, plant architecture, traits such as waxiness, and the target environment may help to identify and reduce confounding effects.

Supplementary Materials

The following are available online at https://0-www-mdpi-com.brum.beds.ac.uk/2073-4395/11/3/486/s1, Table S1: List of the genotypes in the Nepali Wheat Diversity Panel included in this study, Table S2: Analysis of variance for 318 genotypes belonging to the NWDP for phenotypic traits evaluated at four different field experiments conducted in 2016 and 2017, Table S3: Summary of weather data for the four field experiments conducted in Nepal and Canada during 2016 and 2017 wheat growing seasons, Table S4: Pearson correlation of NDVI values and AUNC with grain yield, Table S5: Detailed time course NDVI data from 2016 and 2017, Elora, Canada, Table S6: Correlation between grain yield and NDVI-related traits in separate analysis using data from 2016 and 2017 field season at the Elora Research Station, Canada.

Author Contributions

K.K. conceptualized the paper; K.K. wrote the manuscript; A.J.B. and H.J.E. contributed technical expertise and editing; M.N.R. contributed technical advice, and technical and language editing; A.N. supervised the project and provided technical expertise. All authors have read and agreed to the published version of the manuscript.

Funding

The funding for this research was kindly provided by a grant to M.N.R. from the Canadian International Food Security Research Fund (CIFSRF), jointly funded by the International Development Research Centre (IDRC, Ottawa) and Global Affairs Canada, along with the grants to A.N. from SeCan, the Agricultural Adaptation Council and Grain Farmers of Ontario.

Institutional Review Board Statement

Not applicable.

Informed Consent Statement

Not applicable.

Data Availability Statement

The data can be available on request to the corresponding author.

Acknowledgments

We dedicate this paper to our mentor, colleague and friend, the late, Alireza Navabi, who passed away suddenly during the preparation of this manuscript. The authors wish to thank Nick Wilker and Katarina Bosnic (University of Guelph) for assistance with seed handling and field planting. We thank Arun Kumar Joshi, Madan Bhatta and Deepak Pandey for facilitating seed acquisition from Nepal and Thomas Payne from CIMMYT, Mexico. For the Nepal trials, we thank Dhruba Bahadur Thapa and Deepak Pandey, and our research assistants, Sapana Ghimire and Niraj Ghimire, for their support in field data recording. Nepali landrace seeds were generously provided by the National Agriculture Genetic Resources Centre (NAGRC, Nepal) and Nepal Agricultural Research Council (NARC, Nepal). Seeds of released varieties were provided by the National Wheat Research Program (NWRP belonging to NARC, Nepal). CIMMYT breeding lines were provided by CIMMYT, Mexico.

Conflicts of Interest

The authors declare no conflict of interest. The funders had no role in the design of the study; in the collection, analyses, or interpretation of data; in the writing of the manuscript, or in the decision to publish the results.

References

  1. Shiferaw, B.; Smale, M.; Braun, H.-J.; Duveiller, E.; Reynolds, M.; Muricho, G. Crops that feed the world 10. Past successes and future challenges to the role played by wheat in global food security. Food Secur. 2013, 5, 291–317. [Google Scholar] [CrossRef] [Green Version]
  2. Hickey, L.T.; Hafeez, A.; Robinson, H.; Jackson, S.A.; Leal-Bertioli, S.C.M.; Tester, M.; Gao, C.; Godwin, I.D.; Hayes, B.J.; Wulff, B.B.H. Breeding crops to feed 10 billion. Nat. Biotechnol. 2019, 37, 744–754. [Google Scholar] [CrossRef] [Green Version]
  3. Abhinandan, K.; Skori, L.; Stanic, M.; Hickerson, N.M.N.; Jamshed, M.; Samuel, M.A. Abiotic Stress Signaling in Wheat—An Inclusive Overview of Hormonal Interactions During Abiotic Stress Responses in Wheat. Front. Plant Sci. 2018, 9, 734. [Google Scholar] [CrossRef] [PubMed]
  4. Sarto, M.V.M.; Sarto, J.R.W.; Rampim, L.; Rosset, J.S.; Bassegio, D.; Da Costa, P.F.; Inagaki, A.M. State University of Mato Grosso do Sul—UEMS Wheat phenology and yield under drought: A review. Aust. J. Crop. Sci. 2017, 11, 941–946. [Google Scholar] [CrossRef]
  5. Daryanto, S.; Wang, L.; Jacinthe, P.-A. Global Synthesis of Drought Effects on Maize and Wheat Production. PLoS ONE 2016, 11, e0156362. [Google Scholar] [CrossRef] [PubMed]
  6. Chen, X.; Min, D.; Yasir, T.A.; Hu, Y.-G. Evaluation of 14 morphological, yield-related and physiological traits as indicators of drought tolerance in Chinese winter bread wheat revealed by analysis of the membership function value of drought tolerance (MFVD). Field Crop. Res. 2012, 137, 195–201. [Google Scholar] [CrossRef]
  7. Barakat, M.N.; Saleh, M.; Al-Doss, A.; Moustafa, K.A.; Elshafei, A.A.; Al-Qurainy, F.H. Identification of new SSR markers linked to leaf chlorophyll content, flag leaf senescence and cell membrane stability traits in wheat under water stressed condition. Acta Biol. Hung. 2015, 66, 93–102. [Google Scholar] [CrossRef] [Green Version]
  8. Khadka, K.; Raizada, M.N.; Navabi, A. Recent Progress in Germplasm Evaluation and Gene Mapping to Enable Breeding of Drought-Tolerant Wheat. Front. Plant Sci. 2020, 11, 1149. [Google Scholar] [CrossRef] [PubMed]
  9. Khadka, K.; Earl, H.J.; Raizada, M.N.; Navabi, A. A Physio-Morphological Trait-Based Approach for Breeding Drought Tolerant Wheat. Front. Plant Sci. 2020, 11, 715. [Google Scholar] [CrossRef] [PubMed]
  10. Simkin, A.J.; López-Calcagno, P.; A Raines, C. Feeding the world: Improving photosynthetic efficiency for sustainable crop production. J. Exp. Bot. 2019, 70, 1119–1140. [Google Scholar] [CrossRef] [PubMed] [Green Version]
  11. Evans, J.R. Improving Photosynthesis. Plant Physiol. 2013, 162, 1780–1793. [Google Scholar] [CrossRef] [PubMed] [Green Version]
  12. Pinheiro, C.; Chaves, M.M. Photosynthesis and drought: Can we make metabolic connections from available data? J. Exp. Bot. 2010, 62, 869–882. [Google Scholar] [CrossRef] [Green Version]
  13. Zait, Y.; Schwartz, A. Climate-Related Limitations on Photosynthesis and Drought-Resistance Strategies of Ziziphus spina-christi. Front. For. Glob. Chang. 2018, 1, 3. [Google Scholar] [CrossRef]
  14. Rungrat, T.; Awlia, M.; Brown, T.; Cheng, R.; Sirault, X.; Fajkus, J.; Trtilek, M.; Furbank, B.; Badger, M.; Tester, M.A.; et al. Using Phenomic Analysis of Photosynthetic Function for Abiotic Stress Response Gene Discovery. Arab. Book 2016, 14, e0185. [Google Scholar] [CrossRef] [PubMed] [Green Version]
  15. Schwarz, E.M.; Tietz, S.; Froehlich, J.E. Photosystem I-LHCII megacomplexes respond to high light and aging in plants. Photosynth. Res. 2017, 136, 107–124. [Google Scholar] [CrossRef] [PubMed] [Green Version]
  16. Roach, T.; Krieger-Liszkay, A.K. Regulation of Photosynthetic Electron Transport and Photoinhibition. Curr. Protein Pept. Sci. 2014, 15, 351–362. [Google Scholar] [CrossRef] [Green Version]
  17. Shah, S.H.; Houborg, R.; McCabe, M.F. Response of chlorophyll, carotenoid and SPAD-502 measurement to salinity and nu-trient stress in wheat (Triticum aestivum L.). Agronomy 2017, 7, 61. [Google Scholar] [CrossRef] [Green Version]
  18. Rosyara, U.R.; Khadka, K.; Subedi, S.; Sharma, R.C.; Duveiller, E. Heritability of stay green traits and association with spot blotch resistance in three spring wheat populations. J. Genet. Breed. 2007, 61, 75–82. [Google Scholar]
  19. Rosyara, U.R.; Khadka, K.; Subedi, S.; Sharma, R.C.; Duveiller, E. Field resistance to spot blotch is not associated with unde-sirable physio-morphological traits in three spring wheat populations. J. Plant Pathol. 2009, 91, 113–122. [Google Scholar]
  20. Kira, O.; Linker, R.; Gitelson, A. Non-destructive estimation of foliar chlorophyll and carotenoid contents: Focus on informative spectral bands. Int. J. Appl. Earth Obs. Geoinf. 2015, 38, 251–260. [Google Scholar] [CrossRef]
  21. Guendouz, A.; Maamari, K. Grain-filling, chlorophyll content in relation with grain yield component of durum wheat in a Mediterranean environment. Afr. Crop Sci. J. 2012, 20, 31–37. [Google Scholar]
  22. Earl, H.J.; Davis, R.F. Effect of drought stress on leaf and whole canopy radiation use efficiency and yield of maize. Agron. J. 2003, 95, 688–696. [Google Scholar] [CrossRef]
  23. Rosyara, U.R.; Subedi, S.; Duveiller, E.; Sharma, R.C. Photochemical Efficiency and SPAD Value as Indirect Selection Criteria for Combined Selection of Spot Blotch and Terminal Heat Stress in Wheat. J. Phytopathol. 2010, 158, 813–821. [Google Scholar] [CrossRef]
  24. Guan, S.; Fukami, K.; Matsunaka, H.; Okami, M.; Tanaka, R.; Nakano, H.; Sakai, T.; Nakano, K.; Ohdan, H.; Takahashi, K. Assessing Correlation of High-Resolution NDVI with Fertilizer Application Level and Yield of Rice and Wheat Crops using Small UAVs. Remote Sens. 2019, 11, 112. [Google Scholar] [CrossRef] [Green Version]
  25. Condorelli, G.E.; Maccaferri, M.; Newcomb, M.; Andrade-sanchez, P.; White, J.W.; French, A.N.; Sciara, G.; Ward, R.; Tuberosa, R. Comparative aerial and ground based high throughput phenotyping for the genetic dissection of NDVI as a proxy for drought adaptive traits in durum wheat. Front. Plant Sci. 2018, 9, 893. [Google Scholar] [CrossRef] [PubMed]
  26. Sid’Ko, A.; Botvich, I.; Pisman, T.; Shevyrnogov, A. Estimation of chlorophyll content and yield of wheat crops from reflectance spectra obtained by ground-based remote measurements. Field Crop. Res. 2017, 207, 24–29. [Google Scholar] [CrossRef]
  27. Lopresti, M.F.; Di Bella, C.M.; Degioanni, A.J. Relationship between MODIS-NDVI data and wheat yield: A case study in Northern Buenos Aires province, Argentina. Inf. Process. Agric. 2015, 2, 73–84. [Google Scholar] [CrossRef] [Green Version]
  28. Gracia-Romero, A.; Kefauver, S.C.; Vergara-Díaz, O.; Zaman-Allah, M.A.; Prasanna, B.M.; Cairns, J.E.; Araus, J.L. Compar-ative performance of ground vs. Aerially assessed rgb and multispectral indices for early-growth evaluation of maize performance under phosphorus fertilization. Front. Plant Sci. 2017, 8, 2004. [Google Scholar] [CrossRef] [PubMed] [Green Version]
  29. Silva, G.F.C.; Gonçalves, A.C.A.; da Silva Junior, C.A.; Nanni, M.R.; Facco, C.U.; Cezar, E.; da Silva, A.A. NDVI response to water stress in different phenological stages in culture bean. J. Agron. 2016, 15, 1–10. [Google Scholar]
  30. Fernández, E.; Gorchs, G.; Serrano, L. Use of consumer-grade cameras to assess wheat N status and grain yield. PLoS ONE 2019, 14, e0211889. [Google Scholar] [CrossRef] [PubMed] [Green Version]
  31. Bi, H.; Kovalchuk, N.; Langridge, P.; Tricker, P.J.; Lopato, S.; Borisjuk, N. The impact of drought on wheat leaf cuticle properties. BMC Plant Biol. 2017, 17, 85. [Google Scholar] [CrossRef] [Green Version]
  32. Cossani, C.M.; Reynolds, M.P. Physiological Traits for Improving Heat Tolerance in Wheat. Plant Physiol. 2012, 160, 1710–1718. [Google Scholar] [CrossRef] [Green Version]
  33. Buschhaus, C.; Jetter, R. Composition and Physiological Function of the Wax Layers Coating Arabidopsis Leaves: β-Amyrin Negatively Affects the Intracuticular Water Barrier. Plant Physiol. 2012, 160, 1120–1129. [Google Scholar] [CrossRef] [Green Version]
  34. Huggins, T.D.; Mohammed, S.; Sengodon, P.; Ibrahim, A.M.H.; Tilley, M.; Hays, D.B. Changes in leaf epicuticular wax load and its effect on leaf temperature and physiological traits in wheat cultivars (Triticum aestivum L.) exposed to high temperatures during anthesis. J. Agron. Crop. Sci. 2017, 204, 49–61. [Google Scholar] [CrossRef]
  35. Jäger, K.; Fábián, A.; Eitel, G.; Szabó, L.; Deák, C.; Barnabäs, B.; Papp, I. A morpho-physiological approach differentiates bread wheat cultivars of contrasting tolerance under cyclic water stress. J. Plant Physiol. 2014, 171, 1256–1266. [Google Scholar] [CrossRef] [PubMed] [Green Version]
  36. Mohammed, S.; Huggins, T.D.; Beecher, F.; Chick, C.; Sengodon, P.; Mondal, S.; Paudel, A.; Ibrahim, A.M.; Tilley, M.; Hays, D.B. The Role of Leaf Epicuticular Wax in the Adaptation of Wheat (Triticum aestivum L.) to High Temperatures and Moisture Deficit Conditions. Crop Sci. 2018, 58, 679–689. [Google Scholar] [CrossRef]
  37. Pereira, J.F.; Da Cunha, G.R.; Moresco, E.R. Improved drought tolerance in wheat is required to unlock the production potential of the Brazilian Cerrado. Crop Breed. Appl. Biotechnol. 2019, 19, 217–225. [Google Scholar] [CrossRef] [Green Version]
  38. Shepherd, T.; Griffiths, D.W. The effects of stress on plant cuticular waxes. New Phytol. 2006, 171, 469–499. [Google Scholar] [CrossRef] [PubMed]
  39. Bowne, J.B.; Erwin, T.A.; Juttner, J.; Schnurbusch, T.; Langridge, P.; Bacic, A.; Roessner, U. Drought Responses of Leaf Tissues from Wheat Cultivars of Differing Drought Tolerance at the Metabolite Level. Mol. Plant 2012, 5, 418–429. [Google Scholar] [CrossRef] [PubMed] [Green Version]
  40. Willick, I.R.; Lahlali, R.; Vijayan, P.; Muir, D.; Karunakaran, C.; Tanino, K.K. Wheat flag leaf epicuticular wax morphology and composition in response to moderate drought stress are revealed by SEM, FTIR-ATR and synchrotron X-ray spectroscopy. Physiol. Plant. 2018, 162, 316–332. [Google Scholar] [CrossRef] [PubMed] [Green Version]
  41. Xue, D.; Zhang, X.; Lu, X.; Chen, G.; Chen, Z.-H. Molecular and Evolutionary Mechanisms of Cuticular Wax for Plant Drought Tolerance. Front. Plant Sci. 2017, 8, 621. [Google Scholar] [CrossRef] [PubMed]
  42. Khadka, K.; Torkamaneh, D.; Kaviani, M.; Belzile, F.; Raizada, M.N.; Navabi, A. Population structure of Nepali spring wheat (Triticum aestivum L.) germplasm. BMC Plant Biol. 2020, 20, 1–12. [Google Scholar] [CrossRef] [PubMed]
  43. Mo, A.D. Statistical Information on Nepalese Agriculture; Government of Nepal, Ministry of Agricultural Development, Agribusiness Promotion and Statistics Division, Agri Statistics Section: Kathmandu, Nepal, 2017.
  44. Gurung, D.B. Improving wheat productivity in Asia. In Proceedings of the Regional Consultation on Improving Wheat Productivity in Asia, Bangkok, Thailand, 26–27 April 2012; Paroda, R., Dasgupta, S., Mal, B., Singh, S.S., Jat, M.L., Singh, G., Eds.; FAO; APAARI; CIMMYT; ICARDA; JIRCAS: Bangkok, Thailand, 2013; pp. 112–123. [Google Scholar]
  45. DHM-MoSTE Nepal. Agroclimatic Atlas of Nepal; Department of Hydrology and Meteorology, Ministory of Science and Teconology, and Environment, Government of Nepal: Kathmandu, Nepal, 2013.
  46. Shrestha, N.; Raes, D.; Vanuytrecht, E.; Sah, S.K. Cereal yield stabilization in Terai (Nepal) by water and soil fertility man-agement modeling. Agric. Water Manag. 2013, 122, 53–62. [Google Scholar] [CrossRef]
  47. Depauw, R.M.; Knox, R.E.; McCaig, T.N.; Clarke, F.R.; Clarke, J.M. Carberry hard red spring wheat. Can. J. Plant Sci. 2011, 91, 529–534. [Google Scholar] [CrossRef]
  48. Patterson, H.D.; Williams, E.R. A new class of resolvable incomplete block designs. Biometrika 1976, 63, 83–92. [Google Scholar] [CrossRef]
  49. Tucker, C.J. Red and photographic infrared linear combinations for monitoring vegetation. Remote Sens. Environ. 1979, 8, 127–150. [Google Scholar] [CrossRef] [Green Version]
  50. Haghighattalab, A.; Pérez, L.G.; Mondal, S.; Singh, D.; Schinstock, D.; Rutkoski, J.; Ortiz-Monasterio, I.; Singh, R.P.; Goodin, D.; Poland, J. Application of unmanned aerial systems for high throughput phenotyping of large wheat breeding nurseries. Plant Methods 2016, 12, 1–15. [Google Scholar] [CrossRef] [PubMed] [Green Version]
  51. Torres, A.; Pietragalla, J. Chapter 19: Crop morphological traits. In Physiological Breeding II: A Field Guide to Wheat Breeding; Pask, A., Pietragalla, J., Mullan, D., Reynolds, M., Eds.; CIMMYT: Mexico City, Mexico, 2012; pp. 106–112. [Google Scholar]
  52. Guo, J.; Xu, W.; Yu, X.; Shen, H.; Li, H.; Cheng, D.; Liu, A.; Liu, J.; Liu, C.; Zhao, S.; et al. Cuticular wax accumulation is as-sociated with drought tolerance in wheat near-isogenic lines. Front. Plant Sci. 2016, 7, 1809. [Google Scholar] [CrossRef] [PubMed] [Green Version]
  53. Medeiros, C.; Falcão, H.; Almeida-Cortez, J.; Santos, D.; Oliveira, A.; Santos, M. Leaf epicuticular wax content changes under different rainfall regimes, and its removal affects the leaf chlorophyll content and gas exchanges of Aspidosperma pyrifolium in a seasonally dry tropical forest. S. Afr. J. Bot. 2017, 111, 267–274. [Google Scholar] [CrossRef]
  54. Gates, D.M.; Keegan, H.J.; Schleter, J.C.; Weidner, V.R. Spectral Properties of Plants. Appl. Opt. 1965, 4, 11–20. [Google Scholar] [CrossRef]
  55. Ballester, C.; Brinkhoff, J.; Quayle, W.C.; Hornbuckle, J. Monitoring the Effects of Water Stress in Cotton using the Green Red Vegetation Index and Red Edge Ratio. Remote Sens. 2019, 11, 873. [Google Scholar] [CrossRef] [Green Version]
  56. Walter-Shea, E.A.; Blad, B.L.; Hays, C.J.; Mesarch, M.A.; Deering, D.W.; Middleton, E.M. Biophysical properties affecting vegetative canopy reflectance and absorbed photsynthetically active radiation at the FIFE site. J. Geophys. Res. 1992, 97, 925–934. [Google Scholar]
  57. Holmes, M.G.; Keiller, D.R. Effects of pubescence and waxes on the reflectance of leaves in the ultraviolet and photosynthetic wavebands: A comparison of a range of species. Plant Cell Environ. 2002, 25, 85–93. [Google Scholar] [CrossRef]
  58. Mohammed, G.H.; Noland, T.L.; Irving, P.H.; Sampson, P.H.; Zarco-Tejada, P.J.; Miller, J.R. Natural and Stress-Induced Effects on Leaf Spectral Reflectance in Ontario Species; Ontario Forest Research Institute, Ontario Ministry of Natural Resources: Sault Ste. Marie, ON, Canada, 2000; Volume 156, ISBN 0777893878. [Google Scholar]
  59. Xue, J.; Su, B. Significant Remote Sensing Vegetation Indices: A Review of Developments and Applications. J. Sens. 2017, 2017, 1–17. [Google Scholar] [CrossRef] [Green Version]
  60. Morgounov, A.; Gummadov, N.; Belen, S.; Kaya, Y.; Keser, M.; Mursalova, J. Association of digital photo parameters and NDVI with winter wheat grain yield in variable environments. Turk. J. Agric. For. 2014, 38, 624–632. [Google Scholar] [CrossRef]
  61. Araus, J.L. Integrative physiological criteria associated with yield potential. In Increasing Yield Potential in Wheat: Breaking the Barriers; Reynolds, M.P., Rajaram, S., McNab, A., Eds.; International Maize and Wheat Improvement Center (CIMMYT): Mexico City, Mexico, 1996; pp. 150–166. [Google Scholar]
  62. Vergara-Díaz, O.; Chairi, F.; Vicente, R.; A Fernandez-Gallego, J.; Nieto-Taladriz, M.T.; Aparicio, N.; Kefauver, S.C.; Araus, J.L. Leaf dorsoventrality as a paramount factor determining spectral performance in field-grown wheat under contrasting water regimes. J. Exp. Bot. 2018, 69, 3081–3094. [Google Scholar] [CrossRef] [Green Version]
  63. Samborski, S.M.; Gozdowski, D.; Walsh, O.S.; Lamb, D.W.; Stępień, M.; Gacek, E.S.; Drzazga, T. Winter wheat genotype effect on canopy reflectance: Implications for using NDVI for in-season nitrogen topdressing recommendations. Agron. J. 2015, 107, 2097–2106. [Google Scholar] [CrossRef]
  64. Sreeman, S.M.; Vijayaraghavareddy, P.; Sreevathsa, R.; Rajendrareddy, S.; Arakesh, S.; Bharti, P.; Dharmappa, P.; Soola-nayakanahally, R. Introgression of physiological traits for a comprehensive improvement of drought adaptation in crop plants. Front. Chem. 2018, 6, 92. [Google Scholar] [CrossRef] [Green Version]
  65. Perdeaux, S. Climate Change Adaptation ‘Stories’ of Ontario: A Collection of Five Adaptation Initiatives from across Ontario; Ontario Centre for Climate Impacts and Adaptation Resources (OCCIAR); Laurentian University: Greater Sudbury, ON, Canada, 2017. [Google Scholar]
  66. Foley, S.; Rivard, B.; Sanchezazofeifa, G.; Calvo, J. Foliar spectral properties following leaf clipping and implications for handling techniques. Remote Sens. Environ. 2006, 103, 265–275. [Google Scholar] [CrossRef]
  67. Khadka, K. Genotypic and Phenotypic Analysis of a Nepali Spring Wheat (Triticum aestivum L.) Population. Ph.D. Thesis, University of Guelph, Guelph, ON, Canada, 2020. [Google Scholar]
  68. Kyratzis, A.C.; Skarlatos, D.P.; Menexes, G.C.; Vamvakousis, V.F.; Katsiotis, A. Assessment of Vegetation Indices Derived by UAV Imagery for Durum Wheat Phenotyping under a Water Limited and Heat Stressed Mediterranean Environment. Front. Plant Sci. 2017, 8, 1114. [Google Scholar] [CrossRef] [Green Version]
  69. Shi, Y.; Thomasson, J.A.; Murray, S.C.; Pugh, N.A.; Rooney, W.L.; Shafian, S.; Rajan, N.; Rouze, G.; Morgan, C.L.S.; Neely, H.L.; et al. Unmanned Aerial Vehicles for High-Throughput Phenotyping and Agronomic Research. PLoS ONE 2016, 11, e0159781. [Google Scholar] [CrossRef] [Green Version]
  70. Tattaris, M.; Reynolds, M.P.; Chapman, S.C. A direct comparison of remote sensing approaches for high-throughput pheno-typing in plant breeding. Front. Plant Sci. 2016, 7, 1131. [Google Scholar] [CrossRef]
  71. Hollington, P. Technological breakthroughs in creening/breeding wheat varieties for salt toleracne. In Proceedings of the Na-tional Conference on “Salinity Management in Agriculture”, Karnal, India, 2 December 1998; p. 36. [Google Scholar]
  72. Zhang, Y.; Wang, Z.; Fan, Z.; Li, J.; Gao, X.; Zhang, H.; Zhao, Q.; Wang, Z.; Liu, Z. Phenotyping and evaluation of CIMMYT WPHYSGP nursery lines and local wheat varieties under two irrigation regimes. Breed. Sci. 2019, 69, 55–67. [Google Scholar] [CrossRef] [Green Version]
  73. Islam, M.R.; Haque, K.M.S.; Akter, N.; Karim, M.A. Leaf chlorophyll dynamics in wheat based on SPAD meter reading and its relationship with grain yield. Sci. Agric. 2014, 4, 4–9. [Google Scholar]
  74. Sultana, S.R.; Ali, A.; Ahmad, A.; Mubeen, M.; Zia-Ul-Haq, M.; Ahmad, S.; Ercisli, S.; Jaafar, H.Z.E. Normalized difference vegetation index as a tool for wheat yield estimation: A case study from Faisalabad, Pakistan. Sci. World J. 2014, 2014, 1–8. [Google Scholar] [CrossRef] [PubMed] [Green Version]
  75. Rebetzke, G.J.; Jimenez-Berni, J.A.; Bovill, W.D.; Deery, D.M.; James, R.A. High-throughput phenotyping technologies allow accurate selection of stay-green. J. Exp. Bot. 2016, 67, 4919–4924. [Google Scholar] [CrossRef] [Green Version]
  76. Tan, C.; Wang, D.; Zhou, J.; Du, Y.; Luo, M.; Zhang, Y.; Guo, W. Remotely Assessing Fraction of Photosynthetically Active Radiation (FPAR) for Wheat Canopies Based on Hyperspectral Vegetation Indexes. Front. Plant Sci. 2018, 9, 776. [Google Scholar] [CrossRef] [PubMed] [Green Version]
  77. Zhang, K.; Wang, J.; Qin, H.; Wei, Z.; Hang, L.; Zhang, P.; Reynolds, M.; Wang, D. Assessment of the individual and combined effects of Rht8 and Ppd-D1a on plant height, time to heading and yield traits in common wheat. Crop. J. 2019, 7, 845–856. [Google Scholar] [CrossRef]
  78. Rutkoski, J.; Poland, J.A.; Mondal, S.; Autrique, E.; Pérez, L.G.; Crossa, J.; Reynolds, M.; Singh, R. Canopy Temperature and Vegetation Indices from High-Throughput Phenotyping Improve Accuracy of Pedigree and Genomic Selection for Grain Yield in Wheat. G3 Genes Genomes Genet. 2016, 6, 2799–2808. [Google Scholar] [CrossRef] [PubMed] [Green Version]
  79. Lopes, M.S.; Reynolds, M.P. Stay-green in spring wheat can be determined by spectral reflectance measurements (normalized difference vegetation index) independently from phenology. J. Exp. Bot. 2012, 63, 3789–3798. [Google Scholar] [CrossRef] [Green Version]
  80. Prasad, B.; Babar, M.A.; Carver, B.F.; Raun, W.R.; Klatt, A.R. Association of biomass production and canopy spectral reflec-tance indices in winter wheat. Can. J. Plant Sci. 2009, 89, 485–496. [Google Scholar] [CrossRef]
  81. Thapa, S.; Rudd, J.C.; Xue, Q.; Bhandari, M.; Reddy, S.K.; Jessup, K.E.; Liu, S.; Devkota, R.N.; Baker, J.; Baker, S. Use of NDVI for characterizing winter wheat response to water stress in a semi-arid environment. J. Crop. Improv. 2019, 33, 633–648. [Google Scholar] [CrossRef]
  82. Christopher, J.T.; Christopher, M.J.; Borrell, A.K.; Fletcher, S.; Chenu, K. Stay-green traits to improve wheat adaptation in well-watered and water-limited environments. J. Exp. Bot. 2016, 67, 5159–5172. [Google Scholar] [CrossRef] [Green Version]
  83. Fu, Z.; Jiang, J.; Gao, Y.; Krienke, B.; Wang, M.; Zhong, K.; Cao, Q.; Tian, Y.; Zhu, Y.; Cao, W.; et al. Wheat Growth Monitoring and Yield Estimation based on Multi-Rotor Unmanned Aerial Vehicle. Remote Sens. 2020, 12, 508. [Google Scholar] [CrossRef] [Green Version]
Figure 1. Pearson correlation values for pairs of phenotypic traits evaluated using the trait means calculated from all four field experiments conducted in 2016 and 2017. For each pair of traits indicated, the panel at the lower left intersection is the raw data, while the panel at the upper left intersection is the Pearson correlation value. The panel with the trait label indicates the distribution of the data. Significance: * p ≤ 0.05, ** p ≤ 0.001, *** p ≤ 0.0001. Abbreviations: AUNC = Area under NDVI curve, AUSC = Area under SPAD curve, GY = Grain yield, NDVIdr = NDVI derived from UAV/drone data.
Agronomy 11 00486 g001
Figure 2. A biplot generated for grain yield, waxiness, and chlorophyll-related traits evaluated in four field experiments in 2016 and 2017. Abbreviations: AUNC = Area under NDVI curve, AUSC = Area under SPAD curve, NDVIdr = NDVI derived from UAV/drone data, WAX = Waxiness, GY = Grain yield, EL = Elora, NW = National Wheat Research Program (NARC, Nepal), AB = Agricultural Botany Division (NARC, Nepal). The numbers 16 and 17 correspond to the year of experimentation, CIMMYT = International Maize and Wheat Improvement Center.
Agronomy 11 00486 g002
Figure 3. Scatter plots of AUNC with grain yield from four field experiments conducted in 2016 and 17. Trend line indicates a Pearson Correlation line of best fit; Abbreviation: AUNC = Area under NDVI curve.
Agronomy 11 00486 g003
Figure 4. Scatterplots of waxiness ratings and AUNC and AUSC from three field experiments conducted in 2016 and 2017 (no data was available for waxiness from the NWRP, Nepal site); Abbreviations: AUNC = Area under NDVI curve, AUSC = Area under SPAD curve.
Agronomy 11 00486 g004
Table 1. Pearson correlation measurements for pairs of phenotypic traits evaluated in four field experiments conducted in 2016 and 2017.
Traits
Location AUNCAUSCGYWAX
Elora 2016AUSC0.06
GY−0.21 ***0.33 ***
WAX−0.18 **0.66 ***0.34 ***
Elora 2017AUSC0.57 ***
GY0.030.06
WAX0.42 ***0.74 ***0.12 *
NDVIdr−0.18 **−0.31 ***−0.03−0.21 ***
ABD 2017AUSC−0.14 *
GY0.25 ***0.20 **
WAX−0.21 **0.48 ***0.44 ***
NWRP 2017GY0.05
Significance: * p ≤ 0.05, ** p ≤ 0.001, *** p ≤ 0.0001; Abbreviations: AUNC = Area under NDVI curve, AUSC = Area under SPAD curve, GY = Grain yield.
Table 2. Pearson correlations between pairs of phenotypic traits evaluated in field experiments conducted at the Elora Research Station (Canada) in 2016 (a dry year), after segregating the data based on waxiness scores and breeding histories.
TraitsGroups Based on Waxiness ScoresGroups Based on Breeding History
Group 1—Low wax (N = 88)
GY (kg/ha) (mean ± SEM) = 2720.1 ± 69.97
WAX (mean ± SE) = 1.2 ± 0.05
Landraces (N = 166)
GY (kg/ha) (mean ± SEM) = 2705.7 ± 48.43
WAX (mean ± SE) = 2.3 ± 0.10
AUNCAUSCGYAUNCAUSCGY
AUSC0.23 * 0.15
GY−0.160.19 −0.24 *0.11
WAX0.190.22 *−0.23 *−0.23 *0.47 ***0.11
Group 2—Medium wax (N = 100)
GY (kg/ha) (mean ± SEM) = 3037.3 ± 78.38
WAX (mean ± SE) = 2.9 ± 0.04
Commercial varieties (N = 34)
GY (kg/ha) (mean ± SEM) = 3608.3 ± 108.12
WAX (mean ± SE) = 2.9 ± 0.19
AUSC0.10 0.61 ***
GY−0.34 **0.11 0.48 *0.14
WAX−0.22 *0.35 **0.22 *0.180.38 * (check)0.12
Group 3—Highest wax (N = 130)
GY (kg/ha) (mean ± SEM) = 3413.3 ± 54.53
WAX (mean ± SE) = 5.2 ± 0.11
CIMMYT lines (N = 115)
GY (kg/ha) (mean ± SEM) = 3474.7 ± 53.89
WAX (mean ± SE) = 4.9 ± 0.15
AUSC0.45 *** 0.30 **
GY0.140.15 0.090.06
WAX0.170.46 ***0.030.180.45 ***0.00
Significance: * p ≤ 0.05, ** p ≤ 0.001, *** p ≤ 0.0001; Abbreviations: AUNC = Area under NDVI curve, AUSC = Area under SPAD curve, GY = Grain yield, CIMMYT = International Maize and Wheat Improvement Center.
Table 3. Pearson correlations between pairs of phenotypic traits evaluated in field experiments conducted at the Elora Research Station (Canada) in 2017 (a wet year), after segregating the data based on waxiness scores and breeding histories.
TraitsGroups Based on Waxiness ScoresGroups Based on Breeding History
Group 1—Low wax (N = 69),
GY (kg/ha) (mean ± SEM) = 1917.9 ± 87.31
WAX (mean ± SE) = 1.3 ± 0.05
Landraces (N = 166)
GY (kg/ha) (mean ± SEM) = 1987.3 ± 53.07
WAX (mean ± SE) = 2.9 ± 0.13
AUNCAUSCGYWAXAUNCAUSCGYWAX
AUSC0.50 *** 0.51 ***
GY−0.13−0.24 −0.03−0.01
WAX−0.140.04−0.28 * −0.30 ***0.67 ***0.03
NDVIdr−0.30*−0.37 *0.160.210.19 *−0.42 ***−0.01−0.25 **
Group 2—Medium wax (N = 105)
GY (kg/ha) (mean ± SEM) = 1977.6 ± 61.45
WAX (mean ± SE) = 2.9± 0.05
Commercial varieties (N = 34)
GY (kg/ha) (mean ± SEM) = 2240.3 ± 120.29
WAX (mean ± SE) = 4.1 ± 0.25
AUSC0.41 *** 0.55 **
GY−0.12−0.10 − 0.10−0.09
WAX0.170.43 ***0.01 0.220.74 ***0.24
NDVIdr0.07−0.24*−0.09−0.18−0.13−0.100.10−0.11
Group 3—Highest wax (N = 144)
GY (kg/ha) (mean ± SEM) = 2126.8 ± 63.58
WAX (mean ± SE) = 5.6 ± 0.09
CIMMYT lines (N = 115)
GY (kg/ha) (mean ± SEM) = 3474.7 ± 53.89
WAX (mean ± SE) = 5.1 ± 0.15
AUSC0.35 *** 0.33 **
GY0.090.12 0.080.15
WAX0.100.39 ***0.08 0.28 *0.64 ***0.20 *
NDVIdr−0.16−0.17*−0.01−0.02−0.16−0.20 *−0.06−0.17
Significance: * p ≤ 0.05, ** p ≤ 0.001, *** p ≤ 0.0001; Abbreviations: AUNC = Area under NDVI curve, AUSC = Area under SPAD curve, GY = Grain yield, NDVIdr = NDVI derived from UAV/drone data, CIMMYT = International Maize and Wheat Improvement Center.
Table 4. Discrepancy observed between the correlations for waxiness with AUNC, and waxiness with AUSC.
Elora 2016
TraitsGroups based on waxiness scoresGroups based on breeding history
Group 1—Low wax (N = 88)Landraces (N = 166)
AUNCAUSC* DiscrepancyAUNCAUSC* Discrepancy
WAX0.190.22 *0.03−0.23 *0.47 ***0.70
Group 2—Medium wax (N = 100)Commercial varieties (N = 34)
WAX−0.22 *0.35 **0.570.180.38 *0.20
Group 3—Highest wax (N = 130)CIMMYT lines (N = 115)
WAX0.170.46 ***0.290.180.45 ***0.27
Elora 2017
TraitsGroups based on waxiness scoresGroups based on breeding history
Group 1 (N = 69)Landraces (N = 166)
AUNCAUSCDiscrepancyAUNCAUSCDiscrepancy
WAX−0.140.040.18−0.30 ***0.67 ***0.97
Group 2 (N = 105)Commercial varieties (N = 34)
WAX0.170.43 ***0.260.220.74 ***0.52
Group 3 (N = 144)CIMMYT lines (N = 115)
WAX0.100.39 ***0.290.28 *0.64 ***0.36
Significance: * p ≤ 0.05, ** p ≤ 0.001, *** p ≤ 0.0001; * The discrepancy was calculated as r (WAX with AUSC)–r (WAX with AUNC). Abbreviations: AUNC = Area under NDVI curve, AUSC = Area under SPAD curve, WAX = Waxiness, CIMMYT = International Maize and Wheat Improvement Center.
Publisher’s Note: MDPI stays neutral with regard to jurisdictional claims in published maps and institutional affiliations.

