
Development of a Five-Parameter Model to Facilitate the Estimation of Additive, Dominance, and Epistatic Effects with a Mediating Using Bootstrapping in Advanced Generations of Wheat (Triticum aestivum L.)


 , , and
Abstract
:1. Introduction
2. Materials and Methods
3. Results
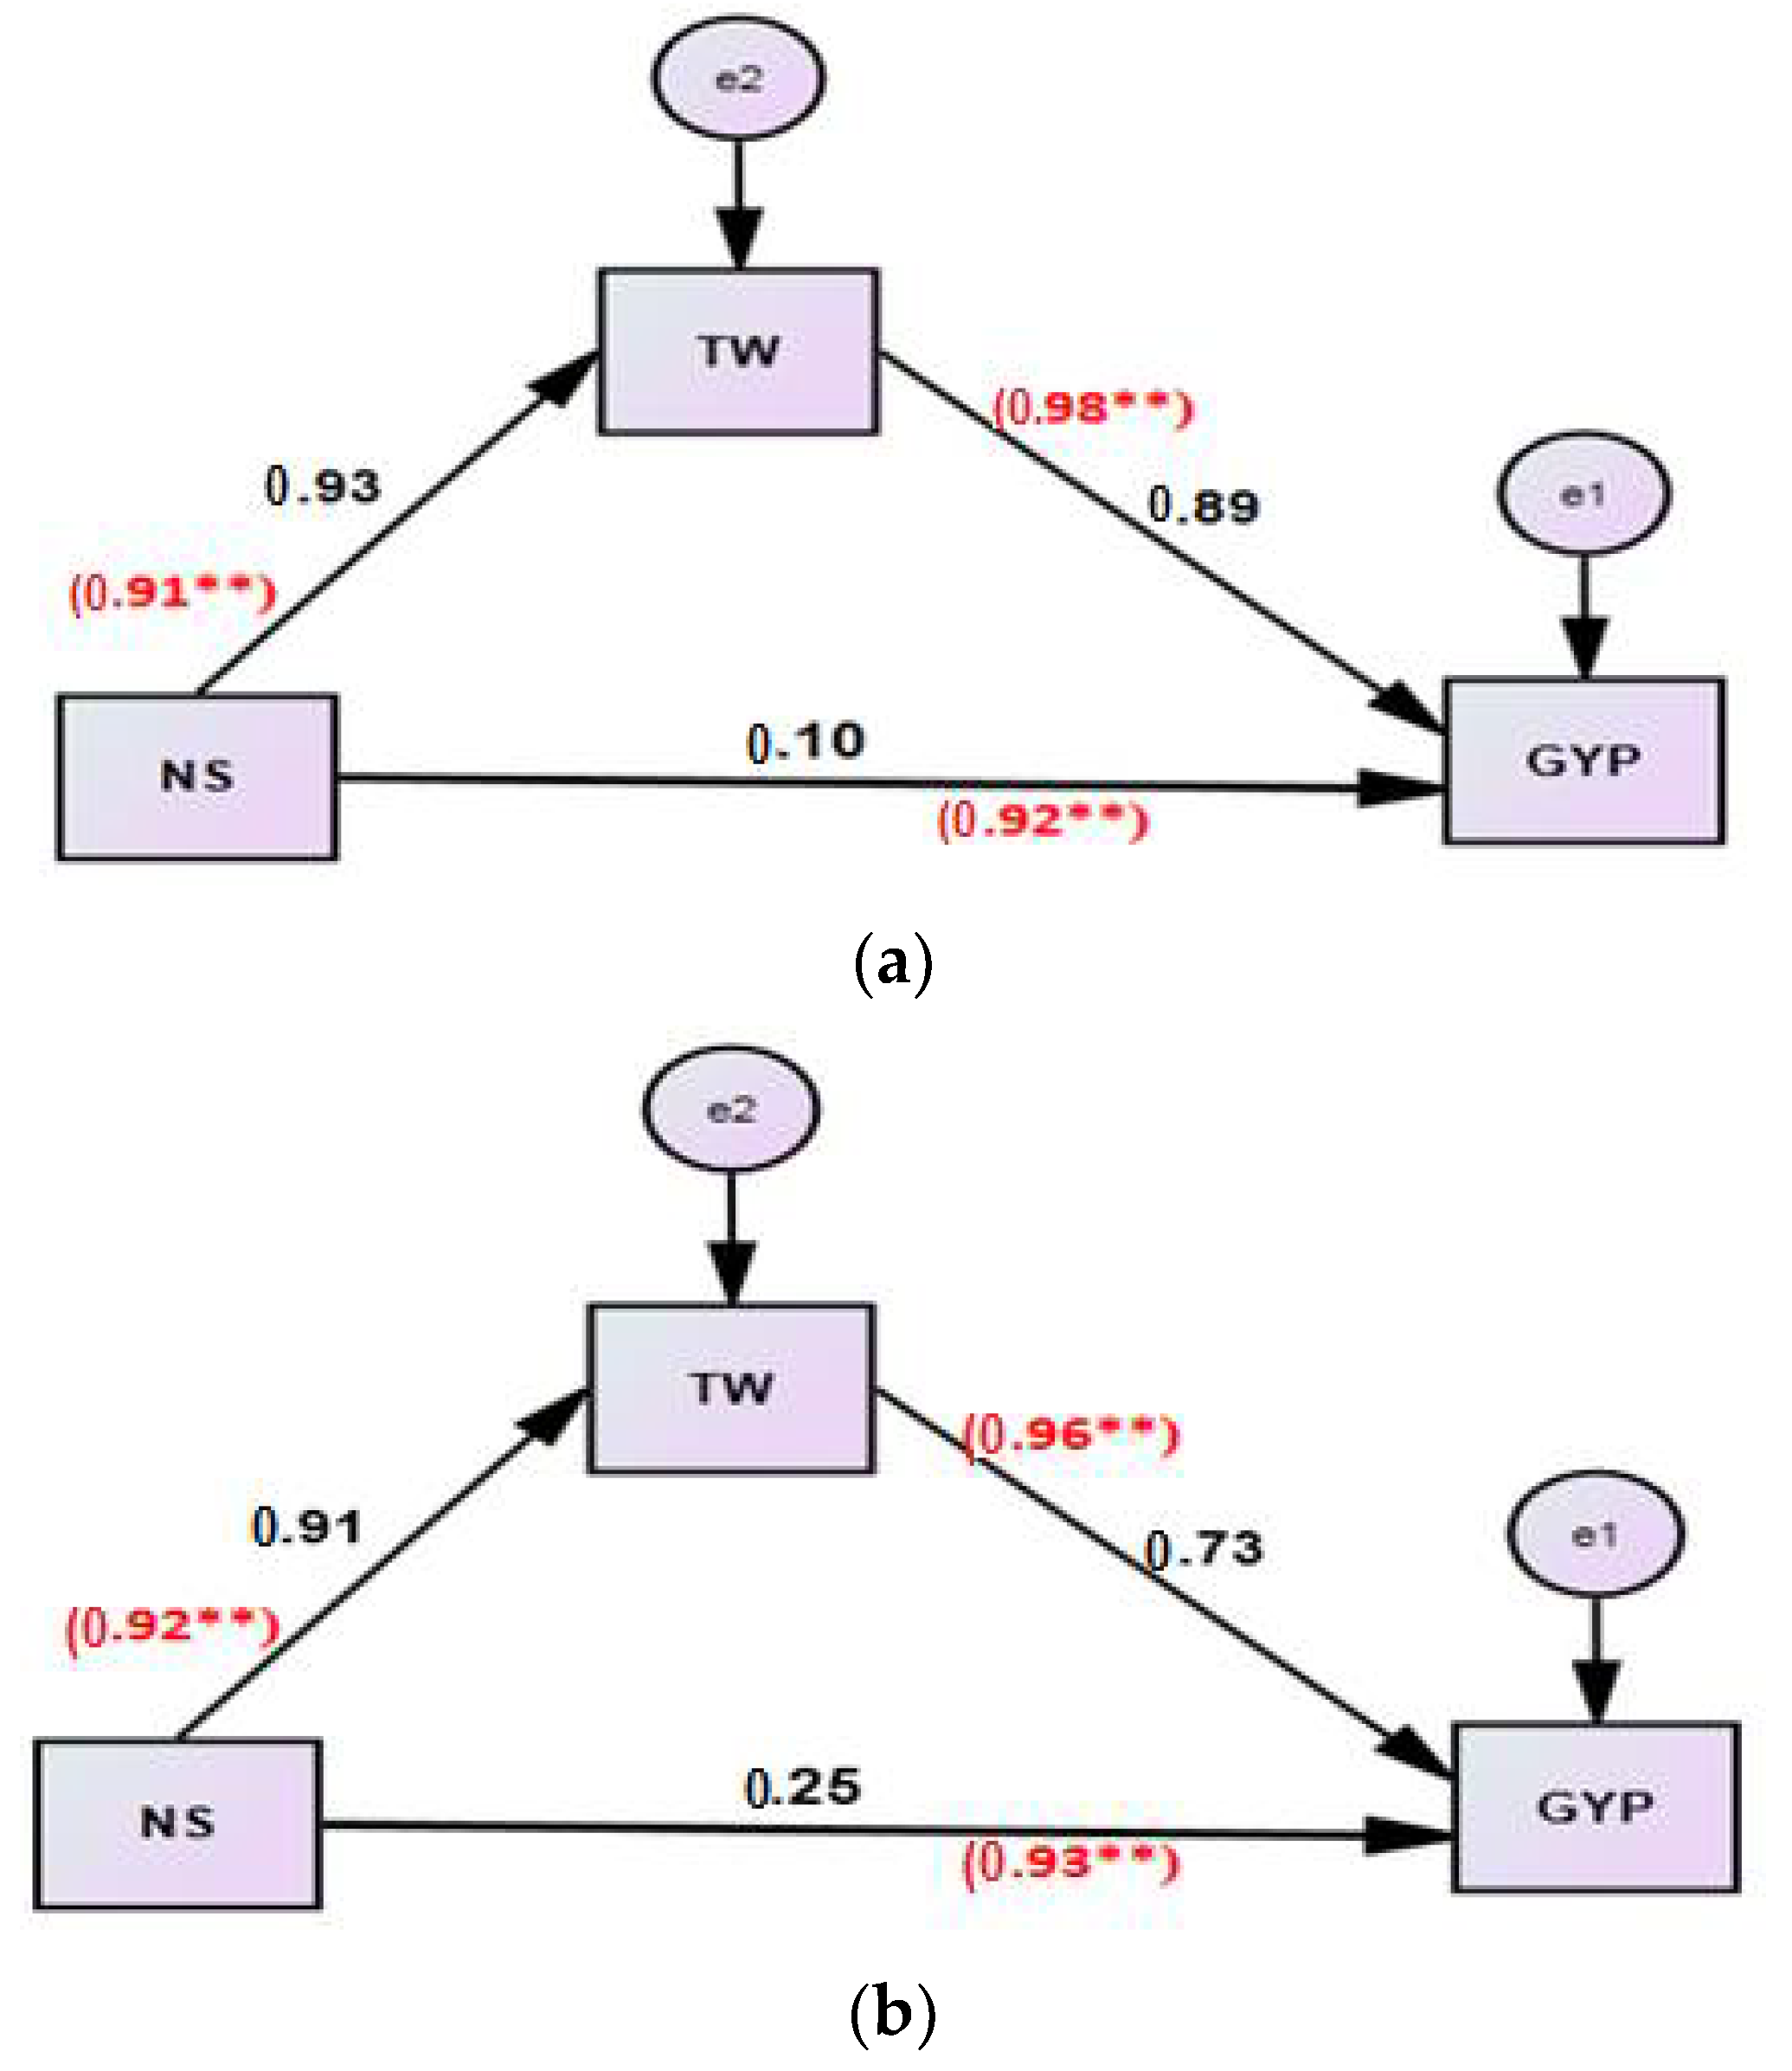
4. Discussion
5. Conclusions
Author Contributions
Funding
Institutional Review Board Statement
Informed Consent Statement
Data Availability Statement
Acknowledgments
Conflicts of Interest
References
- FAO (Food and Agriculture Organization of the United Nations). FAOSTAT: World Crop Production Data. 2017. Available online: http://www.fao.org/giews/countrybrief/country.jsp?code=EGY (accessed on 21 September 2017).
- Chandra, D.; Islam, M.A.; Barma, N.C.D. Variability and interrelationship of nine quantitative characters in F5 bulks of five wheat crosses. Pak. J. Biol. Sci. 2004, 7, 1040–1045. [Google Scholar] [CrossRef]
- Chowdhry, M.A.; Rafiq, M.; Alam, K. Genetic architecture of grain yield and certain other traits in bread wheat. Pak. J. Agric. Res. 1992, 13, 216–220. [Google Scholar]
- Larik, A.S.; Mahar, A.R.; Hafiz, H.M.I. Heterosis and combining ability estimates in diallel crosses of six cultivars of spring wheat. Wheat Inform. Serv. 1995, 80, 12–19. [Google Scholar]
- Srivastava, R.B.; Paroda, R.S.; Sharma, S.C.; Yunus, M.D. Genetic variability and advance under four selection procedures in wheat pedigree breeding programme. Theor. Appl. Genet. 1989, 77, 516–520. [Google Scholar] [CrossRef] [PubMed]
- El-Ameen, T.A.; Hossain, A.; Teixeira da Silva, J.A. Genetic analysis and selection for bread wheat (Triticum aestivum L.) yield and agronomic traits under drought conditions. Int. J. Plant Breed. 2013, 7, 61–68. [Google Scholar]
- Mahdy, E.E.; Ismail, A.A.; Kheiralla, K.A. The relative merits of selection index and pedigree selection in improving grain yield of spring wheat. Assiut J. Agric. Sci. 1996, 27, 18–33. [Google Scholar]
- Hamam, K.A. Late and early pedigree selection for grain yield with three selection criteria in two populations in bread wheat. J. Plant Prod. Mansoura Univ. 2014, 5, 1831–1847. [Google Scholar] [CrossRef]
- Erkul, A.; Ünay, A.; Konak, C. Inheritance of yield and yield components in a bread wheat (Triticum aestivum L.) cross. Turk. J. Field Crops 2010, 15, 137–140. [Google Scholar]
- Hayman, B.I. The separation of epistatic from additive and dominance variation in generation means. Heredity 1958, 12, 371–390. [Google Scholar] [CrossRef] [Green Version]
- Jinks, J.L.; Jones, R.M. Estimation of the components of heterosis. Genetics 1958, 43, 223–234. [Google Scholar] [CrossRef]
- Kearsey, M.J.; Pooni, H.S. The Genetical Analysis of Quantitative Traits, 1st ed.; Chapman and Hall: London, UK, 1996. [Google Scholar]
- Mather, K.; Jinks, J.L. Biometrecal Genetics; Chapman and Hall: London, UK, 1971. [Google Scholar]
- Abdel Nour, N.A.R.; Moshref, K.H.M. Gene effects and variances in three wheat crosses using the five parameters model. Egypt. J. Plant Breed. 2006, 10, 305–318. [Google Scholar]
- Hamam, K.A. Estimation of genetic parameters using five populations model in three bread wheat crosses under normal irrigation and drought stress. Egypt. J. Plant Breed. 2013, 17, 63–79. [Google Scholar]
- Khaled, M.A.I. Analysis of yield and yield components in two bread wheat crosses under water stress conditions. Egypt. J. Agric. Res. 2013, 91, 1489–1501. [Google Scholar]
- Koumber, R.M.; El-Gammaal, A.A. Inheritance and gene action for yield and its attributes in three bread wheat crosses (Triticum aestivum L.). World J. Agric. Sci. 2012, 8, 156–162. [Google Scholar] [CrossRef]
- Abbasi, S.; Baghizadeh, A.; Mohammadi-Nejad, G.; Nakhoda, B. Genetic Analysis of Grain Yield and Its Components in Bread Wheat (Triticum aestivum L.). Annu. Res. Rev. Biol. 2014, 24, 3636–3644. [Google Scholar] [CrossRef]
- Khalaf, A.; Yassein, A.; Sabet, T. Genetic Statistical Model to Estimate Epistasis, Additive and Dominance Genetic Effects Using Advanced Populations. Egypt. J. Agron. 2017, 39, 127–135. [Google Scholar] [CrossRef] [Green Version]
- Fisher, R.X.V. The Correlation between Relatives on the Supposition of Mendelian Inheritance. Earth Environ. Sci. Trans. R. Soc. Edinb. 1919, 52, 399–433. [Google Scholar] [CrossRef] [Green Version]
- Mather, K.; Jinks, J.L. Biometrical Genetic, 3rd ed.; Chapman and Hall: London, UK, 1982. [Google Scholar]
- Dewey, D.R.; Lu, K.H. A correlation and path coefficient analysis of components of crested wheat grass seed production. Agron. J. 1959, 51, 515–518. [Google Scholar] [CrossRef]
- Arbuckle, J.L. IBM SPSS Amos 24 User’s Guide; Amos Development Corporation, SPSS Inc.: Crawfordville, FL, USA, 2017. [Google Scholar]
- Hayes, A.F.; Montoya, A.K.; Rockwood, N.J. The analysis of mechanisms and their contingencies: PROCESS versus structural equation modeling. Australas. Mark. J. 2017, 25, 76–81. [Google Scholar] [CrossRef]
- Amin, I.A. Genetic behaviour of some agronomic traits in two durum wheat crosses under heat stress. Alex. J. Agric. Res. 2013, 58, 53–66. [Google Scholar]
- Farshadfar, E.; Aghaie, M.; Sharifi, M.; Yaghotipoor, A. Assessment of salt tolerance inheritance in barley via generation mean analysis. J. Biol. Sci. 2008, 8, 461–465. [Google Scholar] [CrossRef] [Green Version]
- Tammam, A.M. Generation mean analysis in bread wheat under different environmental conditions. Minufiy J. Agric. Res. 2005, 30, 937–956. [Google Scholar]
- Lakens, D. Calculating and reporting effect sizes to facilitate cumulative science: A practical primer for t-tests and ANOVAs. Front. Psychol. 2013, 4, 1–12. [Google Scholar] [CrossRef] [PubMed] [Green Version]
- Levine, T.R.; Hullett, C.R. Eta Squared, Partial Eta Squared, and Misreporting of Effect Size in Communication Research. Hum. Commun. Res. 2002, 28, 612–625. [Google Scholar] [CrossRef]
- Norouzian, R.; Plonsky, L. Eta- and partial eta-squared in L2 research: A cautionary review and guide to more appropriate usage. Second Lang. Res. 2018, 34, 257–271. [Google Scholar] [CrossRef]
- Cohen, J. A power primer. Psychol. Bullet. 1992, 112, 155–159. [Google Scholar] [CrossRef]
- Gadolina, I.; Papic, L.; Zaynetdinov, R. Statistical bootstrap in the problem of availability factor estimating: Example of SRs 1200 excavator reliability. Int. J. Syst. Assur. Eng. Manag. 2019, 10, 21–28. [Google Scholar] [CrossRef]
- Jung, K.; Lee, J.; Gupta, V.; Cho, G. Comparison of Bootstrap Confidence Interval Methods for GSCA Using a Monte Carlo Simulation. Front. Psychol. 2019, 10, 24–25. [Google Scholar] [CrossRef] [Green Version]


| Populations | Gene Actions | ||||
|---|---|---|---|---|---|
| Additive-Dominance Model | Non-Allelic (Epistasis) | ||||
| m | a | D | I = aa | L = DD | |
| 1 | +1 | 0 | +1 | 0 | |
| 1 | −1 | 0 | +1 | 0 | |
| 1 | 0 | +1/16 | 0 | +1/256 | |
| 1 | 0 | +1/32 | 0 | +1/1024 | |
| 1 | 0 | +1/64 | 0 | +1/4096 | |
| Source of Variation | df | Mean Square | |||||
|---|---|---|---|---|---|---|---|
| N. Spikelet | 1000-Weight | Grain y/Plant | |||||
| Cross I (P1 × P2) | 2017 | 2018 | 2017 | 2018 | 2017 | 2018 | |
| Rep. | 2 | 5.48 ns | 1.75 ns | 1.11 ns | 0.23 ns | 0.59 ns | 0.18 ** |
| Populations | 4 | 226.97 ** | 160.80 ** | 620.50 ** | 532.54 ** | 341.12 ** | 353.90 ** |
| Error | 61 | 1.85 | 1.71 | 0.76 | 0.68 | 0.56 | 0.25 |
| Effect Size η2% | 89.00 | 89.3 | 98.2 | 96.7 | 97.5 | 94.8 | |
| Cross II (P1 × P3) | |||||||
| Rep. | 2 | 0.09 ns | 1.26 ns | 2.63 ns | 0.02 ns | 1.09 ns | 3.17 ns |
| Populations | 4 | 220.16 ** | 242.21 ** | 496.20 ** | 511.42 ** | 338.01 ** | 370.12 ** |
| Error | 61 | 1.73 | 1.39 | 1.125 | 0.77 | 1.23 | 0.96 |
| Effect Size η2% | 86.00 | 91.9 | 99.10 | 97.7 | 98.1 | 96.20 | |
| Generations | No. | Traits | |||||
|---|---|---|---|---|---|---|---|
| N. Spikelet (n) | 1000-Weight (g) | Grain Yield/Plant (g) | |||||
| Mean ± S.E | Mean ± S.E | Mean ± S.E | |||||
| Cross I (P1 × P2) | 2017 | 2018 | 2017 | 2018 | 2017 | 2018 | |
| Sakha93 (P1) | 10 | 20.00 ± 0.45 | 20.20 ± 0.54 | 37.96 ± 0.28 | 38.60 ± 0.15 | 15.97 ± 0.08 | 15.72 ± 0.21 |
| Gimmiza5 (P2) | 10 | 16.60 ± 0.65 | 17.80 ± 0.74 | 33.90 ± 0.31 | 34.30 ± 0.30 | 12.56 ± 0.14 | 12.47 ± 0.15 |
| t-value | 4.29 ** | 2.49 ** | 9.65 ** | 12.99 ** | 20.95 ** | 12.74 ** | |
| F5 | 18 | 25.00 ± 0.27 | 24.17 ± 0.26 | 48.30 ± 0.24 | 47.57 ± 0.24 | 22.99 ± 0.29 | 23.20 ± 0.13 |
| F6 | 15 | 26.73 ± 0.32 | 25.97 ± 0.13 | 49.28 ± 0.23 | 48.85 ± 0.24 | 24.33 ± 0.16 | 24.24 ± 0.11 |
| F7 | 15 | 26.76 ± 0.34 | 26.47 ± 0.08 | 49.69 ± 0.15 | 49.31 ± 0.11 | 24.53 ± 0.11 | 24.50 ± 0.09 |
| Cross II (P1 × P3) | |||||||
| Sakha93 (P1) | 10 | 19.80 ± 0.44 | 19.60 ± 0.60 | 38.10 ± 0.28 | 37.90 ± 0.23 | 15.83 ± 0.12 | 15.93 ± 0.19 |
| Sids1 (P3) | 10 | 21.80 ± 0.33 | 22.00 ± 0.33 | 43.90 ± 0.31 | 43.79 ± 0.29 | 20.03 ± 0.12 | 19.77 ± 0.18 |
| t-value | 3.64 ** | 3.49 ** | 13.84 ** | 15.82 ** | 24.15 ** | 14.77 ** | |
| F5 | 18 | 27.60 ± 0.33 | 28.00 ± 0.25 | 51.40 ± 0.29 | 51.67 ± 0.23 | 25.57 ± 0.30 | 26.40 ± 0.30 |
| F6 | 15 | 28.29 ± 0.32 | 29.27 ± 0.25 | 52.77 ± 0.25 | 52.82 ± 0.24 | 28.02 ± 0.39 | 28.30 ± 0.28 |
| F7 | 15 | 29.29 ± 0.34 | 29.54 ± 0.25 | 53.10 ± 0.30 | 52.92 ± 0.17 | 28.30 ± 0.27 | 28.55 ± 0.28 |
| Generations | No. | Traits | |||||
|---|---|---|---|---|---|---|---|
| N. Spikelet | 1000−Weight | Grain y/Plant | |||||
| Mean | Mean | Mean | |||||
| Cross I | 2017 | 2018 | 2017 | 2018 | 2017 | 2018 | |
| Scaling test | A | 20.31 ** | 17.55 ** | 28.66 ** | 27.38 ** | 22.81 ** | 22.36 ** |
| B | 16.97 ** | 15.94 ** | 28.34 ** | 26.63 ** | 20.93 ** | 21.33 ** | |
| C | −8.74 ** | −8.41 ** | −18.08 ** | −18.52 ** | −5.18 ** | −4.98 ** | |
| Gene Actions | m | 26.23 ** | 26.70 ** | 50.05 ** | 49.64 ** | 24.42 ** | 24.59 ** |
| a | 1.70 ** | 1.20 ** | 2.03 ** | 2.15 ** | 1.71 ** | 1.63 ** | |
| D | 51.41 ns | −6.25 ns | −21.12 ns | −17.28 ns | 17.28 ns | −0.11 ns | |
| I | −7.93 ** | −7.70 ** | −14.12 ** | −13.19 ** | −10.15 ** | −10.49 ** | |
| L | −1137.78 ns | −548.86 ns | −109.23 ns | −254.86 ns | −641.71 ns | −352.71 ns | |
| Cross II | |||||||
| Scaling test | A | 18.92 ** | 19.48 ** | 26.28 ** | 26.24 ** | 25.08 ** | 24.69 ** |
| B | 17.70 ** | 18.01 ** | 24.86 ** | 24.34 ** | 21.30 ** | 21.91 ** | |
| C | −9.75 ** | −9.19 ** | −22.07 ** | −22.59 ** | −7.30 ** | −7.11 ** | |
| Gene Actions | m | 29.45 ** | 29.56 ** | 53.19 ** | 52.70 ** | 27.95 ** | 28.34 ** |
| a | −1.00 ** | −1.2 ** | −2.09 ** | −2.95 ** | −2.10 ** | −1.92 ** | |
| D | −3.25 ns | 6.51 ns | 1.6 ns | 24.00 ns | 42.56 ns | 28.31 ns | |
| I | −8.65 ** | −8.76 ** | −12.19 ** | −11.85 ** | −10.02** | −10.49 ** | |
| L | −416.63 ns | −502.90 ns | −484.69 ns | −648.53 ns | −1290.24 ns | −949.36 ns | |
| Effect | Traits | Season | Value | Confidence Interval Using Bootstrapping | p-Value by Bootstrapping | Sig. | |
|---|---|---|---|---|---|---|---|
| Lower | Upper | ||||||
| Direct Effect via | TW | First | 0.89 | 0.80 | 0.96 | 0.003 | ** |
| Second | 0.73 | 0.64 | 0.83 | 0.008 | ** | ||
| NS | First | 0.10 | 0.17 | 0.19 | 0.04 | * | |
| Second | 0.25 | 0.15 | 0.35 | 0.006 | ** | ||
| Indirect Effect of NS via | TW | First | =(0.93) (0.89) =0.83 | 0.73 | 0.92 | 0.04 | * |
| Second | =(0.91) (0.73) =0.66 | 0.56 | 0.77 | 0.003 | ** | ||
| Total effect | TW | First | =0.89 + 0.83 =1.72 | 0.91 | 0.93 | 0.015 | * |
| Second | =0.73 + 0.66 =1.39 | 0.87 | 0.92 | 0.005 | ** | ||
| NS | First | 0.1 | 0.89 | 0.94 | 0.007 | ** | |
| Second | 0.25 | 0.88 | 0.93 | 0.006 | ** | ||
| Type of mediation | First season | Partial mediation | |||||
| Second season | Partial mediation | ||||||
Publisher’s Note: MDPI stays neutral with regard to jurisdictional claims in published maps and institutional affiliations. |
© 2021 by the authors. Licensee MDPI, Basel, Switzerland. This article is an open access article distributed under the terms and conditions of the Creative Commons Attribution (CC BY) license (https://creativecommons.org/licenses/by/4.0/).
Share and Cite
Khalaf, A.E.A.; Eid, M.A.M.; Ghallab, K.H.; El-Areed, S.R.M.; Yassein, A.A.M.; Rady, M.M.; Ali, E.F.; Majrashi, A. Development of a Five-Parameter Model to Facilitate the Estimation of Additive, Dominance, and Epistatic Effects with a Mediating Using Bootstrapping in Advanced Generations of Wheat (Triticum aestivum L.). Agronomy 2021, 11, 1325. https://0-doi-org.brum.beds.ac.uk/10.3390/agronomy11071325
Khalaf AEA, Eid MAM, Ghallab KH, El-Areed SRM, Yassein AAM, Rady MM, Ali EF, Majrashi A. Development of a Five-Parameter Model to Facilitate the Estimation of Additive, Dominance, and Epistatic Effects with a Mediating Using Bootstrapping in Advanced Generations of Wheat (Triticum aestivum L.). Agronomy. 2021; 11(7):1325. https://0-doi-org.brum.beds.ac.uk/10.3390/agronomy11071325
Chicago/Turabian StyleKhalaf, Ahmed E. A., Mohamed A. M. Eid, Kamal H. Ghallab, Sherif R. M. El-Areed, Ahmed A. M. Yassein, Mostafa M. Rady, Esmat F. Ali, and Ali Majrashi. 2021. "Development of a Five-Parameter Model to Facilitate the Estimation of Additive, Dominance, and Epistatic Effects with a Mediating Using Bootstrapping in Advanced Generations of Wheat (Triticum aestivum L.)" Agronomy 11, no. 7: 1325. https://0-doi-org.brum.beds.ac.uk/10.3390/agronomy11071325