Article

Incidence of GLMD-Like Symptoms on Grapevines Naturally Infected by Grapevine Pinot gris virus, Boron Content and Gene Expression Analysis of Boron Metabolism Genes

1
Mendeleum-Institute of Genetics, Faculty of Horticulture, Mendel University in Brno, Valticka 334, 69144 Lednice, Czech Republic
2
Department of Viticulture and Enology, Faculty of Horticulture, Mendel University in Brno, Valticka 337, 69144 Lednice, Czech Republic
3
Laboratoire de Biologie des Systèmes Microbiens (LBSM), Ecole Normale Supérieure de Kouba, Vieux-Kouba, 16050 Alger, Algeria
*
Author to whom correspondence should be addressed.
Submission received: 22 March 2021 / Revised: 12 May 2021 / Accepted: 17 May 2021 / Published: 21 May 2021
(This article belongs to the Special Issue The Complex Roles of Viruses in Agroecosystems)

Abstract

:
Grapevine Pinot gris virus (GPGV) is considered to be a causal agent of Grapevine Leaf Mottling and Deformation (GLMD) disease that has been reported worldwide through the grapevine-growing regions. Seven grapevines that were collected from a vineyard in the Czech Republic were tested for the presence of GPGV in leaf and phloem tissues. Each of the seven grapevines was infected by GPGV, from which sic symptoms were mostly shown without a typical mottling. The phylogeny based on RNA-dependent RNA polymerase and movement/coat protein sequences indicated the same origin of the GPGV isolates. The GPGV titer was the highest in the grapevines with the highest GLMD-like symptoms; however, some of the grapevines with milder GLMD-like symptoms had a lower GPGV titer than the asymptomatic grapevine. Soil analysis showed uneven boron content in the direct vicinity of the grapevines, while the boron content in the grapevines was more, even showing no boron deficiency. The quantitative analysis of selected gene expressions associated with boron efflux and transport only partially explained the boron content in the soil and grapevines and only in the grapevines growing in soils with the highest or lowest boron contents. The VvBor2 and VvNIP5 genes had a higher expression and VvNIP6 had a lower expression in the grapevine growing in the soil with the lowest boron content, while a low expression of VvBor1 and VvBor2 was observed in the grapevine that was grown in the soil with the highest boron content.

1. Introduction

Grapevine Pinot gris virus (GPGV) is a member of the genus Trichovirus in the family Betaflexiviridae. The virus was initially described in Italian grapevine cv. Pinot gris, in which it causes Grapevine Leaf Mottling and Deformation (GLMD) disease [1,2]. GPGV is widespread in many wine-producing countries around the world [3], and it was recently detected in Canada [4], Armenia [5], Australia [6], Brazil [7], Chile [8], Pakistan [9], and Algeria [10]. The typical symptoms, which are apparent mostly in the beginning of the season, are delayed budburst, leaf distortion and mottling, stunted shoots, and poor yield due to increased berry acidity [2]. It is hard to assess the economic impact of GPGV, because many GPGV strains do not provoke GLMD symptoms [2,3,10,11]. Several studies conducted in Italy have monitored the production and growth parameters of GLMD-affected/GPGV-infected vineyards [2,12,13]. The observations that were performed in Prosecco vineyards in Veneto, northeast Italy, showed a reduction in bunch quality and led to the removal of GLMD-affected plants and subsequent economic loss [14]. The Czech Republic has 18,000 ha of vineyards, where only symptomless GPGV isolates were observed [15,16,17].
The presence and sequence variations in GPGV isolates remain unknown worldwide. There are few studies that have suggested that GPGV is genetically diverse and it consists of numerous haplotypes [2,5,13,16,17]. Saldarelli et al. [2] reported variations in the codons of the movement protein/coat protein (MP/CP) and RNA dependent RNA polymerase (RdRp) domains based on which genotypes were divided into the non-symptom and symptom causing genotypes. Bertazzon et al. [4] recently showed three cluster phylogeny with non-symptomatic, symptomatic, and both non-symptomatic and symptomatic genotypes.
The similar period of symptom occurrence in the spring and the resemblance of GLMD symptoms to boron deficiency symptoms lead to an investigation for the connection between GPGV infection and boron metabolism [12]. The affection of boron supply on viral symptom occurrence is well known and it has also been described in other pathosystems [18,19]. In controlled conditions, the GLMD symptoms in GPGV positive grapevines only occurred at boron deficiency conditions, while, at sufficient boron availability, the symptoms were not visible, regardless of GPGV infection [20]. In the same study, the gene expression analyses of two boron exporters BOR1 and BOR2 and two nodulin-26-like intrinsic proteins, NIP5;1 and NIP6;1, revealed that the GPGV presence during boron deficiency conditions significantly alters the expression of these genes.
Boron exporter BOR1 plays a key role in xylem loading and boron distribution within shoots [21], and it is mainly expressed in the root, but also in other tissues [22]. At boron deficiency, the expression of this gene was elevated in grapevine leaves and roots, while, at the GPGV infection during the boron deficiency, its expression was significantly higher than in healthy plants [20]. BOR2 is an efflux-type boron transporter that has been proposed to facilitate the effective cross linking of RG-II by boron in the cell wall [22]. This protein is strongly expressed in the root tissues, and it is essential for root cell elongation under low boron conditions [23]. Different expressions of this gene were observed in grapevine roots and leaves under boron deficiency, where the expression was downregulated in healthy plant roots and upregulated in leaves, while, in GPGV infected plants, the expression was significantly downregulated in both roots and leaves when compared to healthy plants [20].
Intrinsic proteins NIP5;1 and NIP6;1 are both localized in the plasma membrane, but their B transport functions are different. NIP5;1 is involved in the initial uptake process in root cells [24] and its expression increases under boron deficiency [25,26]. NIP6;1 may function in xylem–phloem boron re-translocation into young growing tissues [27]. The gene expression levels under boron deficiency of NIP5;1 and NIP6;1 at healthy grapevines were the opposite, where the VvNIP5 gene was upregulated and VvNIP6 downregulated in both roots and leaves [20]. GPGV infected plants had significantly different expressions of both genes only in the leaves, where VvNIP5 was downregulated and VvNIP6 upregulated as compared to the healthy plants that were grown in boron deficiency conditions [20].
We surveyed seven grapevines in one field where the GLMD-like symptoms occurred in early September. Together with GPGV detection and relative quantification, we investigated the phylogeny of GPGV isolates. To obtain the whole picture of GLMD symptom development, we also analyzed the content of boron in the soil and in the mostly symptomatic grapevine shoots and leaves together with the gene expression analysis of boron efflux and uptake genes.

2. Material and Methods

2.1. Sampling and Collection of Plant Samples

In September 2020, a field survey was conducted in a single vineyard located in wine-growing region in the Czech Republic: Rajhrad, Znojmo subregion, Moravian region (GPS: 49.0894583N, 16.6044350E). Seven grapevines cv. Sauvignon blanc grafted on SO4 were sampled according to GLMD symptoms. Based on the severity of GLMD symptoms, the grapevines were scaled from 0 to 5 (0—no symptoms, 5—highest symptom severity). All of the grapevines were five years old. From each tested grapevine, 2–3 one-year old green shoots with leaves were sampled, packed, and transferred to Mendeleum Laboratory, Department of Genetics. Seven samples, one from each grapevine, were tested for the presence of GPGV and then used for the measurement of boron content.

2.2. Sampling and Collection of Soil Samples

The soil was collected at the same time as the grapevines were sampled. The soil was collected from the direct vicinity of an individual tested grapevine. The amount of 300 g was engraved from the upper 25 cm of soil horizon. The measurement of the pH (pH-Meter 766, Knick, Berlin, Germany) and soil type (by a ribbon test) determination was done separately for each of the seven samples and then averaged. Each of the soil samples was then used for the measurement of boron content.

2.3. RNA Extraction and RT-PCR Detection of GPGV and Sequencing of MP/CP and RdRp PCR Amplicons

RNA was extracted using the Spectrum Plant Total RNA Kit (Sigma-Aldrich, St. Louis, MO, USA) from 1 g of a petiole and leaf mixture grounded at −80 °C by mortar and pestle. From each grapevine, one RNA sample (one biological replicate) was obtained. RNA was then reverse transcribed to cDNA, as described by Eichmeier et al. [28]. Subsequently, PCR GPGV detection was performed utilizing 1 U of GoTaq® G2 Flexi DNA Polymerase (Promega, Madison, WI, USA). The primers used were targeting MP/CP [29] and RdRp domain [2], and they are listed in Supplementary Table S1. The PCR conditions were as described in the articles from which the primers were used. The PCR amplicons were purified and sequenced from both sides by Sanger sequencing, as described by Eichmeier et al. [28].

2.4. Phylogenetic Analysis

The acquired sequences of tested samples and sequences of the symptomatic behaving GPGV isolates that are available in GenBank, together with sequences from our previous phylogenetic studies [3,10,11], were used in phylogenetic analysis to determine the phylogeny that can be associated with the symptomatic manifestation of the GPGV isolates [2]. The RdRp domain and MP/CP sequences were analyzed according to the parameters published by Eichmeier et al. [3]. All of the obtained sequences were also blasted using BlastN (NCBI) against GPGV reference Acc. No. NC_015782.2 (GenBank) to unveil detailed diversity and nucleotide positioning of the sequences.

2.5. GPGV Relative Quantification

Prior to real-time PCR, the extracted RNA from each grapevine (one biological replicate per grapevine) was treated with DNase I (Sigma-Aldrich, St. Louis, MO, USA) according to the manufacturer’s instructions. After treatment, 300 ng of RNA from each sample was reverse transcribed to cDNA. Briefly, RNA was reverse transcribed with 100 U RevertAid Reverse Transcriptase (Thermo Fisher Scientific, Waltham, MA, USA) using 0.5 µM of random hexamers p(dN)6 (Roche, Basel, Switzerland) in the 20 µL reactions. All the other steps of reverse transcription were following the reverse transcriptase manufacturer’s instructions.
The quantitative real-time PCR (qPCR) assay targeting CP gene [13] was used for GPGV relative quantification. The housekeeping grapevine Vv60SRP gene (60S ribosomal gene), which was previously described as the most stable gene [20], was used for normalization of GPGV quantities between the samples. A 20 µL reaction volume consisted of 1 × HotSybr qPCR Kit (MCLab, San Francisco, CA, USA), 2 µL of prepared cDNA, CP, or Vv60SRP specific primers (Supplementary Table S2), and PCR grade water. Two reactions were prepared for each sample per each target and run in the real-time PCR cycler qTower (Analytik Jena, Jena, Germany). The cycling conditions were 10 min. at 95 °C for polymerase activation and 40 cycles of 15 s at 95 °C, 40 s at 60 °C, and reading on FAM channel. After cycling, the specificity of the products was checked by melting temperature analysis. Prior to relative quantification, the primer pair efficiency (E) values were evaluated on the standard curves of serial dilutions of pooled cDNA. For relative quantification, the Pfaffl [30] ΔΔCt method was used and the analyses were performed using qPCRsoft 3.4 software (Analytik Jena, Jena, Germany).

2.6. Gene Expression Analysis

The expression of genes that were responsible for borate transport (VvBOR1 and VvBOR2) and facilitating B influx (VvNIP5 and VvNIP6) was evaluated by relative quantification in real-time PCR. The same cDNA, real-time PCR mix composition, but with corresponding primers (primer sequences of analyzed genes are listed in Supplementary Table S2) and normalization genes for gene expression between the samples, was used as for GPGV relative quantification. The other procedures of the real-time PCR and post PCR analyses, except for the cycling conditions, which were 40 cycles of 15 s at 95 °C and 40 s at 58 °C and reading on the FAM channel, were the same as those described at GPGV relative quantification.

2.7. Analysis of Boron Content in Soil and Grapevine Shoots and Leaves

The determination of boron content in soil was performed according to the protocol outlined by Berger [31]. All the glassware for samples was immersed in 4 M HNO3 for 24 h before analysis. Ten grams of soil sample was added into the Erlenmeyer flask and then mixed with 50 mL of hot distilled water and five drops of 10% MgSO4·7H2O. The flask was closed with a reflux and the suspension was boiled for 5 min. Hot suspension was filtered through a Quantitative Grade 390 filter paper (Sartorius, Gottingen, Germany). Six milliliters of cooled soil extract were mixed with 0.5 mL of oxidizing agent (6 M H2SO4 and 0.2 M KMnO4 in a 1:1 ratio) and then heated in a boiling bath for 10 min. After cooling, 0.5 mL of ascorbic acid was added into the test tubes with samples and mixed thoroughly. After complete decolorization, 4 mL of a reagent (Azomethin H solution mixed with buffer and masking solution in a 1:1 ratio prepared before use) was added into the solution, mixed, and then left to stand at room temperature for 2 h. The absorbance of the solutions was measured in a spectrophotometer SPEKOL 11 (Carl Zeiss Jena, Jena, Germany) at a wavelength of 420 nm. The boron content was calculated from the calibration curve that was prepared according to Berger [31].
The determination of boron content in leaf and shoot tissues was performed according to the protocol implemented by Krug et al. [32]. Five grams, a 1:1 ratio of leaves, and shoots weighed with accuracy on 0.1 mg of dried and ground sample were incinerated in previously 4 M HNO3 treated crucibles in the oven, as follows: 1 h at 200 °C, 1 h at 300 °C, and 6 h at 450 °C. After cooling down, 2 mL of 2 M HNO3 (nitric acid) and 8 mL of 6 M HCl (hydrochloric acid) were added into the content of crucibles, covered, and then briefly boiled on a stove. The suspension was then quantitatively transferred into a 50 mL measuring flask and adjusted with distilled water to the mark. The prepared samples were left to stand until the next day and then filtered into PE containers. Two milliliters of mineralized sample were pipetted into a 50 mL beaker and 4 mL of distilled water and 4 mL of reagent (Azomethin H solution mixed with buffer and masking solution in a 1:1 ratio prepared before use) were added. The solution was thoroughly mixed, left to stand for 2 h, and then measured on a spectrophotometer SPEKOL 11 (Carl Zeiss Jena, Jena, Germany) at 420 nm. The boron content (mg.kg−1 of soil/grapevine shoots and leaves) was directly recorded from the graph of the calibration curve.

2.8. Statistical Analysis

Molecular phylogenetic analyses of GPGV MP/CP and GPGV RdRp sequences were performed by the Maximum Likelihood method that was based on the Tamura–Nei model [33]. The cladograms were constructed in MEGA 7 [34], Muscle [35], and the UPGMB clustering method.

3. Results

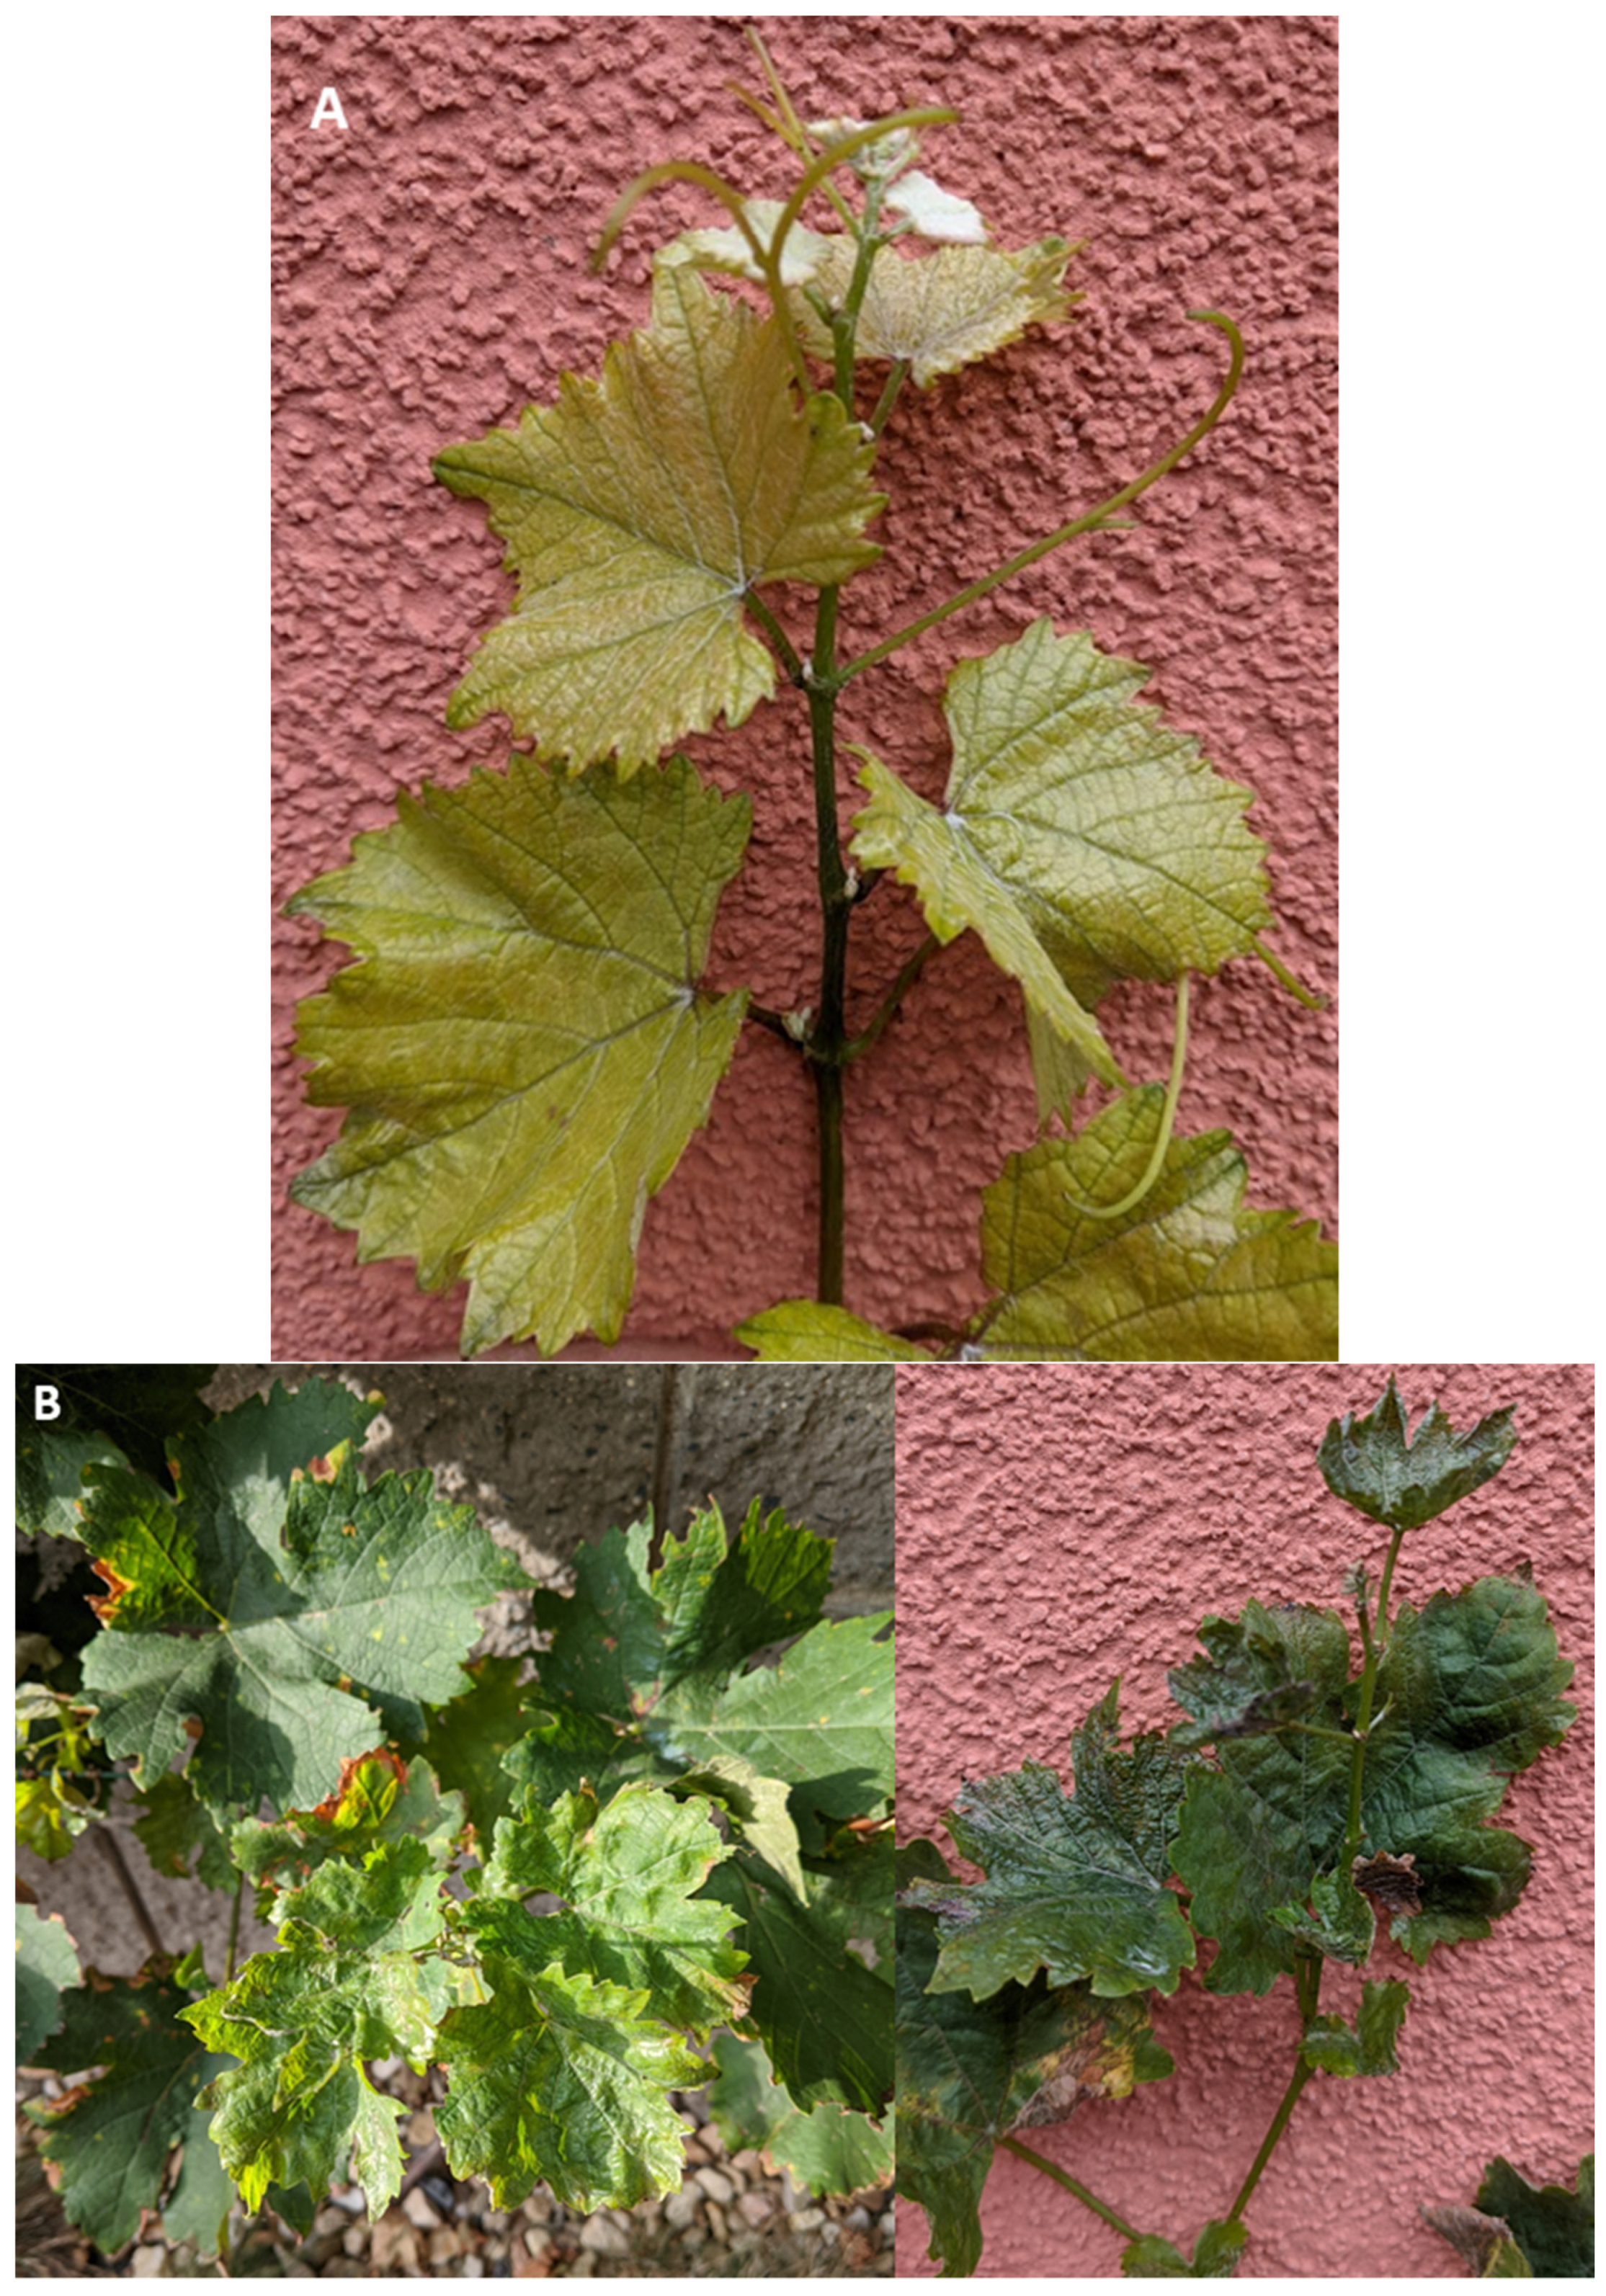
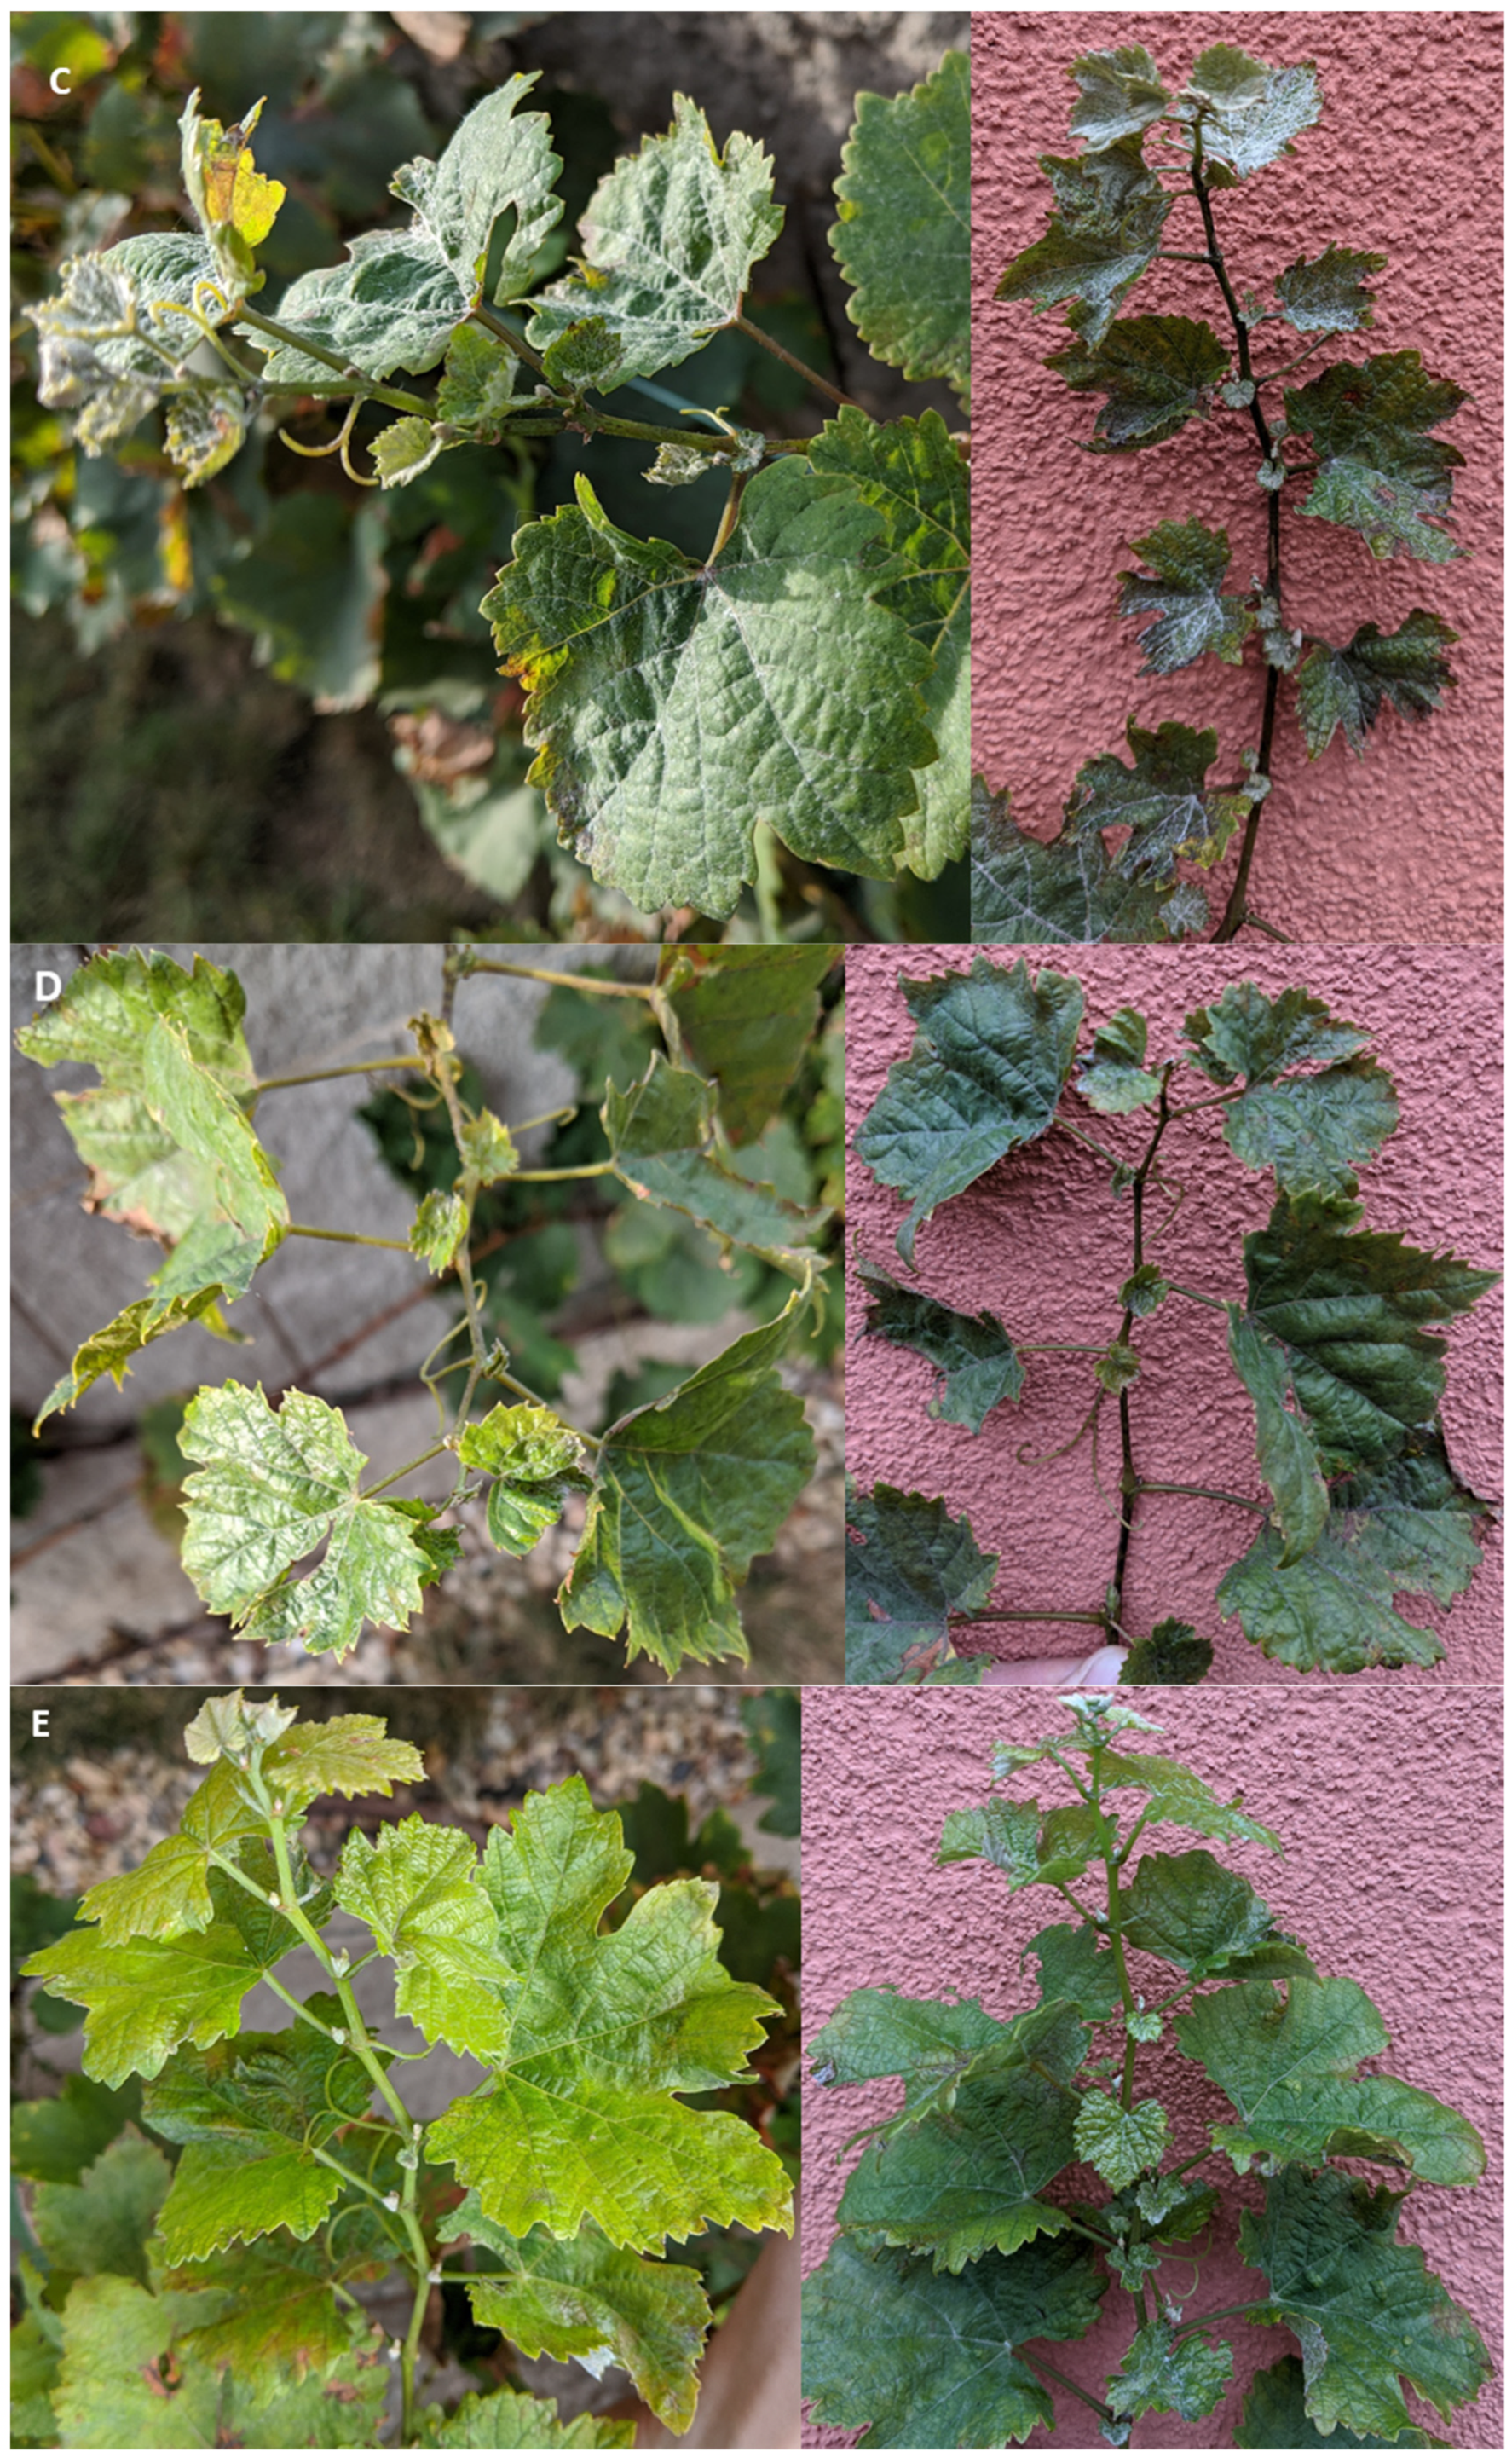
3.1. Symptomatology and GPGV Detection

Based on the severity of GLMD symptoms, the plants were scaled from 0 to 5 (0—no symptoms, 5—highest symptom severity). Despite leaf chlorosis, no typical GLMD symptoms were observed in sample Sb/SO4_1 (Figure 1A), thus scoring 0 (no symptoms) in the GLMD symptom severity scale. The rest of the samples showed GLMD symptoms, where the sample Sb/SO4_7 (Figure 1F) scored 1 in the scale, only showing weak symptoms, sample Sb/SO4_4 (Figure 1D) scored 2, showing milder symptoms, samples Sb/SO4_6 and Sb/SO4_8 (Figure 1E,G) scored 3, and finally samples Sb/SO4_2 and Sb/SO4_3 (Figure 1B,C) scored 4, showing more severe symptoms (curly top leaves, deformation of the leaves, stunted growth, thin internodes, and dense foliage); see Table 1 for detailed description.
Based on two primer pairs targeting MP/CP and RdRp, all of the tested grapevine samples were GPGV positive (Table 1). Each of the obtained PCR amplicons was sequenced, and the sequences were deposited in GenBank under Acc. Nos. MW147696-MW147703 and MW147704-MW147711.

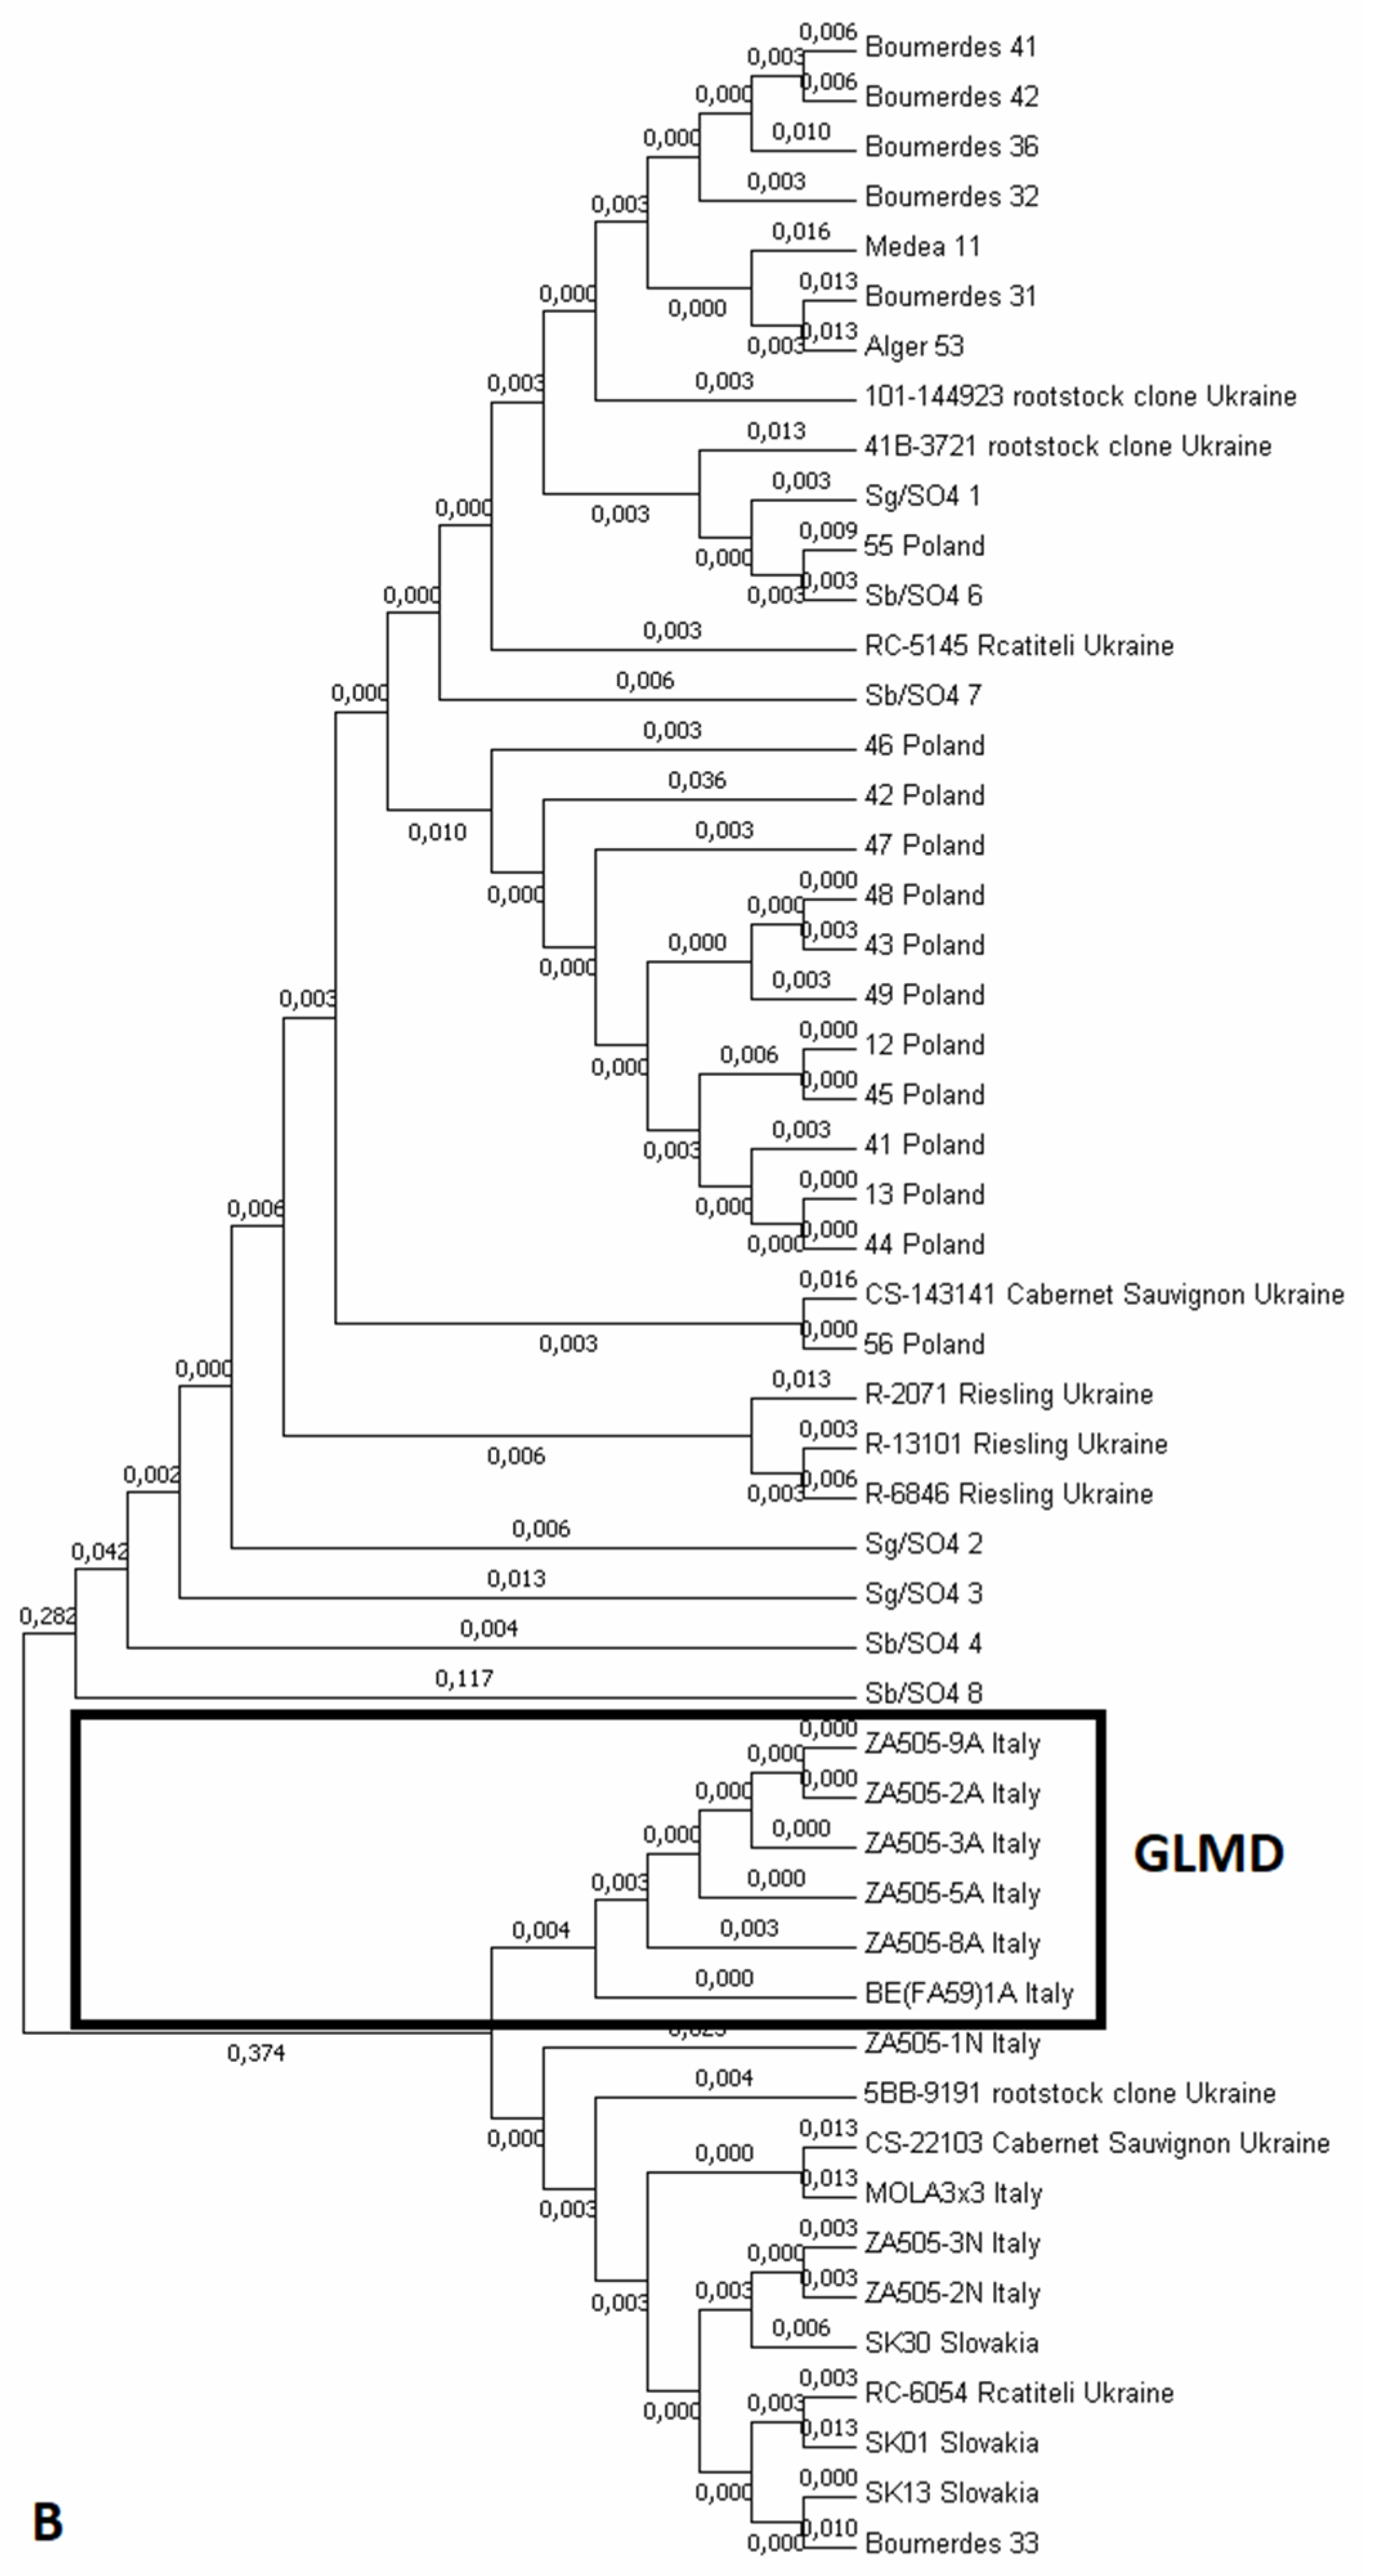
3.2. GPGV Phylogenetic Analysis

Molecular phylogenetic analysis based on MP/CP and RdRp domain sequences was compared with sequences of GPGV isolates from Italy, Slovakia, Poland, Ukraine, and Algeria (Figure 2). Despite the high diversity at the MP/CP level of isolates from this study, all of them clustered out of the cluster containing GLMD, causing GPGV isolates (Figure 2A). An independent cluster containing the isolates that were not showing symptoms from Algeria, Armenia, Ukraine, and our study isolates, which originated in the Czech Republic, was created.
Similar results were obtained at the phylogenetic tree of RdRp domain (Figure 2B), where our study isolates were again arranged with the previously described asymptomatically behaving GPGV isolates, which were clearly distinct from GLMD causing isolates marked by a black square (Figure 2).

3.3. GPGV Relative Quantification

The relative quantities of GPGV (Table 1) differed in the grapevines. The highest viral quantity was measured in the sample Sb/SO4_3, which had around 30 times higher GPGV titer than Sb/SO4_7 with the lowest GPGV titer. Both of these samples were showing GLMD symptoms, where the Sb/SO4_3 showed the most severe symptoms and Sb/SO4_7 only had weak symptoms. Sb/SO4_2 had the second highest GPGV titer and it was also showing severe symptoms. The rest of the symptomatic samples had at least 2.5 times lower GPGV titer than the Sb/SO4_3, but they were also showing mild or weak GLMD symptoms. The only asymptomatic sample (Sb/SO4_1) had more than six times lower GPGV titer than Sb/SO4_3; however, it also had at least 2.5 times higher titer than the samples Sb/SO4_7 and Sb/SO4_4 showing weak and milder symptoms.

3.4. Boron Content

Among all the factors, the acceptability of boron by the grapevines also depends on the soil type and soil pH values. The soil samples were typed as medium-heavy with a pH of 7.2 (data not shown), which indicates a slightly lowered boron availability. Soil boron content analysis showed that the boron content in the direct vicinity of each plant was not the same and it ranged from 0.19 to 0.97 mg.kg−1 (Table 2). A low concentration of boron, with possible deficiency symptoms, has soils with lower than 0.2 mg.kg−1 of boron, while medium and high concentrations of boron have soils with the content between 0.21–0.6 and 0.61–1.1 mg.kg−1 of boron, respectively, according to De Abreu et al. [36]. Here, the only asymptomatic sample Sb/SO4_1, showing no GLMD symptoms, was growing in the soil with high boron content. On the other hand, the sample Sb/SO4_8 was growing in the soil with the lowest amount of boron, while only showing milder GLMD symptoms. The rest of the samples were growing in the soil with medium content of boron, and they were showing GLMD symptoms that ranged from weak to severe.
The boron content in the grapevine shoots and leaves was more even than in the soil, ranging from 32.1 to 52.4 mg.kg−1 (Table 2). The marginal content of boron in grapevine leaves is between 26–34 mg.kg−1 and adequate between 35–70 mg.kg−1, according to Reuter and Robinson [37]. The upper values of marginal boron contents were measured in samples Sb/SO4_3, Sb/SO4_4, and Sb/SO4_7, from which the Sb/SO4_3 showed severe GLMD symptoms and Sb/SO4_7 and Sb/SO4_4 grapevines were showing only weak to milder GLMD symptoms. The samples with adequate boron content in plant tissues were showing diverse GLMD symptoms, where, for example, the asymptomatic Sb/SO4_1 (46.1 mg.kg−1) grapevine had lower boron content than the Sb/SO4_6 (52.4 mg.kg−1) grapevine showing mild GLMD symptoms.

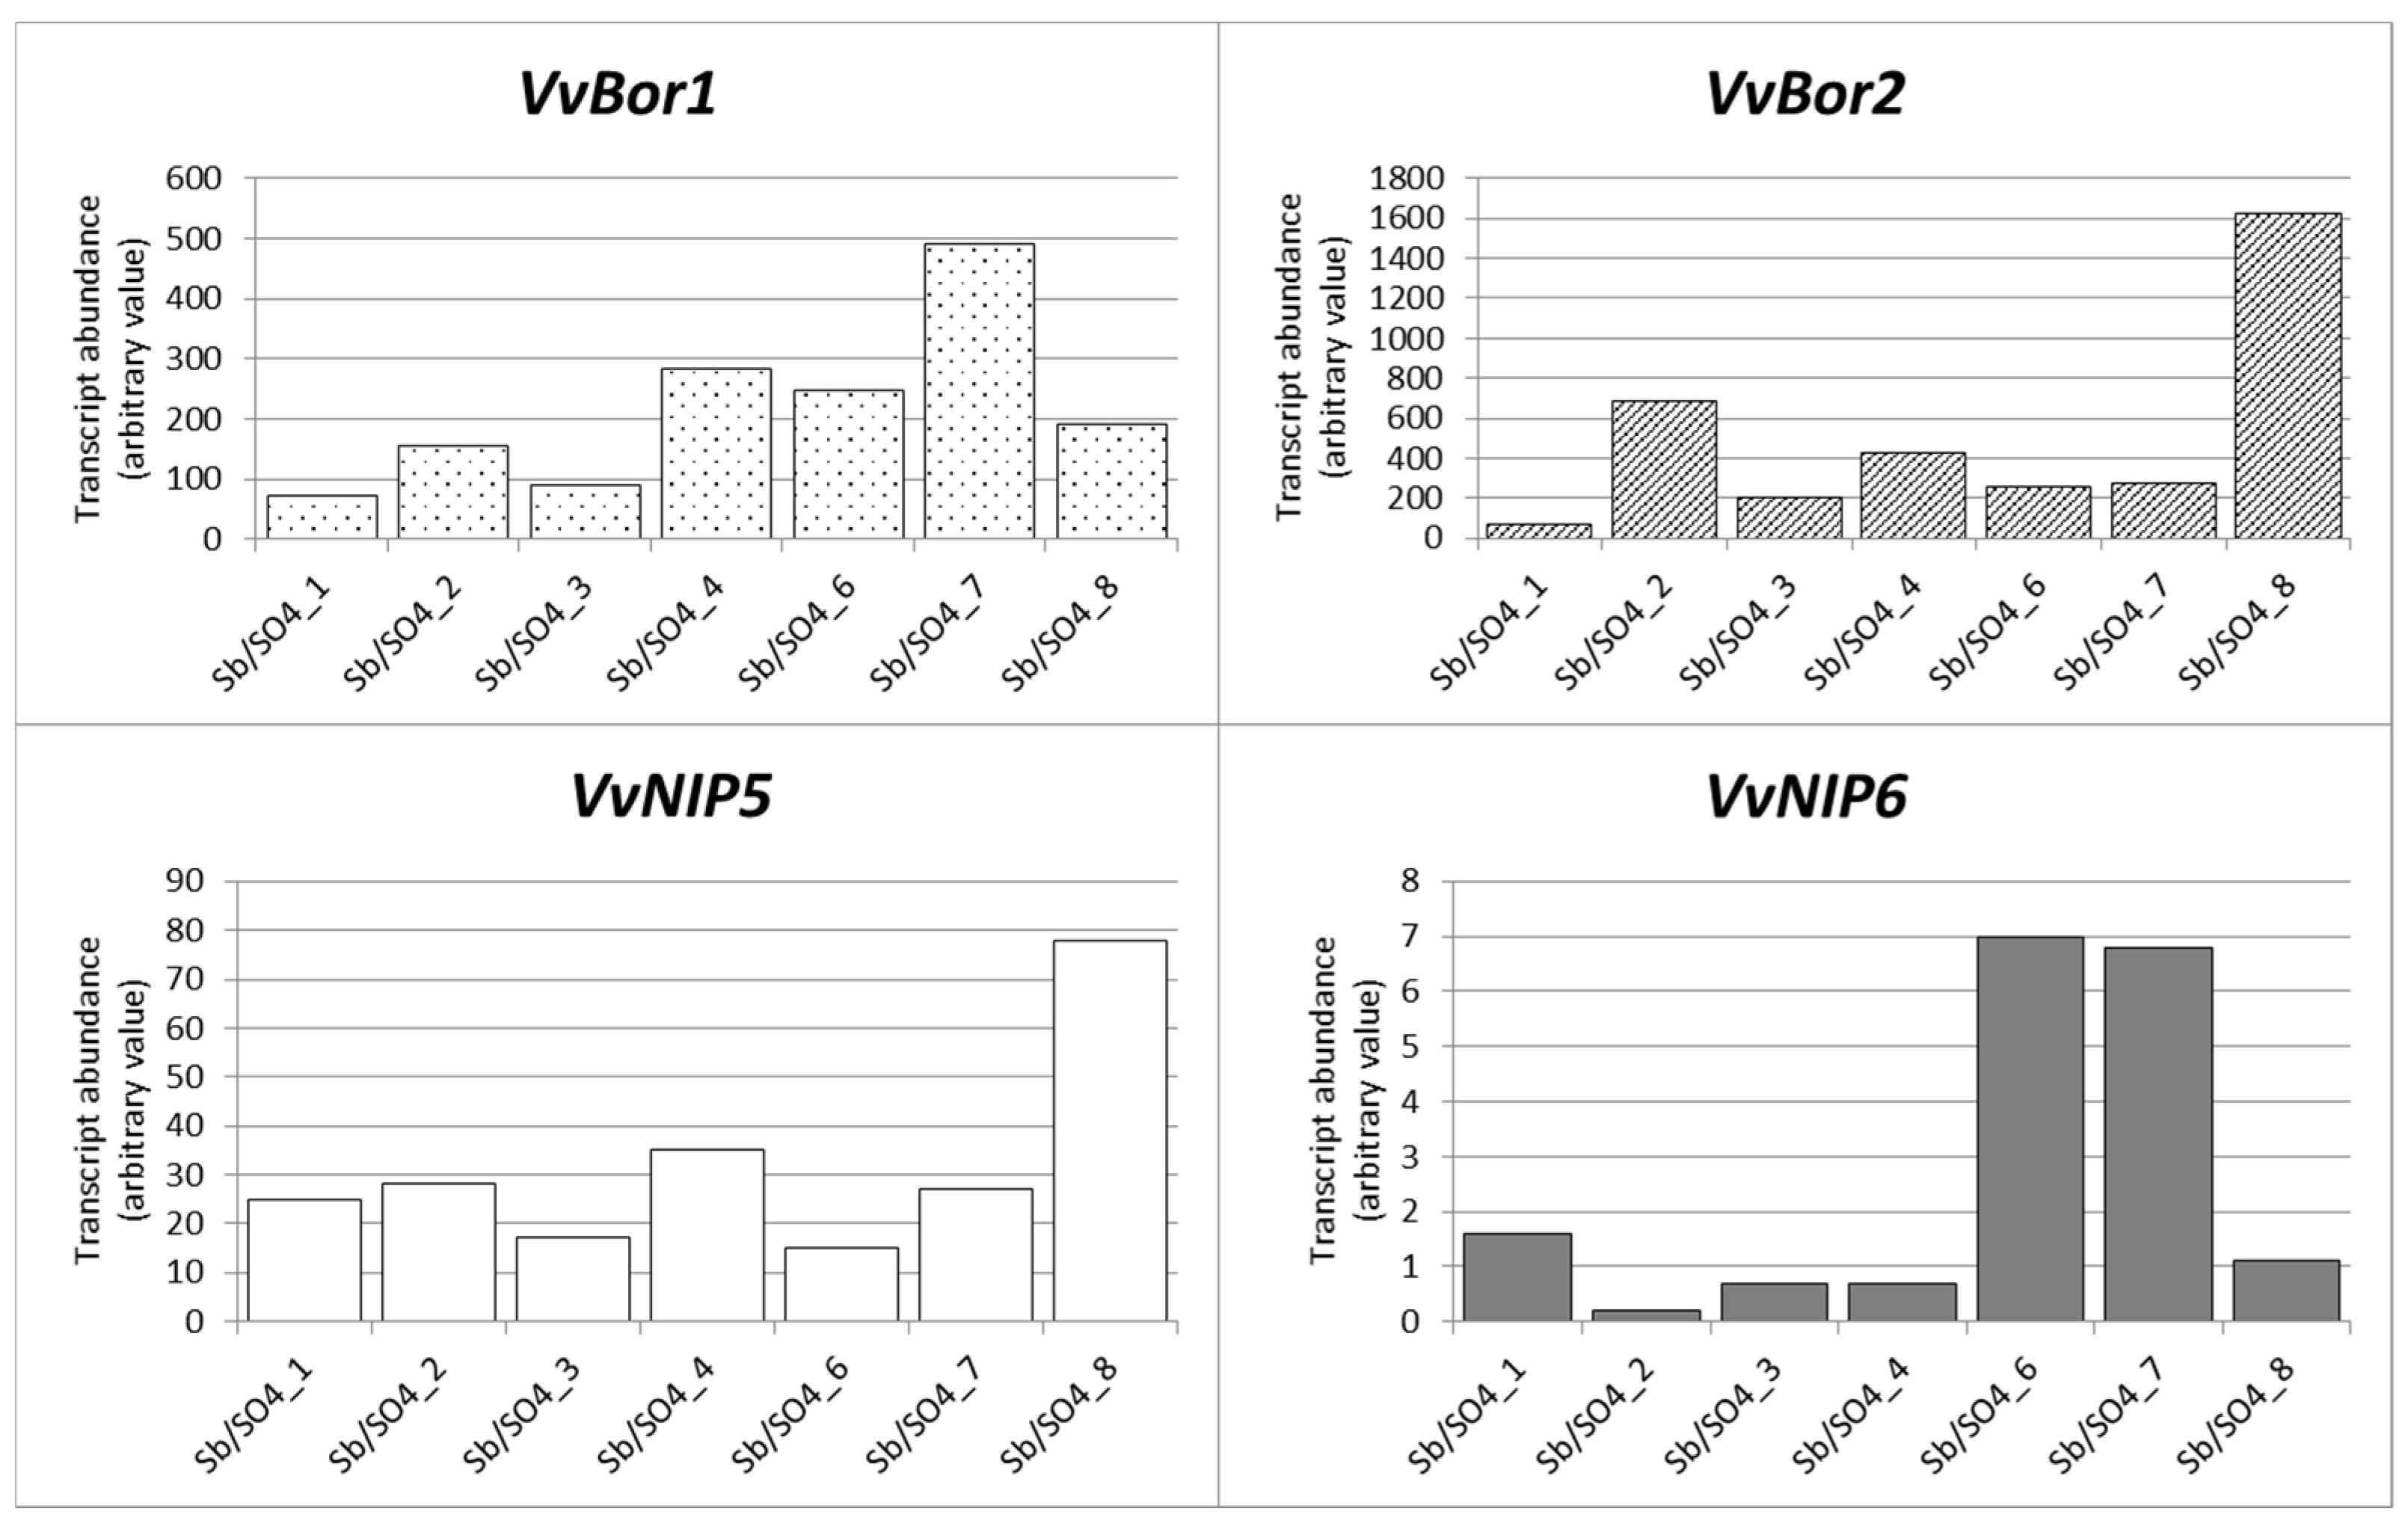
3.5. Gene Expression Analysis

The highest VvBOR1 expression, which is a boron transporter to xylem and responsible for boron shoot distribution [28], was observed at symptomatic Sb/SO4_7 grapevine (Figure 3), and its expression level was considerably higher when compared to the asymptomatic sample Sb/SO4_1 (by 582%) and severely symptomatic Sb/SO4_3 (by 445%), which had the lowest expression levels. Other samples had similar gene expression levels of VvBOR1.
For the VvBOR2, which is included in boron transport and root cell elongation promotion under B deficiency [30], the lowest expression levels were again observed at the asymptomatic Sb/SO4_1 sample (Figure 3). The highest VvBOR2 expression levels were observed at Sb/SO4_8, together with the sample Sb/SO4_2, which had, by 2125% and 837%, respectively, higher expression levels than the Sb/SO4_1. At the rest of the samples, the gene expression levels ranged from 285% to 586% of that of the Sb/SO4_1 sample.
The expression levels of the borate transporter VvNIP5 gene, a gene that is responsible for boron uptake by root cells [24], were the highest at the symptomatic Sb/SO4_8 sample (Figure 3). Its expression level was by 420% higher when comparing to the Sb/SO4_6 sample, which had the lowest expression level. Other samples had very similar gene expression levels and they ranged from 120 to 233% of the gene expression of the Sb/SO4_6 sample.
For VvNIP6 gene, where the function is xylem–phloem boron transport into young growing tissues [27], the considerably higher expression levels were observed at Sb/SO4_6 and Sb/SO4_7 (Figure 3) than at the other samples. They both had, by 3398% and 3064%, respectively, higher expression levels than the Sb/SO4_2, which had the lowest expression level. The other samples had relatively similar expression levels ranging from 342% to 805% of the expression levels of Sb/SO4_2 sample.

4. Discussion

Six out of seven analyzed grapevines were showing GLMD-like symptoms that varied from weak to severe, which does not align with the results of phylogenetic analysis. This could be explained by an inconsistency in the delineation between symptomatic and non-symptomatic viral genotypes, where the previous two cluster hypothesis of symptomatic and non-symptomatic GPGV isolates that were proposed by Saldarelli et al. [2] have been changed to the suggested three-cluster hypothesis [3] of symptomatic, non-symptomatic, and both symptomatic and non-symptomatic isolates. Moreover, in controlled conditions, the symptomatic GPGV genotypes did not prove to always show GLMD symptoms [38].
Samples with the highest GPGV titer also had the highest GLMD symptom manifestation. On the contrary, the only asymptomatic sample had considerably lower GPGV titer than both of the samples with the highest GPGV titers. These results are in agreement with the results of Bianchi et al. [39], but also Bertazzon et al. [13], who measured significantly higher GPGV titers in symptomatic grapevines throughout the whole vegetative period when compared to the asymptomatic grapevines. However, some of the grapevines in our study, although only showing weak or milder symptoms, had lower GPGV titers than the asymptomatic grapevine that corresponds to the results of Buoso et al. [20], who did not observe the correlation between symptoms and virus titer in the field or in controlled conditions.
Although the soil type was medium-heavy, the 7.2 pH of the soil indicated slightly lowered boron availability. Surprisingly, GLMD-like symptoms were more severe in grapevines Sb/SO4_2 and Sb/SO4_3 growing in soils with higher amounts of boron than at Sb/SO4_8, which was grown in soil with a low boron content (0.19 mgkg−1). These results are opposite the results of Buoso et al. [20]; however, in their work only conditions with no boron and sufficient boron in the hydroponic media (0.5 ppm) were tested. In our work, the grapevines growing in a similar amount of boron in the soil (approximately 0.5 mg.kg−1) to sufficient boron conditions of Buoso et al. [20] showed various degrees of GLMD-like symptoms. However, the sample Sb/SO4_1 did not show GLMD-like symptoms at the highest amount of boron content in the soil (0.97 mg.kg−1).
The analysis of boron content in the shoots and leaves of tested grapevines suggests that the boron deficiency did not cause GLMD-like symptoms in the tested grapevines. When compared to the results of Buoso et al. [20], the boron contents in grapevine tissues were very similar to the contents in the leaves of grapevines from the boron sufficient media. At the same time, our tested grapevines were showing GLMD-like symptoms that ranged from asymptomatic to severe symptoms, while in Buoso et al. [20], all of the grapevines with sufficient boron content in media were asymptomatic, regardless of the GPGV presence.
Interestingly, the second highest boron content in the shoots and leaves (43.3 mg/kg−1) of Sb/SO4_8 did not correlate with low amount of boron in the soil in its direct vicinity (0.19 mg/kg−1). Here, the possible answer could be the increase in boron uptake metabolism. At the sample Sb/SO4_8, its VvBor2 and VvNIP5 gene expressions were highly upregulated when compared to the other grapevines that were in soils with higher boron content. The expression levels of these genes together with a lower expression of VvNIP6 gene agree with previous observations under boron deficiency conditions [20,27]. However, the gene expression of VvBor1 at Sb/SO4_8 grapevine was not distinctly different from other grapevines growing in soils with sufficient boron content, which does not agree with the upregulation of this gene under boron deficiency in other works [20,30]. The only asymptomatic grapevine Sb/SO4_1, which was growing in the soil with the highest boron content, had the lowest gene expressions of both borate exporter genes VvBor1 and VvBor2, which agrees with the results found by Buoso et al. [20], and proves that these genes are upregulated at boron deficiency [22,23]. The gene expression levels of both intrinsic genes VvNIP5 and VvNIP6 were not considerably different in asymptomatic Sb/SO4_1 grapevine when compared to other symptomatic grapevines, which does not agree with the results of Buoso et al. [20], where the gene expressions of both these genes were significantly different between symptomatic and asymptomatic GPGV positive grapevines. The rest of the samples in our study were growing in soils with medium to high boron content and had GLMD-like symptoms, where we expected similar gene expressions. However, grapevines Sb/SO4_6 and Sb/SO4_7 had unexpectedly high gene expression levels of the VvNIP6 gene, which should be upregulated at asymptomatic GPGV grapevines [20]. A considerably high gene expression of VvBor1 gene was measured again at the Sb/SO4_7 grapevine, which refers to boron deficiency [22]. However, in the soil in direct vicinity of this grapevine, medium boron content was measured, which was similar to boron content in soils in the vicinity of Sb/SO4_3 and Sb/SO4_4 grapevines, which had lower expression levels of this gene, being comparable to the rest of the samples.
However, when compared to other studies, our results were not always in line with their findings. This might be due to the low number of samples in our study, where each grapevine was represented by one biological replicate. Thus, the presented results should be considered to be indicative. In fact, more in vitro or controlled condition studies are necessary to answer all of these questions. Nevertheless, as seen in Buoso et al. [20] and Bertazzon et al. [13], the field results will probably not always correlate with the results under controlled conditions.

5. Conclusions

This article was performed based on occurrence of GLMD-like symptoms on grapevines in September, which is not a typical period of year for the occurrence of these symptoms. All of these GPGV positive grapevines were the same Sauvignon blanc variety on the same rootstock, grown in the same vineyard where no GLMD symptoms have been reported yet. Based on connection between GLMD symptoms with GPGV titer and the resemblance of GLMD symptoms to boron deficiency, we measured the relative concentration of GPGV in the tissues, boron content both in grapevines and soil, and performed a gene expression of genes that were differently expressed during boron deficiency. However, the results did not show clear results, where, for example, the GPGV titer was the highest in the samples showing the most severe GLMD-like symptoms; however, the asymptomatic GPGV positive sample had a higher GPGV titer than other samples with milder GLMD-like symptoms. Surprisingly, despite the different boron contents in the soil, the grapevines maintained a sufficient amount of boron in their tissues, which excludes the possibility of boron deficiency symptoms. Gene expression then partially explained these observations just in the plants growing in soils with the highest or lowest boron contents. Here, the VvBor2 and VvNIP5 genes had a higher expression and VvNIP6 had lower expression in the plant growing in the soil with the lowest boron content, while low expression of VvBor1 and VvBor2 was observed in the plant grown in the soil with the highest boron content.

Supplementary Materials

The following are available online at https://0-www-mdpi-com.brum.beds.ac.uk/article/10.3390/agronomy11061020/s1, Table S1. List of primers used for GPGV detection and subsequent phylogenetic; Table S2. List of primers used for GPGV relative quantification and gene expression analyses.

Author Contributions

The study was conceived by A.E. and T.K. All authors contributed to the data collection. Data interpretation and manuscript preparation were performed by T.K.; K.Š.; A.V.; M.K.; A.E.M.; A.B.-T.; M.Š.; M.B.; D.T.; E.H.; J.Č.; J.P. and A.E. performed the experiments. A.E. and T.K. contributed to data analysis. All authors have read and agreed to the published version of the manuscript.

Funding

This research was supported by project No. TJ02000096 and by project No. CZ.02.1.01/0.0/0.0/16_017/0002334.

Institutional Review Board Statement

Not applicable.

Informed Consent Statement

Not applicable.

Conflicts of Interest

The authors declare no conflict of interest.

References

  1. Giampetruzzi, A.; Roumi, V.; Roberto, R.; Malossini, U.; Yoshikawa, N.; La Notte, P.; Terlizzi, F.; Credi, R.; Saldarelli, P. A new grapevine virus discovered by deep sequencing of virus- and viroid-derived small RNAs in Cv Pinot gris. Virus Res. 2012, 163, 262–268. [Google Scholar] [CrossRef] [PubMed]
  2. Saldarelli, P.; Giampetruzzi, A.; Morelli, M.; Malossini, U.; Pirolo, C.; Bianchedi, P.; Gualandri, V. Genetic Variability of Grapevine Pinot gris virus and Its Association with Grapevine Leaf Mottling and Deformation. Phytopathology 2015, 105, 555–563. [Google Scholar] [CrossRef] [PubMed] [Green Version]
  3. Eichmeier, A.; Penazova, E.; Muljukina, N. Survey of Grapevine Pinot gris virus in certified grapevine stocks in Ukraine. Eur. J. Plant Pathol. 2018, 152, 555–560. [Google Scholar] [CrossRef]
  4. Poojari, S.; Lowery, T.; Rott, M.; Schmidt, A.M.; Urbez-Torres, J.R. First Report of Grapevine Pinot gris virus in British Columbia, Canada. Plant Dis. 2016, 100, 1513. [Google Scholar] [CrossRef]
  5. Eichmeier, A.; Penazova, E.; Nebish, A. First Report of Grapevine Pinot gris Virus on Grapevines in Armenia. Plant Dis. 2020, 104, 1000. [Google Scholar] [CrossRef]
  6. Wu, Q.; Habili, N. The recent importation of Grapevine Pinot gris virus into Australia. Virus Genes 2017, 53, 935–938. [Google Scholar] [CrossRef]
  7. Fajardo, T.V.M.; Eiras, M.; Nickel, O. First report of Grapevine Pinot gris virus infecting grapevine in Brazil. Australas Plant. Dis. 2017, 12, 45. [Google Scholar] [CrossRef]
  8. Zamorano, A.; Medina, G.; Fernandez, C.; Cui, W.; Quiroga, N.; Fiore, N. First Report of Grapevine Pinot gris virus in Grapevine in Chile. Plant Dis. 2019, 103, 1438–1439. [Google Scholar] [CrossRef]
  9. Rasool, S.; Naz, S.; Rowhani, A.; Golino, D.A.; Westrick, N.M.; Farrar, K.D.; Al Rwahnih, M. First Report of Grapevine Pinot gris virus Infecting Grapevine in Pakistan. Plant Dis. 2017, 101, 1958. [Google Scholar] [CrossRef]
  10. Eichmeier, A.; Penazova, E.; Cechova, J.; Berraf-Tebbal, A. Survey and Diversity of Grapevine Pinot gris virusin Algeria and Comprehensive High-Throughput Small RNA Sequencing Analysis of Two Isolates fromVitis viniferacv. Sabel Revealing High Viral Diversity. Genes 2020, 11, 1110. [Google Scholar] [CrossRef] [PubMed]
  11. Eichmeier, A.; Pieczonka, K.; Penazova, E.; Pecenka, J.; Gajewski, Z. Occurrence of Grapevine Pinot gris virus in Poland and description of asymptomatic exhibitions in grapevines. J. Plant Dis. Prot. 2017, 124, 407–411. [Google Scholar] [CrossRef]
  12. Bertazzon, N.; Filippin, L.; Forte, V.; Angelini, E. Grapevine Pinot gris virus seems to have recently been introduced to vineyards in Veneto, Italy. Arch. Virol. 2016, 161, 711–714. [Google Scholar] [CrossRef]
  13. Bertazzon, N.; Forte, V.; Filippin, L.; Causin, R.; Maixner, M.; Angelini, E. Association between genetic variability and titre of Grapevine Pinot gris virus with disease symptoms. Plant Pathol. 2017, 66, 949–959. [Google Scholar] [CrossRef]
  14. Malagnini, V.; de Lillo, E.; Saldarelli, P.; Beber, R.; Duso, C.; Raiola, A.; Zanotelli, L.; Valenzano, D.; Giampetruzzi, A.; Morelli, M.; et al. Transmission of grapevine Pinot gris virus by Colomerus vitis (Acari: Eriophyidae) to grapevine. Arch. Virol. 2016, 161, 2595–2599. [Google Scholar] [CrossRef]
  15. Eichmeier, A.; Penazova, E.; Pavelkova, R.; Mynarzova, Z.; Saldarelli, P. Detection of Grapevine Pinot Gris Virus in Certified Grapevine Stocks in Moravia, Czech Republic. J. Plant Pathol. 2016, 98, 155–157. [Google Scholar]
  16. Glasa, M.; Predajna, L.; Kominek, P.; Nagyova, A.; Candresse, T.; Olmos, A. Molecular characterization of divergent grapevine Pinot gris virus isolates and their detection in Slovak and Czech grapevines. Arch. Virol. 2014, 159, 2103–2107. [Google Scholar] [CrossRef]
  17. Eichmeier, A.; Kominkova, M.; Kominek, P.; Baranek, M. Comprehensive Virus Detection Using Next Generation Sequencing in Grapevine Vascular Tissues of Plants Obtained from the Wine Regions of Bohemia and Moravia (Czech Republic). PLoS ONE 2016, 11, e0167966. [Google Scholar] [CrossRef]
  18. Cooper, J.I.; Jones, R.A.C.; Harrison, B.D. Field and Glasshouse Experiments on Control of Potato Mop-Top Virus. Ann. Appl. Biol. 1976, 83, 215–230. [Google Scholar] [CrossRef]
  19. Shimomura, T. Effects of Boron on the Formation of Local Lesions and Accumulation of Callose in French Bean and Samsun Nn Tobacco-Leaves Inoculated with Tobacco Mosaic-Virus. Physiol. Plant Pathol. 1982, 20, 257–261. [Google Scholar] [CrossRef]
  20. Buoso, S.; Pagliari, L.; Musetti, R.; Fornasier, F.; Martini, M.; Loschi, A.; Fontanella, M.C.; Ermacora, P. With or Without You: Altered Plant Response to Boron-Deficiency in Hydroponically Grown Grapevines Infected by Grapevine Pinot Gris Virus Suggests a Relation Between Grapevine Leaf Mottling and Deformation Symptom Occurrence and Boron Plant Availability. Front. Plant Sci. 2020, 11, 226. [Google Scholar] [CrossRef] [Green Version]
  21. Takano, J.; Miwa, K.; Yuan, L.X.; von Wiren, N.; Fujiwara, T. Endocytosis and degradation of BOR1, a boron transporter of Arabidopsis thaliana, regulated by boron availability. Proc. Natl. Acad. Sci. USA 2005, 102, 12276–12281. [Google Scholar] [CrossRef] [PubMed] [Green Version]
  22. Wang, N.N.; Yang, C.Q.; Pan, Z.Y.; Liu, Y.Z.; Peng, S. Boron deficiency in woody plants: Various responses and tolerance mechanisms. Front. Plant Sci. 2015, 6, 916. [Google Scholar] [CrossRef] [PubMed] [Green Version]
  23. Miwa, K.; Wakuta, S.; Takada, S.; Ide, K.; Takano, J.; Naito, S.; Omori, H.; Matsunaga, T.; Fujiwara, T. Roles of BOR2, a Boron Exporter, in Cross Linking of Rhamnogalacturonan II and Root Elongation under Boron Limitation in Arabidopsis. Plant Physiol. 2013, 163, 1699–1709. [Google Scholar] [CrossRef] [Green Version]
  24. Takano, J.; Wada, M.; Ludewig, U.; Schaaf, G.; von Wiren, N.; Fujiwara, T. The Arabidopsis major intrinsic protein NIP5;1 is essential for efficient boron uptake and plant development under boron limitation. Plant Cell 2006, 18, 1498–1509. [Google Scholar] [CrossRef] [PubMed] [Green Version]
  25. An, J.C.; Liu, Y.Z.; Yang, C.Q.; Zhou, G.F.; Wei, Q.J.; Peng, S.A. Isolation and expression analysis of CiNIP5, a citrus boron transport gene involved in tolerance to boron deficiency. Sci. Hortic. 2012, 142, 149–154. [Google Scholar] [CrossRef]
  26. Zhou, G.F.; Liu, Y.Z.; Sheng, O.; Wei, Q.J.; Yang, C.Q.; Peng, S.A. Transcription profiles of boron-deficiency-responsive genes in citrus rootstock root by suppression subtractive hybridization and cDNA microarray. Front. Plant Sci. 2015, 5, 5. [Google Scholar] [CrossRef] [PubMed] [Green Version]
  27. Tanaka, M.; Wallace, I.S.; Takano, J.; Roberts, D.M.; Fujiwara, T. NIP6;1 Is a Boric Acid Channel for Preferential Transport of Boron to Growing Shoot Tissues in Arabidopsis. Plant Cell 2008, 20, 2860–2875. [Google Scholar] [CrossRef] [Green Version]
  28. Eichmeier, A.; Baranek, M.; Pidra, M. Analysis of genetic diversity and phylogeny of partial coat protein domain in Czech and Italian GFLV isolates. Plant Prot. Sci. 2010, 46, 145–148. [Google Scholar] [CrossRef] [Green Version]
  29. Morelli, M.; Catarino, A.D.M.; Susca, L.; Saldarelli, P.; Gualandri, V.; Martelli, G.P. First Report of Grapevine Pinot Gris Virus from Table Grapes in Southern Italy. J. Plant Pathol. 2014, 96, 439. [Google Scholar]
  30. Pfaffl, M.W. MIQE challenges and solutions: The use of -omics technologies for transcriptional biomarker discovery. Int. J. Mol. Med. 2015, 36, S58. [Google Scholar]
  31. Berger, K.C. Boron in Soils and Crops. Adv. Agron. 1949, 1, 321–351. [Google Scholar]
  32. Krug, B.A.; Whipker, B.E.; Fonteno, W.C.; McCall, I.; Frantz, J. Incidence of Boron Deficiency in Bedding Plants Caused by Drought Stress or Abscicic Acid Application. Acta Hortic. 2011, 891, 141–147. [Google Scholar] [CrossRef] [Green Version]
  33. Tamura, K.; Nei, M. Estimation of the Number of Nucleotide Substitutions in the Control Region of Mitochondrial-DNA in Humans and Chimpanzees. Mol. Biol. Evol. 1993, 10, 512–526. [Google Scholar]
  34. Kumar, S.; Stecher, G.; Tamura, K. MEGA7: Molecular Evolutionary Genetics Analysis Version 7.0 for Bigger Datasets. Mol. Biol. Evol. 2016, 33, 1870–1874. [Google Scholar] [CrossRef] [PubMed] [Green Version]
  35. Edgar, R.C. MUSCLE: Multiple sequence alignment with high accuracy and high throughput. Nucleic Acids Res. 2004, 32, 1792–1797. [Google Scholar] [CrossRef] [PubMed] [Green Version]
  36. de Abreu, C.A.; van Raij, B.; de Abreu, M.F.; González, A.P. Routine soil testing to monitor heavy metals and boron. Sci. Agric. 2005, 62, 564–571. [Google Scholar] [CrossRef]
  37. Reuter, D.J.; Robinson, J.B. Plant Analysis: An Interpretation Manual, 2nd ed.; CSIRO Publishing: Melbourne, VIC, Australia, 1997. [Google Scholar]
  38. Tarquini, G.; Ermacora, P.; Bianchi, G.L.; De Amicis, F.; Pagliari, L.; Martini, M.; Loschi, A.; Saldarelli, P.; Loi, N.; Musetti, R. Localization and subcellular association of Grapevine Pinot Gris Virus in grapevine leaf tissues. Protoplasma 2018, 255, 923–935. [Google Scholar] [CrossRef] [PubMed] [Green Version]
  39. Bianchi, G.L.; De Amicis, F.; De Sabbata, L.; Di Bernardo, N.; Governatori, G.; Notino, F. Occurrence of Grapevine Pinot gris virus in Friuli Venezia Giulia (Italy): Field monitoring and virus quantification by real-time RT -PCR. EPPO Bull. 2015, 45, 22–32. [Google Scholar] [CrossRef]
Figure 1. The symptoms observed on seven surveyed grapevines. The pictures were taken at the same time in case of each grapevine; (A) grapevine Sb/SO4_1 showed yellowing of the leaves and a distinctive chlorosis appeared on the leaves; (B) Sb/SO4_2 showed curly top leaves, deformation of the leaves, stunted growth, thin internodes, and dense foliage; (C) Sb/SO4_3 similarly as Sb/SO4_2 showed a strong inhibition of growth showed by stunted deformed leaves and shortened and thin internodes, curly top leaves and dense foliage; (D) Sb/SO4_4 top leaves were curly and deformed, also lateral shoots were highly inhibited in their growth, the leaves on shoots were infrequently distributed; (E) Sb/SO4_6 compared to the previous grapevines, this grapevine showed a highly dense foliage where the lateral leaves were highly stunted, internodes were shortened and the zig-zag internodes were evidenced; (F) Sb/SO4_7 curly top leaves, the leaves and shoots were clearly young comparing to the other observed grapevines; and, (G) Sb/SO4_8 curly top leaves, deformation of the leaves, stunted growth, and thin internodes, the leaves on shoots were infrequently distributed with no lateral shoots. The top leaves were deformed.
Agronomy 11 01020 g001aAgronomy 11 01020 g001bAgronomy 11 01020 g001c
Figure 2. (A) molecular phylogenetic analysis of GPGV MP/CP sequences. (B) Phylogenetic analysis of the GPGV RdRp domain. The isolates in the box are GLMD causing GPGV isolates.
Agronomy 11 01020 g002aAgronomy 11 01020 g002b
Figure 3. Relative gene expression of four borate uptake and transporter genes (VvBOR1-efflux boron transporter, VvBOR2-boron transporter, VvNIP5-efficient boron uptake and plant development under boron limitation, and VvNIP6-boric acid uptake) in the collected grapevines.
Agronomy 11 01020 g003
Table 1. Sampled grapevines GLMD symptom severity, Acc. Nos. of obtained GPGV sequences in GenBank/NCBI and relative quantities (ΔΔCt) of GPGV in plant samples. GLMD symptom severity: 0—no symptoms, 1—curly top leaves, 2—curly top leaves, deformation of the leaves and stunted growth, 3—curly top leaves, deformation of the leaves, stunted growth, and thin internodes, 4—curly top leaves, deformation of the leaves, stunted growth, thin internodes, and dense foliage.
SampleGLMD Symptom SeverityGPGV
MP/CP Acc. No. GenBankRdRp Acc. No. GenBankΔΔCt
(Arbitrary Value)
Sb/SO4_10MW147696MW1477045.98
Sb/SO4_24MW147697MW14770528.37
Sb/SO4_34MW147698MW14770638.42
Sb/SO4_42MW147699MW1477072.21
Sb/SO4_63MW147701MW1477097.56
Sb/SO4_71MW147702MW1477101.26
Sb/SO4_83MW147703MW14771114.22
Table 2. The boron content measured in the soil, shoots, and leaves.
SampleB (mg.kg−1) in the SoilB (mg.kg−1) in the Shoots and Leaves
Sb/SO4_10.9746.1
Sb/SO4_20.4639.1
Sb/SO4_30.4033.8
Sb/SO4_40.2632.4
Sb/SO4_60.4952.4
Sb/SO4_70.3734.4
Sb/SO4_80.1946.3
Publisher’s Note: MDPI stays neutral with regard to jurisdictional claims in published maps and institutional affiliations.

