Article

Nutrient Solution Deprivation as a Tool to Improve Hydroponics Sustainability: Yield, Physiological, and Qualitative Response of Lettuce

by
Michele Ciriello
1,†,
Luigi Formisano
1,†,
Antonio Pannico
1,
Christophe El-Nakhel
1,
Giancarlo Fascella
2,
Luigi Giuseppe Duri
1,
Francesco Cristofano
1,
Beniamino Riccardo Gentile
1,
Maria Giordano
1,
Youssef Rouphael
1,
Giovanna Marta Fusco
3,
Pasqualina Woodrow
3 and
Petronia Carillo
3,*
1
Department of Agricultural Sciences, University of Naples Federico II, 80055 Portici, Italy
2
Research Centre for Plant Protection and Certification (CREA), 90011 Bagheria, Italy
3
Department of Environmental, Biological and Pharmaceutical Sciences and Technologies, University of Campania “Luigi Vanvitelli”, 81100 Caserta, Italy
*
Author to whom correspondence should be addressed.
These authors have contributed equally to this work.
Submission received: 21 June 2021 / Revised: 18 July 2021 / Accepted: 22 July 2021 / Published: 23 July 2021
(This article belongs to the Collection Nutrition Management of Hydroponic Vegetable Crops)

Abstract

:
Hydroponics growing systems often contain excessive nutrients (especially nitrates), which could lead to a quality loss in ready-to-eat leafy vegetables and posing a health risk to consumers, if managed inadequately. A floating raft system was adopted to assay the production and quality performance of lettuce (Lactuca sativa L. cv ‘Maravilla De Verano Canasta’) deprived of the nutrient solution by replacement with only water, three and six days before harvest. Yield and quality parameters, mineral composition, pigments, organic acids, amino acids profile, soluble proteins, and carbohydrate content were determined. Nutrient solution deprivation six days before harvest resulted in a significant reduction in leaf nitrate (−53.3%) concomitant with 13.8% of yield loss, while plants deprived of nutrient solution three days before harvest increased total phenols content (32.5%) and total ascorbic acid (102.1%), antioxidant activity (82.7%), anthocyanins (7.9%), sucrose (38.9%), starch (19.5%), and γ-aminobutyric acid (GABA; 28.2%), with a yield reduction of 4.7%, compared to the control. Our results suggest that nutrient solution deprivation three days before harvest is a successful strategy to reduce nitrate content and increase the nutritional quality of lettuce grown in floating raft systems with negligible impact on yield. These promising results warrant further investigation of the potential effect of nutrient solution deprivation on the quality attributes of other leafy vegetables cultivated in floating raft systems and in a “cascade” growing system.

1. Introduction

Although lettuce (Lactuca sativa L.) was historically grown and used in the “Old Continent” (Mediterranean areas), nowadays, this tender and fresh leafy vegetable belonging to the Asteraceae has also widely spread in more industrialized countries such as China and the USA [1,2]. Due to its high water content, the nutritional quality of lettuce is often undervalued [3]. However, its low caloric, sodium, and fat contents have made it a well-liked and popular vegetable, electing it as a staple ingredient for fresh meals like salads [4,5]. The genetic variability of the genus Lactuca, which is the fruit of intense breeder selection over the years, provides consumers with a wide assortment of leaf typology that differs in color (red to green), morphology (smooth or curly), size, and nutritional characteristics [3,6,7]. Lettuce is usually consumed raw, exalting its crispness and freshness and preserving its nutritional value. The health attributes of this leafy vegetable are ascribed to its dietary fibers and bioactive compounds such as vitamins (A, B9, and C), carotenoids, and phenolic compounds [8,9]. Nowadays, the demand for lettuce is steadily growing due to its appreciated beneficial effects on human well-being [5].
The industrialization process has led to a depopulation of the rural areas by accelerating the urban development process and unavoidably causing the loss of agricultural land [10]. In this scenario, hydroponic cultivation is a practical approach to address this challenge as it fits well with the urban landscape, supplying fresh food and solving the agricultural soil loss problem [11]. As if that were not enough, traditional agricultural systems consume large volumes of water, endangering the water supply of future generations [2]. These systems’ environmental and economic unsustainability highlights the urgent need to move towards innovative agronomic methods, such as closed-loop hydroponics [12]. Among the different hydroponic techniques, the floating raft system (FRS) has become the most successful for producing leafy vegetables such as lettuce, basil, rocket, and radish [13,14]. Compared to conventional soil-based cultivation, FRS guarantees the (i) de-seasonalization of production, (ii) speeding up the growth cycle, (iii) increment of water use efficiency, (iv) reduction of labor costs, (v) increment of unit production through higher planting density, (vi) achievement of more stable and repeatable growth conditions, (vii) reduction of the incidence of telluric pathogens, and (viii) overcoming of the limiting conditions such as high salinity, heavy metal contamination, and suboptimal soil reactions (alkalinity and acidity) [5,8,13,14,15]. FRS bestows a benefit for both consumers and fresh-cut vegetable growers who can produce residue-free soil products, which results in fewer washing procedures with less water waste [12,13].
However, it is noteworthy that using FRS to grow leafy vegetables does not inevitably result in quality improvement [16]. The imperative to achieve higher yield with lower costs has prompted the use of nutrient solutions often exceeding in nitrogen, causing a hyper-accumulation of nitrate, especially in green leafy vegetables, thus posing a potential hazard for the environment and food safety [17,18]. Several studies have proven that nitrate is safe, but salivary bacteria can reduce it into more harmful metabolites such as nitrites, nitric oxide, and nitrosamines, which are recognized to play a critical role in the processes of carcinogenesis and blood diseases like methemoglobinemia [19,20]. Since nitrate exposure depends on leafy vegetable consumption, the European Community has set restrictive thresholds for their commercialization [21]. At present, hydroponic systems, through the possibility of promptly managing the composition of the nutrient solution, could be used to reduce nitrate levels in leafy tissues. For this purpose, several authors proposed different agronomic strategies such as nutrient solution replacement with water, the use of low-nitrate nutrient solution, or nitrate replacement with chloride a few days before harvest [15,20,22,23,24,25].
Moreover, the potential to apply eustress (positive stress) through the management of the nutrient solution could not only reduce the amount of antinutritional compounds (e.g., nitrate) but also trigger the biosynthesis of specialized metabolites such as carotenoids, flavonoids, phenols, and vitamin C which are increasingly sought after by consumers due to their antioxidant properties [7,26]. To date, few works have investigated the effects induced by nutrient solution deprivation close to harvest, on the primary and secondary metabolism of leafy vegetables. For this purpose, our research was aimed to evaluate the effects of nutrient solution replacement with water, three and six days before harvest, on yield and nitrate accumulation as well as on the biosynthesis of antioxidant metabolites of ready-to-eat lettuce (Lactuca sativa L.) in a closed-loop hydroponic system.

2. Materials and Methods

2.1. Plant Material and Experimental Design

The experiment was conducted in a passively ventilated greenhouse (15 m × 5 m), located at the Department of Agriculture (DIA) of the University of Naples Federico II (Portici, Italy; 40°48′ N, 14°20′ E, 29 m.s.l.). During the crop cycle, air temperature, air relative humidity, and photosynthetic photon flux density (PPFD) measurements were recorded every 30 min using WatchDog A150 dataloggers (Spectrum Technologies Inc., Aurora, IL, USA) (Supplementary Figure S1). On 2 October 2020 (18 days after sowing), seedlings of lettuce (Lactuca sativa L.) ‘Maravilla De Verano Canasta’ hereafter ‘Canasta’ (Butterhead lettuce; Pagano Domenico & Figli, Scafati, Salerno, Italy) were transplanted at the two true-leaf stage in polystyrene trays with a planting density of 70 plants m−2. Experimental treatments consisted of a control (0 DD) managed with nutrient solution (NS) throughout the growing cycle and two deprivation treatments applied 3 (3 DD) and 6 (6 DD) days prior to harvest by completely replacing nutrient solution with osmotic water only (0.156 mM potassium, 0.217 mM magnesium, 0.205 mM calcium, 0.065 mM nitrate, 0.010 sulfate, 0.003 phosphate; pH 6, electrical conductivity (EC) 150 µS cm−1) arranged in a randomized complete block design (RCBD) with three replicates. Each experimental unit consisted of a 35 L plastic tank (0.60 × 0.40 × 0.24 m; L × W × D) on which floated a polystyrene tray (52 × 33 m) anchoring 12 plants (total of 36 plants per treatment). Oxygenation of the aqueous medium (NS or water) was provided by immersion pumps equipped with a Venturi system (Aquaball 60, Eheim, Stuttgart, Germany).
The macronutrient concentration of the NS was: 8.2 mM nitrate, 0.7 mM phosphate, 1.0 mM sulfate, 2.7 mM potassium, 2.9 mM calcium, 0.7 mM magnesium, and 1.0 mM ammonium, while the micronutrient concentration was: 20 µM iron, 20 µM boron, 9 µM manganese, 1.6 µM zinc, 0.3 µM copper, and 0.3 µM molybdenum. The electrical conductivity of NS was 1.2 ± 0.1 mS cm−1, whereas pH was monitored every day and maintained at 5.8 ± 0.3 using a portable pH meter (HI 991301, Hanna Instruments, Milan, Italy) by adding an acid mixture (mainly phosphoric acid) with the same anion ratio as NS.

2.2. Sampling and CIELab Colorimetric Index

The experimental trial was carried out from 2 October to 30 October 2020. At 29 days after transplanting (DAT), ten plants per replicate were harvested, weighed for fresh weight determination, and separated into leaves and stems. Leaves of each plant were counted, and the leaf area was quantified by digital image analysis with ImageJ v1.52a software (U.S. National Institutes of Health, Bethesda, MD, USA) after image acquisition with Nikon D80 camera (Nikon Corporation, Tokyo, Japan). Two plants per replicate were stored at −20 °C for further qualitative analysis. Contextually to harvest, colorimetric measurements were performed on the upper side of ten fully expanded young leaves for each experimental unit. Specifically, a Minolta CR-300 Chroma Meter (Minolta Camera Co. Ltd., Osaka, Japan) was used to obtain the color space parameters (L, a, and b) and then to calculate the chroma and HUE angle values. The leaf tissues were placed in a ventilated oven for ~72 h at 60 °C until constant weight to determine the dry biomass and leaf dry matter percentage (%). Dry matter percentage was also calculated using the following formula: DM = 100 × Dry weight/Fresh weight.

2.3. Spad Index and Chlorophyll Fluorescence

On the harvest day (October 30, 29 DAT), on the adaxial side of twenty fully expanded young leaves of twelve plants per experimental unit, SPAD index measurements were made using a portable SPAD-502 m (Minolta Camera Co. Ltd., Osaka, Japan). On the same date and the same leaves used for SPAD index determination, between 11:00 a.m. and 1:00 p.m., measurements of the maximum quantum efficiency of PSII expressed as Fv/Fm were determined using a portable fluorometer (Plant Stress Kit, Opti-Sciences, Hudson, NH, USA).

2.4. Pigments Determination

As proposed by Wellburn [27], for pigment determination (i.e., total chlorophyll and carotenoids), five hundred mg of two fresh frozen leaves per replicate were extracted in 3 mL of 90% (v/v) ammonia acetone (Carlo Erba Reagents Srl, Milan, Italy) and ground using a ceramic pestle and mortar. Chlorophyll a, b, and carotenoids contents were determined by UV-Vis spectrophotometer (DR 4000, Hach Co, Loveland, CO, USA) with absorbance of 647, 664, and 470 nm, respectively. Total chlorophyll, calculated as the sum of chlorophylls a and b, and carotenoids were expressed as mg g−1 of fresh weight (fw).

2.5. Total Nitrogen and Mineral Profile Determination

The total nitrogen (N) concentration of dried and finely ground lettuce samples by means of MF10.1 cutting-grinding head mill (IKA®, Staufen im Breisgau, Baden-Württemberg, Germany) and MF0.5 sieve (0.5 mm hole size; IKA®, Staufen im Breisgau, Baden-Württemberg, Germany) was determined by the Kjeldahl method after mineralization with sulfuric acid (Carlo Erba Reagents Srl, Milan, Italy) and a catalyst (3.5 g K2SO4 + 0.1 g CuSO4 × 5H2O; Velp® Scientifica, Usmate Velate, Monza Brianza, Italy) as described in detail by Formisano et al. [28]. Minerals (P, K, S), nitrate, and organic acids (malate, tartrate, oxalate, citrate, and isocitrate) were determined by ion chromatography (ICS3000, Thermo Scientific™ Dionex™, Sunnyvale, CA, USA) coupled to an electrical conductivity detector using the Chromeleon™ 6.8 software (Thermo Scientific™ Dionex™, Sunnyvale, CA, USA) according to the method described by Pannico et al. [29]. Minerals and organic acids concentrations were expressed as mg g−1 of dry weight (dw), while nitrate was expressed as mg kg−1 fw.

2.6. Total Phenol, Total Ascorbic Acid, Anthocyanins, Hydrogen Peroxide, and Antioxidant Activities Determination

For compositional and phytochemical analyses, samples of fresh matter from randomly selected lettuce leaves were instantly frozen in liquid nitrogen and stored at −80 °C before lyophilized in a Christ, Alpha 1–4 (Martin Christ Gefriertrocknungsanlagen GmbH, Osterode am Harz, Germany) freeze drier [30].
Total phenol and total ascorbic acid analysis were performed by spectrophotometry according to the method proposed by Singleton et al. [31] and Kampfenkel et al. [32], respectively. Gallic acid and ascorbate standards (Sigma Aldrich, Milan, Italy) standards were used to create calibration curves to quantify total phenols and total ascorbic acid content. A UV-VIS spectrophotometry (Hach DR 4000, Hach CO., Loveland, CO, USA) with an absorbance of 765 and 525 nm, respectively, was used to determine total phenols and total ascorbic acid, and the results were expressed as mg gallic acid equivalent 100 g−1 dw and mg 100 g−1 fw, respectively. Total anthocyanin analysis was performed according to Rouphael et al. [33] by suspending 20 mg lyophilized leaf samples in 180 µL of 40% (v/v) ethyl alcohol and incubating it on ice for 20 min. After 14,000 rpm centrifugation for 10 min, the pellet was re-extracted in 180 µL of 40% (v/v) ethyl alcohol, and the two supernatants joined. Duplicate aliquots of 150 µL of the supernatant (or 40% w/v ethanol solution as blank) were placed in a polypropylene microplate with 75 µL of 25 mM KCl (pH 1.0) or 75 µL of 400 mM sodium acetate (pH 4.5). The absorbance was recorded at 520 and 700 nm by a Synergy HT spectrophotometer (BioTEK Instruments, Bad Friedrichshall, Germany). The anthocyanin content was expressed as mg cyanidin−3-glucoside equivalents (C3Geq) g−1 dw. Hydrogen peroxide (H2O2) content was determined according to Dell’Aversana et al. [34] with few modifications. Aliquots of 20 mg of lyophilized leaf tissues were suspended in 230 µL of 0.1% (w/v) of trichloroacetic acid, vortexed and, after at 4 °C for 10 min, 50 µL of clear supernatants were placed in wells of a polypropylene microplate with 100 µL of 1 M KI and 50 µL of 10 mM phosphate buffer (pH 7.0). H2O2 concentration was assayed at 390 nm for comparison with standard curves of known concentrations of H2O2 and expressed as µmol·g−1 dw. To quantify the antioxidant activity, 0.2 g of freeze-dried lettuce leaves were subjected to different extraction procedures. Hydrophilic (HAA) and 2,2’-azino-bis (3-ethylbenzothiazoline-6-sulfonic acid) (ABTS) antioxidant activities were measured according to the protocol proposed by Fogliano et al. [35] and Pellegrini et al. [36]. For ABTS antioxidant activity, a radical cation decolorization assay 3-ethylbenzothiazoline-6-sulfonic acid (2, 2′-azinobis (Sigma Aldrich, Milan, Italy) was used. The HAA and ABTS content of the obtained solutions were quantified by UV-VIS spectrophotometry (Hach DR 4000, Hach CO., Loveland, CO, USA) with absorbance at 505 and 734 nm, respectively. Each treatment was analyzed in triplicate and the results were expressed as mmol of ascorbic acid equivalent 100 g−1 dw and mmol Trolox equivalent 100 g−1 dw for HAA and ABTS, respectively.

2.7. Carbohydrates, Soluble Proteins, and Amino Acids Analysis

The analysis of soluble carbohydrates content (expressed as µmol g−1 dw) was performed in ethanolic extracts of lyophilized lettuce leaf tissues, while the starch (expressed as µmol glucose equivalents g−1 dw) was estimated in the pellet of the same ethanolic extract after hydrolysis to glucose, by supplying oxidized pyridine nucleotide and measuring its rate of reduction in the presence of sugars according to Carillo et al. [24]. The absorbance was recorded at 340 nm by a Synergy HT spectrophotometer (BioTEK Instruments, Bad Friedrichshall, Germany). Soluble proteins were analyzed by suspending 20 mg of lyophilized leaf tissues in 1 mL of Tris-HCl 200 mM (pH 7.5) containing 500 mM MgCl2. Samples were then centrifuged and the proteins measured in the supernatant by using the Protein Assay Dye Reagent Concentrate (Bio-Rad, Milan, Italy), according to Rouphael et al. [32]. Proteins were expressed as mg g−1 dw and primary amino acids were determined in ethanolic extracts of lyophilized leaf samples and assayed by FLD-HPLC, according to Carillo et al. [24]. Amino acids were expressed as µmol g−1 dw.

2.8. Statistics

The statistical analysis was performed using IBM SPSS Statistics (IBM Corp., Armonk, NY, USA), version 26.0 package for Microsoft Windows 10 (Microsoft Corporation, Redmond, WA, USA). The mean effect of all parameters investigated was compared according to one-way ANalysis of VAriance (ANOVA). Statistical significance was determined at the p = 0.05 level using Tukey’s HSD test. All data are presented as mean, n = 3.

3. Results

3.1. Yield and Yield Parameters

As illustrated in Table 1, fresh yield decreased linearly as DD increased. Compared to the control, at three and six days of deprivation (3 and 6 DD), fresh yield decreased by 4.8 and 13.2%, respectively. Furthermore, the lowest leaf area (1312 cm2 plant−1) was recorded at 6 DD, while the highest dry biomass (3.76 g plant−1) was obtained in the plants of the control treatment (Table 1). For the other biometric parameters, such as dry matter and leaf number, the nutrient solution deprivation did not result in significant differences.

3.2. Colorimetric Parameters

Except for the Hue angle, the nutrient solution deprivation resulted in significant changes for all colorimetric parameters (L, a, b, and Chroma) listed in Table 2. Among these, the lowest values were observed at 6 DD, except for a. Specifically, compared to the control, L, b, and Chroma values in plants at 6 DD decreased by 7.1, 16.5, and 16.9%, respectively, whereas an increased by 21.0%.

3.3. Spad Index, Chlorophyll Fluorescence, and Hydrogen Peroxide

As reported in Table 3, the statistical analysis indicated significant differences in SPAD index, chlorophyll fluorescence (Fv/Fm), and hydrogen peroxide (H2O2) content while leaf pigment content (total chlorophylls and carotenoids), chlorophyll a/b ratio, and chlorophyll/carotenoids ratio were not affected by the nutrient solution deprivation. Compared with control, the SPAD index showed no significant difference at 6 DD, while it was reduced by 6.7% at 3 DD. In addition, the control plants showed the highest Fv/Fm value. Finally, at 6 DD, the H2O2 content in leaves increased by 84.0% compared with the control.

3.4. Mineral Composition

The mineral composition of lettuce as a function of nutrient solution deprivation is shown in Table 4. Among all minerals, potassium (K) was the most abundant, ranging from 75.02 to 104.6 mg g−1 dw, followed by N (41.11–46.40 mg g−1 dw), p (5.37–6.62 mg g−1 dw) and S (1.67–1.85 mg g−1 dw). Apart from sulfur (S), the mineral content was significantly affected by the treatments. In particular, N content decreased by 11.4% at 6 DD compared to the control. Lettuce plants at 6 DD reduced nitrogen (−11.4%) and phosphate (−18.9%) contents compared to control and 3 DD treatment, respectively, and showed the lowest K (75.02 mg g−1 dw) concentration.

3.5. Quality Parameters

As shown in Figure 1A, the nitrate content in lettuce leaves decreased linearly as the number of days of nutrient solution deprivation increased. In addition, 3 DD and 6 DD treatments reduced the nitrate content by 12.4 and 53.3%, respectively, compared to the non-deprived control. In addition, lettuce plants at 3 DD recorded the highest total ascorbic acid (144.9 mg 100 g−1 fw) (Figure 1B) and total phenols (3.87 mg gallic ac. equivalent 100 g−1 dw) (Figure 1C). In contrast, the latter decreased by 24.5 and 13.4% compared with the control and 6 DD treatment (Figure 1C). Similarly, hydrophilic antioxidant activity (HAA) decreased by 14.9% in the 6 DD treatment compared with 3 DD treatment (Figure 1D). Regardless of the number of days of nutrient solution deprivation, the control plants showed the lowest ABTS values (11.91 mmol Trolox equivalent 100 g−1 dw) (Figure 1E) and the lowest anthocyanins content (83.78 μg cyanidin equivalent g−1 dw) (Figure 1F).

3.6. Organic Acid Profile and Carbohydrates Content

The organic acids profile and carbohydrates content of lettuce as a function of the nutrient solution deprivation treatments are shown in Table 5. Except for citrate, deprivation treatment significantly affected the content of all organic acids. Among the latter, malate was the most abundant, ranging from 26.74 to 30.35 mg g−1 dw. The highest values of tartrate (2.78 mg g−1 dw) and isocitrate (1.03 mg g−1 dw) were obtained in control plants, in contrast to oxalate, which showed the lowest values (1.63 mg g−1 dw) at 3 DD. Moreover, at 6 DD, glucose, sucrose, and starch content increased by 8.6, 33.5, and 14.1% compared with the control, whereas no significant differences were found for fructose (Table 5).

3.7. Soluble Proteins and Amino Acids Profile

The soluble proteins and amino acids profile of lettuce as a function of nutrient solution deprivation treatment is shown in Table 6. The deprivation treatment significantly decreased the soluble proteins (−26.6%) as well as the total amino acids (−6.9%) content at 6 DD compared to control (0 DD). However, while some primary and more abundant amino acids like asparagine, glutamine, and glutamate decreased (−12.7%, −10.3% and −15.2%, respectively), γ-aminobutyric acid (GABA, a product of glutamate decarboxylation), arginine and branched-chain amino acids (BCAAs) significantly increased (+69%, 26.4%, and 19.1%, respectively) (Table 6).

4. Discussion

Nutrient solutions (NS) used in hydroponics have high levels of nutrients, more than twice of those used in traditional soil-based cultivation [13]. Minerals’ over-rich NS, though capable of increasing productivity within a certain threshold, can lead to quality losses in leafy vegetables (e.g., sensory flattening, delay in harvesting and nitrate accumulation in leaf tissues), and pose an environmental hazard [15]. Nowadays, researchers are continuously searching for innovative NS management strategies to reduce vegetables’ nitrate content without affecting crop yield. Among these, partial nitrate replacement with chloride in the NS is the most investigated and effective technique [15,25]. However, residual chlorine-rich NS disposal can decimate soil microbiological and edaphic populations, thus jeopardizing “soil health” [37,38]. Based on the above, we evaluated if replacing NS with only water close to harvest could be a proper eco-friendly strategy to improve the qualitative and quantitative performance of lettuce grown in floating raft systems (FRS).
The fresh yield and dry biomass reduction resulting from NS deprivation different days before harvest highlight that leafy vegetable yield in hydroponics is affected by nutrient supply [39,40,41,42]. Probably, the yield and dry biomass reduction of lettuce (Lactuca sativa L.) deprived of NS three and six days before harvest was caused by an osmotic effect and, in particular, by macronutrient deficiency [8]. On the other hand, Santamaria et al. [22] did not report a reduction of these parameters in arugula and chicory grown under nitrate deficiency. The reduction of biometric parameters observed in the present experiment would probably not be due solely to nitrate deficiency but to the deprivation of other macronutrients crucial for the maintenance of metabolic processes [43,44].
Compared to the 6 DD treatment, plants subjected to 3 DD were able to sustain growth due to the still-sufficient nutrients pool, thus guaranteeing higher fresh yield. This emphasizes that nutritional stresses depend on their magnitude and especially on the time of exposure to the stress [45,46]. Regardless of the NS deprivation treatment, the number of leaves was unaffected. However, at 6 DD, a significant reduction in leaf area was observed. Long-term nutrient deprivation (particularly nitrogen) probably resulted in the redirection of accumulated nutrient reserves to the root system and young leaves at the expense of mature ones, ensuring their growth and survival [47].
Similarly, as observed for biometric parameters, NS deprivation reduced Fv/Fm values. However, the values recorded at 6 DD (0.829) and 3 DD (0.834) were not indicative of stress oxidative damage [48,49]. To support the above, it is noteworthy that total chlorophyll did not change, in contrast to the findings of several authors on nitrogen-depleted leafy vegetables [50,51,52], falling within the optimal range for lettuce (0.482–0.821 mg g−1 fw) [53]. Moreover, chlorophyll affects the greenness of leafy vegetables, driving consumer choice [54,55]. The greenness (a) variation in plants deprived of NS 6 days before harvest was not attributable to reduced chlorophyll but to an increased anthocyanins content due to macronutrient deficiency, as supported by several authors [9,56,57].
Similar to previous work carried out on several leafy vegetables grown under nutrient-limited conditions [8,41,58,59], in our work, the replacement of the NS with water six days before harvest reduced the nitrogen and potassium uptake compared to the control, thus justifying the lower yield. Relative to potassium, although a positive correlation with carotenoids content in leaves is well established [39], in our experiment, potassium reduction at 6 DD was not associated with a decrease in carotenoids. Probably, potassium levels in plants at 6 DD, being above the optimum value (53.7 mg g−1 dw) for the Butterhead lettuce cultivar ‘Maravilla De Verano Canasta’ type [60], did not affect carotenoids biosynthesis, in comparison with control (0 DD) and 3 DD treatment. The reduction in potassium content obtained in the present experiment could be helpful to dialysis patients for whom potassium intake must be restricted [61,62,63,64,65,66].
As reported by several authors [41,67,68,69], nitrate accumulation in leafy vegetables, other than depending on genotype, is also affected by crop management techniques and light conditions, that differ when plants are grown in different seasons of the year [20]. In effect, nitrate assimilation depends on irradiance and thus on photosynthesis as it provides the carbon skeletons necessary to trigger nitrogen assimilation into amino acids [
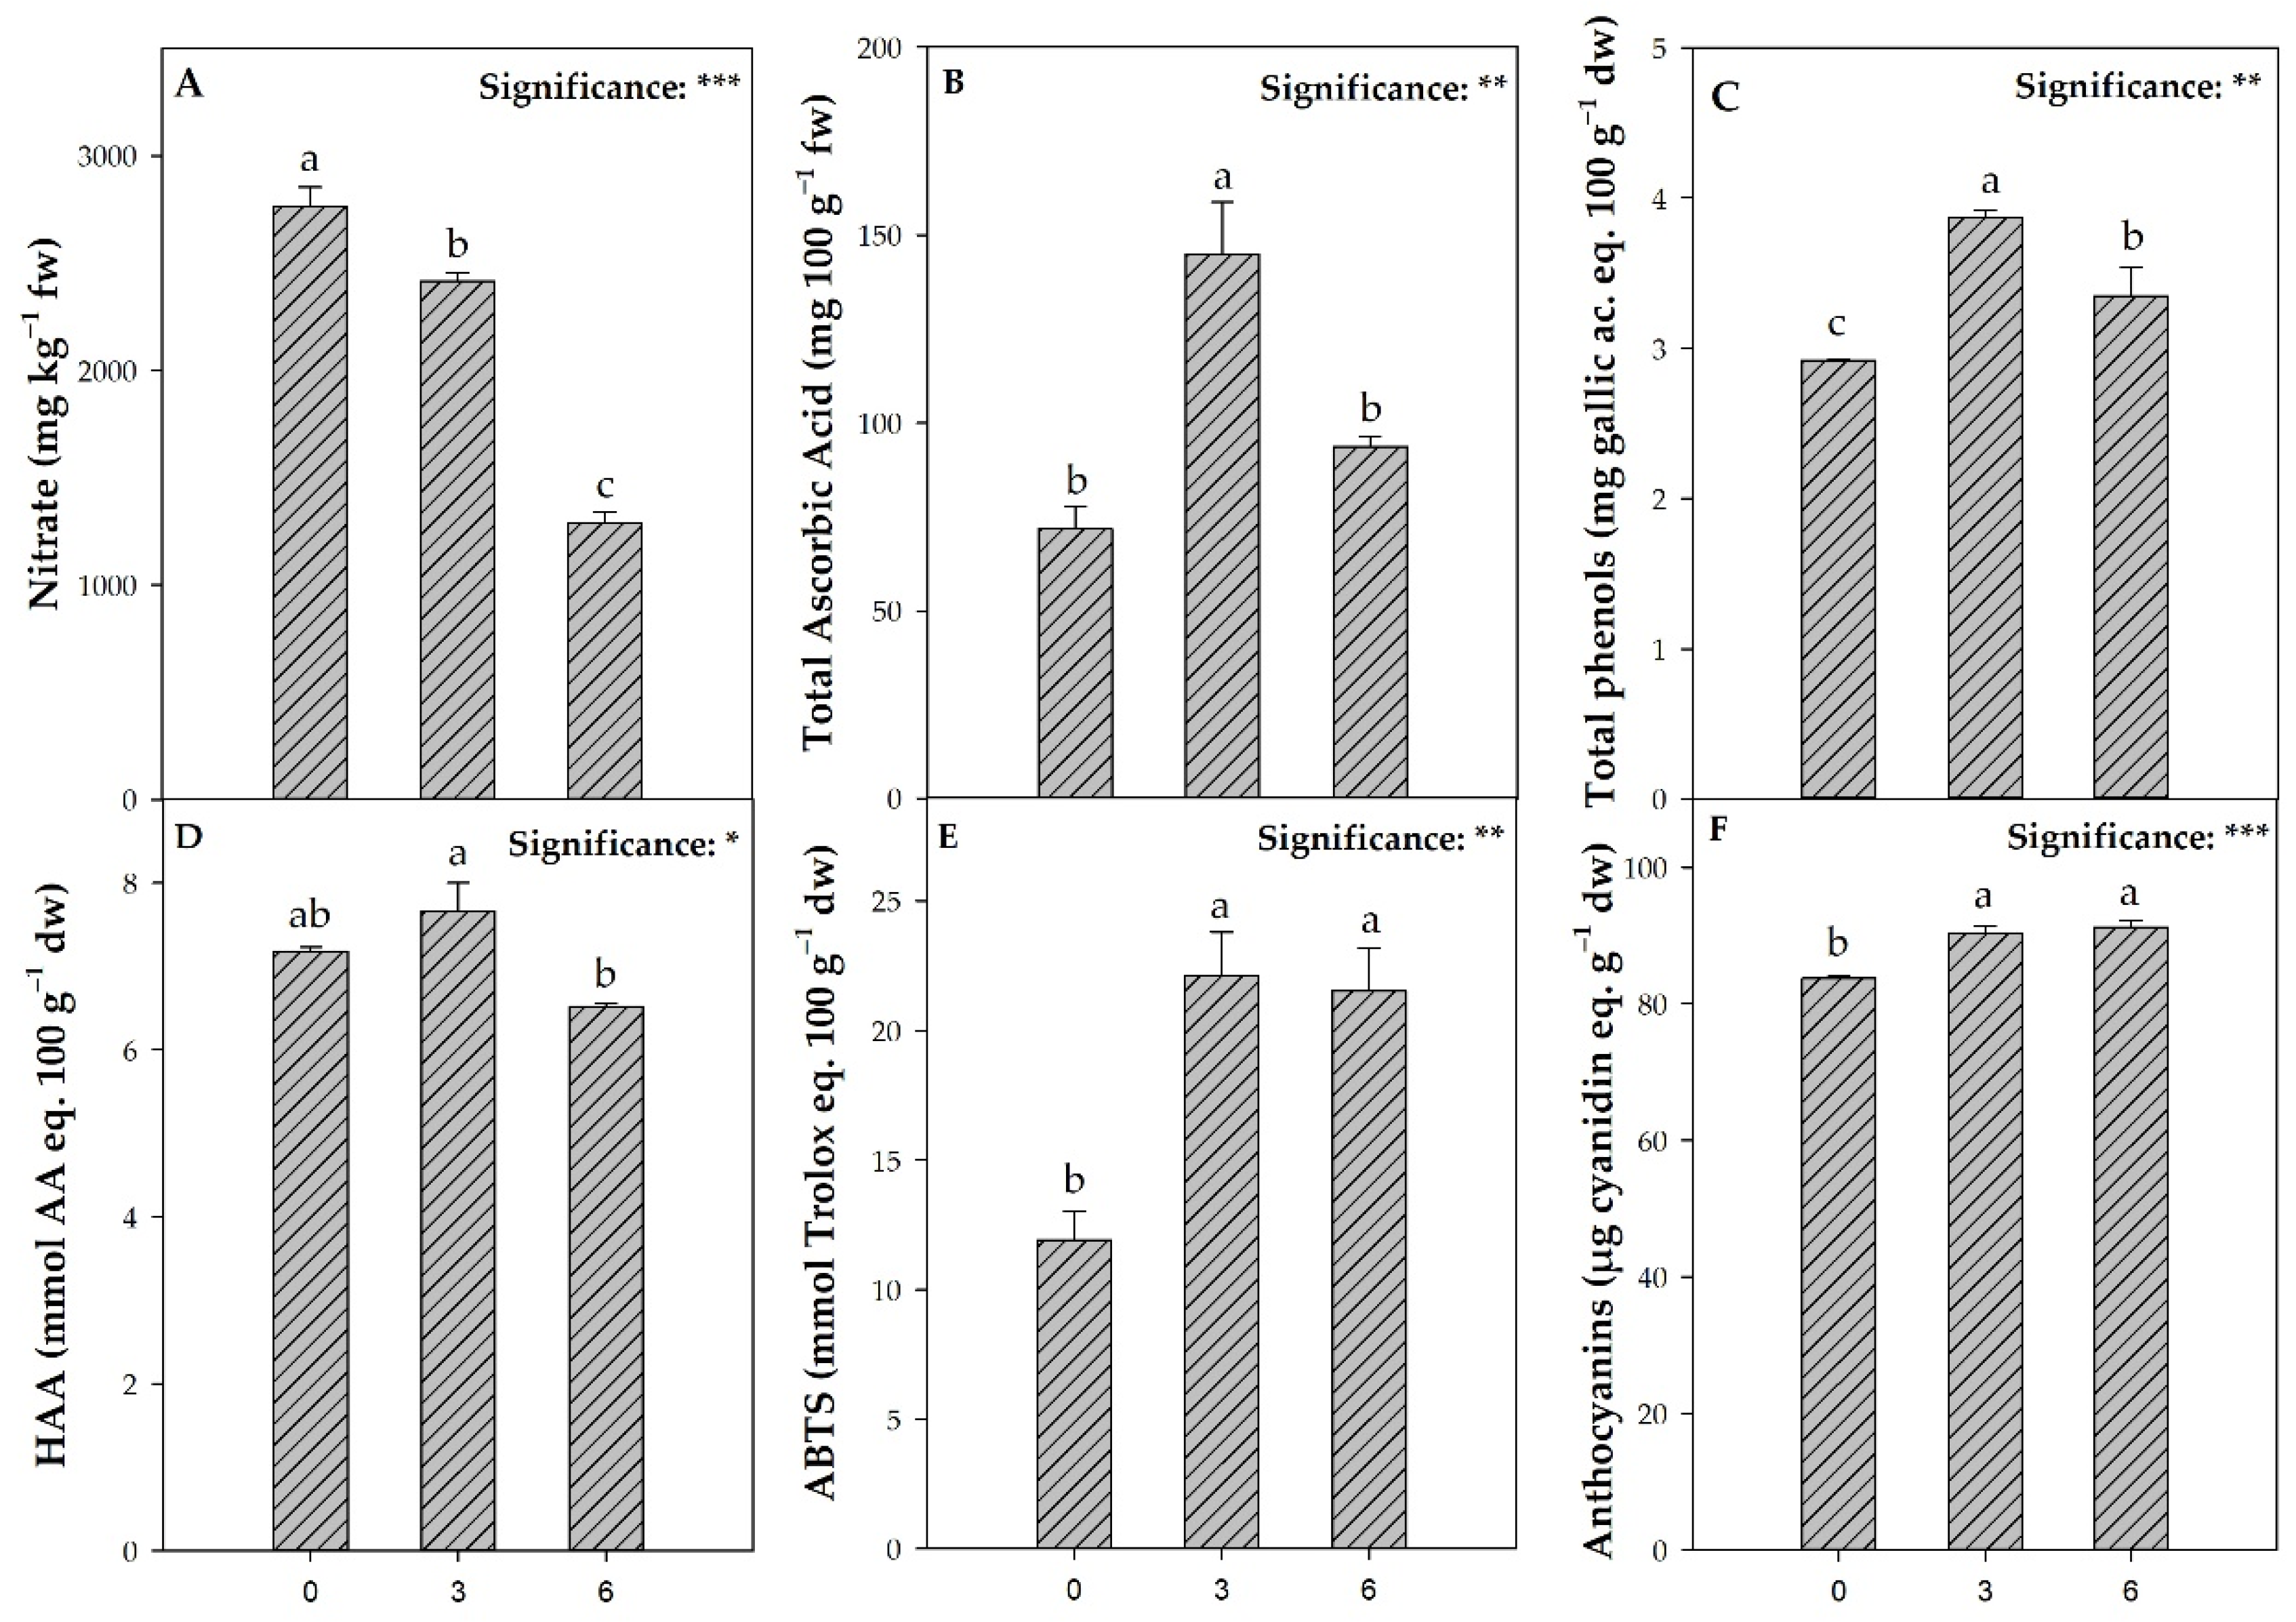
70]. As expected, in our experiment, NS deprivation treatments reduced leaf nitrate content compared to the control (0 DD). Specifically, the values obtained at 3 DD and 6 DD were about two and four-fold lower, respectively, than the threshold limit of 5000 mg kg−1 fw set by the EU Regulation 1258/2011 [21]. Interestingly, the nitrate reduction after NS deprivation was higher than that of total nitrogen, which agrees with Gent’s [71] findings in a previous study. The lower nitrate concentration at 6 DD could be attributable to the reduction of NO3 reserve (vacuolar nitrate) content that plants use to support metabolic processes [22]. During the nitrate assimilation process, vacuolar NO3- ions are replaced by organic acids to prevent alkalization [72]. The role of organic acids as crucial counter-anions for nitrogen metabolism justifies the lower malate, tartrate, and isocitrate values at 6 DD because a high deficiency of nitrate could impair the enzymatic activity involved in organic acid biosynthesis [72]. In contrast, deprivation treatments (3 DD and 6 DD) increased starch content in leaves, compared to the control (0 DD), as nitrate depletion may have prompted plants to accumulate starch as an osmotically inactive form of carbon [72]. Moreover, since nitrate is sensed by plants that adjust their metabolism according to its concentration, the decrease of this important nutrient results in coordinate alterations in the activities of enzymes in several metabolic pathways that are directly or indirectly involved in its reduction and assimilation, including ammonium assimilation, organic acid synthesis, and starch metabolism [72]. Thus, at 3 DD and 6 DD, starch, sucrose, and glucose increased in lettuce plants because they were not used as the source of carbon skeletons for nitrogen assimilation, while organic acids as well as glutamine and glutamate decreased.
Under sub-optimal environmental conditions, plants activate defense mechanisms for their survival [73], producing a wide range of secondary metabolites with antioxidant activity with well-known benefits for human health [4]. In this perspective, nutritional eustress is an excellent strategy to trigger gene activation involved in the biosynthesis of ascorbic acid and phenols, which improves the nutraceutical quality of vegetables [74]. In agreement with the above, deprivation-induced nutritional stress three days before harvest, in comparison with control (0 DD), increased total phenols, total ascorbic acid, and thus hydrophilic (HAA) and ABTS antioxidant activities. It is worth noting that deprivation of the nutrient solution at 6 DD also resulted in a significant increase in ABTS content, in contrast to HAA. As suggested by El-Nakhel [8] and Zhou [4], the total phenols and total ascorbic acid concentration increase after macronutrient deprivation can be attributed to an upregulation of the enzymatic activity of phenylalanine ammonia-lyase (PAL) and L-galactose dehydrogenase (L-GalDH), respectively.
Because antioxidant compounds scavenge hydrogen peroxide (H2O2) [75,76], the non-increase in H2O2 levels in nutrient-deprived plants at 3 DD, compared with the control (0 DD), could be attributable to the increase in antioxidant activity, thus contributing to the scavenging of harmful reactive oxygen species (ROS). In contrast, at 6 DD, the opposite trend was observed, with a significant increase in H2O2 reflecting the HAA decrease. Interestingly, long-term nutrient deprivation (6 DD) did not increase total phenols, total ascorbic acid, and HAA than their values at 3 DD. Our results are corroborated by a previous study by Zhou [4], in which a decrease in transcriptional levels of genes involved in regulating the biosynthesis of antioxidant compounds was observed after a long-term deprivation of nitrate [4].
However, it is interesting that, in lettuce at 6 DD, the perturbation in H2O2 homeostasis can probably affect cytosolic pH inducing the decarboxylation of glutamate to produce GABA [77,78,79]. Since, for the synthesis of this, non-protein amino acid protons are consumed, this process may enable the stationary control of pH. Moreover, GABA has a proved scavenging activity not only against H2O2, but also against superoxide anion radicals and singlet oxygen able to stabilize and protect thylakoids and ensure the viability and photosynthetic efficiency of the plants [80,81]. As reported by several authors, GABA levels increase in response to biotic and abiotic stresses, especially during nutrient starvation [81,82]. Specifically, GABA, after being rapidly synthetized for cell protection in response to stress—mainly functioning as a pH stabilizer and antioxidant—is broken down upon relief of stress to provide nitrogen, NADH, and or/anaplerotic succinate to the Krebs cycle for restoring the energy supply, which is crucial to guarantee that plant recovery and repair stress induced damage [83]. Nonetheless, GABA is an important health-promoting functional compound that can prevent degenerative diseases; for this reason, diverse GABA-enriched foods are currently on the market [84], and a lettuce naturally enriched with GABA could be an interesting premium quality produce. In addition, BCAAs also increased in lettuce at 6 DD, which have been proved to actively function as antioxidants not only in plants, but also in rats and mice by an unknown mechanism [85].

5. Conclusions

Hydroponic growing systems such as the floating raft system can facilitate the bioaccumulation of these nutritional compounds while reducing nitrate content through the possibility to apply nutritional eustress. In the present study, we demonstrated that replacing nutrient solution with water three and six days before harvest reduced the nitrate content and increased the nutritional quality of ready-to-eat lettuce. The lowest nitrate content (1290 mg kg−1 fw) was obtained in plants deprived of the nutrient solution six days before harvest, although the fresh yield decreased by 13.2% compared to control plants. However, the best compromise between yield performance and bioactive compound accumulation was obtained in the plants deprived of the nutrient solution three days before harvest, which significantly increased the total ascorbic acid, total phenols, ABTS antioxidant activity, anthocyanins, sucrose, and starch, whereas this decreased the fresh yield by only 4.7%. These results show that the total deprivation of the nutrient solution with water three days before harvest is a proper eco-friendly strategy for growers to increase the nutritional quality of ready-to-eat lettuce. Furthermore, lettuce plants after six days of deprivation can represent an important premium quality produce for their natural higher content of GABA and BCAAs and lower content of the anti-nutrient nitrate. Future research should focus on recycling the deprived nutrient solutions that will be used in a “cascade” growing system in which more and less nutrient demanding species succeed each other.

Supplementary Materials

The following are available online at https://0-www-mdpi-com.brum.beds.ac.uk/article/10.3390/agronomy11081469/s1, Figure S1: Average air temperature, air relative humidity and Photosynthetic Photon Flux Density (PPFD) recorded during the growing season at the experimental site.

Author Contributions

Conceptualization, M.C., L.F., Y.R. and P.C.; methodology, M.C., L.F., A.P., C.E.-N., L.G.D., F.C., B.R.G., M.G. and G.M.F.; software, A.P.; validation, M.C., L.F., A.P., C.E.-N., L.G.D., F.C., B.R.G., M.G. and G.M.F.; formal analysis, M.C., L.F., A.P., C.E.-N., L.G.D., F.C., B.R.G., M.G. and G.M.F.; investigation, M.C., L.F., A.P., C.E.-N., L.G.D., F.C., B.R.G., M.G. and G.M.F.; resources, P.C.; data curation, M.C., L.F., A.P., C.E.-N., L.G.D., F.C., B.R.G., M.G. and G.M.F.; writing—original draft preparation, M.C., L.F., and P.C.; writing—review and editing, M.C., L.F., G.F., A.P., C.E.-N., F.C., Y.R., P.W. and P.C.; visualization, Y.R. and P.C.; supervision, Y.R. and P.C.; project administration, P.C.; funding acquisition, P.C. All authors have read and agreed to the published version of the manuscript.

Funding

This research received no external funding.

Data Availability Statement

The datasets generated for this study are available upon request to the corresponding author.

Acknowledgments

The authors are grateful to Daniele Capurso and Vincenzo Milliardi for their technical assistance.

Conflicts of Interest

The authors declare no conflict of interest.

References

  1. De Vries, I.M. Origin and domestication of Lactuca sativa L. Genet. Resour. Crop Evol. 1997, 44, 165–174. [Google Scholar] [CrossRef]
  2. Barbosa, G.L.; Almeida Gadelha, F.D.; Kublik, N.; Proctor, A.; Reichelm, L.; Weissinger, E.; Wohlleb, G.M.; Halden, R.U. Comparison of land, water, and energy requirements of lettuce grown using hydroponic vs. conventional agricultural methods. Int. J. Environ. Res. Public Health 2015, 12, 6879–6891. [Google Scholar] [CrossRef] [PubMed] [Green Version]
  3. Kim, M.J.; Moon, Y.; Tou, J.C.; Mou, B.; Waterland, N.L. Nutritional value, bioactive compounds and health benefits of lettuce (Lactuca sativa L.). J. Food Compos. Anal. 2016, 49, 19–34. [Google Scholar] [CrossRef]
  4. Zhou, W.; Chen, Y.; Xu, H.; Liang, X.; Hu, Y.; Jin, C.; Lu, L.; Lin, X. Short-term nitrate limitation prior to harvest improves phenolic compound accumulation in hydroponic-cultivated lettuce (Lactuca sativa L.) without reducing shoot fresh weight. J. Agric. Food Chem. 2018, 66, 10353–10361. [Google Scholar] [CrossRef] [PubMed]
  5. Sapkota, S.; Sapkota, S.; Liu, Z. Effects of nutrient composition and lettuce cultivar on crop production in hydroponic culture. Horticulturae 2019, 5, 72. [Google Scholar] [CrossRef] [Green Version]
  6. Damerum, A.; Chapman, M.A.; Taylor, G. Innovative breeding technologies in lettuce for improved post-harvest quality. Postharvest Biol. Technol. 2020, 168, 111266. [Google Scholar] [CrossRef]
  7. Miras-Moreno, B.; Corrado, G.; Zhang, L.; Senizza, B.; Righetti, L.; Bruni, R.; El-Nakhel, C.; Sifola, M.I.; Pannico, A.; De Pascale, S.; et al. The metabolic reprogramming induced by sub-optimal nutritional and light inputs in soilless cultivated green and red butterhead lettuce. Int. J. Mol. Sci. 2020, 21, 6381. [Google Scholar] [CrossRef]
  8. El-Nakhel, C.; Pannico, A.; Kyriacou, M.C.; Giordano, M.; De Pascale, S.; Rouphael, Y. Macronutrient deprivation eustress elicits differential secondary metabolites in red and green-pigmented butterhead lettuce grown in a closed soilless system. J. Sci. Food Agric. 2019, 99, 6962–6972. [Google Scholar] [CrossRef]
  9. Simko, I. Genetic variation in response to N, P, or K deprivation in baby leaf lettuce. Horticulturae 2020, 6, 15. [Google Scholar] [CrossRef]
  10. Frasetya, B.; Harisman, K.; Ramdaniah, N.A.H. The effect of hydroponics systems on the growth of lettuce. In Proceedings of the IOP Conference Series: Materials Science and Engineering, Bandung Barat, Indonesia, 20–21 April 2020; IOP Publishing: Suzhou, China, 2021; Volume 1098, p. 042115. [Google Scholar]
  11. Touliatos, D.; Dodd, I.C.; Mcainsh, M. Vertical farming increases lettuce yield per unit area compared to conventional horizontal hydroponics. Food Energy Secur. 2016, 5, 184–191. [Google Scholar] [CrossRef] [Green Version]
  12. Kotsiras, A.; Vlachodimitropoulou, A.; Gerakaris, A.; Bakas, N.; Darras, A.I. Innovative harvest practices of Butterhead, Lollo rosso and Batavia green lettuce (Lactuca sativa L.) types grown in floating hydroponic system to maintain the quality and improve storability. Sci. Hortic. 2016, 201, 1–9. [Google Scholar] [CrossRef]
  13. Tomasi, N.; Pinton, R.; Dalla Costa, L.; Cortella, G.; Terzano, R.; Mimmo, T.; Scampicchio, M.; Cesco, S. New “solutions” for floating cultivation system of ready-to-eat salad: A review. Trends Food Sci. Technol. 2015, 46, 267–276. [Google Scholar] [CrossRef]
  14. Ciriello, M.; Formisano, L.; El Nakhel, C.; Corrado, G.; Pannico, A.; De Pascale, S.; Rouphael, Y. Morpho-physiological responses and secondary metabolites modulation by preharvest factors of three hydroponically grown genovese basil cultivars. Front. Plant Sci. 2021, 12, 619. [Google Scholar] [CrossRef] [PubMed]
  15. Borgognone, D.; Rouphael, Y.; Cardarelli, M.; Lucini, L.; Colla, G. Changes in biomass, mineral composition, and quality of cardoon in response to NO3:Cl ratio and nitrate deprivation from the nutrient solution. Front. Plant Sci. 2016, 7, 978. [Google Scholar] [CrossRef] [Green Version]
  16. Gruda, N. Do soilless culture systems have an influence on product quality of vegetables? J. Appl. Bot. Food Qual. 2009, 82, 141–147. [Google Scholar] [CrossRef]
  17. Bian, Z.; Wang, Y.; Zhang, X.; Li, T.; Grundy, S.; Yang, Q.; Cheng, R. A review of environment effects on nitrate accumulation in leafy vegetables grown in controlled environments. Foods 2020, 9, 732. [Google Scholar] [CrossRef]
  18. Bot, J.L.; Jeannequin, B.; Fabre, R. Growth and nitrogen status of soilless tomato plants following nitrate withdrawal from the nutrient solution. Ann. Bot. 2001, 88, 361–370. [Google Scholar] [CrossRef] [Green Version]
  19. European Food Safety Authority. Nitrate in vegetables-scientific opinion of the panel on contaminants in the food chain. EFSA J. 2008, 6, 689. [Google Scholar] [CrossRef]
  20. Colla, G.; Kim, H.J.; Kyriacou, M.C.; Rouphael, Y. Nitrate in fruits and vegetables. Sci. Hortic. 2018, 237, 221–238. [Google Scholar] [CrossRef]
  21. European Union. Commission Regulation (EU) No 1258/2011 of 2 December 2011 amending Regulation (EC) No 1881/2006 as regards maximum levels for nitrates in foodstuffs Text with EEA relevance. Off. J. Eur. Union 2011, 54, 15–17. [Google Scholar]
  22. Santamaria, P.; Elia, A.; Parente, A.; Serio, F. Fertilization strategies for lowering nitrate content in leafy vegetables: Chicory and rocket salad cases. J. Plant. Nutr. 1998, 21, 1791–1803. [Google Scholar] [CrossRef]
  23. Santamaria, P.; Gonnella, M.; Elia, A.; Parente, A.; Serio, F. Ways of reducing rocket salad nitrate content. Acta Hortic. 2001, 548, 529–536. [Google Scholar] [CrossRef]
  24. Carillo, P.; Kyriacou, M.C.; El-Nakhel, C.; Pannico, A.; dell’Aversana, E.; D’Amelia, L.; Colla, G.; Caruso, G.; De Pascale, S.; Rouphael, Y. Sensory and functional quality characterization of protected designation of origin ‘Piennolo del Vesuvio’ cherry tomato landraces from Campania-Italy. Food Chem. 2019, 292, 166–175. [Google Scholar] [CrossRef]
  25. Corrado, G.; Formisano, L.; De Micco, V.; Pannico, A.; Giordano, M.; El-Nakhel, C.; Chiaiese, P.; Sacchi, R.; Rouphael, Y. Understanding the morpho-anatomical, physiological, and functional response of sweet basil to isosmotic nitrate to chloride ratios. Biology 2020, 9, 158. [Google Scholar] [CrossRef]
  26. Chatzigianni, M.; Ntatsi, G.; Theodorou, M.; Stamatakis, A.; Livieratos, I.; Rouphael, Y.; Savvas, D. Functional quality, mineral composition and biomass production in hydroponic spiny chicory (Cichorium spinosum L.) are modulated interactively by ecotype, salinity and nitrogen supply. Front. Plant. Sci. 2019, 10, 1040. [Google Scholar] [CrossRef] [Green Version]
  27. Wellburn, A.R. The spectral determination of chlorophylls a and b, as well as total carotenoids, using various solvents with spectrophotometers of different resolution. J. Plant. Physiol. 1994, 144, 307–313. [Google Scholar] [CrossRef]
  28. Formisano, L.; Ciriello, M.; El-Nakhel, C.; De Pascale, S.; Rouphael, Y. Dataset on the effects of anti-insect nets of different porosity on mineral and organic acids profile of Cucurbita pepo L. fruits and leaves. Data 2021, 6, 50. [Google Scholar] [CrossRef]
  29. Pannico, A.; El-Nakhel, C.; Kyriacou, M.C.; Giordano, M.; Stazi, S.R.; De Pascale, S.; Rouphael, Y. Combating micronutrient deficiency and enhancing food functional quality through selenium fortification of select lettuce genotypes grown in a closed soilless system. Front. Plant. Sci. 2019, 10, 1495. [Google Scholar] [CrossRef] [PubMed] [Green Version]
  30. Kyriacou, M.C.; El-Nakhel, C.; Graziani, G.; Pannico, A.; Soteriou, G.A.; Giordano, M.; Ritieni, A.; De Pascale, S.; Rouphael, Y. Functional quality in novel food sources: Genotypic variation in the nutritive and phytochemical composition of thirteen microgreens species. Food Chem. 2019, 277, 107–118. [Google Scholar] [CrossRef] [PubMed]
  31. Singleton, V.L.; Orthofer, R.; Lamuela-Raventós, R.M. Analysis of total phenols and other oxidation substrates and antioxidants by means of folin-ciocalteu reagent. Methods Enzymol. 1999, 299, 152–178. [Google Scholar] [CrossRef]
  32. Kampfenkel, K.; Van Montagu, M.; Inzé, D. Extraction and determination of ascorbate and dehydroascorbate from plant tissue. Anal. Biochem. 1995, 225, 165–167. [Google Scholar] [CrossRef]
  33. Rouphael, Y.; Corrado, G.; Colla, G.; De Pascale, S.; Dell’Aversana, E.; D’Amelia, L.I.; Fusco, G.M.; Carillo, P. Biostimulation as a means for optimizing fruit phytochemical content and functional quality of tomato landraces of the San Marzano area. Foods 2021, 10, 926. [Google Scholar] [CrossRef] [PubMed]
  34. Dell’Aversana, E.; Hessini, K.; Ferchichi, S.; Fusco, G.M.; Woodrow, P.; Ciarmiello, L.F.; Abdelly, C.; Carillo, P. Salinity duration differently modulates physiological parameters and metabolites profile in roots of two contrasting barley genotypes. Plants 2021, 10, 307. [Google Scholar] [CrossRef] [PubMed]
  35. Fogliano, V.; Verde, V.; Randazzo, G.; Ritieni, A. Method for measuring antioxidant activity and its application to monitoring the antioxidant capacity of wines. J. Agric. Food Chem. 1999, 47, 1035–1040. [Google Scholar] [CrossRef] [PubMed]
  36. Pellegrini, N.; Ke, R.; Yang, M.; Rice-Evans, C. Screening of dietary carotenoids and carotenoid-rich fruit extracts for antioxidant activities applying 2, 2′-azinobis (3-ethylenebenzothiazoline-6-sulfonic acid radical cation decolorization assay. Methods Enzymol. 1999, 299, 379–389. [Google Scholar]
  37. Song, P.; Feng, G.; Brooks, J.; Zhou, B.; Zhou, H.; Zhao, Z.; Li, Y. Environmental risk of chlorine-controlled clogging in drip irrigation system using reclaimed water: The perspective of soil health. J. Clean. Prod. 2019, 232, 1452–1464. [Google Scholar] [CrossRef]
  38. Lonigro, A.; Montemurro, N.; Laera, G. Effects of residual disinfectant on soil and lettuce crop irrigated with chlorinated water. Sci. Total Environ. 2017, 584, 595–602. [Google Scholar] [CrossRef]
  39. Rouphael, Y.; Kyriacou, M.C.; Petropoulos, S.A.; De Pascale, S.; Colla, G. Improving vegetable quality in controlled environments. Sci. Hortic. 2018, 234, 275–289. [Google Scholar] [CrossRef]
  40. Mou, B. Nutrient content of lettuce and its Improvement. Curr. Nutr. Food Sci. 2009, 5, 242–248. [Google Scholar] [CrossRef]
  41. Fallovo, C.; Rouphael, Y.; Rea, E.; Battistelli, A.; Colla, G. Nutrient solution concentration and growing season affect yield and quality of Lactuca sativa L. var. acephala in floating raft culture. J. Sci. Food Agric. 2009, 89, 1682–1689. [Google Scholar] [CrossRef]
  42. Genuncio, G.d.C.; Gomes, M.; Ferrari, A.C.; Majerowicz, N.; Zonta, E. Hydroponic lettuce production in different concentrations and flow rates of nutrient solution. Hortic. Bras. 2012, 30, 526–530. [Google Scholar] [CrossRef] [Green Version]
  43. Samborska, I.A.; Kalaji, H.M.; Sieczko, L.; Goltsev, V.; Borucki, W.; Jajoo, A. Structural and functional disorder in the photosynthetic apparatus of radish plants under magnesium deficiency. Funct. Plant. Biol. 2018, 45, 668–679. [Google Scholar] [CrossRef]
  44. Hawkesford, M.; Horst, W.; Kichey, T.; Lambers, H.; Schjoerring, J.; Møller, I.S.; White, P. Functions of macronutrients. In Marschner’s Mineral Nutrition of Higher Plants, 3rd ed.; Elsevier: Amsterdam, The Netherlands, 2011; pp. 135–189. ISBN 9780123849052. [Google Scholar]
  45. Rouphael, Y.; Kyriacou, M.C. Enhancing quality of fresh vegetables through salinity eustress and biofortification applications facilitated by soilless cultivation. Front. Plant. Sci. 2018, 9, 1254. [Google Scholar] [CrossRef]
  46. Colla, G.; Rouphael, Y.; Cardarelli, M.; Svecova, E.; Rea, E.; Lucini, L. Effects of saline stress on mineral composition, phenolic acids and flavonoids in leaves of artichoke and cardoon genotypes grown in floating system. J. Sci. Food Agric. 2013, 93, 1119–1127. [Google Scholar] [CrossRef]
  47. Tegeder, M.; Masclaux-Daubresse, C. Source and sink mechanisms of nitrogen transport and use. New Phytol. 2018, 217, 35–53. [Google Scholar] [CrossRef] [PubMed] [Green Version]
  48. Gerendás, J.; Führs, H. The significance of magnesium for crop quality. Plant. Soil 2013, 368, 101–128. [Google Scholar] [CrossRef] [Green Version]
  49. Schreiber, U.; Bilger, W.; Neubauer, C. Chlorophyll fluorescence as a nonintrusive indicator for rapid assessment of in vivo photosynthesis. In Ecophysiology of Photosynthesis; Schulze, E., Caldwell, M., Eds.; Springer: Heidelberg, Germany, 1995; pp. 49–70. [Google Scholar]
  50. Lin, K.H.; Huang, M.Y.; Huang, W.D.; Hsu, M.H.; Yang, Z.W.; Yang, C.M. The effects of red, blue, and white light-emitting diodes on the growth, development, and edible quality of hydroponically grown lettuce (Lactuca sativa L. var. capitata). Sci. Hortic. 2013, 150, 86–91. [Google Scholar] [CrossRef]
  51. Rambo, L.; Ma, B.L.; Xiong, Y.; da Silvia, P.R.F. Leaf and canopy optical characteristics as crop-n-status indicators for field nitrogen management in corn. J. Plant. Nutr. Soil Sci. 2010, 173, 434–443. [Google Scholar] [CrossRef]
  52. Mahlangu, R.I.S.; Maboko, M.M.; Sivakumar, D.; Soundy, P.; Jifon, J. Lettuce (Lactuca sativa L.) growth, yield and quality response to nitrogen fertilization in a non-circulating hydroponic system. J. Plant. Nutr. 2016, 39, 1766–1775. [Google Scholar] [CrossRef]
  53. Fallovo, C.; Rouphael, Y.; Cardarelli, M.; Rea, E.; Battistelli, A.; Colla, G. Yield and quality of leafy lettuce in response to nutrient solution composition and growing season. J. Food Agric. Environ. 2009, 7, 456–462. [Google Scholar]
  54. Pathare, P.B.; Opara, U.L.; Al-Said, F.A.J. Colour measurement and analysis in fresh and processed foods: A review. Food Bioprocess. Technol. 2013, 6, 36–60. [Google Scholar] [CrossRef]
  55. Roshanak, S.; Rahimmalek, M.; Goli, S.A.H. Evaluation of seven different drying treatments in respect to total flavonoid, phenolic, vitamin C content, chlorophyll, antioxidant activity and color of green tea (Camellia sinensis or C. assamica) leaves. J. Food Sci. Technol. 2016, 53, 721–729. [Google Scholar] [CrossRef] [Green Version]
  56. Gershenzon, J. Changes in the levels of plant secondary metabolites under water and nutrient stress. In Phytochemical Adaptations to Stress; Springer: Heidelberg, Germany, 1984; pp. 273–320. [Google Scholar]
  57. Ramakrishna, A.; Ravishankar, G.A. Influence of abiotic stress signals on secondary metabolites in plants. Plant. Signal. Behav. 2011, 6, 1720–1731. [Google Scholar] [CrossRef]
  58. Rouphael, Y.; Cardarelli, M.; Lucini, L.; Rea, E.; Colla, G. Nutrient solution concentration affects growth, mineral composition, phenolic acids, and flavonoids in leaves of artichoke and cardoon. HortScience 2012, 47, 1424–1429. [Google Scholar] [CrossRef] [Green Version]
  59. Pannico, A.; Graziani, G.; El-Nakhel, C.; Giordano, M.; Ritieni, A.; Kyriacou, M.C.; Rouphael, Y. Nutritional stress suppresses nitrate content and positively impacts ascorbic acid concentration and phenolic acids profile of lettuce microgreens. Italus Hortus 2020, 27, 41–52. [Google Scholar] [CrossRef]
  60. Baslam, M.; Morales, F.; Garmendia, I.; Goicoechea, N. Nutritional quality of outer and inner leaves of green and red pigmented lettuces (Lactuca sativa L.) consumed as salads. Sci. Hortic. 2013, 151, 103–111. [Google Scholar] [CrossRef]
  61. Yoshida, T.; Sakuma, K.; Kumagai, H. Nutritional and taste characteristics of low-potassium lettuce developed for patients with chronic kidney diseases. Hong Kong J. Nephrol. 2014, 16, 42–45. [Google Scholar] [CrossRef] [Green Version]
  62. Mondal, M.F.; Asaduzzaman, M.; Ueno, M.; Kawaguchi, M.; Yano, S.; Ban, T.; Tanaka, H.; Asao, T. Reduction of potassium (K) content in strawberry fruits through KNO3 management of hydroponics. Hortic. J. 2016, 86, 26–36. [Google Scholar] [CrossRef] [Green Version]
  63. Ogawa, A.; Eguchi, T.; Toyofuku, K. Cultivation methods for leafy vegetables and tomatoes with low potassium content for dialysis patients. Environ. Control. Biol. 2012, 50, 407–414. [Google Scholar] [CrossRef] [Green Version]
  64. Atsushi, O. Cultivation methods for leafy vegetables and tomatoes with low potassium content for dialysis patients and the change of those qualities. Potassium Improv. Qual. Fruits Veg. Hydroponic Nutr. Manag. 2019, 69, 2–17. [Google Scholar] [CrossRef] [Green Version]
  65. Asao, T.; Asaduzzaman, M.; Mondal, M.F.; Tokura, M.; Adachi, F.; Ueno, M.; Kawaguchi, M.; Yano, S.; Ban, T. Impact of reduced potassium nitrate concentrations in nutrient solution on the growth, yield and fruit quality of melon in hydroponics. Sci. Hortic. 2013, 164, 221–231. [Google Scholar] [CrossRef]
  66. Asaduzzaman, M.; Talukder, M.R.; Tanaka, H.; Ueno, M.; Kawaguchi, M.; Yano, S.; Ban, T.; Asao, T. Production of low-potassium content melon through hydroponic nutrient management using perlite substrate. Front. Plant. Sci. 2018, 9, 1–18. [Google Scholar] [CrossRef] [PubMed] [Green Version]
  67. Colonna, E.; Rouphael, Y.; Barbieri, G.; De Pascale, S. Nutritional quality of ten leafy vegetables harvested at two light intensities. Food Chem. 2016, 199, 702–710. [Google Scholar] [CrossRef] [PubMed]
  68. Petropoulos, S.A.; Constantopoulou, E.; Karapanos, I.; Akoumianakis, C.A.; Passam, H.C. Diurnal variation in the nitrate content of parsley foliage. Int. J. Plant. Prod. 2011, 5, 431–438. [Google Scholar]
  69. Santamaria, P. Nitrate in vegetables: Toxicity, content, intake and EC regulation. J. Sci. Food Agric. 2006, 86, 10–17. [Google Scholar] [CrossRef]
  70. Cavaiuolo, M.; Ferrante, A. Nitrates and glucosinolates as strong determinants of the nutritional quality in rocket leafy salads. Nutrients 2014, 6, 1519–1538. [Google Scholar] [CrossRef] [Green Version]
  71. Gent, M.P.N. Rate of change of composition of lettuce in response to nitrogen depletion or re-supply. J. Sci. Food Agric. 2012, 92, 3007–3015. [Google Scholar] [CrossRef]
  72. Scheible, W.R.; González-Fontes, A.; Lauerer, M.; Müller-Röber, B.; Caboche, M.; Stitt, M. Nitrate acts as a signal to induce organic acid metabolism and repress starch metabolism in tobacco. Plant. Cell 1997, 9, 783–798. [Google Scholar] [CrossRef]
  73. Atkinson, N.J.; Urwin, P.E. The interaction of plant biotic and abiotic stresses: From genes to the field. J. Exp. Bot. 2012, 63, 3523–3544. [Google Scholar] [CrossRef] [PubMed] [Green Version]
  74. Becker, C.; Urlić, B.; Špika, M.J.; Kläring, H.P.; Krumbein, A.; Baldermann, S.; Ban, S.G.; Perica, S.; Schwarz, D. Nitrogen limited red and green leaf lettuce accumulate flavonoid glycosides, caffeic acid derivatives, and sucrose while losing chlorophylls, ?-carotene and xanthophylls. PLoS ONE 2015, 10, e0142867. [Google Scholar] [CrossRef]
  75. Sudhakar, C.; Lakshmi, A.; Giridarakumar, S. Changes in the antioxidant enzyme efficacy in two high yielding genotypes of mulberry (Morus alba L.) under NaCl salinity. Plant. Sci. 2001, 161, 613–619. [Google Scholar] [CrossRef]
  76. Formisano, L.; El-Nakhel, C.; Corrado, G.; De Pascale, S.; Rouphael, Y. Biochemical, physiological, and productive response of greenhouse vegetables to suboptimal growth environment induced by insect nets. Biology 2020, 9, 432. [Google Scholar] [CrossRef]
  77. Carillo, P. GABA shunt in durum wheat. Front. Plant. Sci. 2018, 9, 100. [Google Scholar] [CrossRef]
  78. Annunziata, M.G.; Ciarmiello, L.F.; Woodrow, P.; Dell’aversana, E.; Carillo, P. Spatial and temporal profile of glycine betaine accumulation in plants under abiotic stresses. Front. Plant. Sci. 2019, 10, 230. [Google Scholar] [CrossRef] [PubMed] [Green Version]
  79. Noctor, G.; Foyer, C.H. Ascorbate and glutathione: Keeping active oxygen under control. Annu. Rev. Plant. Biol. 1998, 49, 249–279. [Google Scholar] [CrossRef]
  80. Miller, G.; Suzuki, N.; Ciftci-Yilmaz, S.; Mittler, R. Reactive oxygen species homeostasis and signalling during drought and salinity stresses. Plant. Cell Environ. 2010, 33, 453–467. [Google Scholar] [CrossRef] [PubMed]
  81. Bown, A.W.; Shelp, B.J. Does the GABA shunt regulate cytosolic GABA? Trends Plant. Sci. 2020, 25, 422–424. [Google Scholar] [CrossRef]
  82. Bown, A.W.; Shelp, B.J. Plant GABA: Not just a Metabolite. Trends Plant. Sci. 2016, 21, 811–813. [Google Scholar] [CrossRef] [PubMed]
  83. Michaeli, S.; Fromm, H. Closing the loop on the GABA shunt in plants: Are GABA metabolism and signaling entwined? Front. Plant. Sci. 2015, 6, 419. [Google Scholar] [CrossRef] [Green Version]
  84. Takayama, M.; Ezura, H. How and why does tomato accumulate a large amount of GABA in the fruit? Front. Plant. Sci. 2015, 6, 612. [Google Scholar] [CrossRef] [Green Version]
  85. Woodrow, P.; Ciarmiello, L.F.; Annunziata, M.G.; Pacifico, S.; Iannuzzi, F.; Mirto, A.; D’Amelia, L.; Dell’Aversana, E.; Piccolella, S.; Fuggi, A.; et al. Durum wheat seedling responses to simultaneous high light and salinity involve a fine reconfiguration of amino acids and carbohydrate metabolism. Physiol. Plant. 2017, 159, 290–312. [Google Scholar] [CrossRef] [PubMed]
Figure 1. Effect of nutrient solution deprivation at different days before harvest (0, 3, and 6) on the content of nitrate (A), total ascorbic acid (B), total phenols (C), hydrophilic antioxidant activity (HAA) (D), ABTS antioxidant activity (E), and anthocyanins (F) of lettuce grown in floating raft system. Data are mean values ± standard error, n = 3. Mean comparisons were performed by Tukey’s HSD Test (p = 0.05). Different letters indicate significant mean differences. *, ** and *** denote significant effects at p ≤ 0.05, 0.01, and 0.001, respectively. HAA: hydrophilic antioxidant activity, ABTS: 2,2’-azino-bis (3-ethylbenzothiazoline-6-sulfonic acid), fw: fresh weight, dw: dry weight.
Agronomy 11 01469 g001
Table 1. Effect of nutrient solution deprivation at different days before harvest on biometric parameters of lettuce grown in floating raft system. All data are expressed as mean ± standard error, n = 3.
Days of Deprivation (DD)Leaf AreaLeaf NumberFresh YieldDry BiomassDry Matter
(cm2 Plant−1)(no. Plant)(g Plant−1)(g Plant−1)(%)
01481 ± 13 a17.61 ± 0.20100.2 ± 0.45 a3.76 ± 0.15 a3.71 ± 0.14
31435 ± 27 a17.33 ± 0.1795.42 ± 0.85 b3.42 ± 0.01 ab3.54 ± 0.04
61312 ± 23 b17.06 ± 0.2986.98 ± 0.97 c3.37 ± 0.04 b3.80 ± 0.09
Significance**ns****ns
ns, *, **, *** non-significant or significant at p ≤ 0.05, 0.01, and 0.001, respectively. Different letters within each column indicate significant differences according to Tukey’s HSD test (p = 0.05).
Table 2. Effect of nutrient solution deprivation at different days before harvest on CIELab colorimetric indices of lettuce grown in floating raft system. All data are expressed as mean ± standard error, n = 3.
Days of Deprivation (DD)LabChromaHue Angle
047.61 ± 0.43 a−9.80 ± 0.20 b32.63 ± 0.53 a34.08 ± 0.56 a253.3 ± 0.07
347.44 ± 0.28 a−9.07 ± 0.03 b30.73 ± 0.21 a32.06 ± 0.21 a253.6 ± 0.04
644.25 ± 0.84 b−7.74 ± 0.32 a27.23 ± 0.78 b28.32 ± 0.83 b254.2 ± 0.34
Significance**********ns
ns, **, *** non-significant or significant at p ≤ 0.01 and 0.001, respectively. Different letters within each column indicate significant differences according to Tukey’s HSD test (p = 0.05). L: lightness; a: greenness; b: yellowness.
Table 3. Effect of nutrient solution deprivation at different days before harvest on total chlorophyll, carotenoids, SPAD index, chlorophyll fluorescence (Fv/Fm), and hydrogen peroxide of lettuce grown in floating raft system. All data are expressed as mean ± standard error, n = 3.
Days of Deprivation (DD)Total ChlorophyllsCarotenoidsChlorophyll a/b RatioChlorophyll/Carotenoids RatioSPAD IndexFv/FmH2O2
(mg g−1 fw)(mg g−1 fw)(µmol g−1 dw)
00.740 ± 0.030.238 ± 0.012.05 ± 0.103.11 ± 0.0327.08 ± 0.52 a0.843 ± 0.00 a35.16 ± 3.63 b
30.749 ± 0.030.248 ± 0.012.33 ± 0.013.02 ± 0.0825.27 ± 0.23 b0.834 ± 0.00 b37.04 ± 3.21 b
60.828 ± 0.060.268 ± 0.012.33 ± 0.103.09 ± 0.1426.39 ± 0.25 ab0.829 ± 0.00 b64.69 ± 2.46 a
Significancensnsnsns*****
ns, *, ** non-significant or significant at p ≤ 0.05, and 0.01, respectively. Different letters within each column indicate significant differences according to Tukey’s HSD test (p = 0.05). dw: dry weight.
Table 4. Effect of nutrient solution deprivation at different days before harvest on total nitrogen and mineral profile of lettuce grown in floating raft system. All data are expressed as mean ± standard error, n = 3.
Days of Deprivation (DD)NpKS
(mg g−1 dw)(mg g−1 dw)(mg g−1 dw)(mg g−1 dw)
046.40 ± 1.28 a5.90 ± 0.20 ab104.6 ± 0.37 a1.67 ± 0.07
343.95 ± 0.07 ab6.62 ± 0.07 a102.8 ± 1.37 a1.85 ± 0.01
641.11 ± 0.95 b5.37 ± 0.33 b75.02 ± 1.84 b1.72 ± 0.10
Significance*****ns
ns, *, *** non-significant or significant at p ≤ 0.05, and 0.001, respectively. Different letters within each column indicate significant differences according to Tukey’s HSD test (p = 0.05).
Table 5. Effect of nutrient solution deprivation at different days before harvest on the organic acids profile and carbohydrates content of lettuce grown in floating raft system. All data are expressed as mean ± standard error, n = 3.
Days of Deprivation (DD)MalateTartrateOxalateCitrateIsocitrateGlucoseFructoseSucroseStarch
(mg g−1 dw)(mg g−1 dw)(mg g−1 dw)(mg g−1 dw)(mg g−1 dw)(µmol g−1 dw)(µmol g−1 dw)(µmol g−1 dw)(µmol g−1 dw)
030.35 ± 0.87 a2.78 ± 0.08 a2.00 ± 0.06 a6.19 ± 0.191.03 ± 0.08 a331.9 ± 3.02 b291.3 ± 3.8246.35 ± 5.93 b44.37 ± 1.01 b
328.66 ± 0.64 ab2.38 ± 0.04 b1.63 ± 0.02 b5.72 ± 0.360.74 ± 0.06 b341.6 ± 0.67 ab291.2 ± 4.7364.36 ± 0.63 a53.01 ± 1.05 a
626.74 ± 0.41 b2.49 ± 0.02 b1.83 ± 0.06 ab5.49 ± 0.450.60 ± 0.04 b360.4 ± 7.63 a284.1 ± 1.0961.86 ± 1.13 a50.61 ± 0.71 a
Significance*****ns***ns***
ns, *, ** non-significant or significant at p ≤ 0.05, and 0.01, respectively. Different letters within each column indicate significant differences according to Tukey’s HSD test (p = 0.05).
Table 6. Effect of nutrient solution deprivation at different days before harvest on soluble proteins and amino acids profile included branched chain amino acids (BCAAs) of lettuce grown in floating raft system. All data are expressed as mean ± standard error, n = 3.
Chemical CompoundsDays of Deprivation (DD)
036Sig.
Soluble proteins (mg g−1 dw)6.99 ± 0.17 a6.70 ± 0.32 a5.13 ± 0.37 b**
Free amino acids (µmol g−1 dw)
Ala6.92 ± 0.176.47 ± 0.076.94 ± 0.38ns
Arg3.22 ± 0.07 ab3.06 ± 0.21 b4.07 ± 0.32 a*
Asn73.68 ± 0.34 a72.26 ± 0.55 a64.30 ± 2.61 b*
Asp2.16 ± 0.022.11 ± 0.121.89 ± 0.24ns
GABA4.19 ± 0.10 c5.37 ± 0.39 b7.08 ± 0.08 a***
Gln50.83 ± 0.66 a48.54 ± 1.51 ab45.58 ± 0.88 b*
Glu16.43 ± 0.15 a15.16 ± 0.37 b13.93 ± 0.28 c**
Gly0.49 ± 0.01 b0.56 ± 0.02 ab0.65 ± 0.03 a**
His0.60 ± 0.010.62 ± 0.040.67 ± 0.04ns
Ile2.33 ± 0.04 b2.31 ± 0.04 b2.76 ± 0.14 a*
Leu2.21 ± 0.03 b2.34 ± 0.11 ab2.72 ± 0.13 a*
Lys0.75 ± 0.020.76 ± 0.040.87 ± 0.05ns
MEA4.96 ± 0.104.66 ± 0.295.45 ± 0.30ns
Met0.05 ± 0.000.04 ± 0.000.06 ± 0.01ns
Orn0.58 ± 0.010.56 ± 0.020.58 ± 0.02ns
Phe1.39 ± 0.011.36 ± 0.081.39 ± 0.03ns
Pro3.41 ± 0.143.20 ± 0.043.17 ± 0.18ns
Ser6.38 ± 0.065.86 ± 0.235.33 ± 0.45ns
Thr2.07 ± 0.021.99 ± 0.051.67 ± 0.21ns
Trp0.85 ± 0.040.75 ± 0.050.71 ± 0.06ns
Tyr3.52 ± 0.093.54 ± 0.213.79 ± 0.26ns
Val2.41 ± 0.022.53 ± 0.142.80 ± 0.15ns
Total AA189.4 ± 1.00 a184.1 ± 2.71 a176.4 ± 0.78 b**
Essential AA15.89 ± 0.2315.77 ± 0.7317.73 ± 0.86ns
BCAAs6.95 ± 0.08 b7.18 ± 0.28 ab8.28 ± 0.42 a*
ns, *, **, *** non-significant or significant at p ≤ 0.05, 0.01, and 0.001, respectively. Different letters within each row indicate significant differences according to Tukey’s HSD test (p = 0.05).
Publisher’s Note: MDPI stays neutral with regard to jurisdictional claims in published maps and institutional affiliations.

