Article

Characterization of Oilseed Crop Noug (Guizotia abyssinica) Using Agro-Morphological Traits

1
Department of Plant Breeding, Swedish University of Agricultural Sciences, P.O. Box 190, 23422 Lomma, Sweden
2
Ethiopian Biotechnology Institute, Addis Ababa P.O. Box 5954, Ethiopia
*
Author to whom correspondence should be addressed.
Submission received: 12 June 2021 / Revised: 20 July 2021 / Accepted: 23 July 2021 / Published: 25 July 2021
(This article belongs to the Section Crop Breeding and Genetics)

Abstract

:
Noug (Guizotia abyssinica) is an outcrossing oilseed crop that serves as a source of edible oil and other nutrients although its seed yield is generally low. The analysis of agro-morphological traits in relation to seed and oil yields is important for improving the productivity of this crop. The present study aimed at assessing the variation and heritability of quantitative (10) and qualitative (6) traits in noug based on 60 landrace accessions collected from wide geographic area in Ethiopia. The field trial was conducted at two sites in Ethiopia using a square lattice design. The analysis of variance revealed significant variation (p < 0.05) among these accessions. The highest broad-sense heritability (H2) was recorded for days to 10% flowering (DTF10; 85.4%), whereas number of capitula per plant (NCPP) and number of seeds per capitulum (NSPC) showed medium heritability (H2 = 38.5% and 31.6%, respectively). NCPP and NSPC showed a highly significant (p < 0.01) positive and negative genotypic correlation with days to flowering, respectively. These three traits showed very low genotypic coefficient of variation (<1%). In the case of qualitative traits, small capitulum, large flower, green leaf, green stem and course leaf margin showed significant association with higher number of seeds per plant (NSPP). Euclidean distance-based cluster analysis revealed that the clustering pattern of the accessions poorly correlates with the geographic distance between sample collecting sites. Similarly, no clear clustering pattern of accessions was revealed by principal component analysis (PCA) that explained 66.3% and 53.6% of the total variation of quantitative traits and qualitative traits, respectively. The oil content of these accessions was previously investigated and accessions with high oil content show large differences in terms of days to flowering, NSPP and thousand seed weight (TSW). Among the accessions included in this research, Hr_B21; Gj_C17, Sh_I4 and Gr_F15 Gj_G18 and Tg-R13 are top ranking, as they have at least one the following highly desirable traits: early maturity, high oil content, NSPP and TSW. Hence, crossbreeding of their selected genotypes would lead to the development of new cultivars that combine early maturity and both high seed and oil yields.

1. Introduction

Ethiopia is well known as a center of diversity for several crops, including noug (Guizotia abyssinica (L.f.) Cass), teff (Eragrostis tef (Zucc.) Trotter), enset (Ensete ventricosum (Welw.) Cheesman), Ethiopian mustard (Brassica carinata A. Braun), sorghum (Sorghum bicolor (L.) Moench.), durum wheat (Triticum durum Desf.) and barley (Hordeum vulgare L.), among others. Noug is an annual diploid (2n = 2x = 30) [1] oilseed crop exhibiting homomorphic type of sporophytic self-incompatibility [2,3]. It is the only cultivated species in the genus Guizotia that belongs to the subtribe Milleriinae of the tribe Heliantheae in the family Compositae [3,4]. In Africa, it is mainly cultivated in Ethiopia but it is also grown to some extent in countries such as Sudan, Uganda, Tanzania, Malawi and Zimbabwe [5,6]. In Asia, it is a minor oilseed crop mainly cultivated in India and to some extent in Nepal, Bangladesh and Bhutan. Other countries where it is grown as minor crop are the West Indies in the Caribbean and USA [5]. It can grow up to a height of 1.4 to 2 m although short types (about 35 cm) are also known [6]. The number of branches per plant show large variation and is usually low when the environmental conditions are unfavorable and plant density is high.
Based on the time it takes to reach maturity, noug grown in Ethiopia is classified into three groups: abat, mesno and bunegne. Abat is a late-maturing type, which is planted in June and harvested in December; mesno is a type suitable for cultivation in waterlogged soils from late September to January; and bunegne is an early-maturing type suitable for cultivation in lowland areas from July to October [7]. Generally, the crop flowers within 50 to 100 days and matures within about 120 to 180 days after sowing and produces up to 40 capitula per plant [8,9].
Noug is among major sources of edible oil in Ethiopia, mainly produced by smallholders. It accounts for about 30% of the countries oilseed production and 26% of the produce is retained for home consumption [10]. Traditionally, noug seed oil is extracted for home consumption from slightly roasted seeds by grinding with a pestle and mortar, adding hot water and stirring it until the oil floats to the surface, which is followed by scooping the oil off. The press-cake after oil extraction is an excellent poultry and livestock feed as it contains 33 to 37% protein and is rich in inorganic constituents and crude fibers [6]. In non-food sectors, noug oil can be used for illumination, anointing, painting and cleaning machineries as well as for pharmaceutical purposes and making soaps [9].
Noug is grown across different regions in Ethiopia although more than 90% of its production is concentrated in the highlands of Amhara and Oromia regions. Wollega and Shewa are the major noug-producing area in the Oromia region whereas Gojjam and Gondar are the top noug producing areas in the Amhara region [9,11]. According to a CSA [12] report, there was 3.3% increase in area of noug production and 6.9% increase in total production from 2016/2017 to 2017/2018 with an average yield of 1.1 t ha−1. In the year 2018/2019, its yield increased form 1.1 t ha−1 to 1.49 t ha−1 with a 3.2% increase in yield [12]. The crop has high genetic diversity, particularly in Ethiopia [13], where it has been domesticated [14]. Geleta [15] and Geleta et al.[16] reported the genetic diversity of 70 Ethiopian noug collections using random amplified polymorphic DNA (RAPD) and amplified fragment length polymorphism (AFLP) markers and revealed the presence of higher genetic diversity within populations than among populations, which suggests wide genetic basis for noug improvement. However, its seed yield remains low, with national average productivity of about 1.1 t ha−1, [12] with only a slight increase in 2018/2019 cropping season [12] despite breeding efforts to increase seed yield. Major factors contributing to low seed yield include low response to inputs, seed shattering due to indeterminate growth habit, lodging, bird damage, parasitic weeds such as dodder (Cuscuta campestris), insect pests and diseases [9,17]. In India, noug serves as source of edible oil and contributes about 3% of oilseed production [18]. In the United States and Europe, noug seed is used for feeding birds, especially finches [6,19].
Germplasm collected from diverse environments are often heterogeneous and usually exhibit considerable genetic variation for desirable traits. Heritable variation may be controlled by few major genes (e.g., flower size and stem color,) or multiple additive genes (e.g., number of flowers per plant and plant height) although the intensity of the gene expression vary with environments [20,21]. Trait characteristics in plant genotypes develop as a result of gene expression and its interaction with environments during growth and development. Hence, understanding the variation and heritability of desirable agro-morphological traits is essential for crop improvement through utilization of existing genetic resources. The objectives of the present study were therefore to characterize Ethiopian noug accessions based on their agro-morphological traits and assess their genetic variation as well as to identify traits that associates with seed yield and accessions that have a high yield potential for further improvement.

2. Materials and Methods

2.1. Plant Material

Sixty-four noug landrace accessions collected from its major growing areas across different agro-ecological zones in Ethiopia were initially included in this study. However, four accessions failed during the field trial and hence 60 accessions were used for data analysis (Supplementary Materials Table S1).

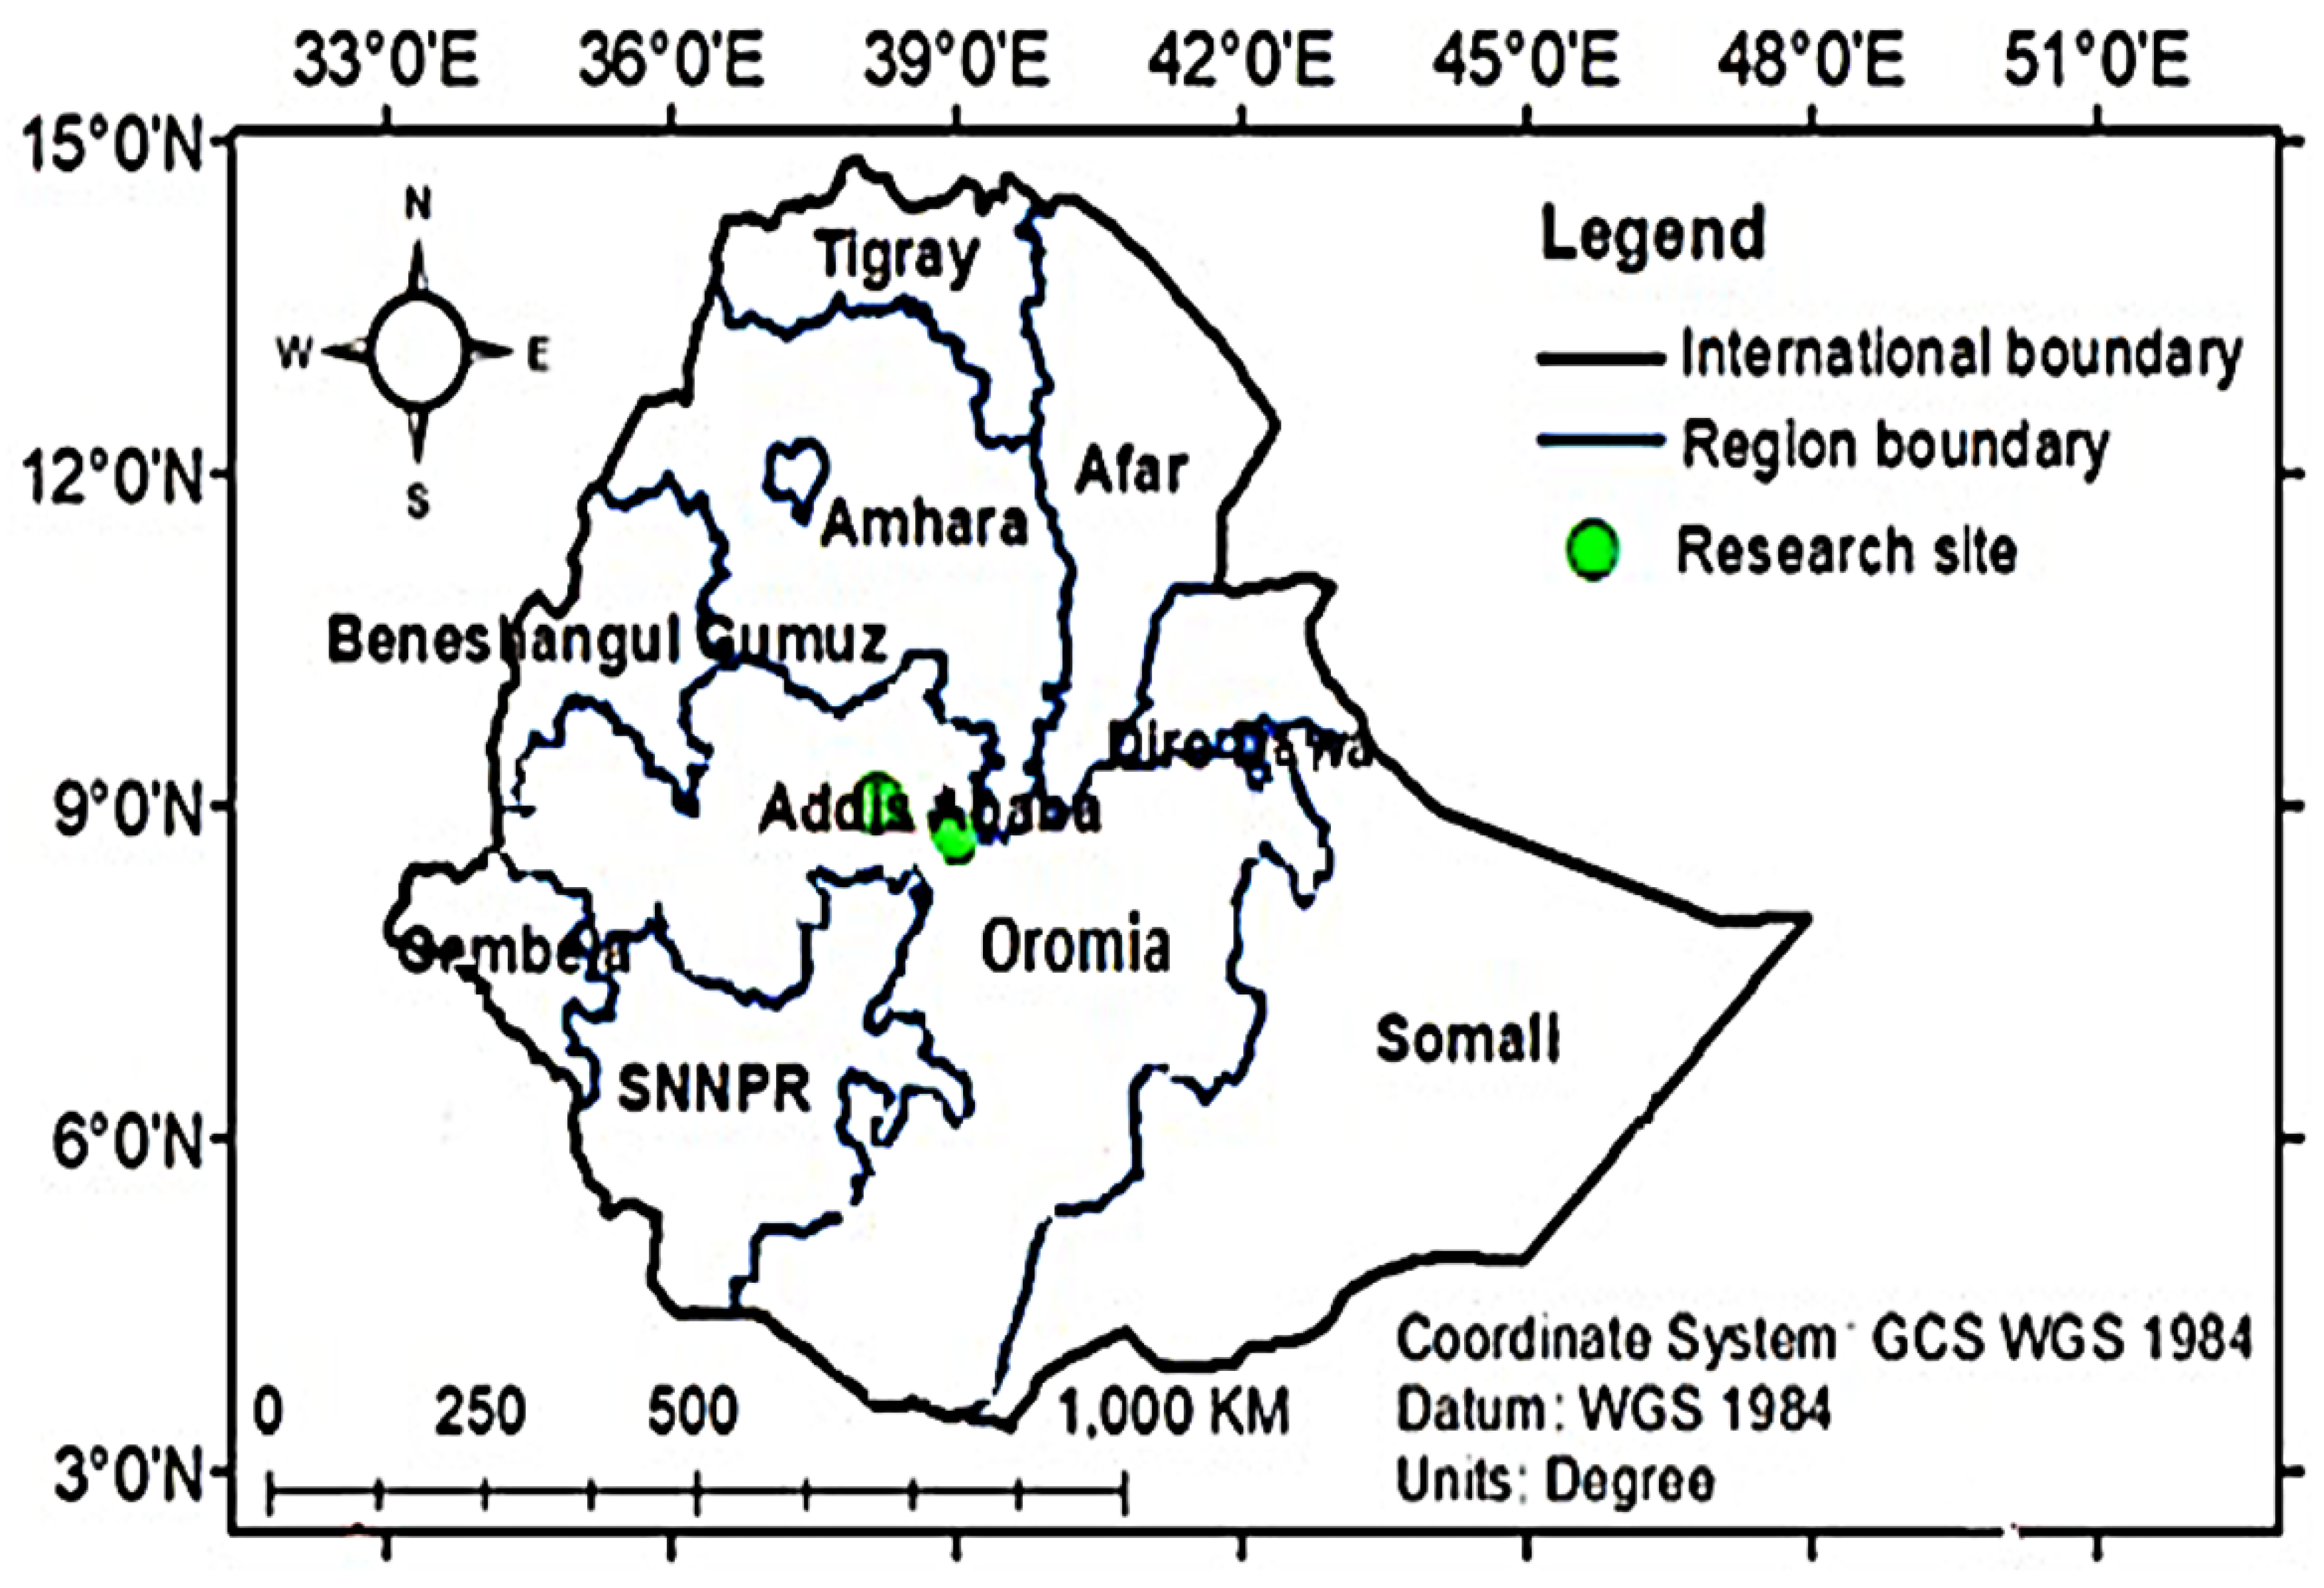
2.2. Experimental Sites and Design

The experiment was carried out at two experimental sites: (1) Holeta Agricultural Research Center, which is located 30 km west of Addis Ababa, 2400 m above sea level (masl), 9o00′ N and 38o30′ E having a soil type of nitosols and vertisols; and (2) Debre Zeit Agricultural Research Center, which is located 47 km southeast of Addis Ababa, 1900 masl, 08°44′ N and 38°58′ E having a soil type of vertisols (Figure 1). Holeta receives an average of 1144 mm annual rainfall with 6 °C and 22 °C minimum and maximum temperature, respectively, whereas Debre Zeit receives an average of 851 mm annual rainfall with 9 °C and 28 °C minimum and maximum temperature, respectively.
The field trial was conducted from June to December in two replications at each site using a lattice square experimental design (8 blocks × 8 plots). The size of each plot was 9 m2 (3 × 3 m). In each plot, seeds were planted in 10 rows and the spacing between plants within a row was 10 cm, whereas the spacing between rows was 30 cm. The distance between plots within a replicate was 1 m, whereas the distance between the two replicates in each site was 5 m. The accessions were randomly assigned to plots within a replicate and randomization was done for each replicate separately.

2.3. Recording Phenotypic Data

Data were recorded for each trait based on standard noug morphological descriptors [9,22]. The traits include 10 quantitative traits; namely, days to 10% flowering (DTF10), days to 50% flowering (DTF50), days to 90% flowering (DTF90), number of nodes per plant (NNPP), number of capitula per plant (NCPP), number of primary branches (NPB), plant height (PH), leaf length (LL), leaf width (LW) and number of seeds per capitula (NSPC) as well as six qualitative traits; flower size (FS), capitulum size (CS), leaf color (LC), leaf margin (LM), stem color (SC) and stem hairiness (SH) (Table 1). The data for DTF10, DFF50 and DTF90 were collected at a plot level whereas data for the other traits were collected from 50 plants in each plot (five randomly selected plants from each of the 10 rows).

2.4. Data Analysis

Quantitative trait data were subjected to analysis of variance (ANOVA) using the GenStat 16th edition statistical package (https://www.vsni.co.uk/software/genstat/ accessed on 24 July 2021). Broad-sense heritability (H2), cluster analysis and genetic correlations were computed by META-R version 6.0. The association between two environments each having two replications and accessions were analyzed using Tukey method at 95% confidence level and the six qualitative traits using Chi-square (χ2) test and Kruskal-Wallis test. The pattern of variation among accessions were examined by principal component analysis (PCA) using MINITAB v18.

2.5. Estimation of Variance Components

The genotypic and phenotypic variances for quantitative traits were estimated as phenotypic and genotypic coefficients of variation (PCV and GCV, respectively hereafter) expressed as percentage of the corresponding phenotypic and genotypic standard deviations. The PCV and GCV values were ranked as low (0–10%), medium (10–20%) and high (>20%) as suggested by Sivasubramanian and Madhavamenon [23]. The variance components were estimated as follows:
Genotypic variance (σ2G) = (MSG − MSe)/r
Environmental variance (σ2e) = MSe/r
Phenotypic variance (σ2p) = σ2G + σ2e
where MSG is the mean sum of square of genotype; MSe is mean sum of square of the error and r is number of replications. The coefficients of variation were calculated according to the below equations:
Phenotypic   coefficient   of   variation   PCV = σ   2 p   x   × 100 Genotypic   coefficient   of   variation     GCV = σ 2 g   x   × 100
where: σp = phenotypic standard deviation, σg = genotypic standard deviation, x = grand mean for character under study.

2.6. Broad-Sense Heritability (H2) and Genetic Correlations as Computed by META-R

The broad-sense heritability (H2) of a trait is the percentage of genotypic to phenotypic variance at an individual environment and was categorized as low (<30%), moderate (30–60%) and high (>60%) as described by Robinson et al. [24]. The H2 was calculated for quantitative traits according to Alvarado et al. [25] as:
H 2 = σ 2 g / ( σ 2 g + σ 2 ε / nRep )
where σ2g and σ2ε are the genotype and error variance components, respectively, and nRep is the number of replicates.
When there is a combined genotype by environment (G × E) interaction, broad-sense heritability was estimated for quantitative traits as:
H 2 = σ 2 g σ 2 g + σ 2 g ε / nLoc + σ 2 ε / ( nLoc   ×   nRep )
where the new term σ2gε is the G × E interaction variance component and nLoc is the number of environments in the analysis.

3. Results

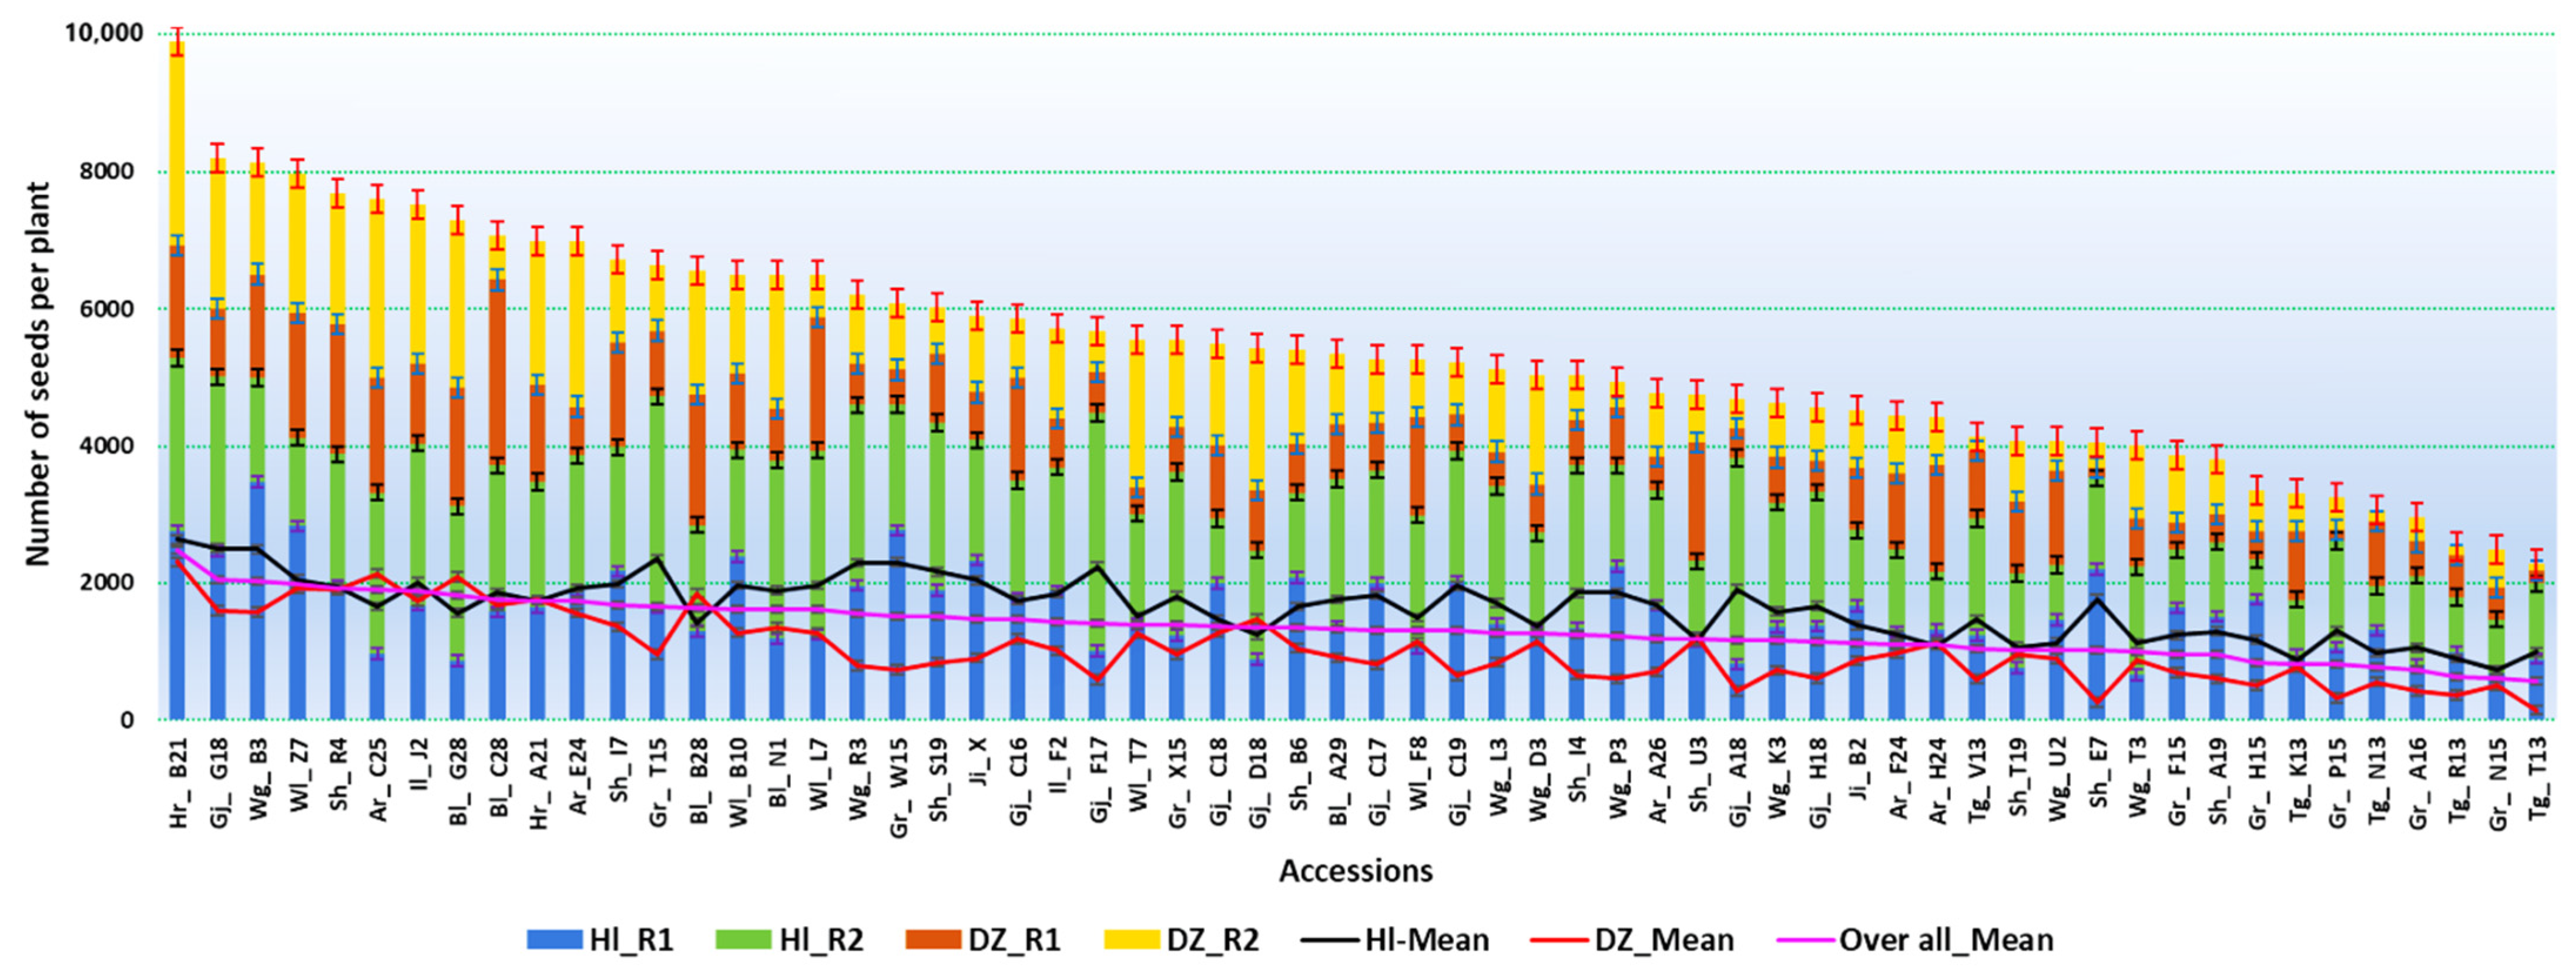
3.1. Analysis of Variance and Mean Performance of the Accessions

The analysis of variance (ANOVA) revealed highly significant differences (p ≤ 0.01) among the accessions for most quantitative traits (Table 2). A wide variability was observed for DTF10, DTF50, DTF90, PH, NCPP and NSPC. DTF10 ranged from 60 to 102 days with a mean value of 77 days, DTF50 ranged from 63 to 107 days with a mean value of 81 days and DTF90 ranged from 65 to 109 days with a mean value of 84 days. The PH ranged from 29.6 to 144.7 cm, NCPP ranged from 10.8 to 87.1 and NSPC ranged from 39.4 to 96.9 with mean values of 87.15 cm, 94.2 cm and 64.5 cm, respectively. The number of seeds per plant ranged from 101 to 3481 (Figure 2) and NPB ranged from 5 to 17 with a mean value of 10.8 (Table 3).
Chi-square test-based associations between the two environments each having two replications and the 60 accessions for desirable characters of the six qualitative traits are given in Table 3. The grouping of the 60 accessions, as revealed using Tukey method at 95% confidence level for the desirable qualitative characters is provided in Table S2. These accessions formed 5, 9, 14, 7 and 9 groups based on the desirable characters that showed significant positive correlation with number of seeds per plant (NSPP; a seed yield related trait) in five of the six qualitative traits, i.e., large flower size, green leaf, green stem, small capitula and course leaf margins. The percentage of large flowers (FS-5) varied from 7% (accession Sh_I7) to 73% (accession Tg_R13), green leaf (LC-3) from 53% (accession Tg_T13) to 99% (accession Wl_F8), green stem (SC-1) from 12% (accession Tg_K13) to 65% (accession Ar_H24), small capitula (CS-1) from 0 (accessions Gr_H15, Tg_K13, Tg_R13, Tg_T13 and Tg_V13) to 79% (accession Sh_E7) and course leaf margins (LM-5) from 2% (accession Sh_E7) to 74% (accession Gj_C17) (Table 3 and Table S2).

3.2. Genotypic and Phenotypic Correlation

The genotypic and phenotypic correlations analyzed based on data from the 60 accessions between all pairs of quantitative traits are provided in Table 4. The traits; DTF10, DTF50, DTF90 and NNPP showed highly significant positive genotypic and phenotypic correlation between them. NCPP showed highly significant negative genotypic correlation with all quantitative traits except with number of primary branches (NPB) and leaf width (LW), which were highly significant positive phenotypic correlation. Interestingly, NSPC showed low but significant positive phenotypic correlation with NCPP.

3.3. Estimation of Variance Components and Broad-Sense Heritability

As suggested by Sivasubramanian and Madhavamenon [23], medium (10–20%) genotypic coefficient of variation (GCV) was recorded only for LW (12.35%) whereas other 9 quantitative traits had low (<10%) GCV values. The lowest GCV values were recorded for NCPP (0.45%) followed by NSPC (0.53%), DTF50 (0.55%), DTF90 (0.56%) and DTF10 (0.69%) respectively. On the other hand, high (>20%) phenotypic coefficient of variation (PCV) values were recorded for LW (36.74%) and LL (21.74%), whereas other traits had low PCV, in which the lowest PCV was recorded for DTF90 (0.63%) (Table 5).
Broad-sense heritability (H2) estimates of the quantitative traits are given in Table 5. According to Robinson et al. [24] and Alvarado et al. [25] classification of broad-sense heritability, low heritability (<30%) was recorded for PH (28.45%), LL (16.59%) and LW (11.31%); medium heritability (30–60%) was recorded for NPB (38.05%), NCPP (38.54%) and NSPC (31.62%) and high heritability (>60%) was recorded for DTF10 (85.38%), DTF50 (71.94%), DTF90 (77.14%) and NNPP (78.71%) (Table 5).

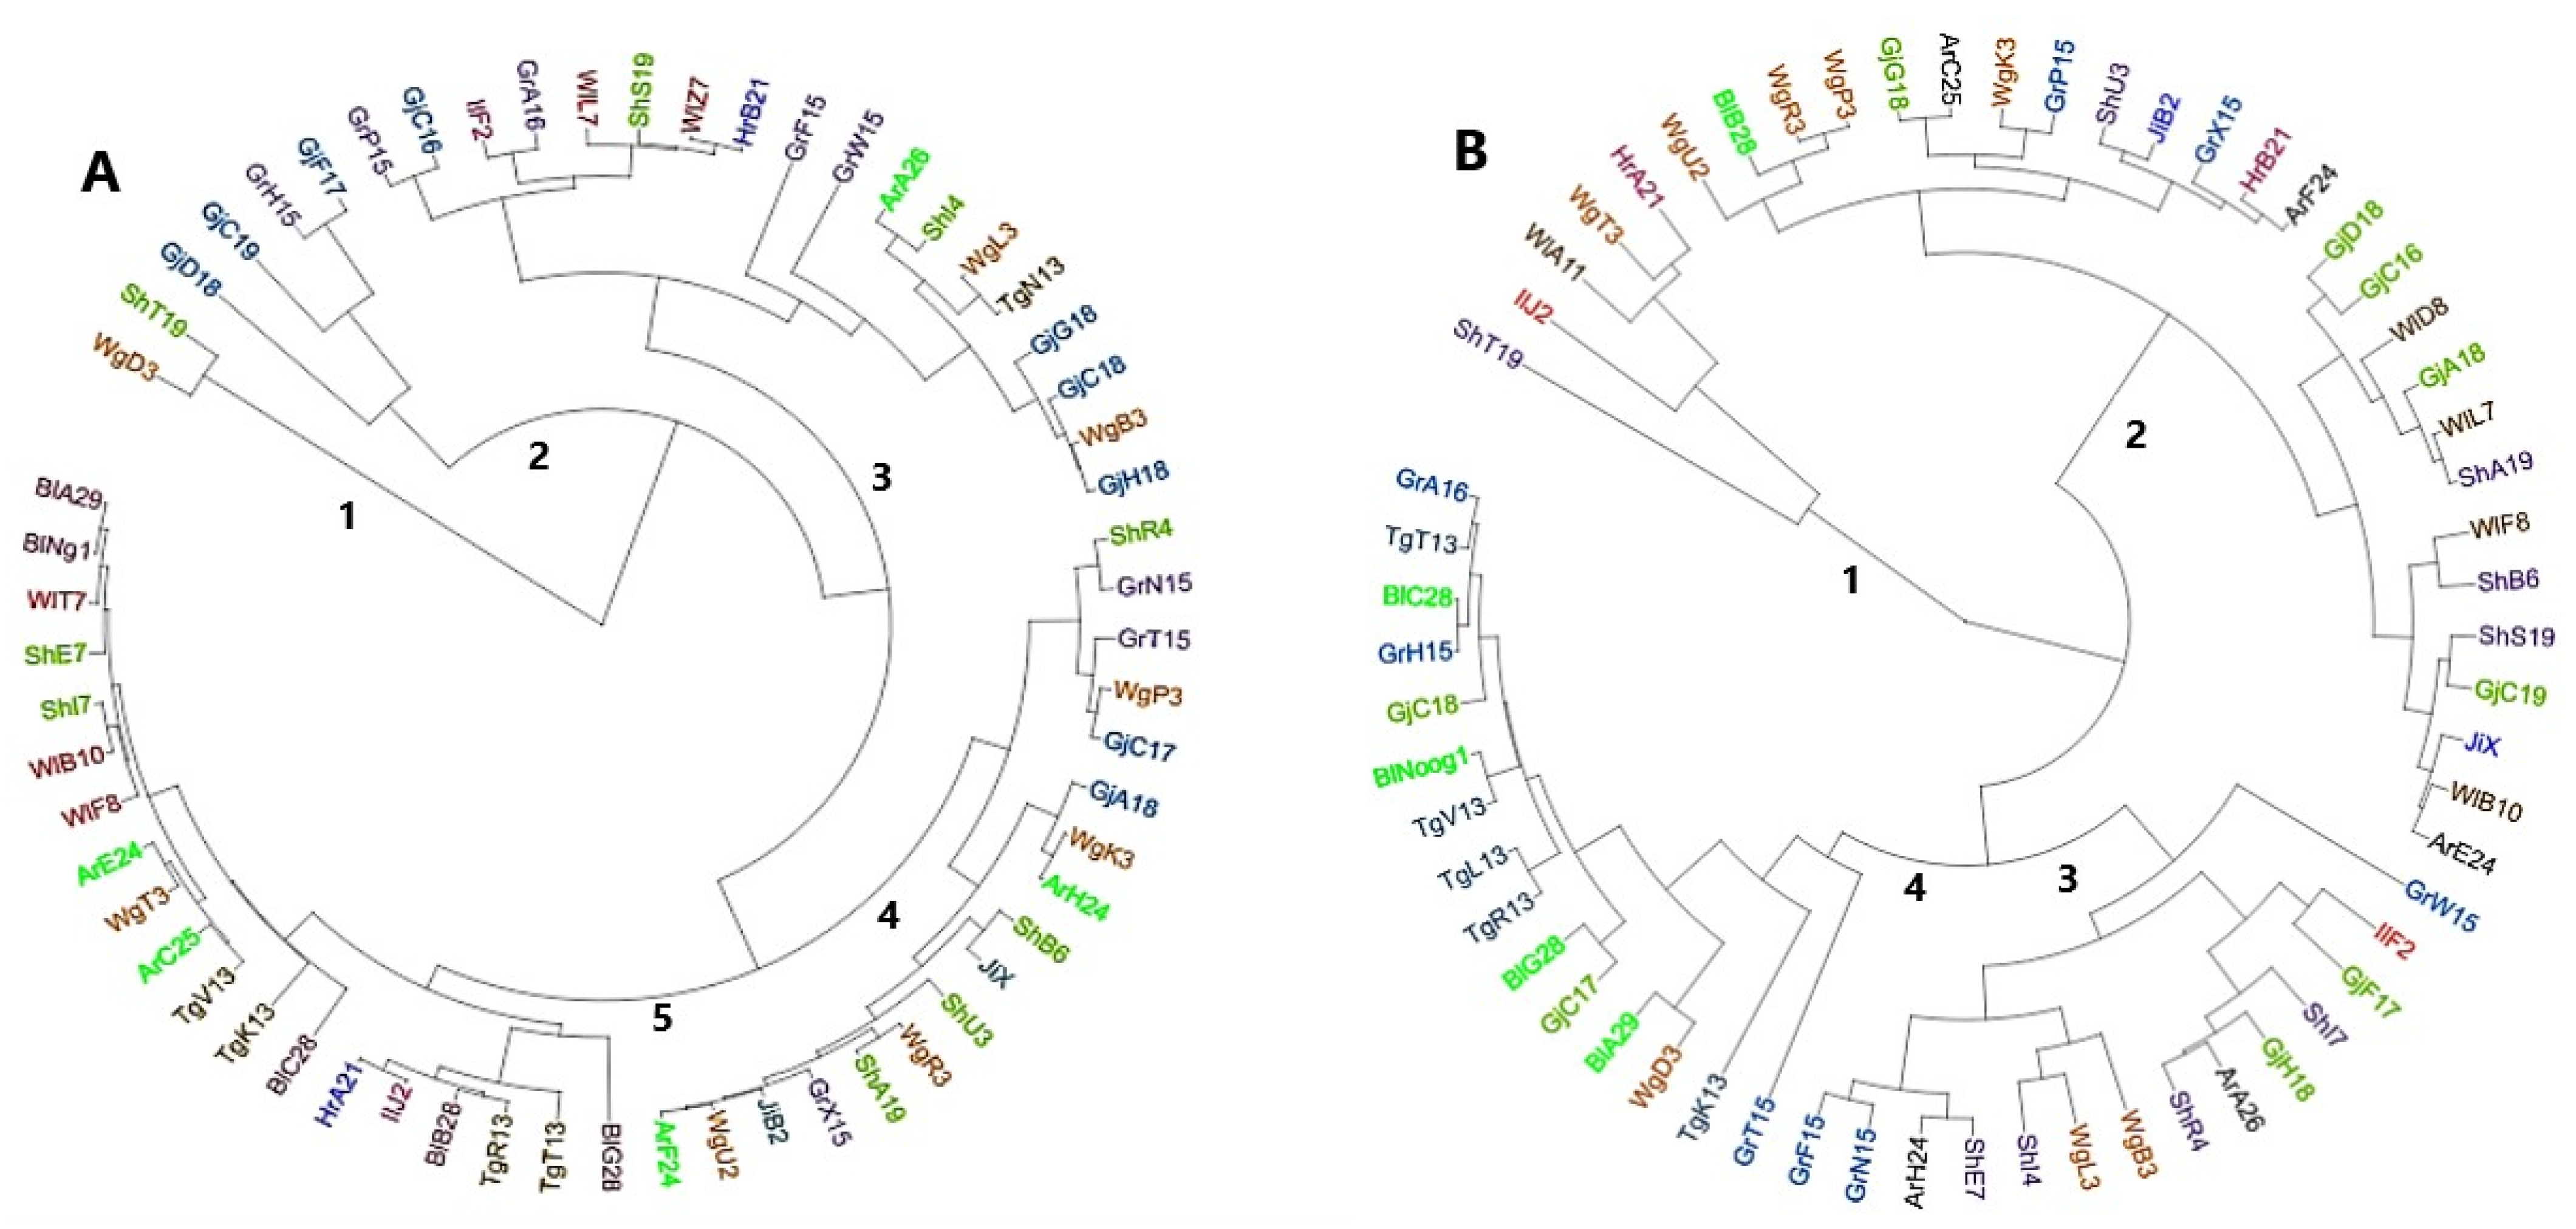
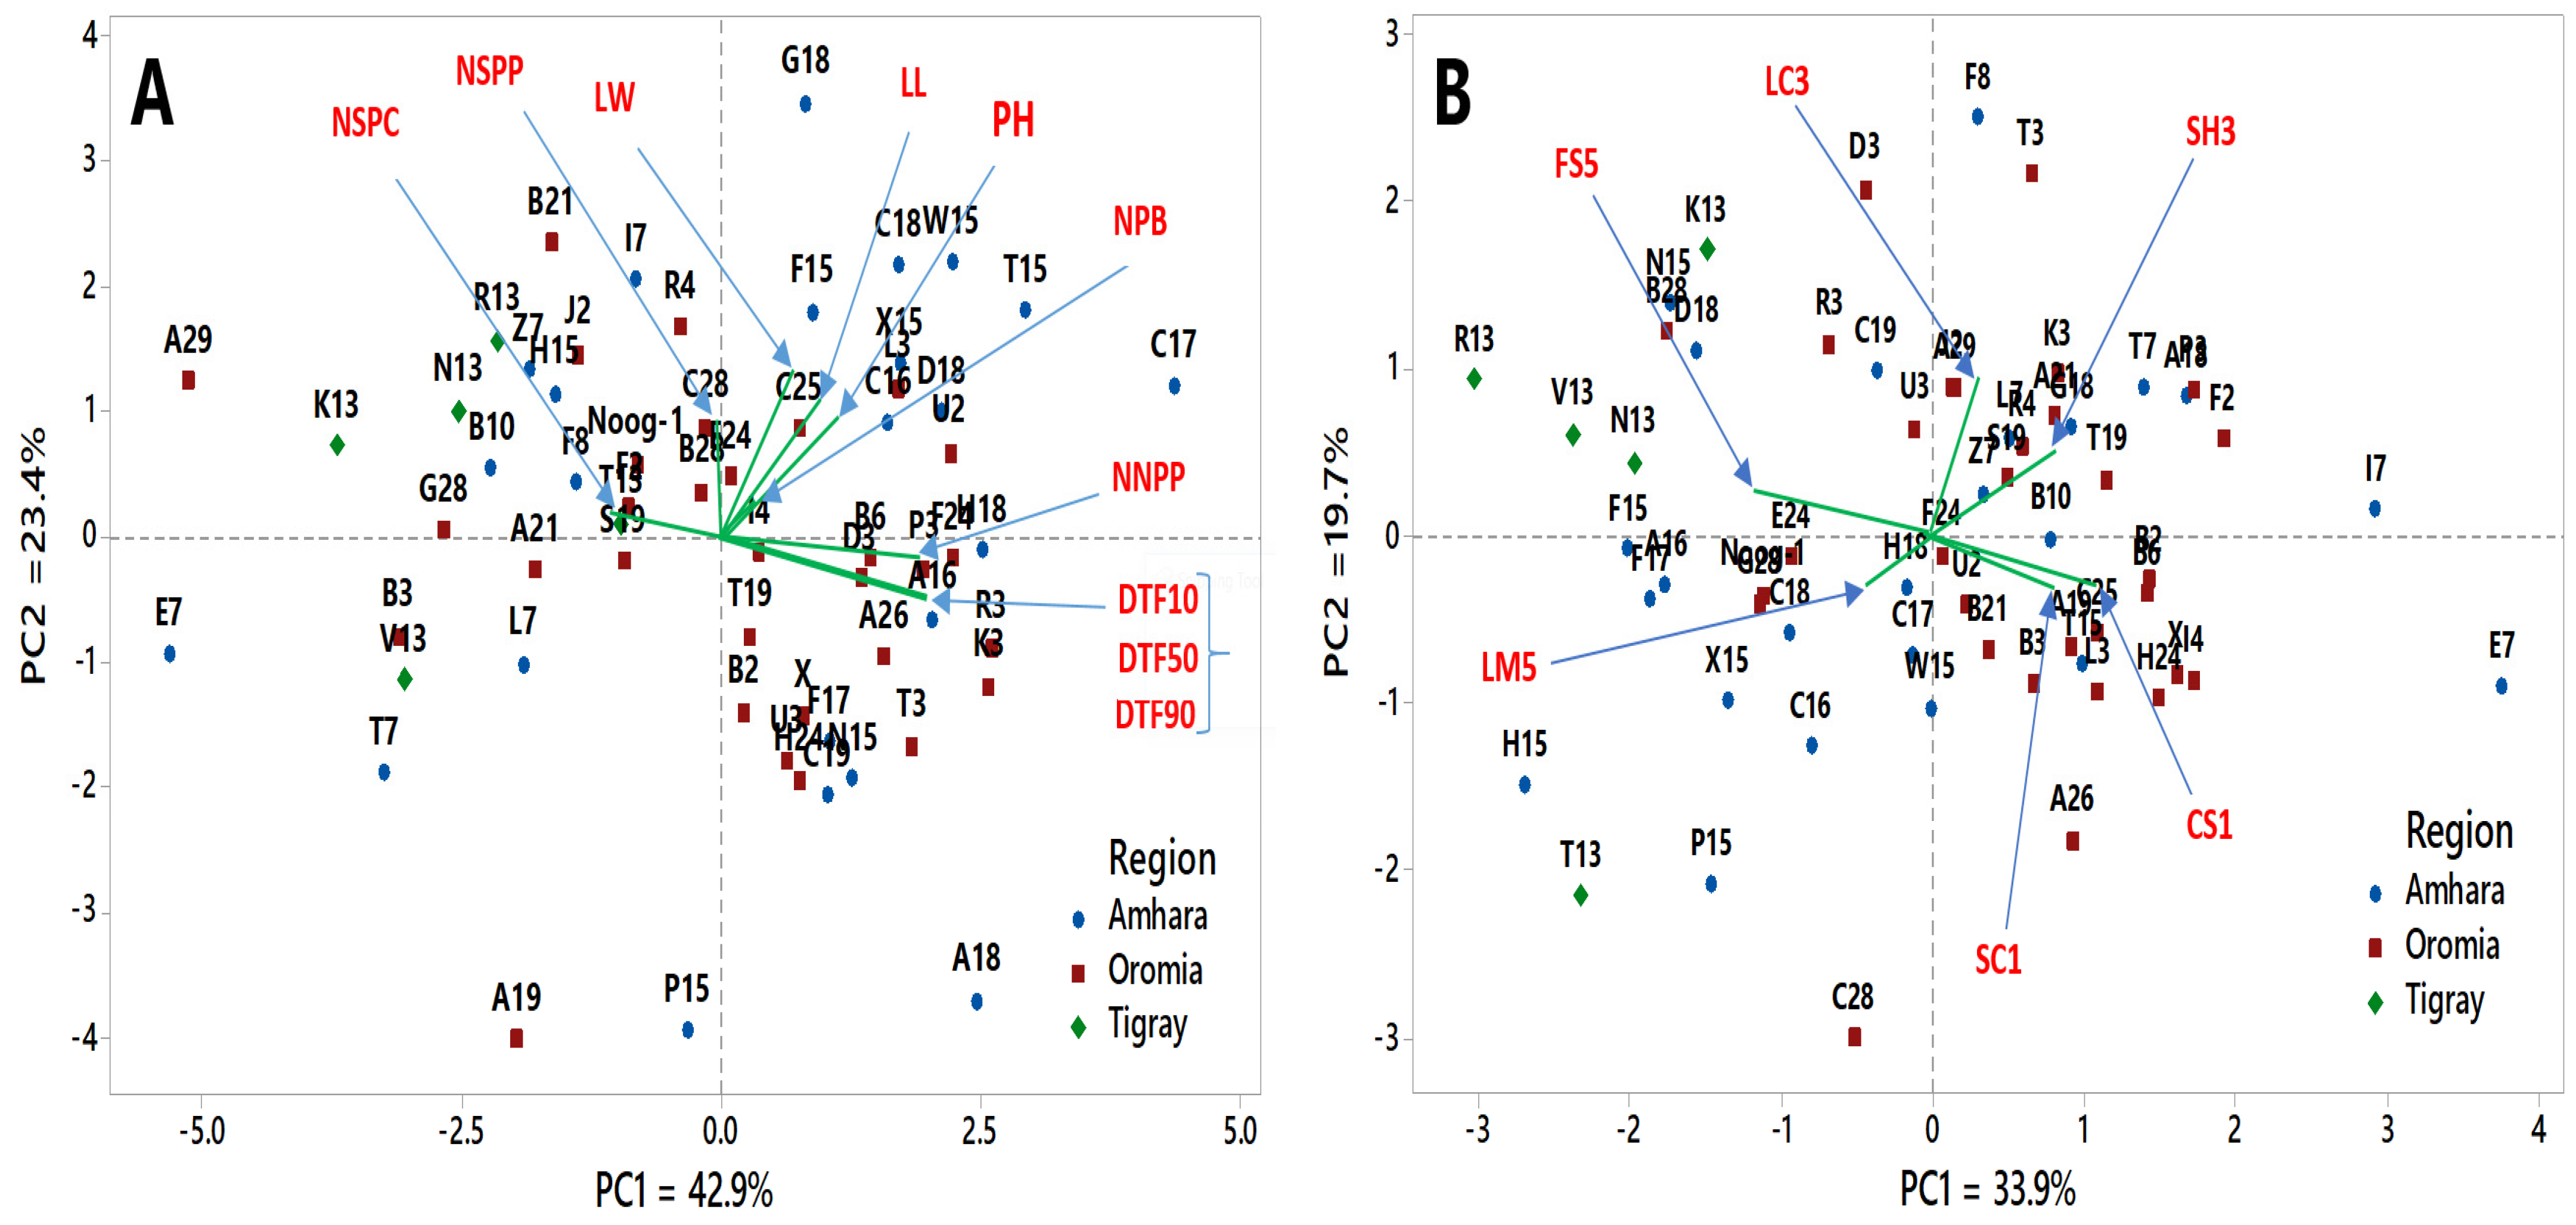
3.4. Cluster Analysis and Principal Component Analysis

Euclidian distance matrices between pairs of the 60 accessions were generated for quantitative and qualitative traits separately. The two distance matrices were used for UPGMA based hierarchical cluster analysis (Figure 3). The cluster analysis grouped the 60 noug accessions into five distinct clusters; three major clusters (3,4,5) and two minor cluster (1,2) for quantitative traits (Figure 3A) and four distinct clusters; three major clusters (2,3,4) and one minor cluster (1) for qualitative traits (Figure 3B). Principal component (PC) biplots of quantitative and qualitative traits were generated for the first two PCs (Figure 4). The first two PCs, which contributed to 66.3% of the variation among the quantitative traits (Figure 4A) and 53.6% of the variation among the qualitative traits (Figure 4B) tested, were the most significant PCs that explained majority of the variations among traits.

4. Discussion

Analysis of qualitative and quantitative agro-morphological traits is very important for efficient representation of crops’ genetic diversity in its ex-situ conserved gene pools as well as for identification of suitable germplasm for use in plant breeding programs. Quantitative traits are controlled by many genes –often with minor effects– and highly influenced by environmental factors. The effects of environmental factors on crop phenotypes are estimated by the magnitude of the differences between the genotypic and phenotypic coefficients of variation; small differences reflect a large genotypic effect, whereas large differences suggest a high environmental influence [26,27]. In the present study, the analysis of variance revealed significant differences among the accessions for most of the traits studied. Panda and Sial [28] also reported a wide range of variation for most of the traits they investigated in noug grown in India.
The observed phenotypic variability among the tested noug accessions suggests the potential of the crop for genetic improvement through selection and crossbreeding of superior genotypes. The genotypic coefficient of variation (GCV) and phenotypic coefficient of variation (PCV) analysis help to group the phenotypic variability into heritable and non-heritable components depending on the level of differences between the two parameters and hence is useful for the identification of superior genotypes for crossbreeding. As suggested by Sivasubramanian and Madhavamenon [23], moderate GCV was recorded only for LW (12.35%) whereas other traits had low (<10%) GCV. On the other hand, high (>20%) PCV was recorded for LW (36.74%) and LL (21.74%) whereas the lowest PCV was recorded for DTF90 (0.63%). The result of the present study is in agreement with the results reported in Amsalu [29] where low PCV and GCV values were recorded for days to flowering, days to maturity, plant height, seed yield and thousand seed weight (TSW); and partly in agreement with Bhoite et al. [30], who found low PCV and GCV values for DTF50 and PH and high PCV and GCV values for NPB, NCPP and NSPC. Low PCV and GCV values were also obtained for DTF50 and days to maturity by Ahmad et al. [31] and Tiwari et al. [32] in agreement with the present results.
Heritability values are very important in predicting the expected progress to be attained through the process of selection. The GCV accompanied by heritability estimates provides an estimate of the amount of genetic advance to be expected through phenotypic selection [33]. Among the 10 quantitative traits included in this study, the highest broad-sense heritability (>60%) was recorded for DTF10 (85.38%) followed by NNPP (78.71%) and the lowest heritability (<30%) was recorded for LW (11.31%) and LL (16.59%) as per Robinson et al. [24] and Alvarado et al. [25] classification of broad-sense heritability.
As results of the present study indicates, LL and LW showed high phenotypic variance and low heritability indicate the environmental effect on their expression is high and hence are not suitable for selecting germplasm of interest. Whereas, low PCV and GCV values and high heritability for many of the traits such as days to flowering and NNPP indicate low influence of the environment on the variation of these traits than the other traits. Early maturing accessions are preferred in areas having frequent drought due to inadequate rainfall. In the present study about 21.7% of the noug accessions matured earlier than 88 days. For example, Ar_C24 and Ar_E24 (40% of the accessions from Arsi); Bl_A29, Bl_B28, Bl_C28, Bl_G28 and Bl_Noog1 (all accessions from Bale); Gj_C18, Gj_D18, Gj_F17 and Gj_G18 (44% of the accessions from Gojjam); Gn_F15, Gn_H15, Gn_P15 and Gn_W15 (50% of the accessions from Gondar); Sh_A19, Sh_B6, Sh_E7, Sh_I4 and Sh_T19 (55% of accessions from Shewa) and Wg_B3 and Wg_L3 (25% of the accessions from Wolega) were early maturing but showing high seed yield. Hence, these accessions are preferred in areas where the rainy season is relatively short. It is therefore very important to consider days to flowering together with NCPP and NSPC in noug breeding programs as days to flowering is related to earliness, a very important trait in the tropics where there is short seasonal rainfall and NCPP and NSPC are related to oil yield in noug. Number of seeds per plant (a seed yield trait) is a product of NCPP and NSPC and hence these traits directly contribute to seed yield, which in turn linked to oil yield.
As yield and quality are complex multigenic traits, knowledge of the extent of the genotypic and phenotypic correlation between traits is useful in the identification of most important plant characteristics contributing to desirable traits. The existence of strong positive phenotypic and genotypic correlation between different traits is useful for indirect selection of complex traits such as seed yield and oil content in noug. Highly heritable traits that have higher genetic correlation with seed yield and oil content could be used for selecting desirable genotypes for use in noug breeding program. The broad sense heritability of DTF10, DTF50, DTF90 and NNPP were 85.38%, 71.94%, 77.14% and 78.71%, respectively and hence they are highly heritable. Research conducted by Weyessa [7] and Tiwari et al. [32] also showed high heritability for days to flowering., which is highly important trait in tropical regions where drought is a problem. The ultimate goal of noug breeding as an oilseed crop is to attain increased seed and oil yields per unit area. DTF10, DTF50, DTF90 and NNPP showed highly significant negative phenotypic and genotypic correlations with number of seeds per capitulum, which is a seed yield related trait. This suggests that early maturing types produce more seeds per capitulum in average as compared to late maturing types. Hence, selecting such plants having larger number of capitula per plant is an interesting approach to increase seed and oil yield in noug.
In the principal component analysis, the first two principal components (PCs) explained 66.3% of the total variation in the case of the quantitative traits (Figure 4A) and 53.6% in the case of the qualitative traits (Figure 4B). These values are lower than those reported in Pulate et al. [34] in similar study in noug where the first two PCs explained 94% of the total variation for quantitative and 60.8% of the total variation for qualitative traits, respectively. Our analysis showed the absence of clear grouping pattern of the accessions for both quantitative and qualitative data, as the accessions were spread along both PC axes. However, it was clear that the accessions in the far right and far left were separated along PC1 axis, which was highly influenced by days to flowering, number of nods per plants and number of seeds per capitulum as depicted by the loadings of the traits. For example, the cluster of nine accessions (A16, A26, B6, D3, F24, H18, K3, R3 and P3; see Table S1 for full accession codes) were formed mainly due to their late maturing character and higher number of nodes per plant although they were from distant areas in Amhara and Oromia regions.
The five accessions from Tigray can be generally regarded as early maturing and are top ranking in number of seeds per capitulum; and hence can serve as sources of alleles for these characteristics in crossbreeding. As depicted in Figure 4A, days to maturity does not have strong influence on NSPC and NCPP (yield component traits) and hence it is possible to develop high yielding early maturing noug cultivars. Accession Hr_B21 (shown as B21 in Figure 4) from West Harerge, Oromia region is an excellent example for this as it is an early maturing type, which came on top in terms of average number of seeds per plant (Table S1). Interestingly, this accession had above average thousand seed weight (TSW) (4.2 gm; the average being 3.6 gm) although it had slightly lower than average oil content (35%; the average being 38%) (Table S1). The results clearly show that there is no strong trade-off between NSPP and seed weight. Seed size (weight) is a highly heritable trait in noug. Hence, noug breeding based on NSPP and seed weight can lead to improved seed yield. In the case of qualitative traits, PC1 of PCA explained 33.9% of the total variation mainly due to the influence of higher proportion of CS1, SC1, FS5 and LM5, but flower size and capitulum size were the most important in separating genotypes along the PC1 axis. Similar to the case of quantitative traits, accessions from Tigray showed similarity in having higher proportion of large flower size (FS5) whereas accessions from Amhara and Oromia showed wider variation. However, the number of seeds per plant for Tigray accessions is intermediate compared to the other accessions (Table S1).
The 60 noug accessions were grouped into five clusters based on quantitative (Figure 3A) and four clusters based on qualitative (Figure 3B) traits. However, the clustering pattern did not follow the geographic proximity of the collection sites of the accessions except in few cases where smaller groups were formed within a cluster. The clustering pattern based on quantitative traits was somewhat different from that of qualitative traits suggesting a poor correlation between the two groups of traits. Such difference in clustering pattern of different Guizotia species and populations was also observed in molecular markers based studies (Random amplified polymorphic DNA vs Amplified Fragment Length Polymorphism) [15,35]. A recent study using transcriptome based SNP markers revealed a weak population structure in noug grown in Ethiopia due to population admixture, which is mainly a result of strong gene flow between populations via pollen and a gradual nation-wide germplasm exchange [36]. The poor clustering pattern of the accessions in terms of geographic proximity in the present study also suggest strong gene flow between populations throughout the country.
Among the sixty accessions used in this study, Gj_C17, Sh_I4 and Gr_F15 are top ranking in oil content with 54%, 52% and 51%, respectively (Table S1; [37]). The codes used for these accessions in Geleta et al. [37] were Gj-2, Sh-2 and Gr-1, respectively. Gj_C17 is late maturing whereas the other two have intermediate maturity (Table S1). However, they had slightly lower than average number of seeds per plant (Table S1). Other interesting accessions are Gj_G18 (from Amhara region) and Tg-R13 (from Tigray region). Gj_G18 is characterized by intermediate maturity (DTF90 = 83), above average oil content (42%), average TSW (3.9 gm) and high NSPP (2327 seeds). Whereas Tg-R13 is characterized by early maturity (DTF90 = 71), high oil content (49%), high TSW (4.7 gm) and low NSPP (965 seeds). Overall, the average oil content and NSPP of early, intermediate and late maturing groups did not show significant differences, thereby suggesting the absence of strong association between maturity time, oil content and seed yield in noug. Hence, crossbreeding of selected genotypes from these accessions should be seriously considered for improving noug in both seed and oil yield.

5. Conclusions

The present study revealed the presence of significant phenotypic and genotypic variation in Ethiopian noug gene pool as reflected based on both qualitative and quantitative traits. The lack of clear clustering pattern of the accessions with regard to their geographic proximity suggests strong gene flow between the landrace populations across a wide geographic region. The present study showed that days to flowering is a highly heritable trait whereas NCPP and NSPC are moderately heritable in noug. Since days to flowering (maturity) does not have strong influence on number of seeds per plant, it is possible to develop high yielding early maturing noug cultivars suitable for areas where there is a shortage of rainfall during plant growing season. Although there are significant positive and negative correlations between several traits included in the present study, there is no strong trade-off among the most important traits, such as earliness, seed yield and oil content. Hence, crossbreeding of selected genotypes with desirable traits from various landrace populations should be considered in noug breeding programs. During selection of genotypes, strong emphasis should be given for traits such as NCPP, NSPC, oil content and days to maturity for improvement of seed and oil yield through crossbreeding.

Supplementary Materials

The following are available online at https://0-www-mdpi-com.brum.beds.ac.uk/article/10.3390/agronomy11081479/s1. Table S1. List of 60 noug landrace accessions used in the present study that shows geographic description of their collecting locations in Ethiopia as well as information related to earliness, seed yield and oil content, Table S2. Grouping of the 60 accessions using Tukey method at 95% confidence level for desirable characters of the six qualitative traits. Accessions with mean frequency values of a character not sharing a letter (A–G) are significantly different in that character.

Author Contributions

Conceptualization, M.G. and R.O.; Methodology: M.G. and A.G.; Software: A.G. and M.G.; Data analysis: all coauthors; Writing—original draft: A.G.; Writing—review and editing: all coauthors; funding acquisition: R.O., M.G. and K.T.; Supervision: M.G., K.T., C.H. and R.O. All authors have read and agreed to the published version of the manuscript.

Funding

This study was supported by SIDA’s Research and Training grant AAU-SLU Biotech https://sida.aau.edu.et/index.php/biotechnology-phd-program/ (accessed on 24 July 2021) awarded to Addis Ababa University and the Swedish University of Agricultural Sciences.

Data Availability Statement

Data is contained within the article and supplementary Tables.

Acknowledgments

We would like to thank Holeta and Debrezeit Agricultural Research Centers for allowing us to conduct the field trial at their experimental field stations by providing all necessary field equipment without charge. We also acknowledge the grant provided by the Swedish International Development Cooperation Agency (Sida) to Addis Ababa University and the Swedish University of Agricultural Sciences, for the research and training of the first author of this article.

Conflicts of Interest

The authors declare no conflict of interest and the funders had no role in the design of the study; in the collection, analysis, or interpretation of data; in the writing of the manuscript, or in the decision to publish the results.

References

  1. Dagne, K. Meiosis in interspecific hybrids and genomic interrelationships in Guizotia Cass.(Compositae). Hereditas 1994, 121, 119–129. [Google Scholar] [CrossRef]
  2. Geleta, M.; Asfaw, Z.; Bekele, E.; Teshome, A. Edible oil crops and their integration with the major cereals in North Shewa and South Welo, Central Highlands of Ethiopia: An ethnobotanical perspective. Hereditas 2002, 137, 29–40. [Google Scholar] [CrossRef]
  3. Geleta, M.; Bryngelsson, T. Population genetics of self-incompatibility and developing self-compatible genotypes in niger (Guizotia abyssinica). Euphytica 2010, 176, 417–430. [Google Scholar] [CrossRef]
  4. Baagoe, J. The genus Guizotia (Compositae). A Taxonomic Revision. Bot. Tidsskr. 1974, 69, 1–39. [Google Scholar]
  5. Geleta, M.; Ortiz, R. The importance of Guizotia abyssinica (niger) for sustainable food security in Ethiopia. Genet. Resour. Crop Evol. 2013, 60, 1763–1770. [Google Scholar] [CrossRef]
  6. Seegeler, C.J.P. Oil Plants in Ethiopia: Their Taxonomy and Agricultural Significance; Center of Agricultural Publishing and Documentation: Wageningen, The Netherlands, 1983; pp. 122–146. [Google Scholar]
  7. Bulcha, W. Guizotia abyssinica (Lf) Cass. Record from PROTA4U; van der Vossen, H.A.M., Mkamilo, G.S., Eds.; PROTA (Plant Resources of Tropical Africa/Ressources végétales de l’Afrique tropicale): Wageningen, The Netherlands, 2007. [Google Scholar]
  8. Riley, K.; Belayneh, H. Niger Seed: Guizotia abyssinica Cass, in Oil Crops in the World: Their Breeding and Utilization; McGraw Hill Publishing Company: New York, NY, USA, 1989; pp. 394–403. [Google Scholar]
  9. Getinet, A.; Sharma, S. Niger, Guizotia abyssinica (Lf) Cass; Bioversity International: Rome, Italy, 1996; Volume 5. [Google Scholar]
  10. Oilseeds Research Strategy 2016–2023; Ethiopian Institute of Agricultural Research: Addis Ababa, Ethiopia, 2017.
  11. Petros, Y. Genetic Diversity and Oil Quality of Guizotia Cass (Asteraceae). Ph.D. Thesis, Swedish University of Agricultural Sciences, Uppsala, Sweden, 2008. [Google Scholar]
  12. CSA, R. The Federal Democratic Republic of Ethiopia Report on Area and Production of Major Crops, Addis Ababa, Ethiopia, 2016.
  13. Geleta, M.; Bryngelsson, T.; Bekele, E.; Dagne, K. Assessment of genetic diversity of Guizotia abyssinica (Lf) Cass (Asteraceae) from Ethiopia using amplified fragment length polymorphism. Plant Genet. Resour. 2008, 6, 41–51. [Google Scholar] [CrossRef]
  14. Dempewolf, H.; Tesfaye, M.; Teshome, A.; Bjorkman, A.; Andrew, R.; Scascitelli, M.; Black, S.; Bekele, E.; Engels, J.M.M.; Cronk, Q.; et al. Patterns of domestication in the Ethiopian oil-seed crop noug (Guizotia abyssinica). Evol. Appl. 2015, 8, 464–475. [Google Scholar] [CrossRef] [PubMed]
  15. Geleta, M. Genetic Diversity, Phylogenetics and Molecular Systematics of Guizotia Cass (Asteraceae). Ph.D. Thesis, Swedish University of Agricultural Sciences, Uppsala, Sweden, 2007. [Google Scholar]
  16. Geleta, M.; Bryngelsson, T.; Bekele, E.; Dagne, K. AFLP and RAPD analyses of genetic diversity of wild and/or weedy Guizotia (Asteraceae) from Ethiopia. Hereditas 2007, 144, 53–62. [Google Scholar] [CrossRef]
  17. Teklewold, A.; Wakjira, A. Seed filling and oil accumulation in noug [Guizotia abyssinica (LF) Cass.]. Sinet Ethiop. J. Sci. 2004, 27, 25–32. [Google Scholar]
  18. Adarsh, M.N.; Kumari, P.; Devi, S. A review of Guizotia abyssinica: A multipurpose plant with an economic prospective. J. Ind. Pollut. Control 2014, 30, 277–280. [Google Scholar]
  19. Kandel, H.J.; Porter, P.M.; Johnson, B.L.; Henson, R.A.; Hanson, B.K.; Weisberg, S.; LeGare, D.G. Plant population influences niger seed yield in the northern Great Plains. Crop Sci. 2004, 44, 190–197. [Google Scholar] [CrossRef]
  20. Hill, W.G. Understanding and using quantitative genetic variation. Philos. Trans. R. Soc. B Biol. Sci. 2010, 365, 73–85. [Google Scholar] [CrossRef] [Green Version]
  21. Xu, Y.; Boddupalli, P.; Zou, C.; Lu, Y.; Xie, C.; Zhang, X.; Prasanna, B.M.; Olsen, M.S. Enhancing genetic gain in the era of molecular breeding. J. Exp. Bot. 2017, 68, 2641–2666. [Google Scholar] [CrossRef]
  22. Genet, T.; Belete, K. Phenotypic diversity in the Ethiopian noug germplasm. Afr. Crop Sci. J. 2000, 8, 137–143. [Google Scholar] [CrossRef]
  23. Sivasubramanian, S.; Menon, M. Heterosis and inbreeding depression in rice. Madras Agric. J. 1973, 60, 1139–1140. [Google Scholar]
  24. Robinson, H.F.; Comstock, R.E.; Harvey, P.H. Estimates of Heritability and the Degree of Dominance in Corn 1. Agron. J. 1949, 41, 353–359. [Google Scholar] [CrossRef]
  25. Alvarado, G.; Rodríguez, F.M.; Pacheco, A.; Burgueño, J.; Crossa, J.; Vargas, M.; Pérez-Rodríguez, P.; Lopez-Cruz, M.A. META-R: A software to analyze data from multi-environment plant breeding trials. Crop. J. 2020, 8, 745–756. [Google Scholar] [CrossRef]
  26. Buzatti, R.S.D.O.; Pfeilsticker, T.R.; Muniz, A.C.; Ellis, V.A.; De Souza, R.P.; Lemos-Filho, J.P.; Lovato, M.B. Disentangling the environmental factors that shape genetic and phenotypic leaf trait variation in the tree Qualea grandiflora across the Brazilian savanna. Front. Plant Sci. 2019, 10, 1580. [Google Scholar] [CrossRef] [PubMed] [Green Version]
  27. Ji, M.; Deng, J.; Yao, B.; Chen, R.; Fan, Z.; Guan, J.; Li, X.; Wu, F.; Niklas, K.J. Ecogeographical variation of 12 morphological traits within Pinus tabulaeformis: The effects of environmental factors and demographic histories. J. Plant Ecol. 2017, 10, 386–396. [Google Scholar]
  28. Panda, S.; Sial, P. Assessment of existing genetic variability and yield component analysis in noug (Guizotia abyssinica (L.f.) Cass). Indian J. Innov. Dev. 2012, 1, 511–514. [Google Scholar]
  29. Amsalu, F. Genetic Variability Correlation and Path Coefficient Analysis of Niger Seed (Guizotia abyssinica [Lf] Cass.) Genotypes. Int. J. Res. Stud. Agric. Sci. 2020, 6, 8–16. [Google Scholar]
  30. Bhoite, K.D.; Kusalkar, D.V.; Patil, H.M. Genetic studies of yield and its component of Niger [(Guizotia abyssinica (Lf) Cass.] in Western Ghat Zone of Maharashtra. J. Pharmacogn. Phytochem. 2020, 9, 1182–1184. [Google Scholar]
  31. Ahmad, E.; Singh, M.N.; Paul, A.; Ansari, A.M.; Sigh, D.N. Genetic studies of yield and yield component of niger (Guizotia abyssinica Cass.) in rainfed condition of western plateau of Jharkhand. Int. J. Trop. Agric. 2016, 34, 1127. [Google Scholar]
  32. Tiwari, V.N.; Ahirwar, A.D.; Rai, G.K. Estimation of genetic parameters of variability for yield and its attributing traits in niger [Guizotia abyssinica (LF) Cass.]. Plant Arch. 2016, 16, 157–158. [Google Scholar]
  33. Wright, S. Correlation and causation. J. Agric. Res. 1921, 20, 557–580. [Google Scholar]
  34. Pulate, S.C.; Patil, H.S.; Patil, M.R. Multivariate analysis of genetic divergence among niger genotypes in relation to seed oil quality traits. Bioscan 2013, 8, 829–833. [Google Scholar]
  35. Geleta, M.; Bryngelsson, T.; Bekele, E.; Dagne, K. Comparative analysis of genetic relationship and diagnostic markers of several taxa of Guizotia Cass (Asteraceae) as revealed by AFLPs and RAPDs. Plant Syst. Evol. 2007, 265, 221–239. [Google Scholar] [CrossRef]
  36. Tsehay, S.; Ortiz, R.; Johansson, E.; Bekele, E.; Tesfaye, K.; Hammenhag, C.; Geleta, M. New Transcriptome-Based SNP Markers for Noug (Guizotia abyssinica) and Their Conversion to KASP Markers for Population Genetics Analyses. Genes 2020, 11, 1373. [Google Scholar] [CrossRef]
  37. Geleta, M.; Stymne, S.; Bryngelsson, T. Variation and inheritance of oil content and fatty acid composition in niger (Guizotia abyssinica). J. Food Compos. Anal. 2011, 24, 995–1003. [Google Scholar] [CrossRef]
Figure 1. Map of Ethiopia showing the field trial sites.
Agronomy 11 01479 g001
Figure 2. Over all mean number of seeds per plant across locations. Hl_R1 = Holeta Replication 1, Hl_R2 = Holeta Replication 2, DZ_R1 = Debre Zeit Replication 1, DZ_R2 = Debre Zeit Replication 2, Hl_Mean = Holeta Mean, DZ_Mean = Debre Zeit–Mean.
Agronomy 11 01479 g002
Figure 3. Dendrogram of 60 noug germplasm accessions constructed with UPGMA using Euclidian distance showing genetic relationships between qualitative (A) and quantitative (B) traits. Note: the underscore in accession codes were excluded for simplicity (e.g., the full code of “ShS19” in this figure is “Sh_S19”).
Agronomy 11 01479 g003
Figure 4. PCA biplots of the first two principal components (PC1 and PC2) combining the score plots of the 60 noug accessions showing their grouping pattern and the corresponding loading plots based on (A) the 10 quantitative traits and (B) the frequency of the desirable characteristics of the six qualitative traits. (A) DTF10 = days to 10% flowering, DTF50 = days to 50% flowering, DTF90 = days to 90% flowering, PH = plant height, NNPP = number of nodes per plant, NCPP = number of capitulum per plant, NPB = number of primary branches, LL = leaf length, LW = leaf width, NSPC = number of seeds per capitulum. (B) CS-1: Capitulum size = small; FS-5: Flower size = large; LC-3: Leaf color = green; LM-5: Leaf margin = course; SC-1: Stem color = green; SH-3: Stem hairiness = medium. Note: Only characters to the right of the underscore in Accession codes were used for sake of simplicity (e.g., the full accession code of “A19” in this figure = “Sh_A19”) (see Table S1).
Agronomy 11 01479 g004
Table 1. Description of the ten quantitative and six qualitative/categorical traits of noug included in the present study.
TraitTrait CodeDescription
Quantitative
Days to 10% floweringDTF10Number of days from planting to the flowering of 10% of plants on a plot
Days to 50% floweringDTF50Number of days from planting to the flowering of 50% of plants on a plot
Days to 90% floweringDTF90Number of days from planting to the flowering of 90% of plants on a plot
Leaf lengthLLThe length of leaves in the middle part of a stem measured from base to tip in cm (average of five leaves per plant)
Leaf widthLWThe width (at the center) of leaves in the middle part of a stem measured in cm (average of five leaves per plant)
Number of capitula per plantNCPPTotal number of capitula on each plant (count)
Number of nodes per plantNNPPTotal number of nodes on each plant (count)
Number of primary branchesNPBTotal number of primary branches on each plant (count)
Number of seeds per capitulumNSPCAn average number of seeds per capitulum, calculated based on five capitula from each plant
Plant heightPHHeight of a plant measured in cm at full flowering stage
Qualitative/Categorical
Flower sizeFSThree categories were given based on the diameter of fully developed flowers: 1 = small (<3 cm); 3 = medium (3 to 4 cm); 5 = large (>4 cm)
Capitulum sizeCSThree categories were given based on the cross-sectional circumference of mature capitulum: 1 = small (<3 cm); 3 = medium (3 to 4 cm); 5 = large (>4 cm)
Leaf colorLCThree categories were given based on the intensity of green color of mature leaves: 1= light green; 3 = green; 5 = deep green
Leaf marginLMThree categories were given based on the indent size of the margins of mature leaves: 1 = fine; 3 = medium; 5 = course
Stem colorSCTwo categories were given based on the color of the middle portion of a stem: 1 = green; 2 = purple
Stem hairinessSHThree categories were given based on the level of hairiness of the middle part of stems: 1 = no or little observable hair; 3 = medium; 5 = clearly visible dense hair
Table 2. Analysis of variance for quantitative traits of 60 noug accessions.
TraitsSources of VariationCoefficient of Variation (%)
MSG (59)MSE (1)MSG*E (59)MSR (120)
DTF10179.2 ***18,357.5 ***22.1 *14.44.9
DTF50188.0 ***20,813.4 ***26.9 ***12.64.4
DTF90185.8 ***21,606.8 ***33.4 ***12.74.2
NNPP4.7 ***97.3 ***0.7 **0.46.1
PH610.0 ***91.2370.1290.418.1
NPB9.0 ***18.5 *4.83.918.1
NCPP243.57695.4 ***23518835.1
LL0.6 *16.3 ***0.40.424.3
LW1.23.21.21.033.4
NSPC103.7 *20,419.2 ***104.0 *63.012.3
*, ** and *** = significant at 0.05, 0.01 and 0.001 significance level, respectively, MSG = mean square due to genotypes, MSE = mean square due to environment, MSG*E = mean square due to G × E interactions, MSR = mean square due to residual, numbers in parenthesis = degrees of freedom, DTF10 = days to 10% flowering, DTF50 = days to 50% flowering, DTF90 = days to 90% flowering, PH = plant height, NNPP = number of nodes per plant, NCPP = number of capitula per plant, NPB = Number of primary branches, LL = leaf length, LW = leaf width, NSPC = Number of seeds per capitulum.
Table 3. Chi-square (χ2) test (degrees of freedom = 177) for association of environments and accessions (two environments, two replications each environment and sixty accessions) for desirable characters of the six qualitative traits (first four columns). Observed (Obs.) and expected (Exp.) frequencies and contribution to χ2 for accessions with the lowest and highest sum of observed frequencies (percent) across the two sites are shown (last seven columns).
CharacterPearson χ2LR χ2p-ValueAcc DZ_R1DZ_R2HL_R1HL_R2All
CS-11629.71802.6<0.001Gj_D18Obs. freq.02608
Exp. freq.1.01.82.72.5
χ21.00.014.12.5
Sh_E7Obs. freq.78717890317
Exp. freq.41.070.0106.599.5
χ233.40.017.60.9
FS-51162.31251.9<0.001Sh_I7Obs. freq.1605829
Exp. freq.4.76.58.98.9
χ227.16.51.70.1
Tg_R13Obs. freq.55489495292
Exp. freq.47.465.789.389.6
χ21.224.790.250.33
LC-3227.9231.1<0.01Tg_T13Obs. freq.44624462212
Exp, freq.51.350.855.654.3
χ21.02.42.41.1
Wg_T3Obs. freq.100100100100400
Exp. freq.96.895.9104.9102.4
χ20.10.20.20.1
LM-5804.9881.8<0.001Sh_E7Obs. freq.06309
Exp. freq.2.32.02.32.3
χ22.37.90.22.3
Gj_C17Obs. freq.84628862296
Exp. freq.76.7966.0877.4375.69
χ20.680.251.442.48
SC-1817.1926.6<0.001Tg_K13Obs. freq.83310051
Exp. freq.12.313.012.613.1
χ21.530.70.513.1
Ar_H24Obs. freq.70647253259
Exp. freq.62.566.164.166.7
χ20.90.11.02.7
SH-3706.6772.3<0.001Wg_B3Obs. freq.81742352
Exp. freq.13.113.113.112.7
χ22.01.16.38.4
Wl_F8Obs. freq.90865256284
Exp. freq.71.871.671.569.1
χ24.62.95.32.5
LR χ2 = likelihood ratio chi-square; Acc = Accession; Obs freq = observed frequency; Exp. Freq. = expected frequency; χ2 = contribution to chi-square; DZ_R1; Debre Zeit replication-1; DZ_R2; Debre Zeit replication-2; HL_R1; Holeta replication-1; HL_R2; Debre Zeit replication-2. CS-1: Capitulum size = small; FS-5: Flower size = large; LC-3: Leaf color = green; LM-5: Leaf margin = course; SC-1: Stem color = green; SH-3: Stem hairiness = medium.
Table 4. Genotypic (below diagonal) and phenotypic correlation (above diagonal) coefficient among the 10 quantitative traits.
TraitsDTF10DTF50DTF90NNPPPHNPBNCPPLLLWNSPC
DTF10 0.91 ***0.94 ***0.59 ***0.220.38−0.040.23−0.06−0.23 ***
DTF500.99 *** 0.95 ***0.57 ***0.23 *0.36−0.030.24−0.08−0.30 **
DTF900.99 ***0.99 *** 0.57 ***0.25 *0.35−0.100.21−0.06−0.30 ***
NNPP0.68 ***0.72 ***0.74 *** 0.41 ***0.73 ***0.060.32 *−0.01−0.09 *
PH0.25 ***0.380.390.44 *** 0.500.27 *0.65 ***0.63 ***−0.11
NPB0.510.55 ***0.52 ***0.89 ***0.29 *** 0.430.53 **0.370.12
NCPP0.11 ***0.60 ***0.24 ***0.36 ***0.65 ***0.99 *** 0.35 ***0.25 ***0.24 *
LL0.380.57 ***0.470.48 ***0.72 ***0.48 ***0.33 *** 0.66 ***−0.11
LW−0.14 ***0.01−0.03 ***−0.26 ***0.50−0.21 ***0.40 ***0.42 *** −0.03
NSPC−0.36 ***−0.61 ***−0.54 ***−0.05 ***−0.08 ***0.41 ***−0.77 ***−0.04 ***0.49 ***
*, ** and *** = significant at 0.05, 0.01 and 0.001 significance level respectively, DTF10 = days to 10% flowering, DTF50 = days to 50% flowering, DTF90 = days to 90% flowering, PH = plant height, NNPP = number of nodes per plant, NCPP = number of capitulum per plant, NPB = number of primary branches, LL = leaf length, LW = leaf width, NSPC = number of seeds per capitulum.
Table 5. Estimates of phenotypic values, variance components and broad-sense heritability (H2) for the 10 quantitative traits measured in 60 noug accessions.
TraitsMinimumMaximumMean ± SDGenotypic VariancePhenotypic VarianceH2 (%)GCV (%)PCV (%)
DTF1060.00102.077.45 ± 3.800.29140.341385.380.690.75
DTF5063.00107.081.00 ± 3.600.20310.282371.940.550.65
DTF9065.00109.084.07 ± 3.600.21950.284477.140.560.63
NNPP6.6013.8210.05 ± 0.610.44680.567678.716.657.49
PH29.60144.787.15 ± 13.710.15860.557528.451.021.91
NPB5.1016.8210.85 ± 1.970.16110.423438.053.695.99
NCPP10.7887.0894.22 ± 17.040.18080.469138.540.450.72
LL1.044.662.54 ± 0.620.05060.305016.598.8521.74
LW1.006.003.01 ± 1.010.13831.222811.3112.3536.73
NSPC39.4096.9264.52 ± 7.940.11540.364931.620.530.93
DTF10 = days to 10% flowering, DTF50 = days to 50% flowering, DTF90 = days to 90% flowering, PH = plant height, NNPP = number of nodes per plant, NCPP = number of capitula per plant, NPB = Number of primary branches, LL= leaf length, LW = leaf width, NSPC = number of seeds per capitulum, SD = standard deviation; PCV = phenotypic coefficient of variation, GCV = genotypic coefficient of variation, H2 = broad-sense heritability.
Publisher’s Note: MDPI stays neutral with regard to jurisdictional claims in published maps and institutional affiliations.

