Article

Short-Term Responses to Salinity of Soybean and Chenopodium album Grown in Single and Mixed-Species Hydroponic Systems

1
Department of Agronomy, Food, Natural Resources, Animals and Environment (DAFNAE), University of Padova, viale dell’Università 16, 35020 Legnaro, Padova, Italy
2
Department of Agricultural, Forest and Food Sciences (DISAFA), University of Turin, Largo Braccini 2, 10095 Grugliasco, Turin, Italy
3
Centre of New Technologies, Stefana Banacha 2c, University of Warsaw, 02-097 Warsaw, Poland
*
Author to whom correspondence should be addressed.
Submission received: 1 July 2021 / Revised: 23 July 2021 / Accepted: 24 July 2021 / Published: 26 July 2021
(This article belongs to the Special Issue Physiology of Halophytes and Their Potential)

Abstract

:
Weeds account for losses in crop yields, and this event might be exacerbated by salinity. Therefore, we investigated the responses of Chenopodium album L. and soybean (Glycine max (L.) Merr.) to salt stress, as well as interferences between species. Ten-day old plants were grown for 1 week in a single- or mixed-species set-up, either with or without 100 mM of NaCl. C. album reduced the biomass of soybean similarly to salt stress, while its growth was unaffected under any condition. C. album decreased the crop protein content when salinity was applied. This effect was ascribed to altered protein metabolism and/or N usage to produce other N metabolites, including osmolytes. The two species did not reciprocally affect the capacity to accumulate Na+, but the weed contained two-fold more Na+ in the leaves. Elevated initial K+ concentration and high K+ delivery to the shoot likely explained the better acclimation of C. album to salinity. C. album produced more phenolics and proline and exhibited greater antioxidant activity, but low lipid peroxidation, in the mixed set-up under salinity. Thus, it is possible that the weed could become more resilient to salinity when growing in a soybean field. In the long term, this might cause significant losses in soybean productivity as expected by the dramatic decline in crop protein content.

1. Introduction

Soil salinization, a condition characterized by a high concentration of soluble salts, among which NaCl is the most soluble and widespread [1], is increasingly affecting agroecosystems, thus contributing to the loss of arable land and adversely impacting crop yields [2]. Due to climate changes and the depletion of natural resources, the agricultural land injured by salinization, currently accounting for 20% of the world’s cultivated areas, is expanding globally at an annual rate of 10% [3]. Sea-level rise and groundwater overexploitation responsible for saltwater intrusion in coastal and inland aquifers [4] are among the main factors expected to exacerbate the negative effects of salinity.
High soil salinity impairs the seed germination, root length, plant height, leaf size and productivity of many cultivated species, including staple crops such as wheat, rice, maize and soybean [5,6,7,8]. Major toxic effects of salinity on the plant at the cellular level include ion imbalance, which affects plant metabolism by increasing the accumulation of Na+ and Cl- ions while depleting K+ and Ca2+ in tissues [9], and hyperosmotic stress [10], which is primarily due to decreased water foraging and reactive oxygen species (ROS) overproduction [10,11,12]. ROS are involved in many biological processes, such as growth and development, cell cycle and programmed cell death [13], but can also initiate cascade reactions that induce oxidative stress, especially through lipid peroxidation and alteration of cell membranes by protein denaturation and DNA mutation [14]. Enzymes such as ascorbate peroxidase (APX), guaiacol peroxidase (GPX) and catalase (CAT), along with nonenzymatic antioxidants, including ascorbate and glutathione, and the osmolyte proline, are involved in plant defense mechanisms against ROS [15,16] and can be used as markers to define the salt stress status of the plant.
The physiological responses to salt stress have been thoroughly studied in soybean (Glycine max (L.) Merr.), which is a salt-sensitive glycophyte [5]. Soil salinization affects important agronomic traits of this crop, such as the growth rate, nodulation, seed quality and quantity [5], which results in severe yield reduction (up to 40%) [17].
In contrast, weed responses to salinity, as well as weed-crop interactions, have been overlooked so far [18]. Because invasive weeds exhibit earlier emergence, faster growth rates and higher genetic resilience and plasticity than overcultivated species under hostile environmental conditions [19,20,21], their diffusion might be favored with increasing salinity in arable lands.
Chenopodium album is one of the most widespread weeds associated with spring and summer crops (e.g., soybean, maize, sugar beet) and displays a plethora of traits, including allelopathic potential, high seed production and longevity, that qualify it as a fearsome weed [18]. It is also recognized as a high-salt tolerant species with typical halophytic traits, such as seed dimorphism, sodium exclusion, potassium retention and high production of osmolytes and antioxidants [22]. Generally, C. album also exhibits greater plasticity in response to changing environment [23]. Thus, this weed can grow within a wide range of climates and soil conditions (pH, soil type, fertility) and is likely to spread in agroecosystems increasingly affected by climate change.
To our knowledge, only a few studies exist that appraise the interactions of C. album with staple crops in saline and non-saline environments. In addition, most of these studies have only considered the interactive effects of species at the seed and early emergence level, while only a few of them have evaluated the competition along the entire plant lifecycle [24,25]. On this account, the current work aims to investigate the responses of soybean and C. album seedlings to salinity (NaCl) in hydroponics, according to single-species and co-cultivation (mixed) set-ups. We assayed the plant biomass and changes in protein and elemental content, as well as the intensity of oxidative stress-related markers (antioxidant capacity, antioxidant enzyme activity, lipid peroxidation, content of total phenolic compounds and the osmolyte proline). Hydroponics was chosen over soil because it is a simplified system that allows studying specific stressors while minimizing variations in measured traits apart from those due to applied treatments, thereby avoiding the stochastic factors that typically affect in-field experiments. Furthermore, the understanding of weed-crop interactions in a controlled environment will provide a solid knowledge basis for further studies performed in greenhouse and open-field conditions.

2. Materials and Methods

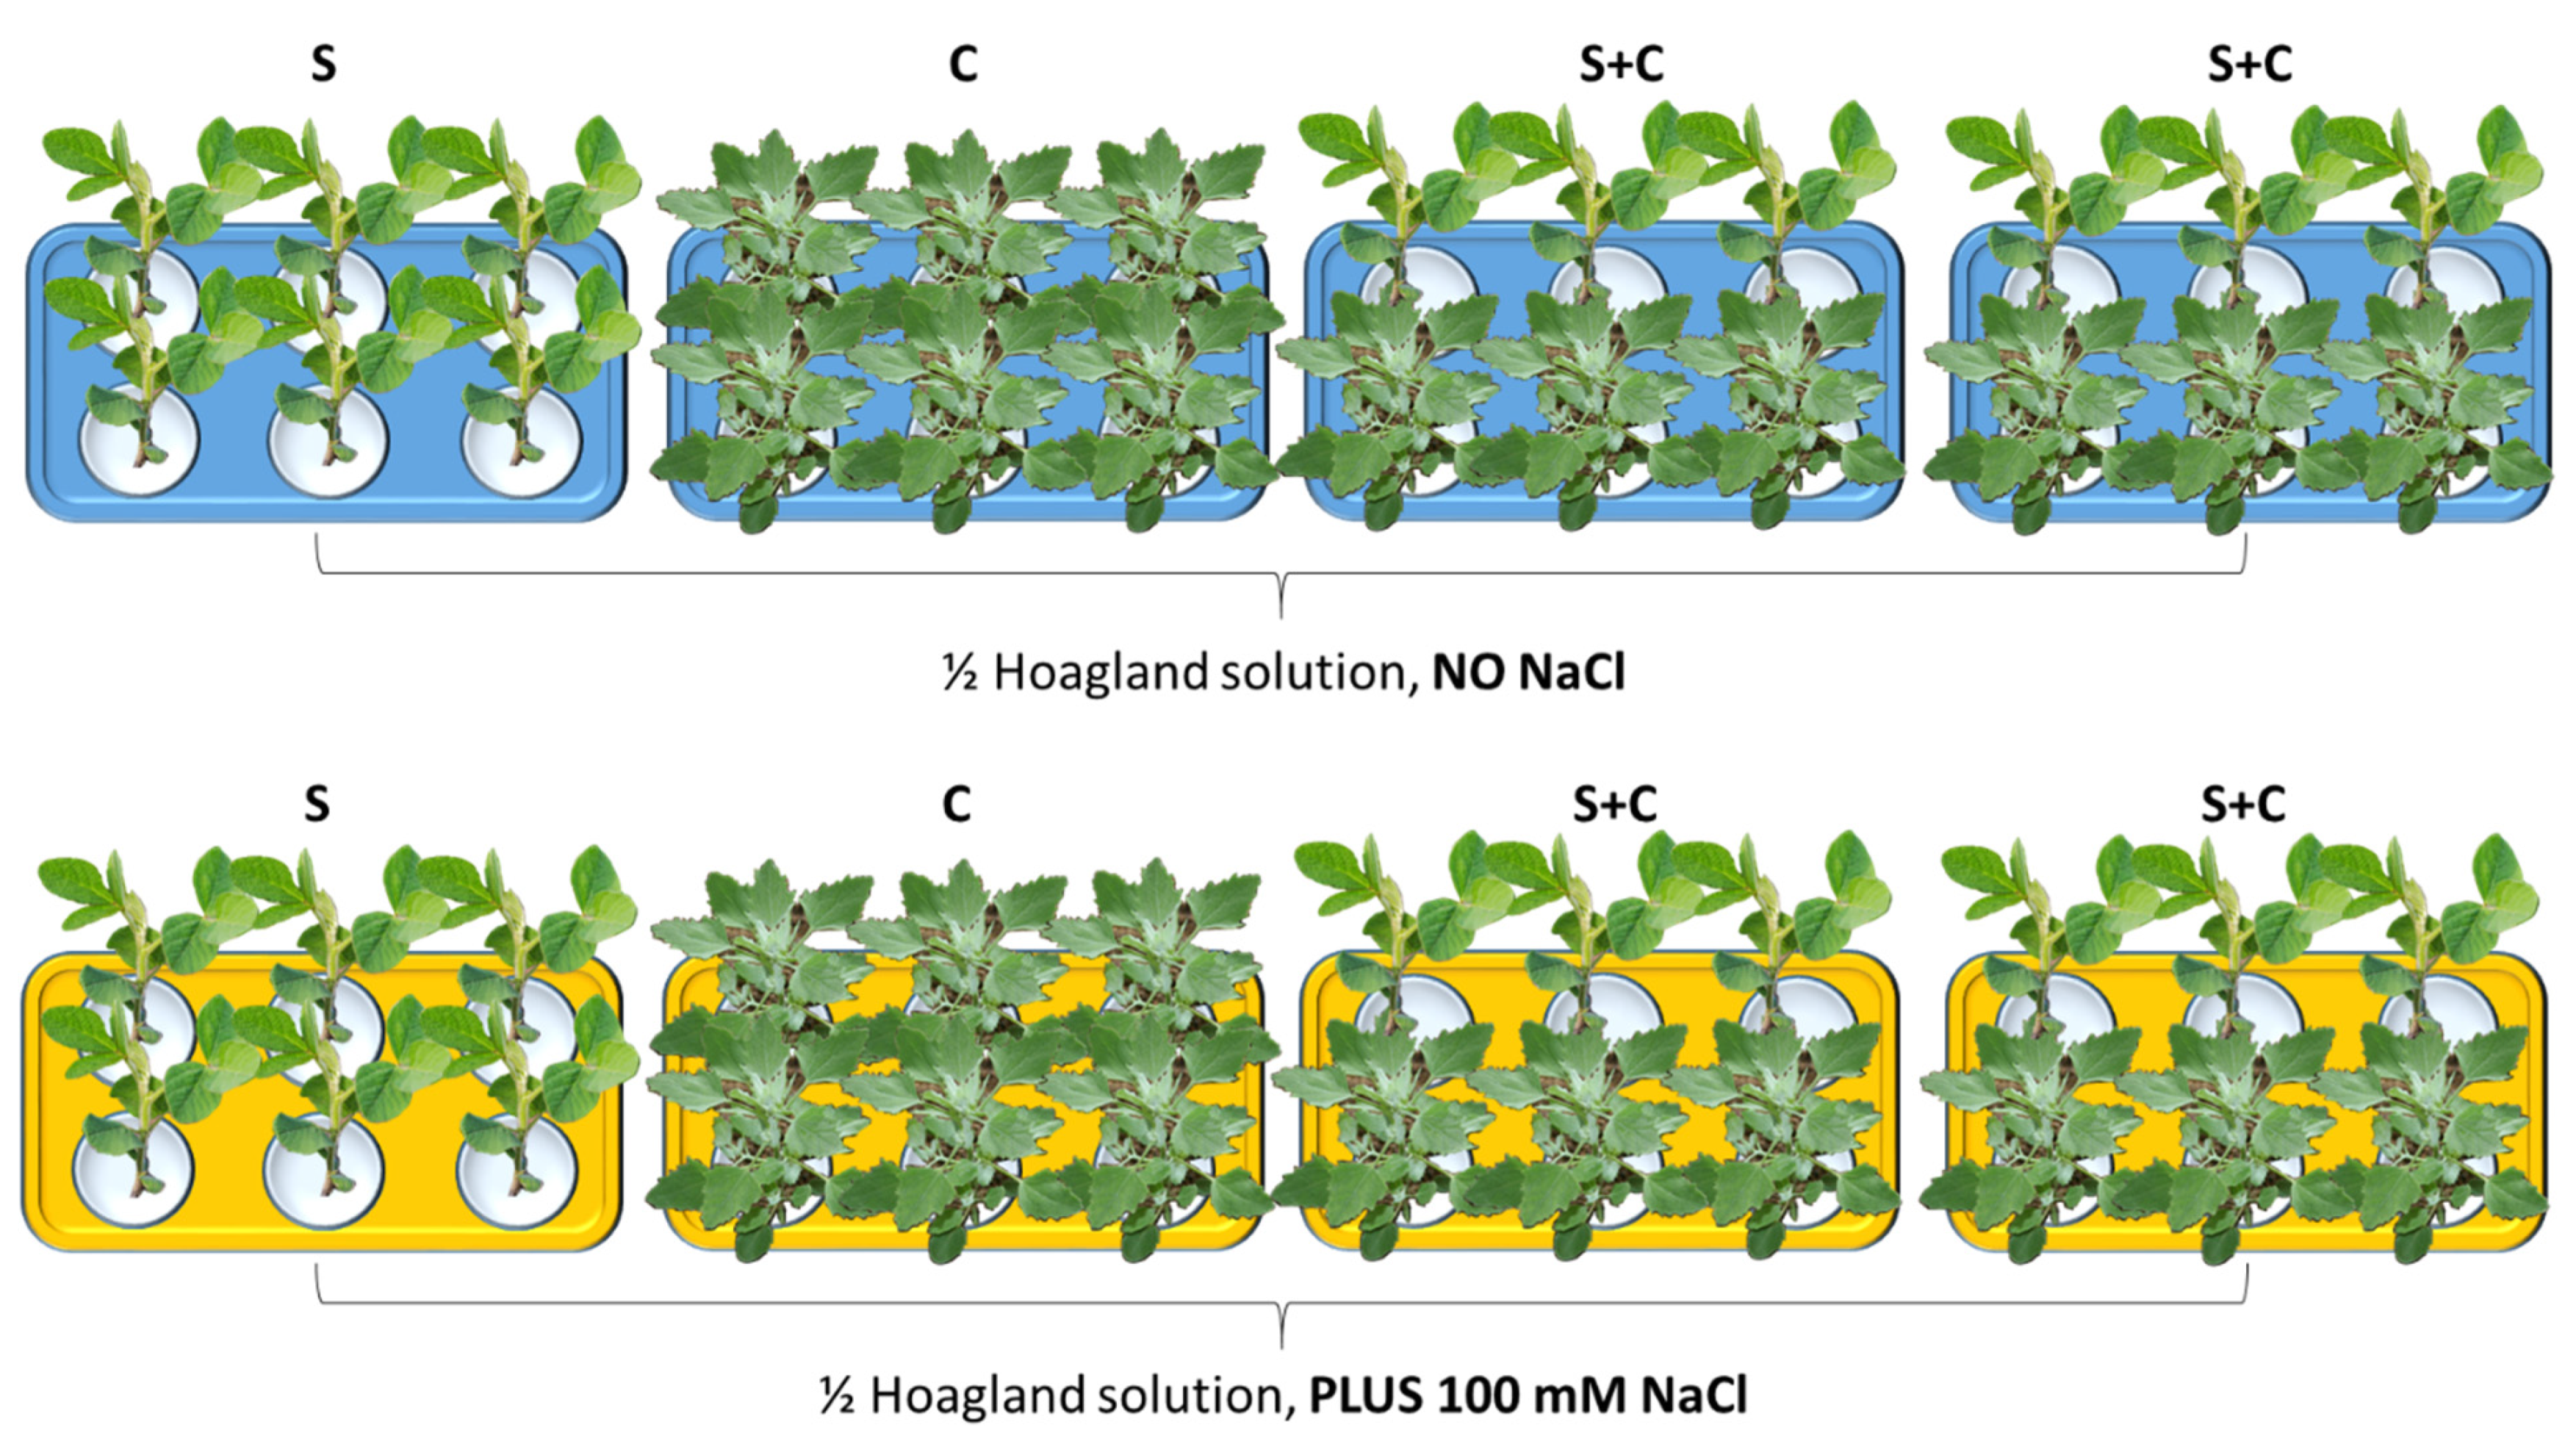
2.1. Plant Growth Conditions and Experimental Design

C. album seeds were harvested from a soybean field at the University of Padova experimental farm (45°20′53″ N 11°57′05″ E, Legnaro, Italy), with a soil electrical conductivity of 0.3 dS/m. Seeds were cleaned and kept at 4 °C until the start of the experiment. The weight of 1000 seeds was 0.540 ± 0.001 g, and 90% of the seeds were black. The soybean cultivar (cv. PD1T45) used in this study was salt-sensitive, as in preliminary tests conducted in hydroponics plants manifested stress signs (e.g., reduced turgor, stunted growth) at low salt concentration.
Soybean and C. album seeds were allowed to germinate in silty loam soil inside a growth chamber set at 25/20 °C, with a lighting period of 14 h, relative humidity of 70/85% and at a photon flux density (PFD) of 280 mol m−2s−1, until C. album seedlings reached the height of 10 cm. For each species, equal-size plants were carefully washed with double-distilled water to remove the majority of soil particles from their radicle. Then, plants were transferred to a hydroponic set-up consisting of sixteen 5 L tanks filled with half-strength Hoagland’s solution (Hoagland and Arnon, 1950) at a density of six plants per tank. After 3 days of acclimation, plants were divided as follows: soybean plants (−/+ NaCl), C. album plants (−/+ NaCl), three soybean plants plus three C. album plants (−/+ NaCl). Plants subjected to salt stress were supplied with 100 mM of NaCl. The salt stress treatment was determined based on preliminary experiments where NaCl concentrations ranging from 25 mM to 150 mM were tested on plants. In these experiments, soybean was found to be excessively affected by NaCl concentrations of over 100 mM, showing extensive necrosis of leaf tissues after 7 days, while 100 mM of NaCl was the concentration at which the effects of salt on plant growth clearly manifested. The duration of the experiment was limited to 1 week to observe short-time effects of various treatments on soybean physiological responses. For each salt treatment with or without the addition of NaCl, two tanks were set up for the individual species, and four tanks were set up for the mixed species. The number of tanks with both soybean and C. album was twice of those with the single species to obtain the same number of biological replicates per treatment (Figure 1). The whole trial was repeated a second time for data confirmation, with the same number of tanks and plant density in each tank. Individual treatments and relative acronyms are reported in Table 1. After 1 week, plants were collected. The fresh (FW) and dry (DW) weight of leaves and roots of individual plants (six per treatment) were measured. For dry weight determination, the plant material was oven-dried at 70 °C for 48 h. The same dry material was used for elemental quantification, while the remaining plants were immediately frozen in liquid nitrogen and stored at −80 °C until further biochemical analyses. In this case, assays were conducted on three samples per treatment. Each sample consisted of a bunch of two plants. Protein concentration in leaves was determined using the Bradford method [26].

2.2. Soluble Protein Quantification

Frozen samples (200 mg) were ground in a mortar with liquid nitrogen and extracted with phosphate buffer (pH 7.8) containing polyvinylpyrrolidone (PVP) (10 g L−1) at a ratio of 1:10. Samples were centrifuged for 20 min at 13,000× g at 4 °C. The supernatant was collected, and the extract (50 μL) was used for the protein assay. Protein content was quantified using a UV/VIS spectrophotometer (Eppendorf Biophotometer® Basic D30, Hamburg, Germany) by comparing the values measured at λ = 595 nm with those provided by a reference calibration curve prepared using bovine serum albumin (BSA) at different dilutions. Data are expressed as milligrams of protein per gram of fresh weight.

2.3. Elemental Content Quantification

Nitrogen (N) contents were determined in dried plant material using a CNS elemental analyzer (Vario MACRO CNS, Hanau, Germany). The quantification of Na and K in leaves and roots was performed after an acid-digestion procedure. Digestion reactions were carried out inside closed Teflon vessels of 100 mL volume using 500 mg dry plant material in 9 mL HNO3 and H2O2 30% (7:2) in a microwave (Millestone Start-D 1200W). Mineralized samples were then diluted in 25 mL ultrapure water and each element was assayed via Inductively Coupled Plasma Atomic Emission Spectroscopy (Optima 2000 DV, Perkin Elmer Instruments, Solingen, Germany). Data are expressed as milligrams per kilo (ppm) of dry weight.

2.4. Determination of Total Antioxidant Activity and Phenol Content

The total antioxidant activity in leaves and roots was evaluated by measuring the ferric-reducing antioxidant power (FRAP). The assay was based on the methodology of Benzie and Strain [27]. In total, 10 g of plant material (leaves and roots) were homogenized in 20 mL of high-performance liquid chromatography (HPLC)-grade methanol using an Ultra-Turrax tissue homogenizer (Takmar, Cincinnati, OH, United States) at a moderate speed (setting of 60) for 30 s. The FRAP reagent was freshly prepared, containing 1 mM 2,4,6-tripyridyl-2-triazine (TPTZ) and 2 mM ferric chloride in 0.25 M sodium acetate buffer at pH 3.6. Then, 100 µL of the methanol extract were added to 1900 μL of FRAP reagent and accurately mixed. After leaving the mixture at 20 °C for 4 min, the absorbance was determined at 593 nm. Calibration was against a standard curve (0–1200 mg mL−1 ferrous ion) obtained by the addition of freshly prepared ammonium ferrous sulfate. FRAP values were calculated as micrograms per milliliter ferrous ion (ferric-reducing power) and are presented as milligrams per kilogram of Fe2+ Eq (ferrous ion equivalents).
The concentration of total phenols in leaves and roots was determined according to the Folin-Ciocalteu (FC) assay with gallic acid as calibration standard using a Shimadzu UV-1800 spectrophotometer (Shimadzu Corporation, Columbia, MD, United States). The FC assay was performed by placing 200 μL of plant extract (obtained as described above for the total antioxidant activity) into a 10 mL PP tube. This procedure was followed by the addition of 1 mL of the FC reagent. The mixture was vortexed for 20 s to 30 s. Then, 800 μL of sodium carbonate solution (20% w/v) was added to the mixture 5 min after the addition of the FC reagent. This was recorded as time zero, and the mixture was vortexed for 20 s to 30 s after the addition of sodium carbonate. After 2 h at room temperature, the absorbance of the colored reaction product was measured at λ = 765 nm. The concentration of total phenols in the extracts was calculated from a standard calibration curve obtained with different concentrations of gallic acid, ranging from 0 mg mL−1 to 600 mg mL−1. Results were expressed as milligrams of gallic acid equivalent per kilogram of FW [28].

2.5. Antioxidant Enzyme Activity

The analysis of enzyme activity was performed in frozen leaves (200 mg) ground in a mortar with liquid nitrogen and extracted with 50 mM phosphate buffer (pH 7.8) containing PVP (10 g L−1) and Triton X-100 (250 μL) at a ratio of 1:10 (w/v). Guaiacol peroxidase activity was determined by measuring the oxidation of guaiacol in the presence of H2O2 (extinction coefficient, 26.6 mM cm−1) at λ = 470 nm over a 3 min interval. The reaction mixture contained 50 μL of 20 mM guaiacol, 2.9 mL of 0.036% H2O2 (v/v) and 50 μL of enzyme extract. For APX, the activity was determined following the decrease of ascorbate (extinction coefficient 2.8 mM cm−1) and measuring the change in absorbance at λ = 290 nm over a 3 min interval. The reaction mixture contained 50 mM phosphate buffer (pH 7.0), 1 mM ethylenediaminetetraacetic acid disodium salt (EDTA)-Na2, 0.5 mM ascorbic acid, 0.1 mM H2O2 and 50 μL of enzyme extract [29]. Results are expressed as enzymatic units per milligram of protein. CAT activity was determined by following the consumption of H2O2 (extinction coefficient, 39.4 mM cm−1) at λ = 240 nm over a 2 min interval. The reaction mixture contained 2.9 mL of 0.036% H2O2 (w/w) and 100 μL of enzyme extract. The reaction was initiated by adding the enzyme extract. Results are expressed as enzyme units per milligrams of protein.

2.6. Lipid Peroxidation

For malondialdehyde (MDA) assay, frozen leaf tissues (150 mg) were ground in liquid nitrogen and added with phosphate buffer (pH 7). Butylated hydroxytoluene (BHT) was used to prevent sample autoxidation and to minimize formation of artifacts. Extracts were further centrifuged at 20,000× g at 4 °C for 20 min, and 200 μL of each supernatant was added with 1.3 mL of 0.3% thiobarbituric acid (TBA) in 10% trichloroacetic acid (TCA). Tubes were placed in a heat block for 30 min at 95 °C. Then, they were cooled in ice and centrifuged at 15,000× g at 4 °C for 10 min. The absorbance was read at 532 nm and 600 nm. The OD600 was then subtracted from the OD532 value (correction for turbidity) to achieve an extinction coefficient of 155 mM cm−1. Data are expressed as TBARS (thiobarbituric acid reactive substances).

2.7. Proline Quantification

Proline content in leaves and roots was determined by reversed-phase (RP)-HPLC followed by UV detection. Each sample was prepared by placing 100 mg of plant material in a 6 × 50 mm borosilicate glass tube. HCl (7.5 mL, 6 M) was added to the sample, which was then heated at 105 °C for 24 h. After hydrolysis, the sample was neutralized to pH 9 using 8N NaOH and brought up to 100 mL with water. The solution was then filtered through a syringe filter of 0.45μm to conduct the derivatization procedure. Then, 10 µL of extract was mixed with 70 µL of 0.2 M borate buffer (pH 9.0), followed by 20 µL of aminoquinolyl-N-hydroxysuccinimidyl carbamate (AQC) dissolved in acetonitrile. The mixture was incubated for 1 min at room temperature, then for 10 min at 55 °C. The resulting AQC-derivatized mixture was diluted by adding 900 µL of borate buffer.
The chromatographic analysis was performed using an Agilent Infinity 1260 liquid chromatograph with a binary pump (Agilent Technologies, Santa Clara, CA, United States), equipped with a CORTECS C18 column (2.7 μm, 2.1 × 150 mm). The mobile phase was 0.1% formic acid (v/v) in deionized water, and the flow rate was 0.4 mL/min. The injection volume was 5 μL. Proline was detected with a diode array detector (DAD), and its concentration was determined based on a standard curve. The results are expressed in nanomoles of proline per gram of fresh weight.

2.8. Statistical Analysis

The parameters evaluated were compared within soybean treatments (progressive numbers: 1–4) and within C. album treatments (progressive numbers: 5–8) (i.e., plants grown in single-species or mixed tanks, with or without the addition of NaCl, Table 1). In addition, the interaction between salt stress and interspecific competition was compared between soybean and C. album.
To assess differences among treatments (salinity and competition), one-way analysis of variance (ANOVA) was performed separately for soybean and C. album using TIBCO 13.6.0 Statistica (2019). The test was followed by pair-wise post hoc analyses (Student-Newman-Keuls test) to determine which means differed significantly at p < 0.05 (±SD). The homogeneity of variances was confirmed by the Levene test. The number of biological replicates varied depending on the analysis performed, as reported in the figure legends.
Factorial ANOVA was performed on TIBCO 13.6.0 Statistica (2019) to assess the combined influence of species and competition on all the parameters, expressed as percentage of treated over non treated plants (% nt).

3. Results

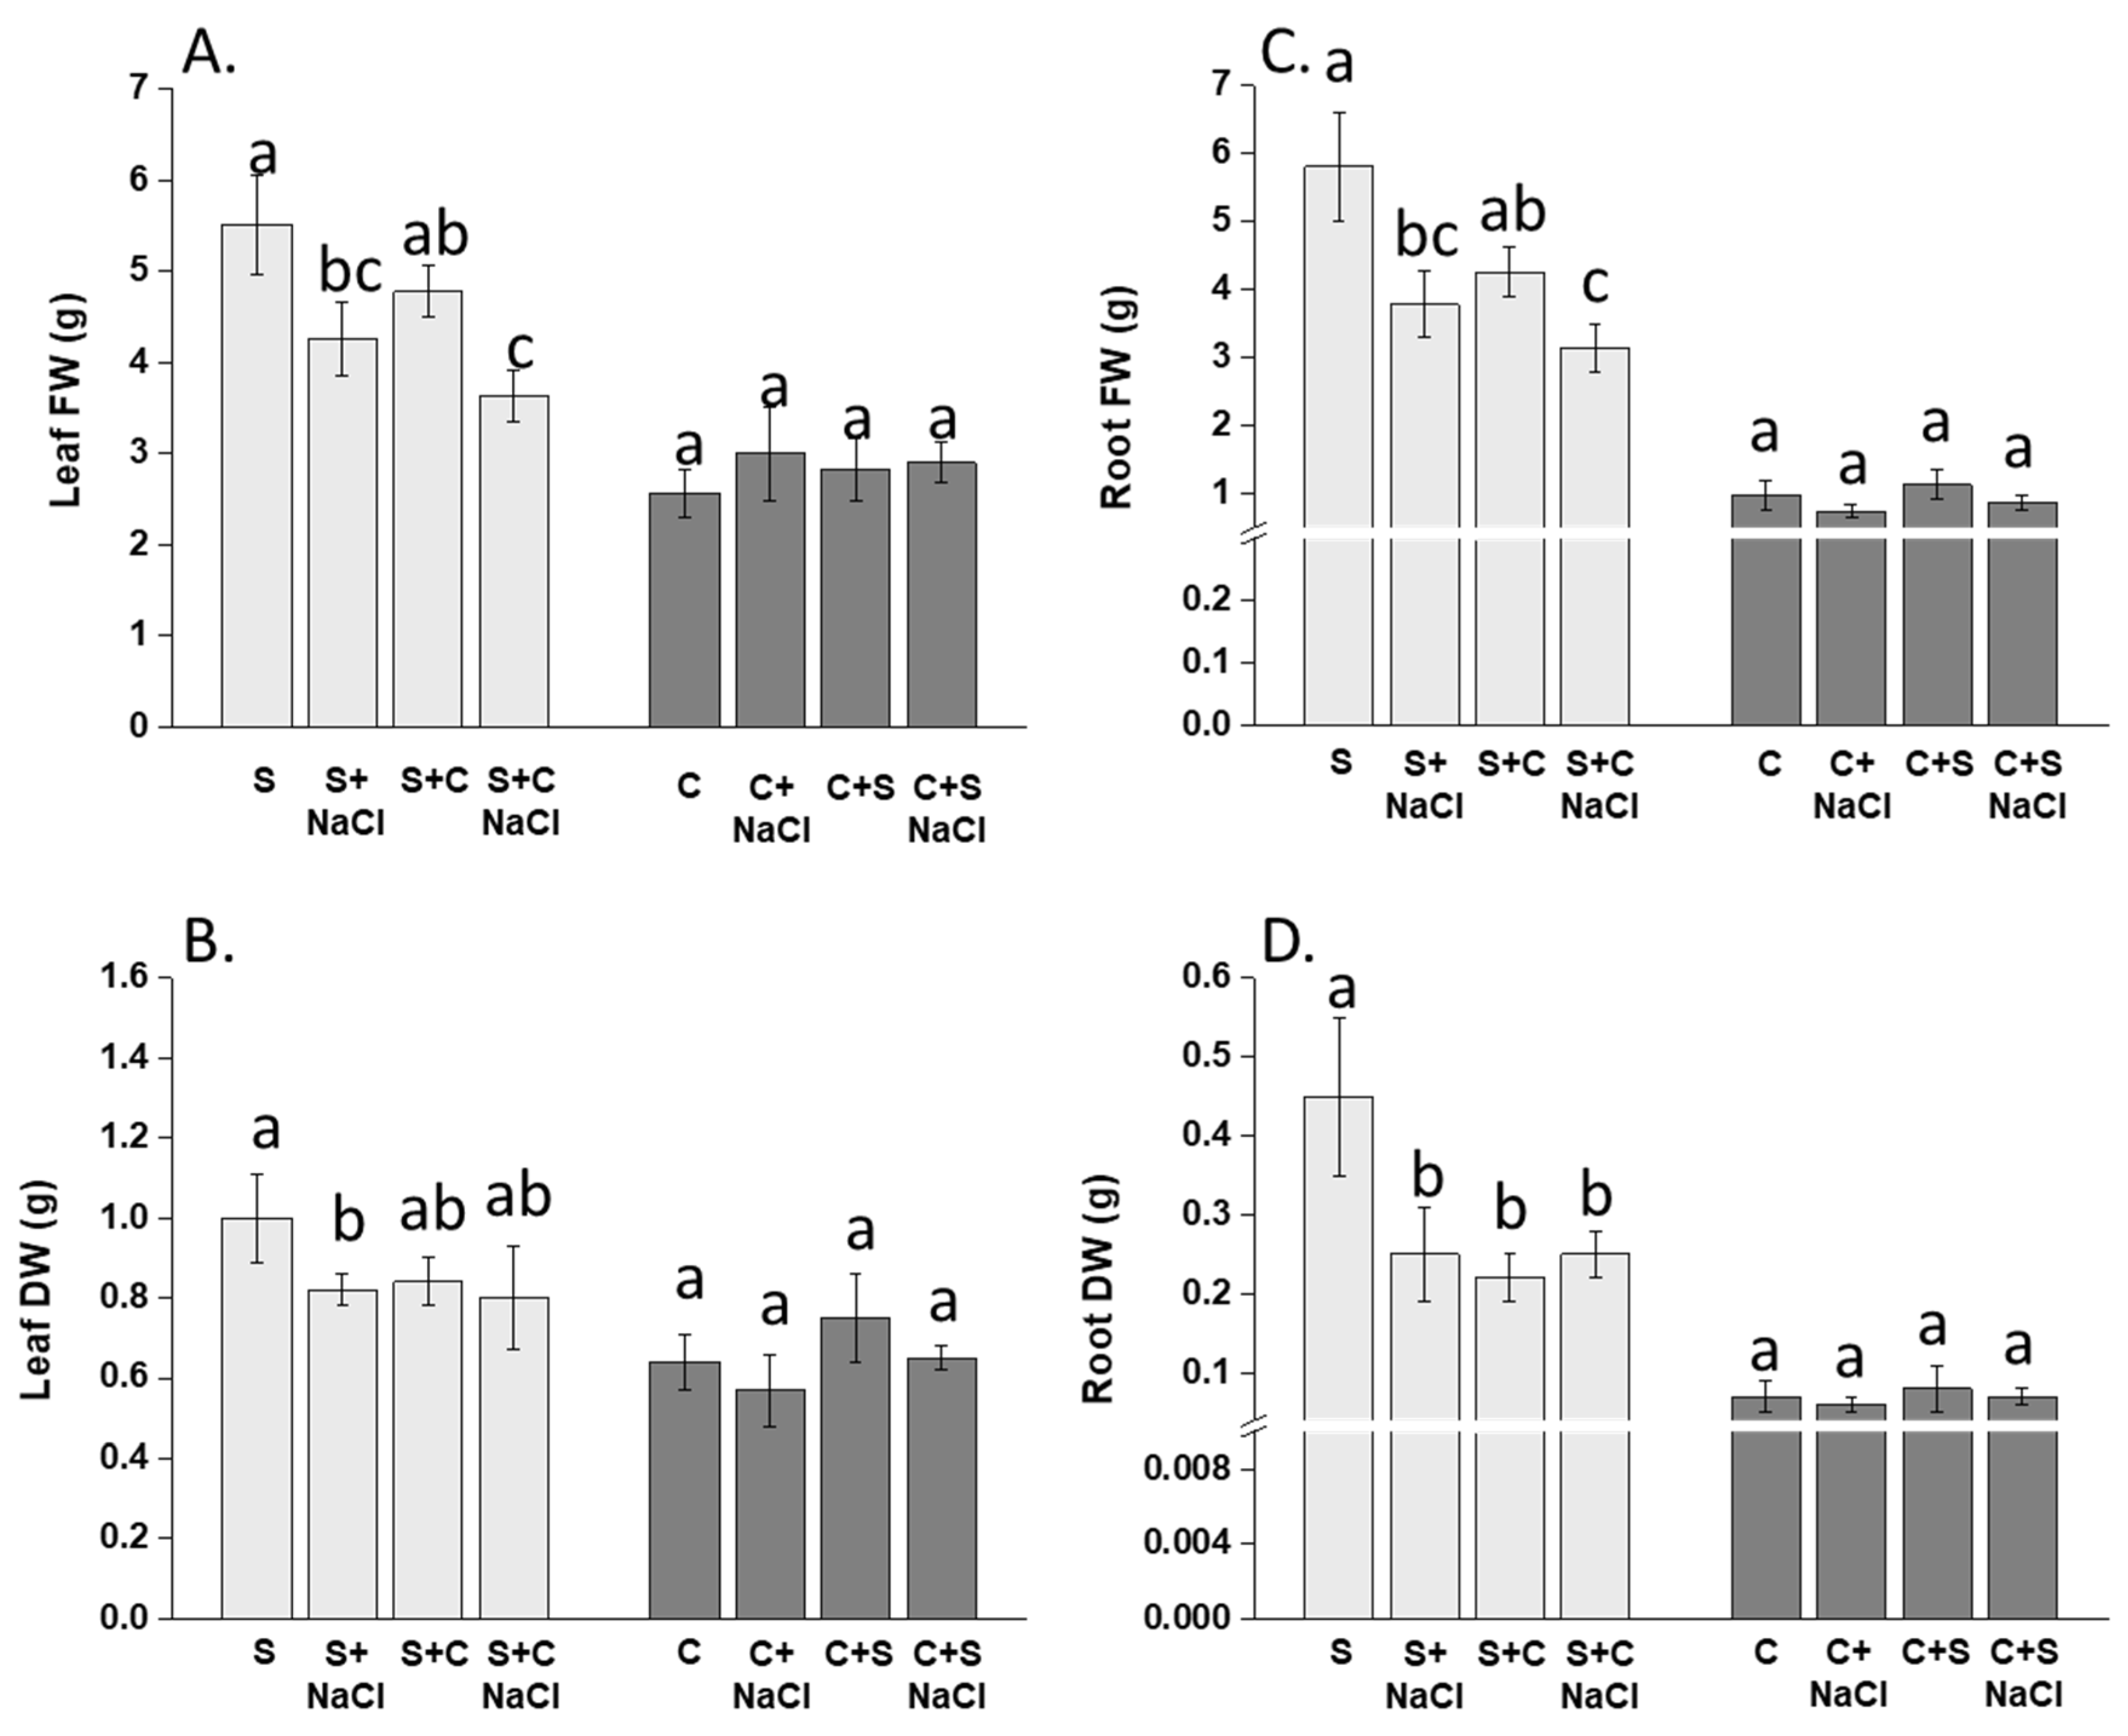
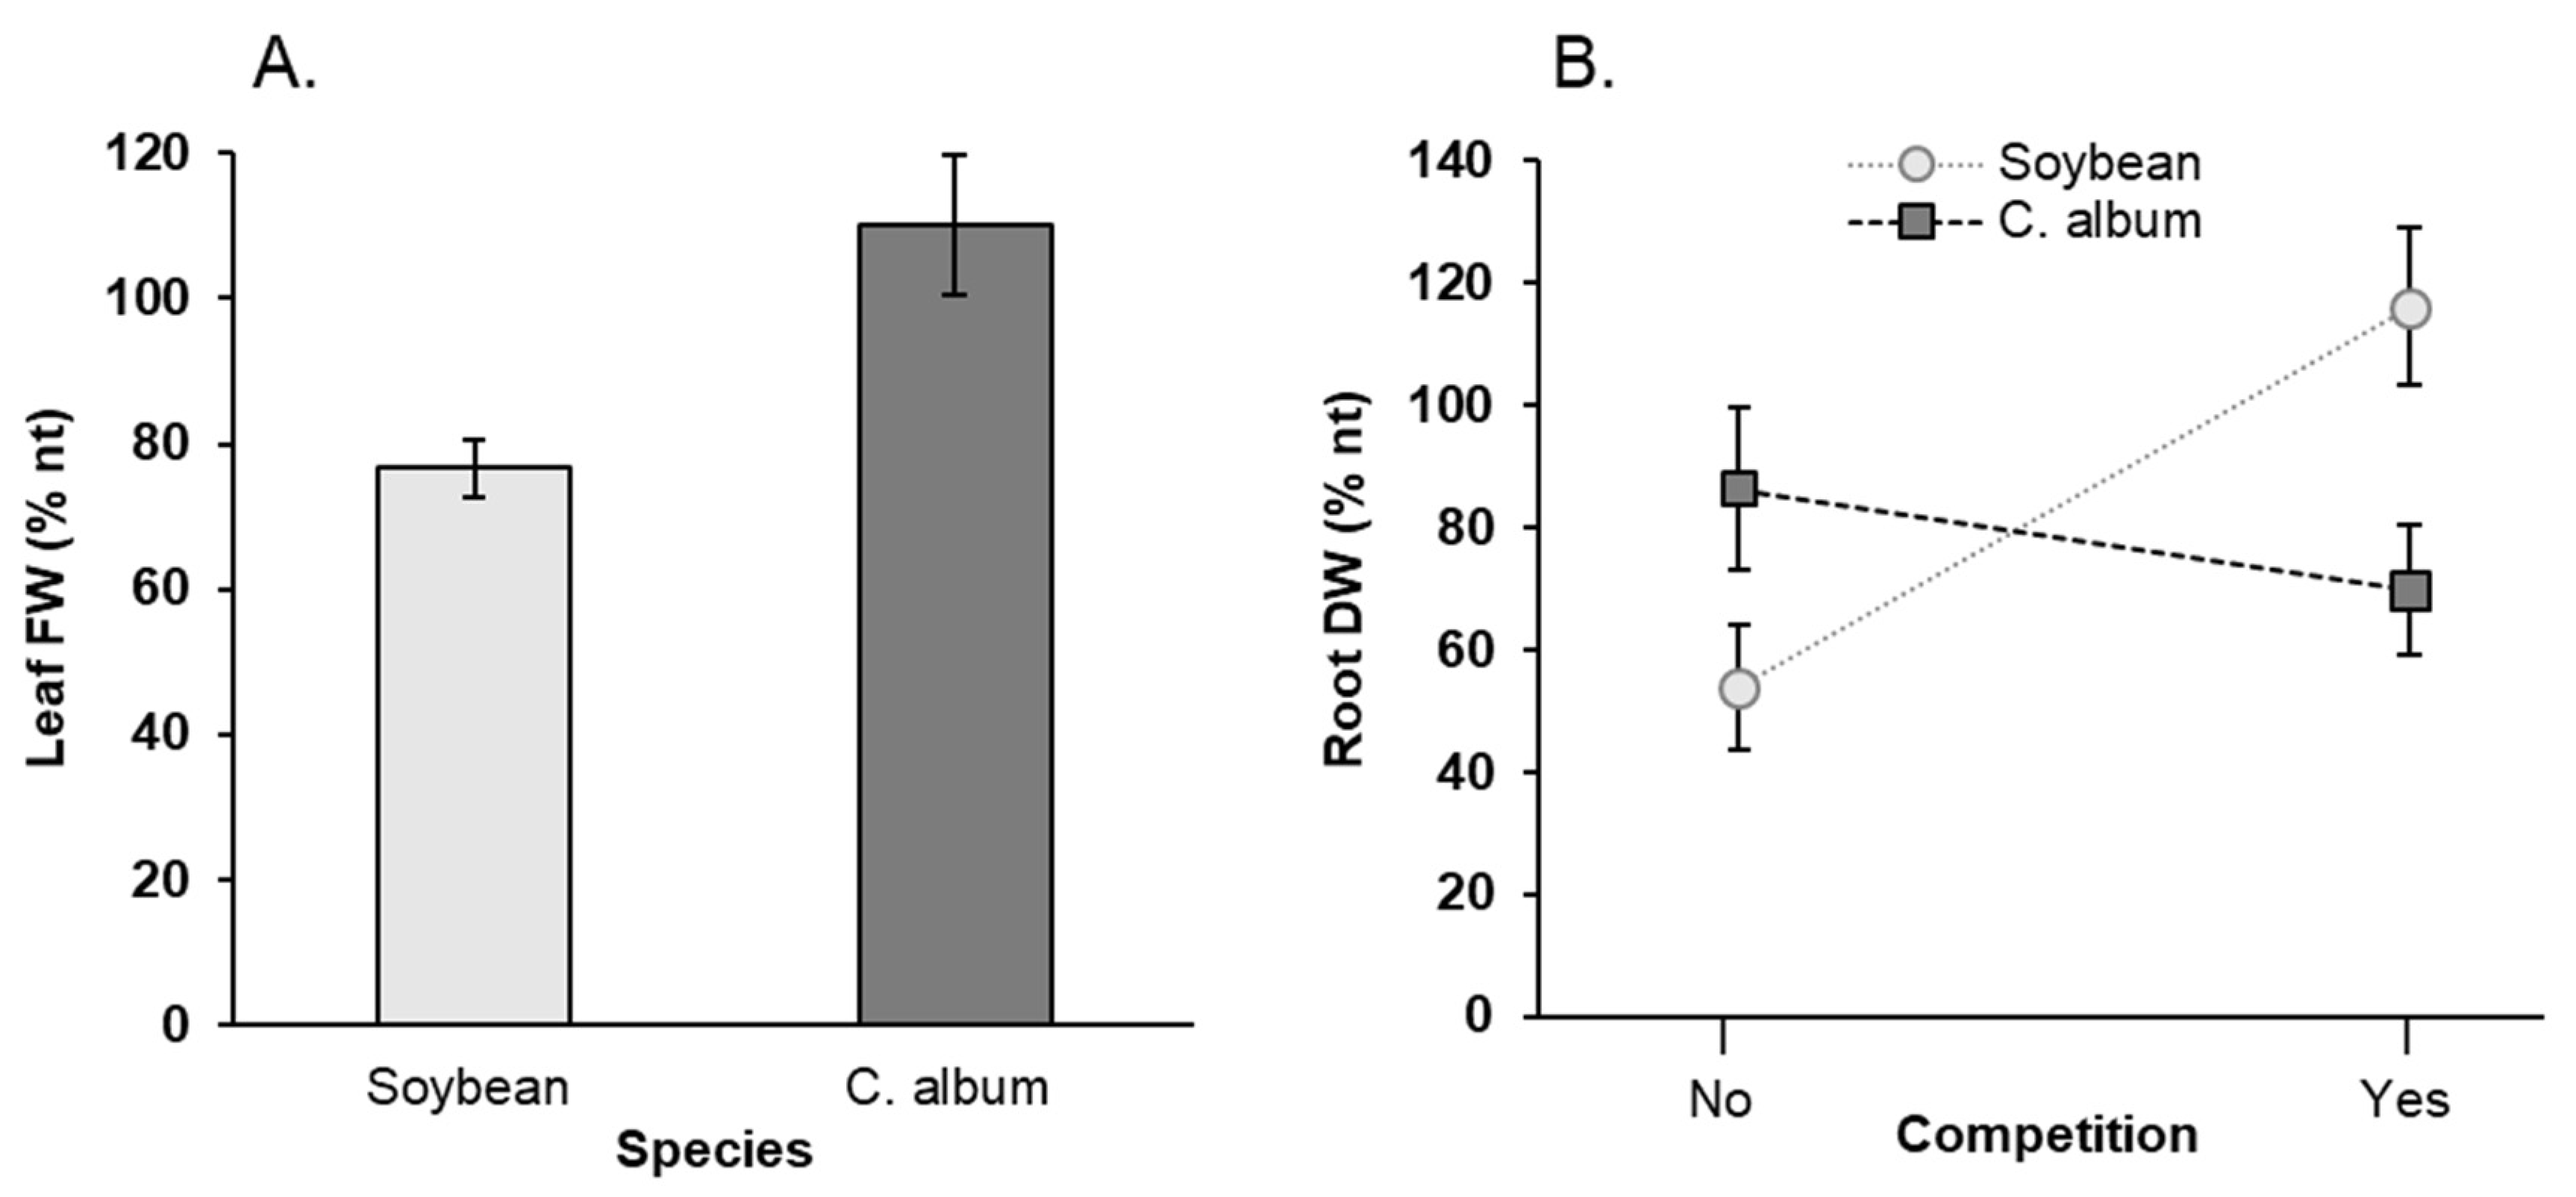
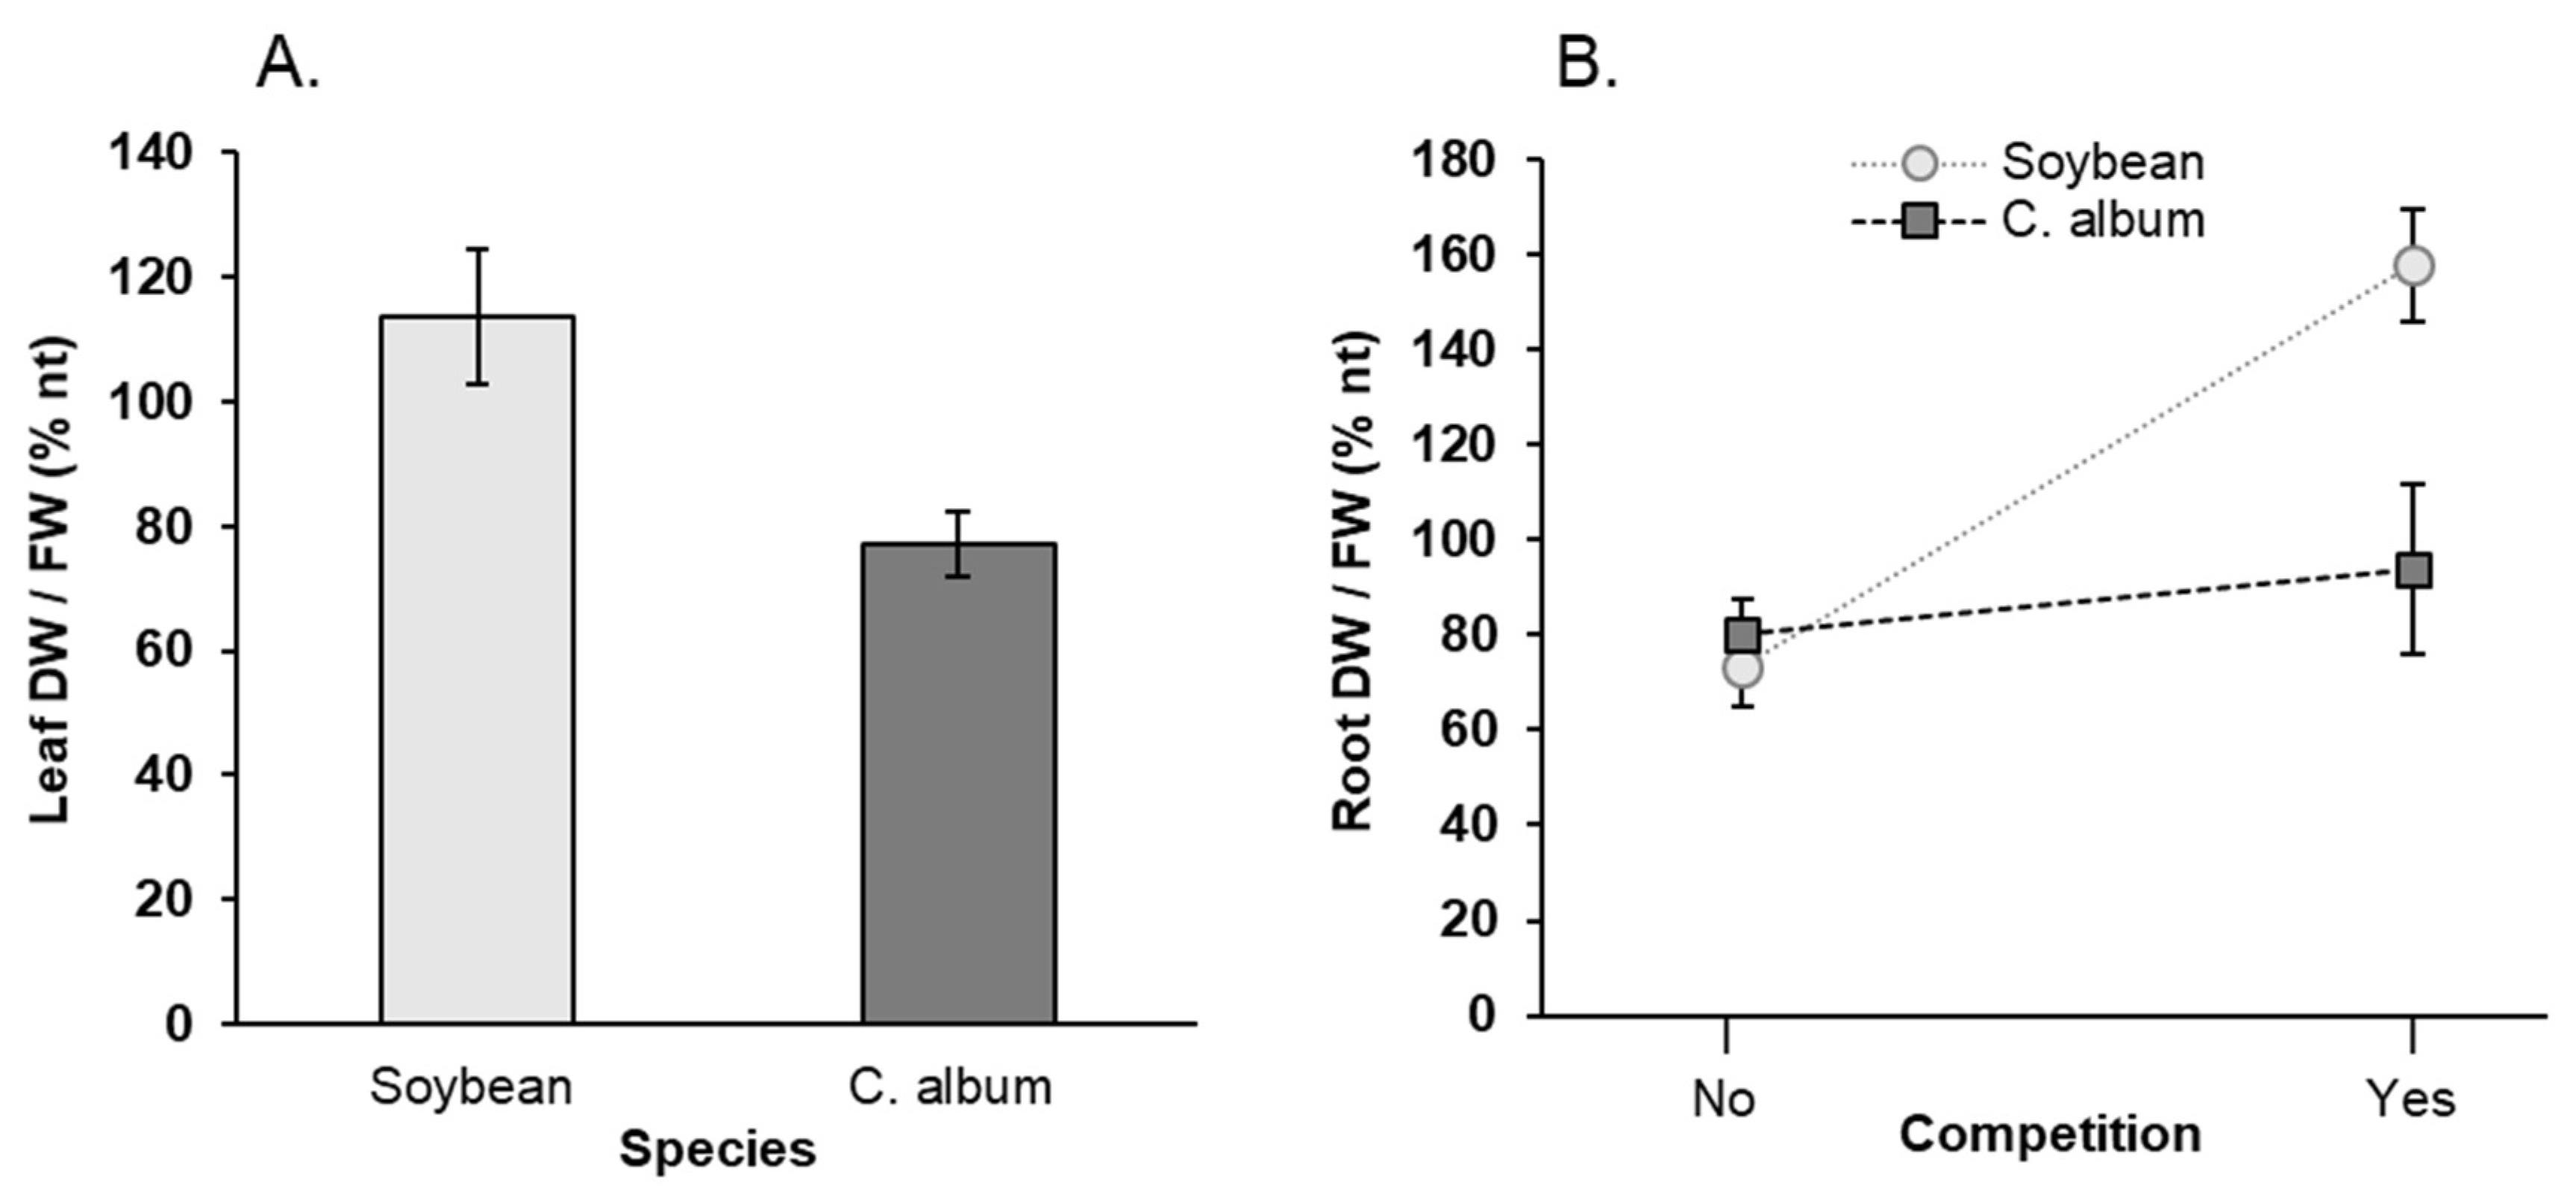
3.1. Effect of NaCl, Plant-Competition and Combination of Both on Plant Biomass

The fresh leaf and root biomass of soybean plants subjected to salinity stress were significantly reduced compared to the relative NaCl-untreated controls (minus and plus C. album) (Figure 2A,C). In the absence of NaCl, a slight decrease of soybean leaf and root fresh biomass was observed when plants were held in the mixed group.
NaCl impaired the leaf and root dry biomass of soybean plants grown separately from C. album (Figure 2B,D). The leaf dry biomass was also reduced by the crop’s coexistence with the weed, but the decrease was not significant in this case (Figure 2B). In contrast, the root dry biomass of soybean was impaired when plants were grown with C. album without any further negative effect due to NaCl (Figure 2D). With respect to C. album, no appreciable differences in leaf and root biomass were evident depending on the growth set-up (single or mixed), NaCl application or the combination of both factors (Figure 2A–D).
When data of fresh and dry biomass of salt-treated plants were computed over untreated plants (% nt), a significant difference between species was determined for fresh leaf matter only, with C. album displaying higher mean values (Figure 3A, Table 2A). Even though no differences were detected either between species or between the single-species and mixed growth set-up, the interaction between species and competition was significant in terms of dry root biomass. In fact, the % nt of C. album dry biomass increased with competition, as opposed to soybean (Figure 3B).
The difference between species was also significant for the plant water content (Figure 4A,B). In particular, higher leaf DW/FW ratios in soybean were indicative of lower water content in leaves (Figure 4A). With respect to root DW/FW ratios, the competition and interaction factors were significant. In fact, the root water content of soybean was lower (i.e., higher DW/FW ratios) than C. album in the mixed-species tanks and higher than C. album in the single-species set-up, but both species showed a lower root water content (i.e., higher DW/FW ratios) in the presence of competition (Figure 4B).

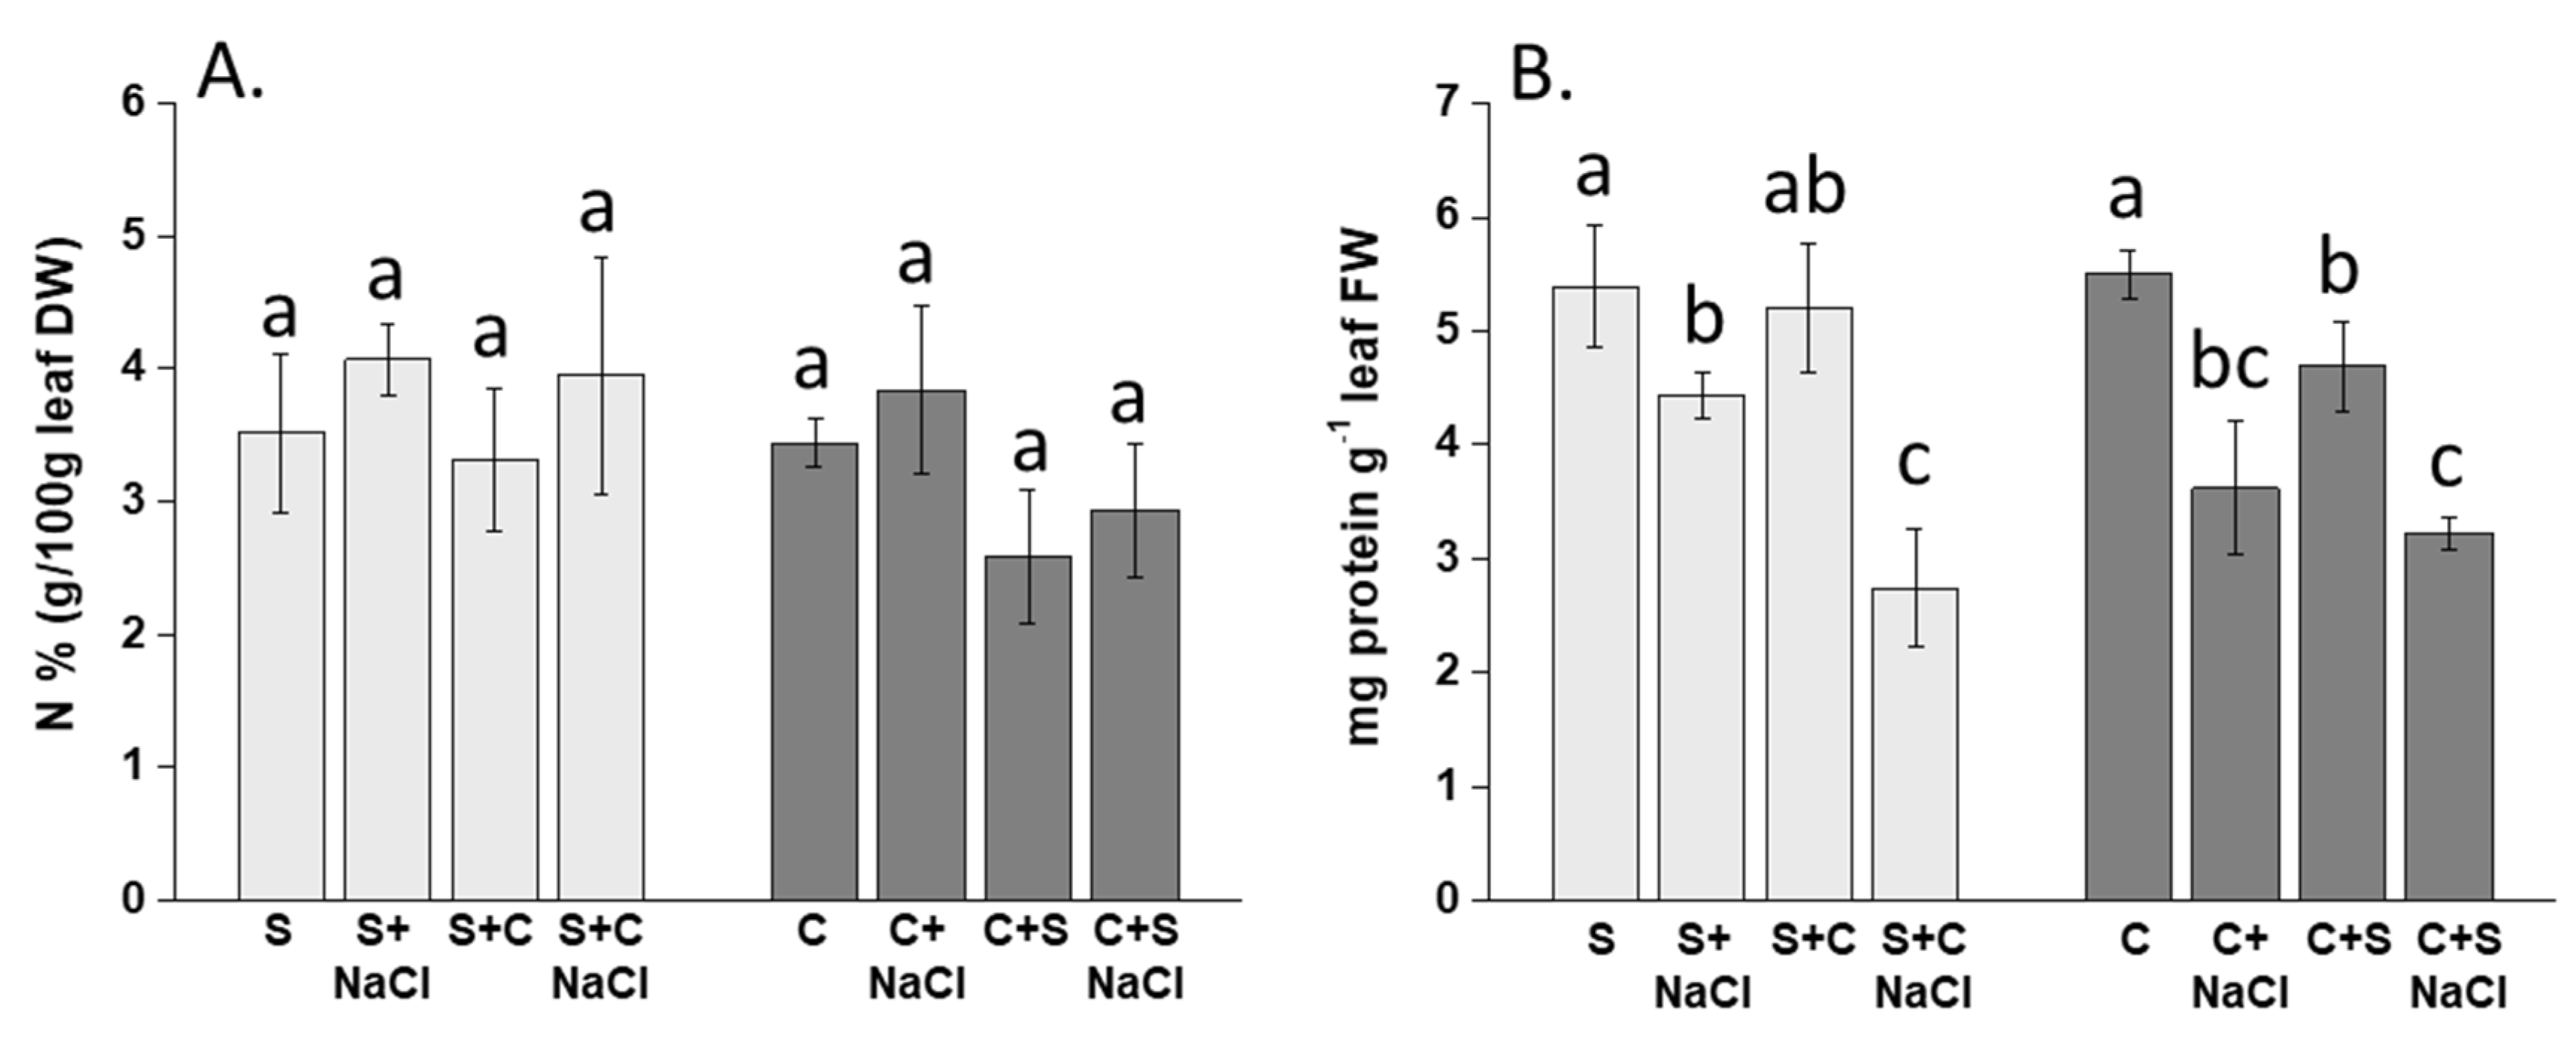
3.2. Effect of NaCl, Plant-Competition and Combination of Both on the Content of N and Soluble Proteins

No relevant changes in N contents were observed in soybean and C. album plants, irrespective of NaCl treatment and/or the growth set-up (Figure 5A). Feeding plants with NaCl caused a decrease in protein accumulation in both species (Figure 5B). However, such a reduction was particularly pronounced (about 50% relative to the control) for soybean plants settled in the mixed set-up. With respect to C. album, the coexistence with soybean did not cause a further decline of protein accumulation compared to the salinity stress condition alone (Table 2B).

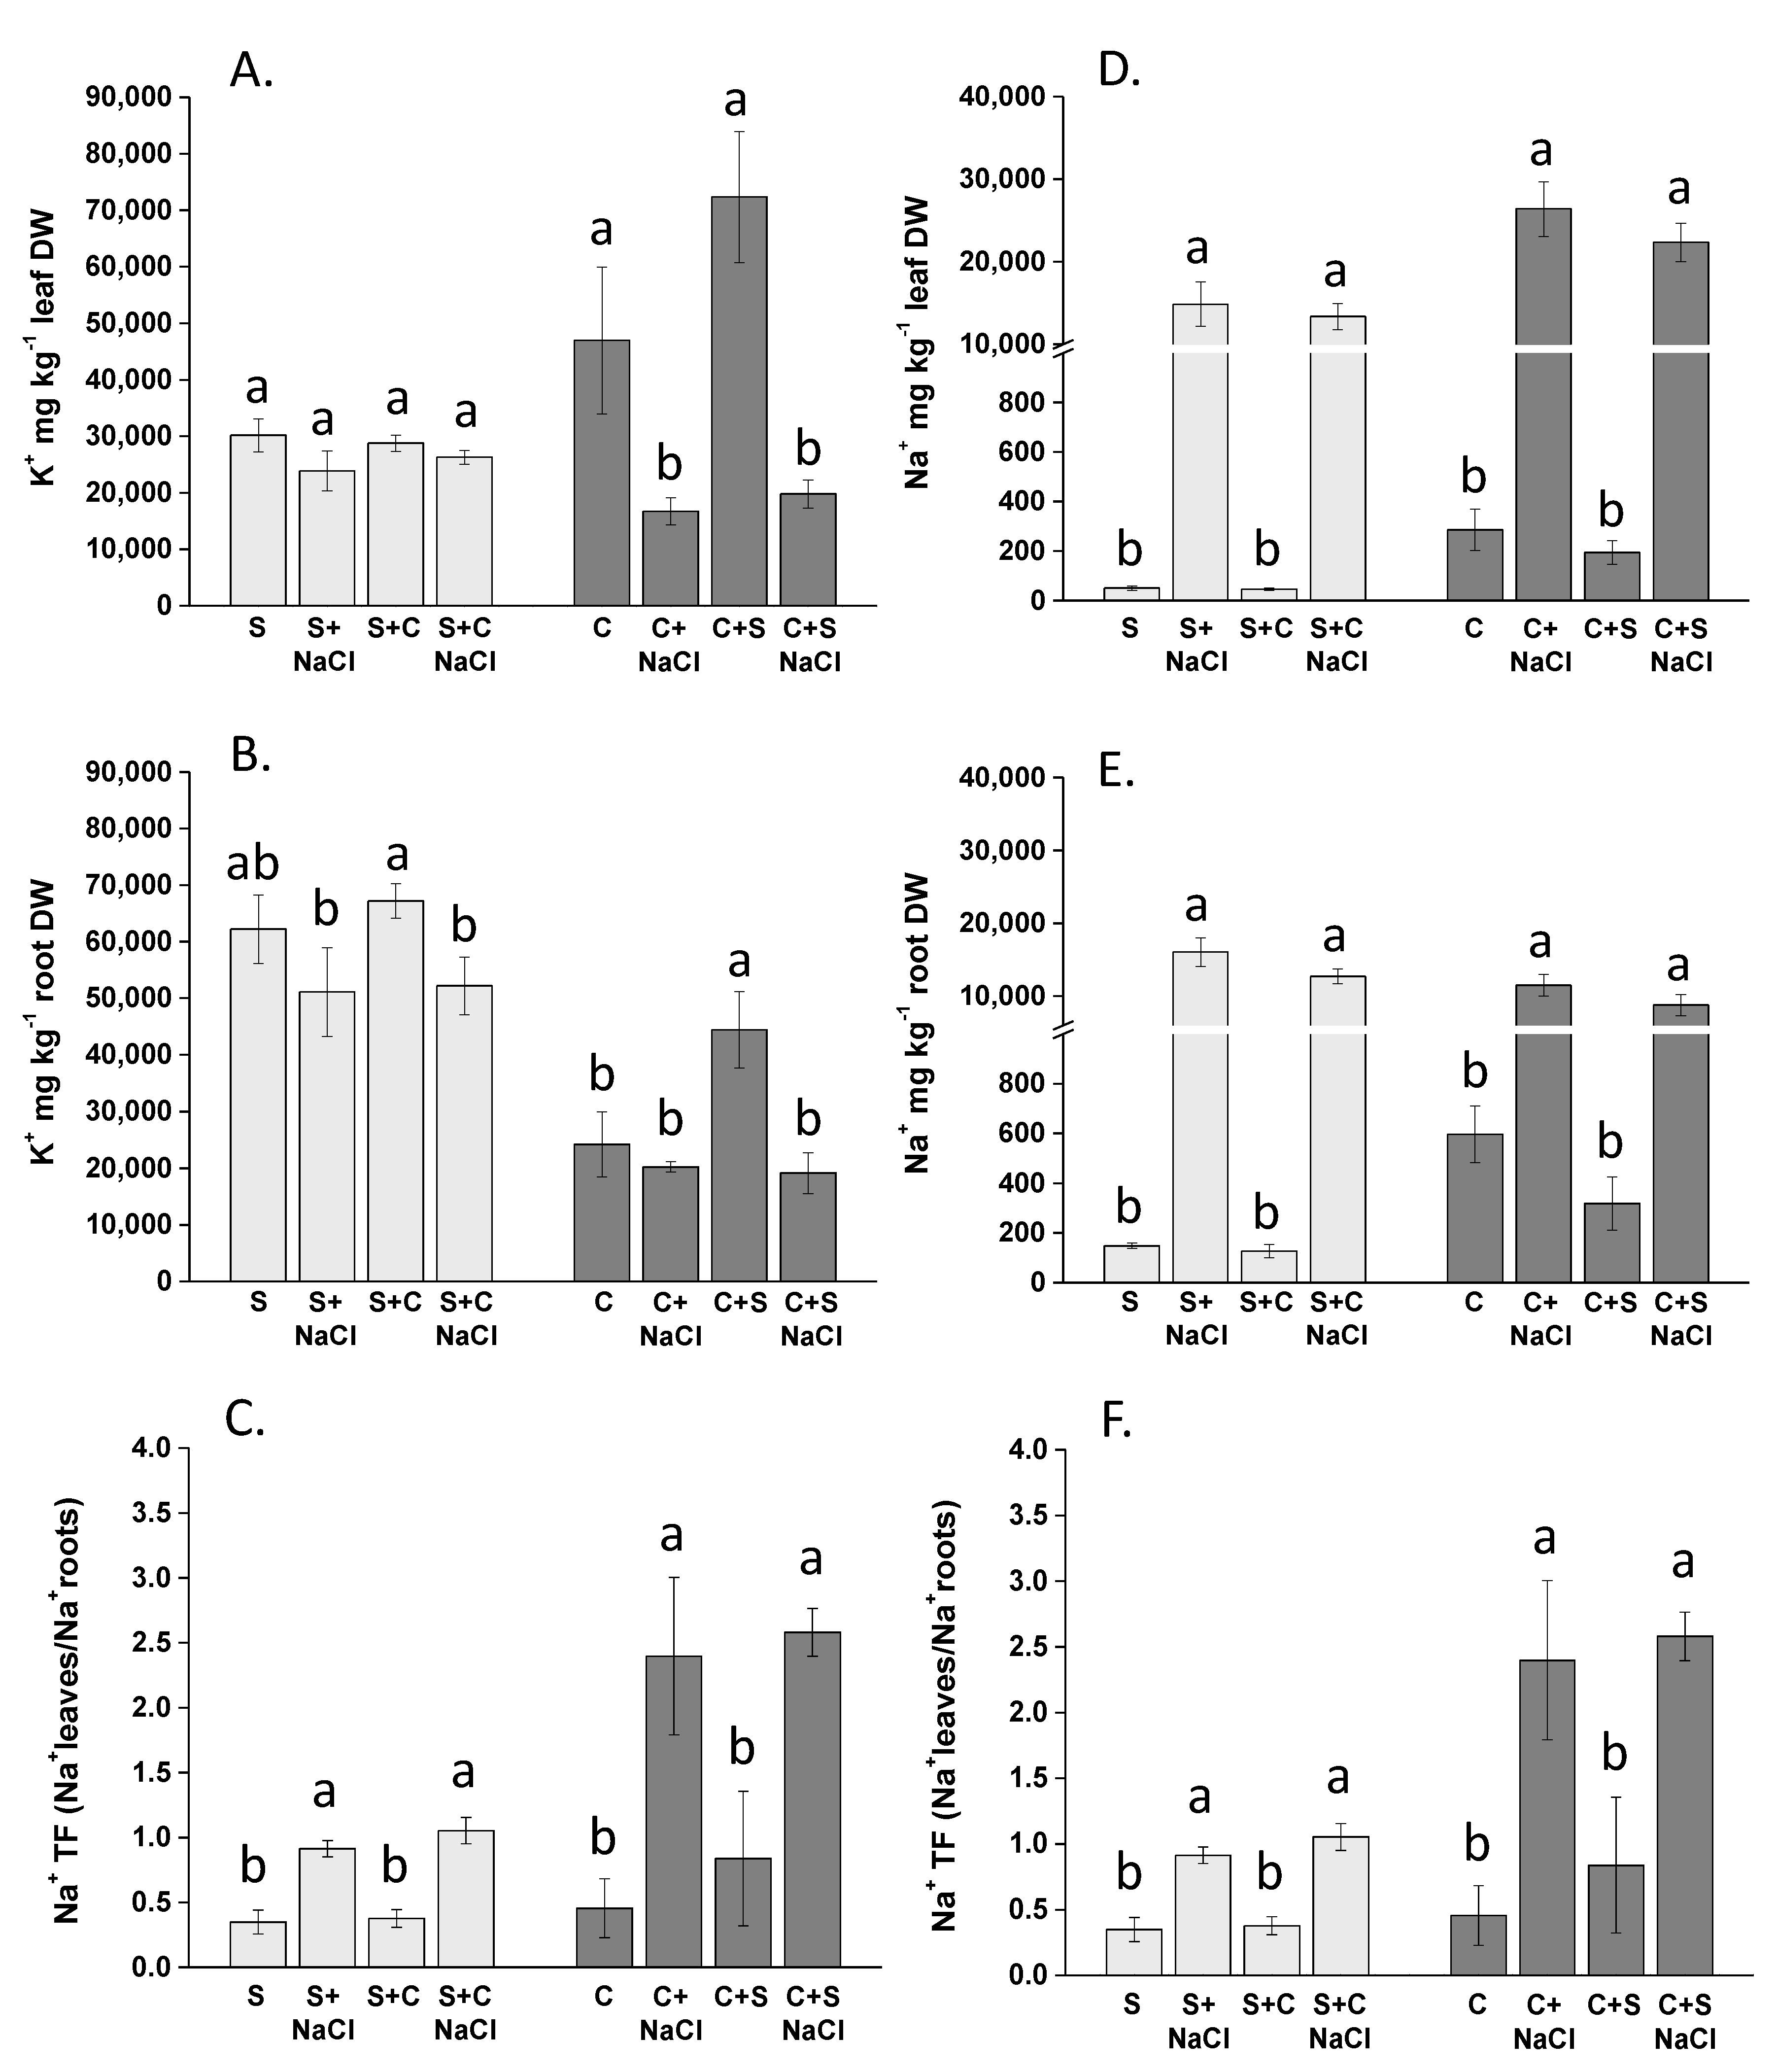
3.3. Effect of NaCl, Plant-Competition and Combination of Both on Na+ and K+ Accumulation

C. album plants exhibited a very high capacity to accumulate Na+ in leaves, while root Na+ concentration was similar as in soybean (Figure 6A,B). Consequently, the translocation factor (TF) of Na+ was about two-fold higher in C. album than in soybean (Figure 6C). Furthermore, in the absence of NaCl, C. album plants contained from two- to three-fold more Na+ than soybean. The co-cultivation set-up did not significantly modify Na+ accumulation by both species.
The distribution of K+ also differed between soybean and C. album (Figure 6D,E). Soybean plants contained less K+ in their leaves compared to C. album under no salt treatment, and no significant variation was evident when NaCl was applied (Figure 6D). Conversely, C. album plants contained very high K+ concentrations in leaves, which were though severely decreased by NaCl application regardless of the growth set-up. Soybean plants contained more K+ in roots compared to C. album, but NaCl caused the reduction of K+ accumulation in both species when co-cultivated (Figure 6E). Consequently, the TF of K+ was greater in C. album than in soybean but declined when plants received NaCl (Figure 6F). Interestingly, the cohabitation of both species improved the capacity of C. album to maintain K+ in roots and leaves when plants were not treated with NaCl (Table 3). The increase of Na+ accumulation and concomitant decrease of K+ content in C. album plants accounted for the approximately two-fold-higher Na+/K+ ratios determined in this species compared to soybean.
Data expressed as % nt confirmed the existence of relevant differences between soybean and C. album in terms of Na+ and K+ contents in roots and leaves (Table 2C). With respect to K+ root content (% nt), a significant difference was also found between the single-species and mixed set-up, and for the interaction between species and competition (Table 2C). In the presence of competition, the decrease in K+ root content was more pronounced in C. album than in soybean.

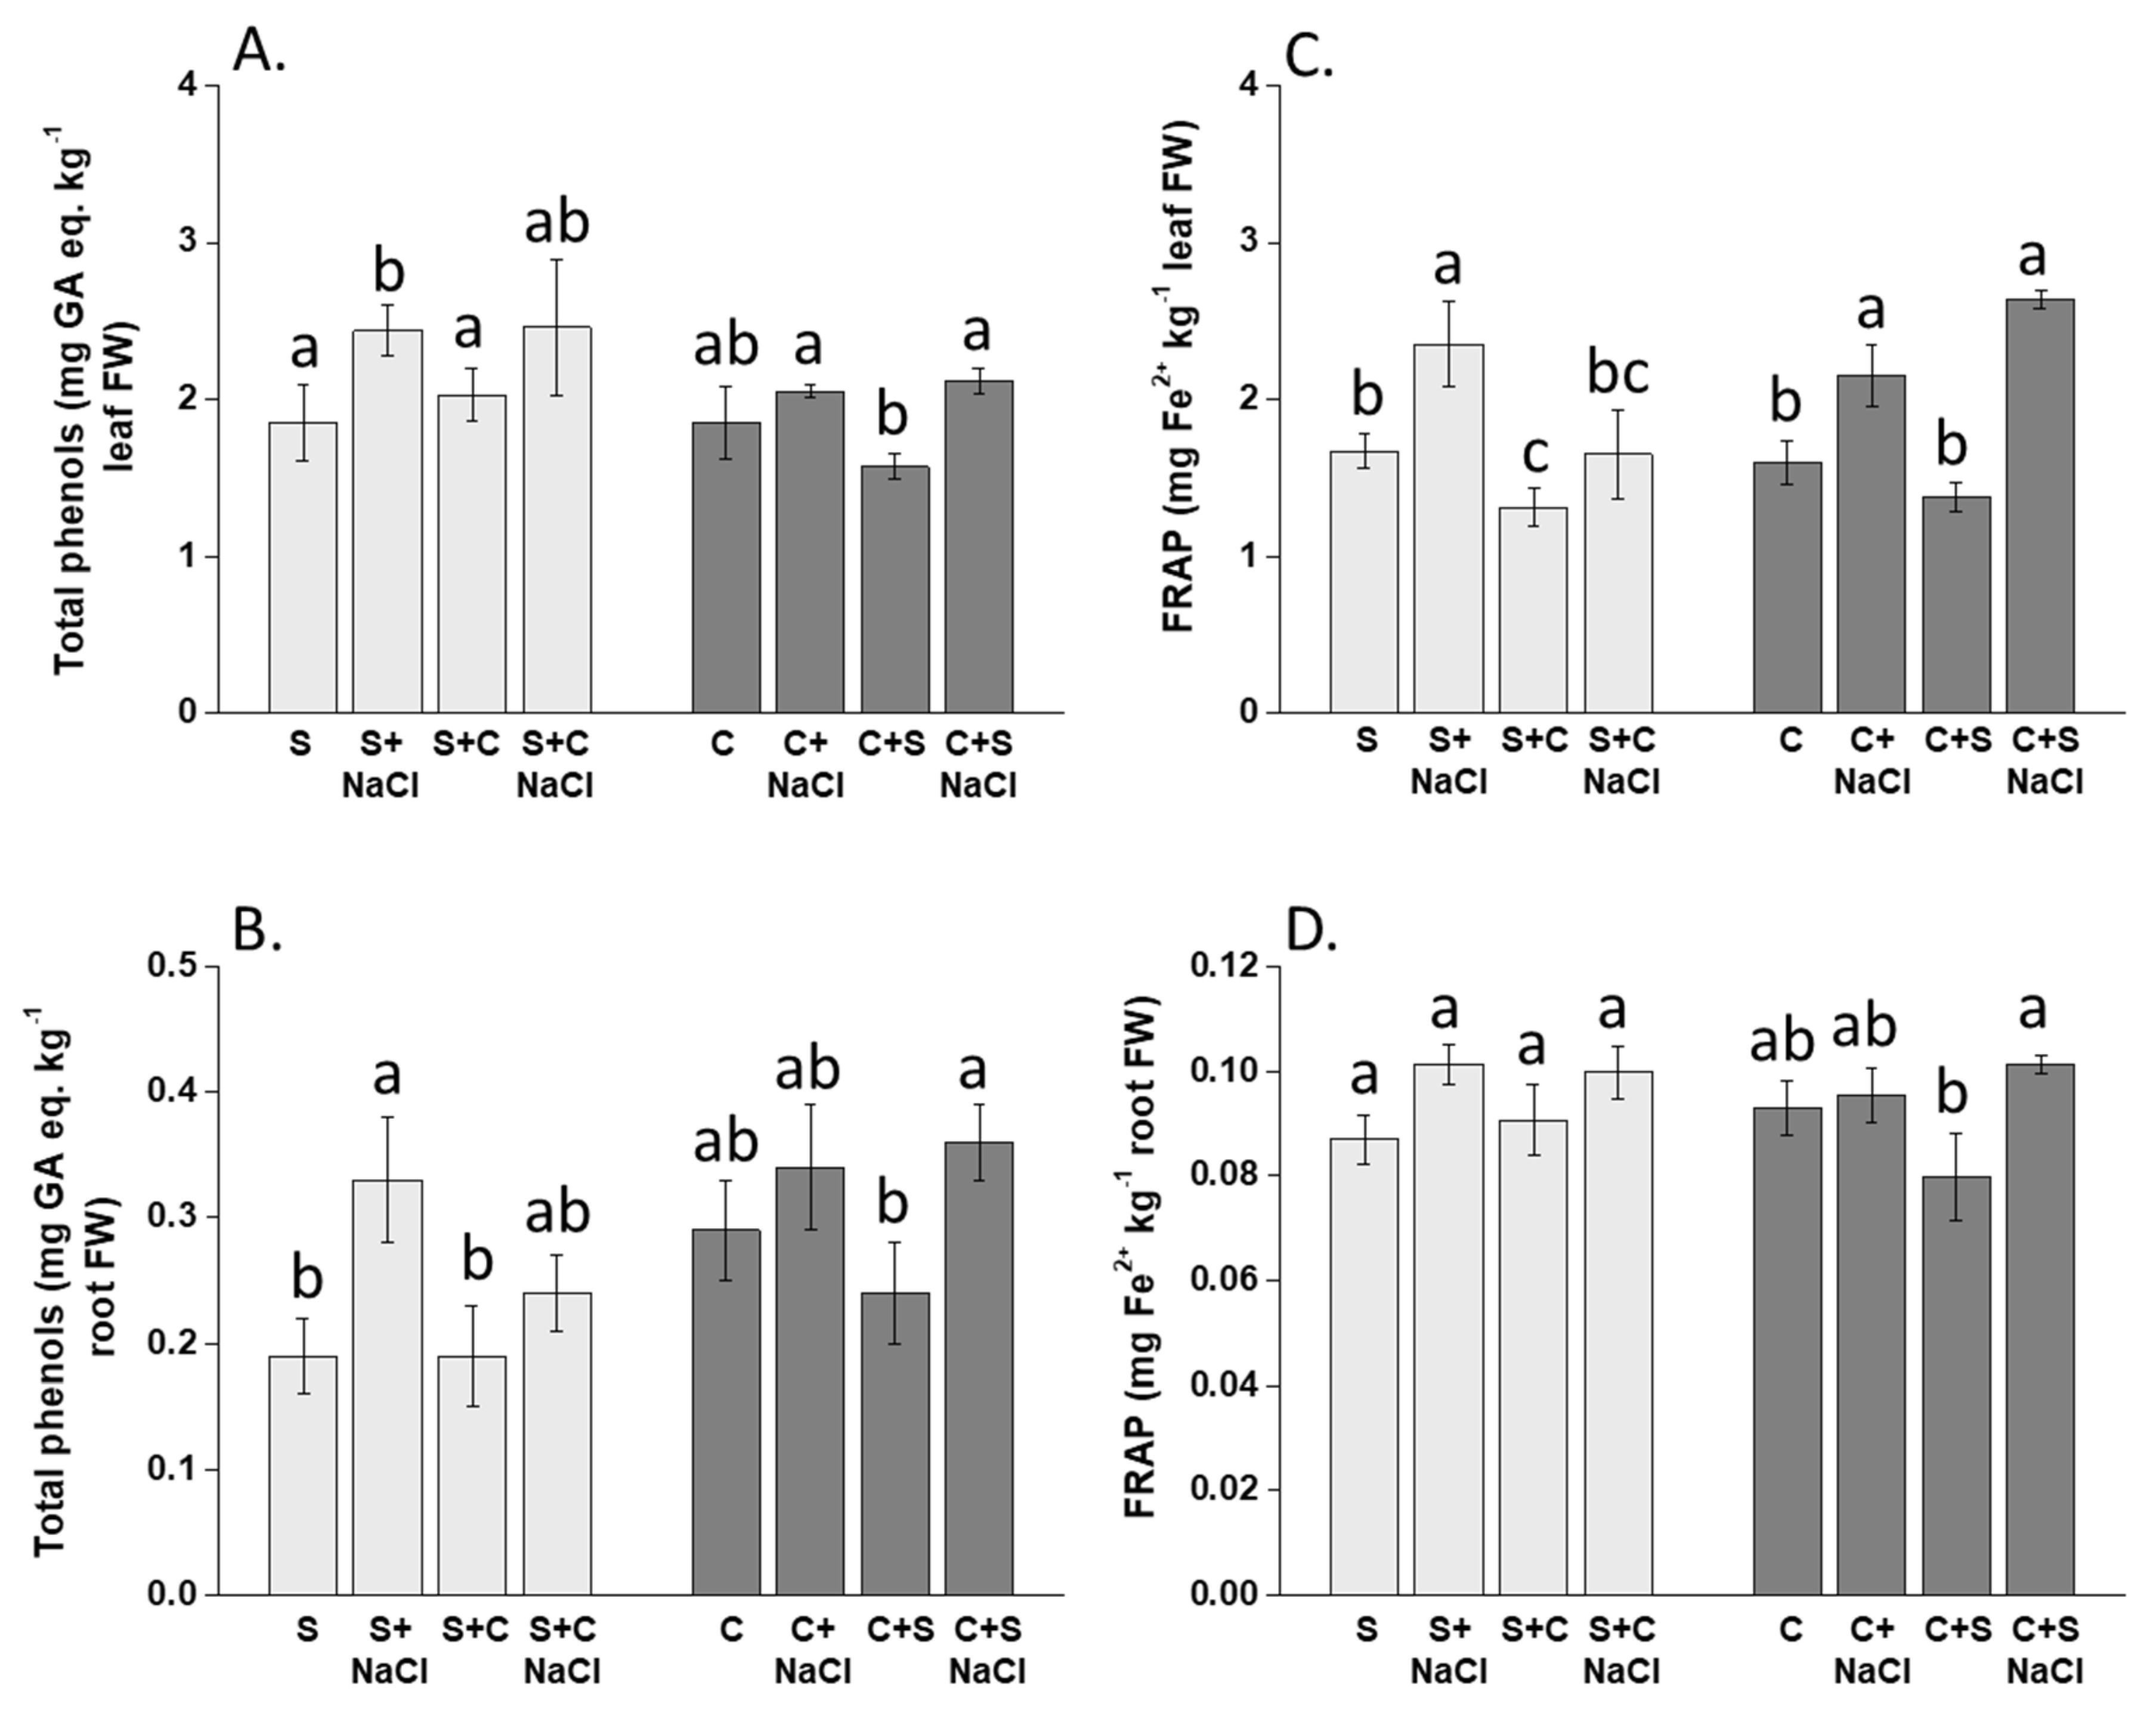
3.4. Effect of NaCl, Plant-Competition and Combination of Both on the Content of Phenolic Compounds and Plant Antioxidant Capacity (FRAP)

The leaf and root content of phenols was appreciably increased by NaCl in soybean plants belonging to the single-species group (Figure 7A,B). Such an effect was also evident in C. album plants cultivated in the mixed set-up. The trend of the plant antioxidant activity, which is reported as FRAP, was similar to that described for phenols (Figure 7C,D).
In terms of % nt, phenols in leaves were not significantly different according to the species and growth set-up (Table 2D). However, the interaction between species and competition was significant for phenols in roots and FRAP in leaves and roots. FRAP in leaves was also different between species (Table 2D).

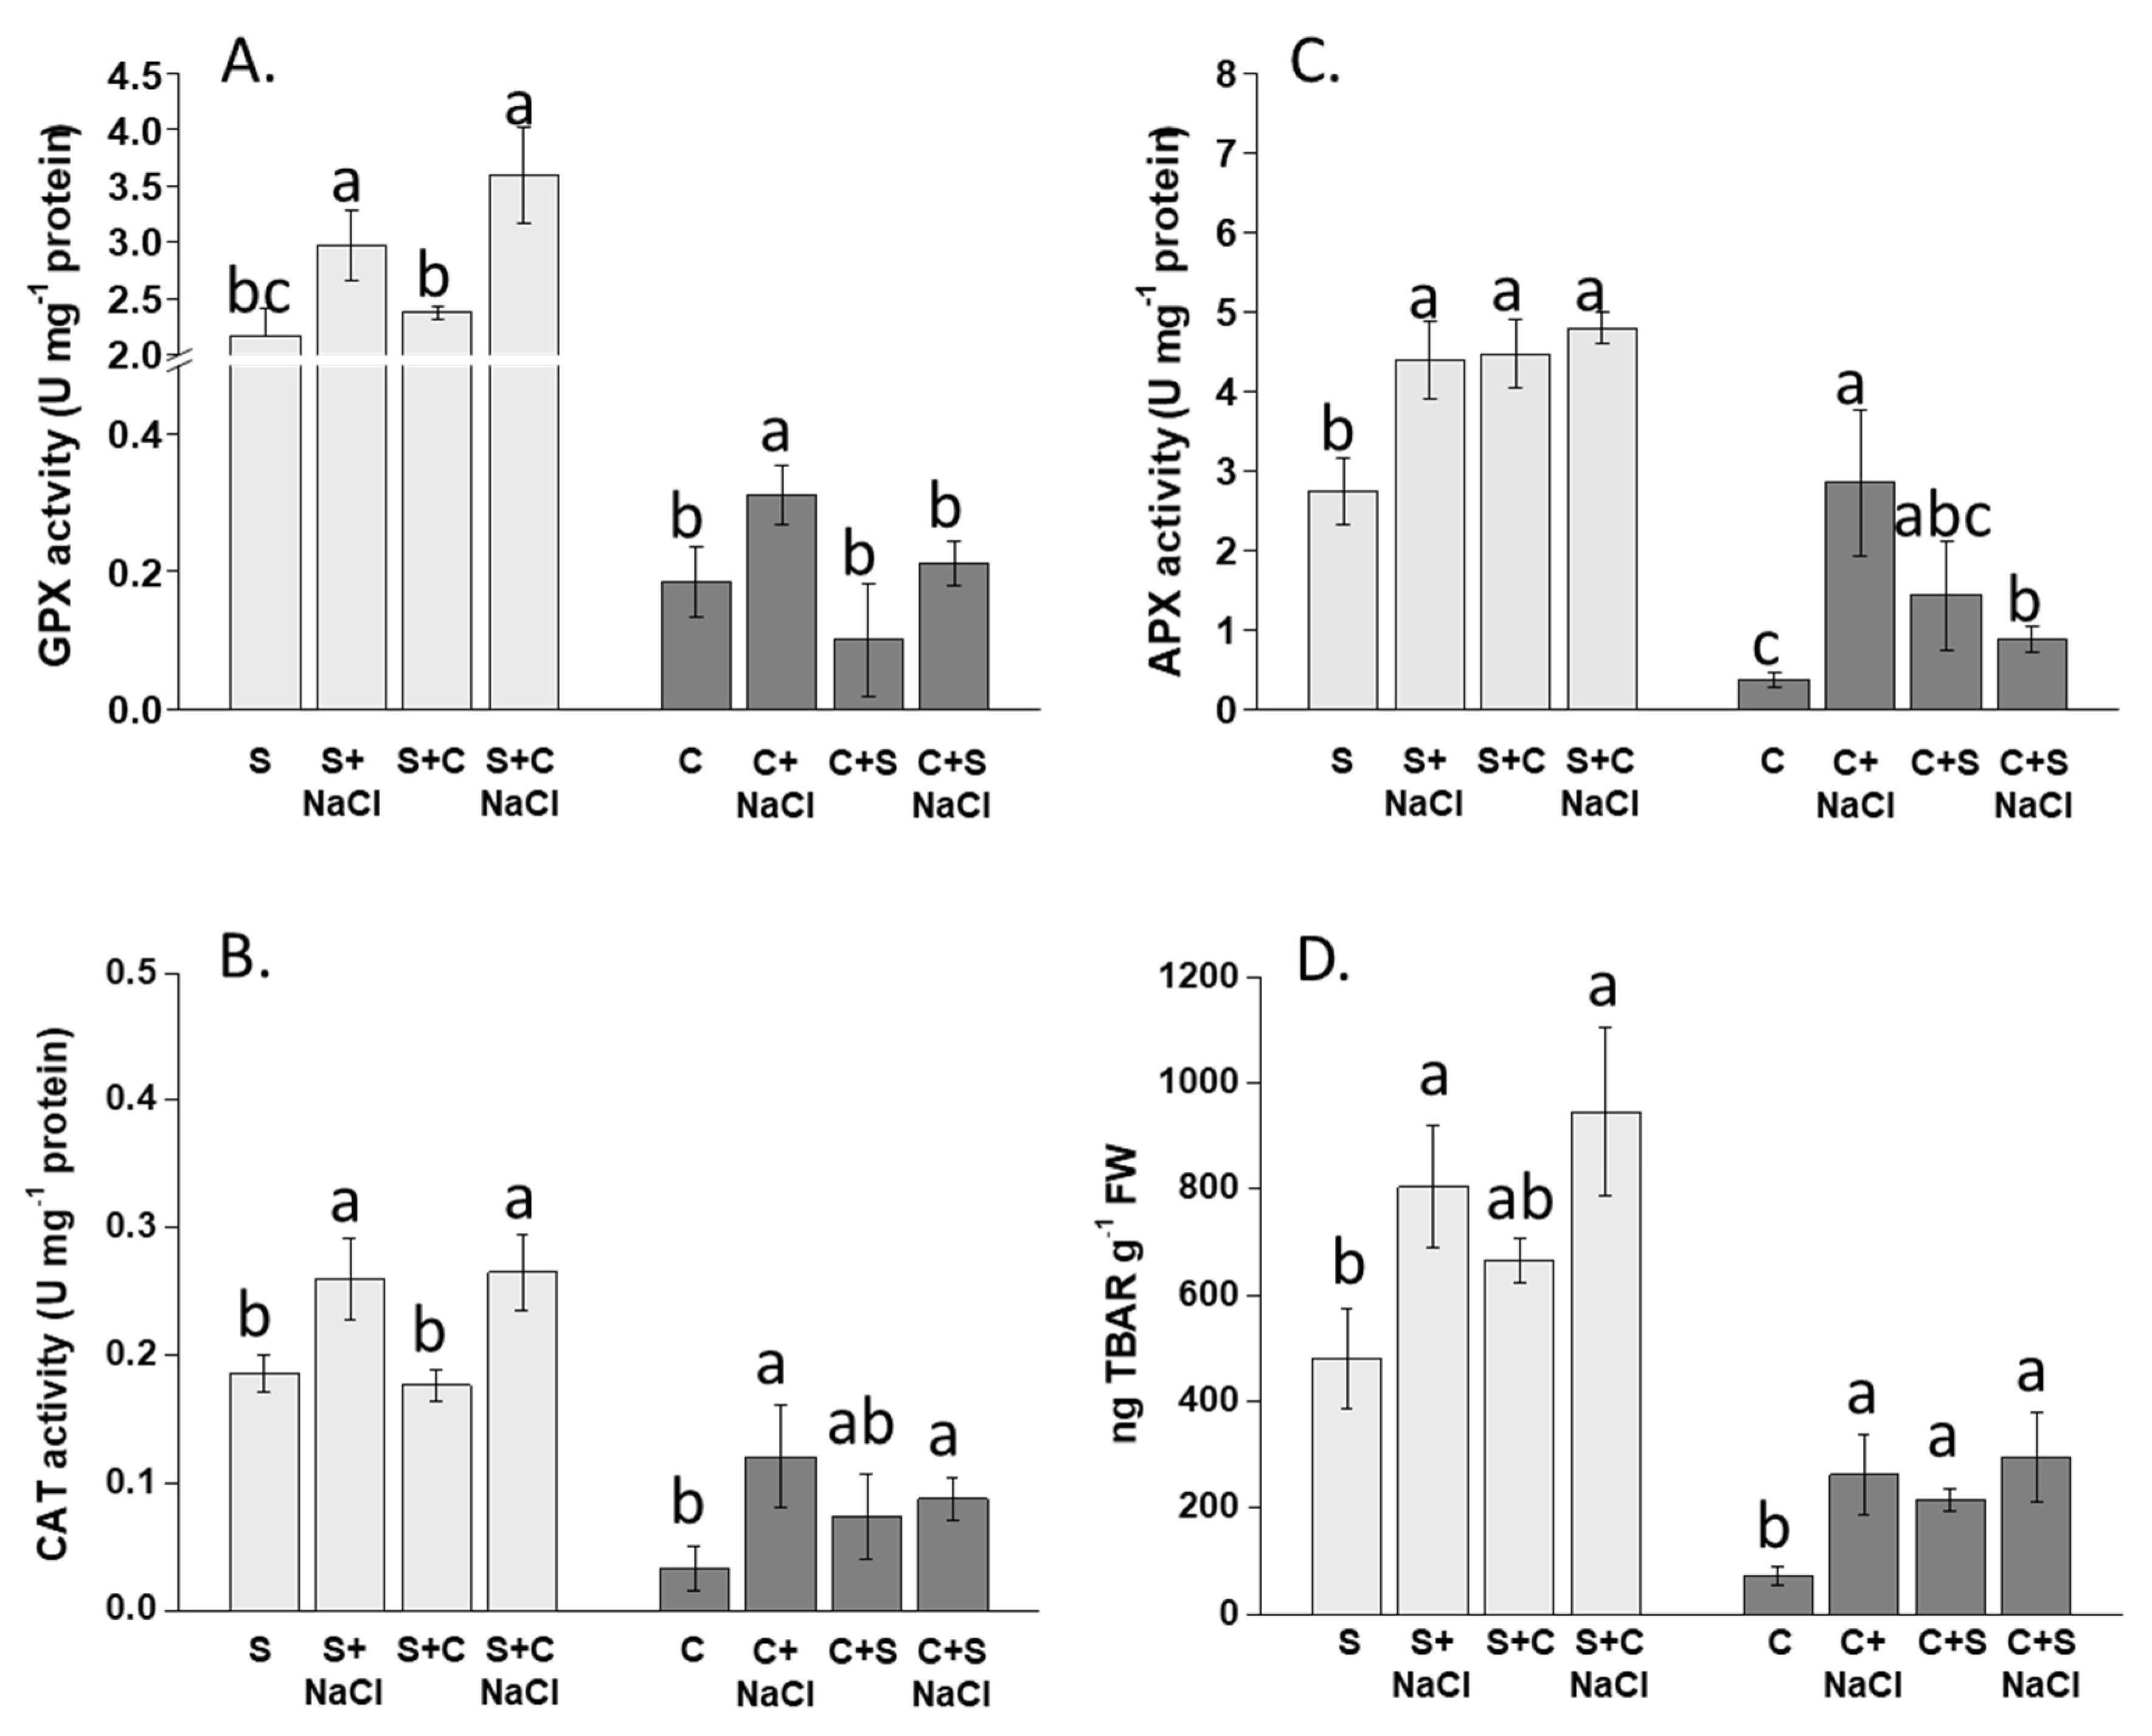
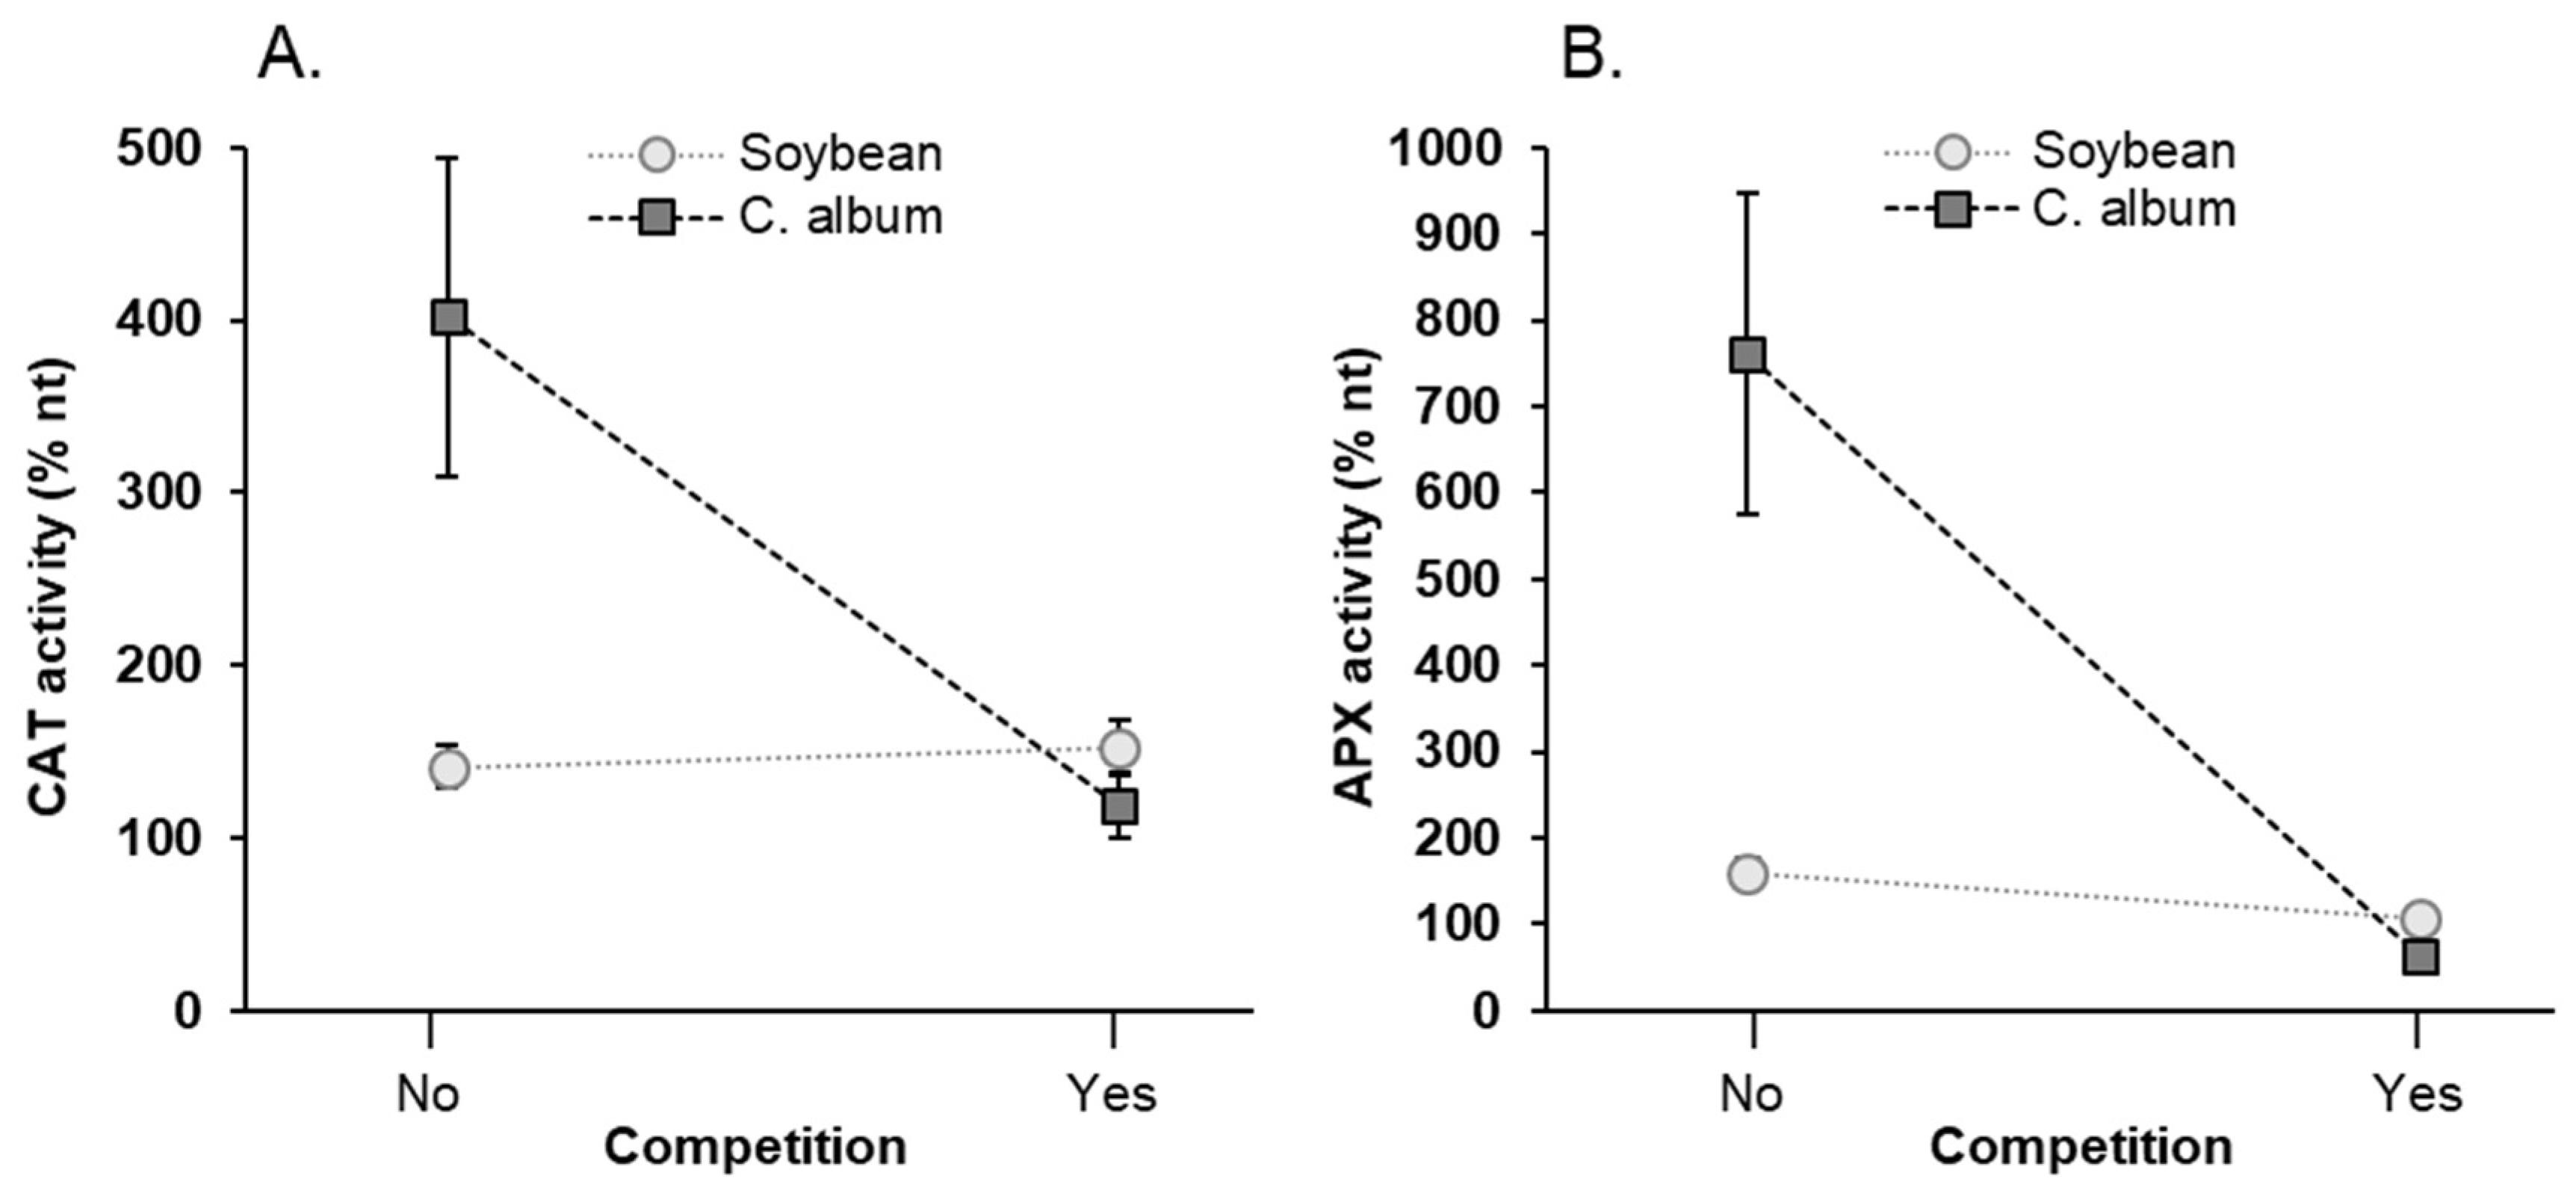
3.5. Effect of NaCl, Plant-Competition and Combination of Both on Antioxidant Enzyme Activity (GPX, APX, CAT) and Lipid Peroxidation

The activity of antioxidant enzymes was generally more pronounced in soybean than in C. album. In more detail, NaCl application increased the activity of GPX and CAT enzymes in soybean (Figure 8A,B), while APX activity was enhanced by either NaCl or co-cultivation with C. album (Figure 8C). The increase in activity of antioxidant enzymes due to NaCl was also observed in C. album plants of the single-species set-up (Figure 8A–C), while CAT and APX activities were higher in C. album co-cultivated with soybean, either with or without NaCl, than in plants of the single-species and NaCl-untreated group (Figure 8B,C).
Lipid peroxidation was lower in C. album compared to soybean plants. However, in both species, lipid peroxidation was significantly intensified by NaCl in the single-species set-ups (Figure 8D). Increased lipid peroxidation was also observed in C. album co-cultivated with soybean without NaCl treatmnt.
With reference to % nt, a significant difference between the two species was found for APX, GPX and CAT activity (Table 2E). CAT (Figure 9A) and APX (Figure 9B) also showed a relevant difference between single-species and mixed set-up and a significant interaction between species and competition factors (Table 2E). In the case of lipid peroxidation, a substantial difference in % nt was recorded only for the competition factor (Table 2E).

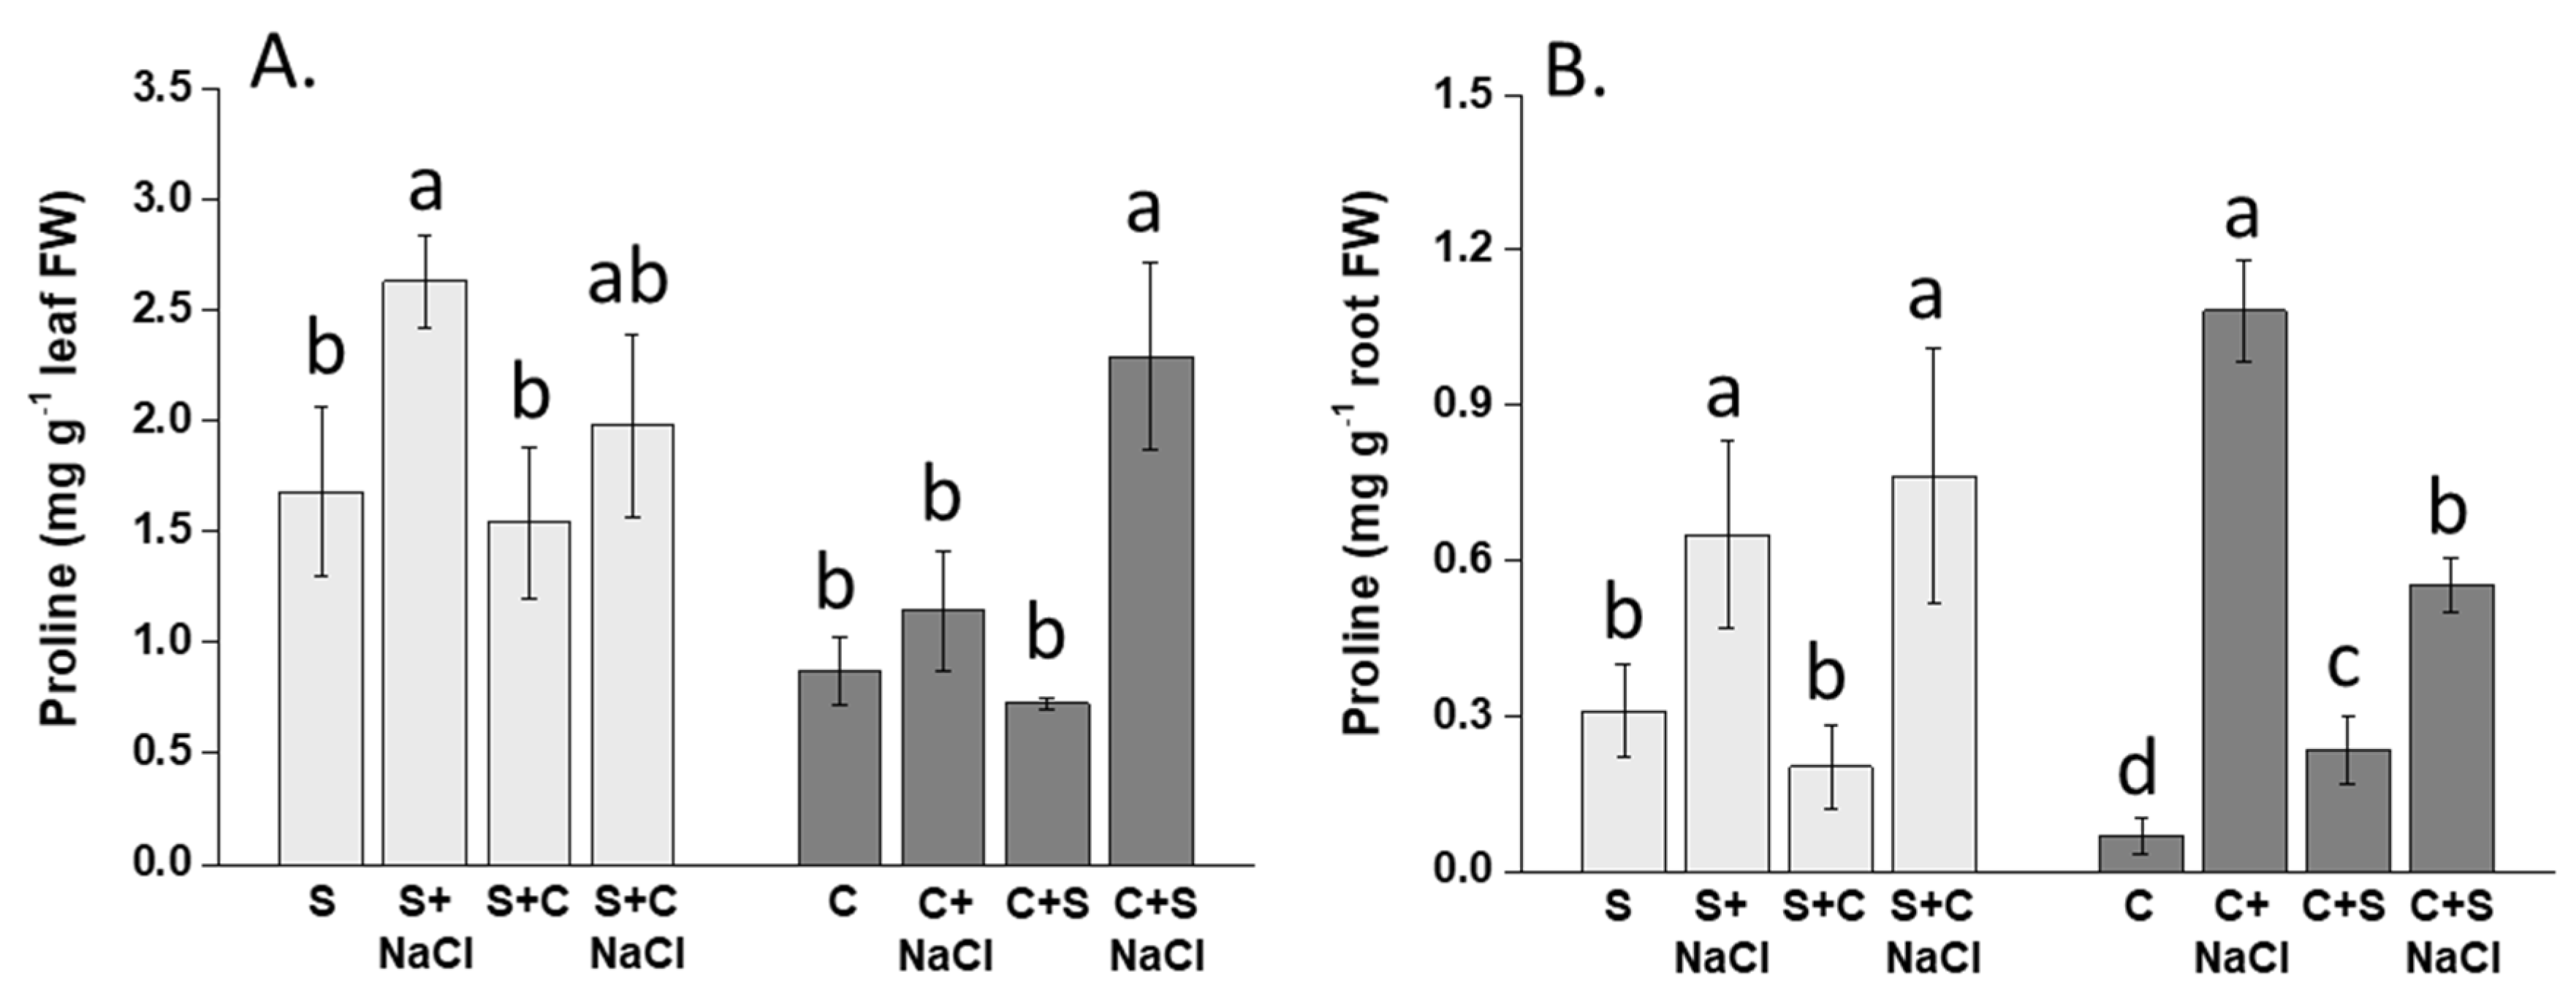
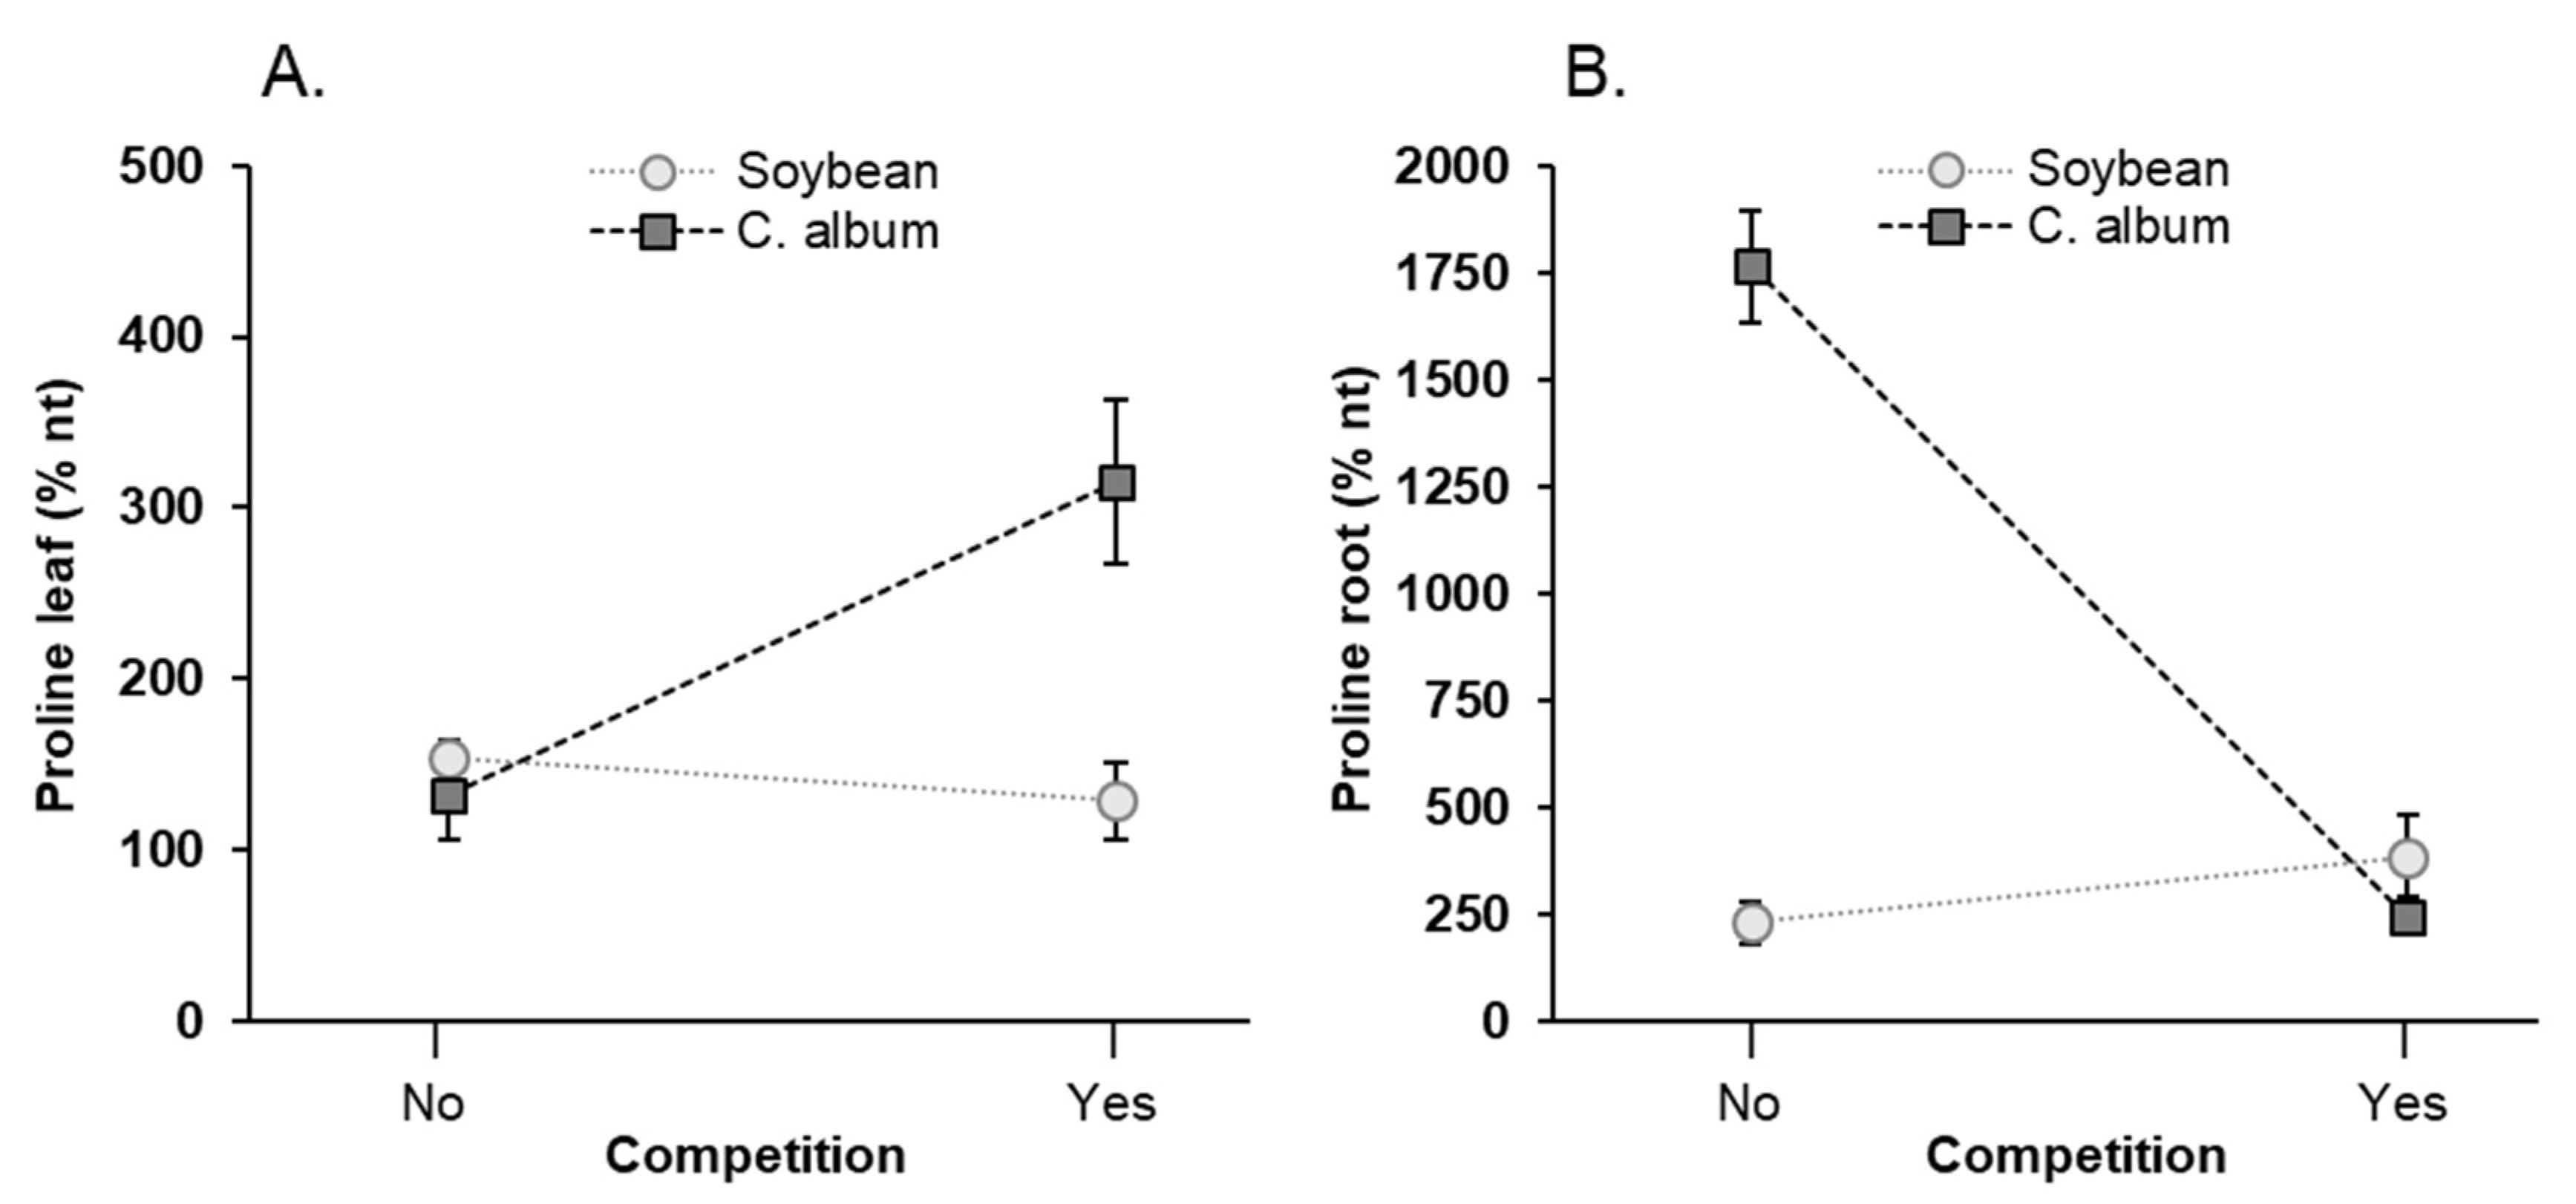
3.6. Effect of NaCl, Plant-Competition and Combination of Both on Proline Accumulation

The addition of NaCl caused the accumulation of proline in leaves of soybean, which was, however, significant only when plants were grown without C. album. Conversely, C. album plants subjected to NaCl treatment contained more proline in leaves when co-cultivated with soybean (Figure 10A). Root proline content was significantly increased by NaCl in both species regardless of the growth set-up. The most pronounced effect was evident in C. album plants treated with NaCl in the single-species arrangement. Combining C. album and soybean in the absence of NaCl also caused the increase, although moderate, in root proline content compared to the individual species growth set-up (Figure 10B).
In terms of % nt, a significant difference was found for species and competition, and the interaction between species and competition (Table 2F), with opposite behavior for leaves and roots. The leaf proline relative content (+NaCl/−NaCl) was higher in soybean than in C. album when plants were grown in the single set-up, while content was lower in the presence of competition. The opposite trend was observed for root proline content (Figure 11A,B).

4. Discussion

This study aimed to evaluate whether salinity impacts crop and weed competition, which, in turn, might affect the crop resilience to salt stress and require adjustments of weed management strategies in the global warming framework. To better understand how crops and weeds possibly disturb each other while responding to NaCl, we chose the hydroponic set-up as a simplified system for plant growth.
Our results indicate that soybean plants suffered from salt stress, as revealed by the impairment of leaf and root biomass. This is consistent with the literature that recognizes soybean as a salt-sensitive glycophyte [5]. We also observed a decrease in root dry biomass of soybean plants grown with the weed. It is known that C. album is a very strong competitor of soybean, especially in the case of early weed emergence [24,25], and its interference with crops was previously postulated to depend on various factors, including nutrient competition and allelopathy. In this study, the reduction in root dry biomass of NaCl-untreated soybean plants of the mixed set-up was not due to competition with C. album for nutrient foraging, because the amount of nutrients in tissues was similar to that measured in soybean plants settled in the single-species group. It is possible that the weed released substances through exudates that impaired the development of the neighboring crop. Indeed, C. album was formerly found to reduce the growth of other crops such as rapeseed [30], sunflower, tomato [31] and rice [32] through the release of allelochemicals, which are known to consist mainly of phenolic acids (e.g., ferulic acid) [33]. Also, Namvar et al. [34] reported the inhibitory effect of C. album aqueous extracts obtained from leaves, roots and the whole plant on soybean growth, which was further exacerbated by combining the extracts with NaCl. The synergy of C. album and salt stress in determining significant reduction of soybean growth was, however, not observed during the period of treatment assayed in our study, which was aimed at evaluating short-term responses. We do not rule out that extending the period of treatment may lead to a more pronounced reduction of soybean growth under this condition, especially considering that plants collected at the end of the experiment showed a substantial decrease in the content of proteins.
C. album was confirmed to be a salt-tolerant species, with NaCl unable to affect its biomass and water conservation. Similarly to other halophytes, C. album tolerance to NaCl has been ascribed to various mechanisms, which appear to depend on the intensity of salt stress [22,35]. Yao et al. [36], for instance, observed a preferential uptake of K+ over Na+ in C. album plants treated with mild NaCl stress, and an increase of the K+/Na+ ratio in the cytoplasm and Na+ sequestration in vacuoles under severe NaCl stress. This last process is thought to be crucial in determining the tolerance to salt stress not only of weeds, but also of crops [37]. Other reports have highlighted the extraordinary capacity of C. album to accumulate Na+ in leaves, a process that is also termed “craving for salt” [38]. In our study, C. album displayed a greater capacity of Na+ accumulation and root-to-shoot delivery than soybean, which justified the two-fold-higher Na+/K+ ratios in its tissues, while K+ accumulation in leaves was conversely reduced by NaCl. K+ loss from plants is a common phenomenon under salinity stress, and the capacity of plants to counteract salt-induced harms depends on K+ availability and K+ retention in tissues [39]. K+ losses, however, are generally more pronounced in salt-sensitive than tolerant plant varieties [39,40]. Thereby, our results seem to be at odds with the current literature regarding C. album, but it must be noted that K+ content was very high in the weed not treated with NaCl. Elevated initial levels of K+ possibly counteracted the early negative effects of Na+ accumulation in C. album, thus helping weed maintain the osmotic balance and better acclimate to the adverse salt condition, even though K+ was later partly lost. This hypothesis is plausible considering that the salt-sensitive soybean plants contained less K+ in their leaves, but no K+ losses were evident due to NaCl. In addition, the TF for K+ was always higher in C. album than in soybean, regardless of salinity, which suggests the better ability of C. album to control long-distance K+ transport, either by more efficient xylem loading and delivery to the shoot or minimizing the extent of K+ recirculation in the phloem [39]. Unlike C. album, soybean plants accumulated Na+ equally between roots and leaves, while K+ was preferentially retained in the roots. Previous studies have reported that salt-sensitive species may even increase the overall root K+ content compared to salt-untreated plants [41,42,43]. The restricted K+ translocation to the aerial parts along with the low leaf K+ accumulation were both likely responsible for the limited capacity of soybean plants to tolerate NaCl, which manifested in the decline of plant growth. Although the weed and the crop did not interfere with the capacity of each other to accumulate Na+ and K+ in leaf tissues, soybean promoted K+ accumulation in the root of C. album unless salinity was applied, and K+ was significantly lost from the roots of both species when co-cultivated under salt stress.
NaCl decreased protein accumulation in both species. This outcome has been reported in many crops [44,45], but is particularly significant for soybean. As a relevant protein crop, soybean’s protein content is indissolubly linked to its nutritional value. Sharing the same set-up with C. album made this effect even worse. Under salt stress, C. album did not subtract N from soybean for N uptake, as the capacity of the crop to accumulate N in leaves was unchanged. Thus, the effect of C. album was apparently on the process of N assimilation into proteins rather than N uptake. It must also be noted that soybean increased the production of N compounds such as antioxidant enzymes, phenolics and the osmolyte proline under salt stress, generally without differences between plants of the single and mixed set-ups, which may suggest the substantial use of N resources to support the antioxidant machinery of the plant.
Leaves of C. album contained less proteins under salinity, possibly because of K+ losses, and were not influenced by the co-existence with soybean.
C. album has documented capacity to tolerate severe salt stress by producing numerous compatible solutes that contrast osmotic imbalance and promote cell turgor maintenance, similar to salt stress-resistant plants [46]. Proline is one major organic osmolyte [47,48], and its concentration was dramatically increased in the weed, as in the crop, under salinity. The increase in proline generally reflects the osmoregulatory role of this compound [49]. In leaves of C. album, this effect was more pronounced when plants were grown with soybean and concurred with the increase in the accumulation of antioxidant phenol compounds. The opposite was observed for soybean. Therefore, the weed and the crop were influenced reciprocally for the production of proline and phenols, with different outcomes in leaves and roots, which may depend on the osmotic status of the plant organ.
Soybean plants showed enhanced activity of antioxidant enzymes under salinity, which was consistent with the lipid peroxidation trend, as having higher antioxidant activity is a strategy that protects plants from cellular injuries caused by ROS [50]. In C. album, the activity of antioxidant enzymes was stimulated by NaCl only in the single growth set-up. However, overall, the activity of antioxidant enzymes was lower than in soybean because lipid peroxidation intensity was concurrently very low. The observation that the leaf antioxidant activity in the weed was increased by salt stress and was comparable to that of soybean opens the hypothesis that other antioxidant mechanisms and ROS-scavenging molecules other than those explored in this study may be involved in the elevated tolerance of C. album to NaCl.

5. Conclusions

This study confirms the low and high salt tolerance of soybean and C. album plants, respectively, by dissecting different intensities of individual responses. The presence of C. album in the same growth system with soybean repressed the crop growth and protein accumulation, but neither affected its N nutrition nor its capacity to accumulate Na+. Unlike other investigations conducted in halophytic plants, we found significant K+ losses in C. album after 1 week of NaCl application, which was quite unexpected. Perhaps, high initial levels of K+ in the weed and greater root-to-shoot K+ translocation accounted for its acclimation and resilience to early salinity stress. The presence of the crop along with salinity triggered the activation of antioxidative defenses and osmotic balance adjustment mechanisms in the weed. However, the effect was not intense enough to hamper the weed growth and induce oxidative stress in its tissues.
We conclude that C. album is salt-resilient irrespective of the co-cultivation with soybean, and its occurrence along with salinity has a strong, early negative effect on the content of proteins in the crop. Thus, although C. album did not impair soybean growth and nutrition more than salinity alone under such a condition, it interfered with N assimilation processes in the crop. A reduced protein content in soybean is expected to result in biomass losses that would become more evident in the longer period. These results are particularly relevant to salt-sensitive cultivars, including the one used in the present work. Whereas these studies were conducted in hydroponics to evaluate the interactive effects between C. album and soybean without the interference of soil within a short-term period, further experiments carried out in pots will be useful to evaluate these effects at the soil-plant level and in the long term. In a climate-change scenario characterized by increasing salinization, we may expect C. album to exhibit even greater competitiveness. Possible sustainable strategies to mitigate soybean losses due to competition with C. album follow two directions: (1) At the genetic level, by selecting soybean varieties more tolerant to salt stress and/or allelochemicals released by the weed; (2) at the agronomic level, by sowing soybean in correspondence with the highest probability of precipitation so that salt can be partly leached from the soil by rainfall, or by applying the false seedbed technique to remove C. album seedlings from the topsoil before sowing soybean.

Author Contributions

Conceptualization, M.S., R.M. and G.Z.; methodology, M.S.; investigation, M.S. and P.O.; writing—original draft preparation, A.G.; writing—review and editing, M.S., R.M. and G.Z.; visualization, A.G. and M.S.; supervision, M.S., R.M. and G.Z. All authors have read and agreed to the published version of the manuscript.

Funding

This research was funded by the Department of Agronomy, Food, Natural resources, Animals and Environment (DAFNAE), University of Padova, Italy, grant number BIRD183031.

Institutional Review Board Statement

Not applicable.

Informed Consent Statement

Not applicable.

Data Availability Statement

The data presented in this study are available on request from the corresponding author.

Conflicts of Interest

The authors declare no conflict of interest.

References

  1. Almeida, D.M.; Margarida Oliveira, M.; Saibo, N.J.M. Regulation of Na+ and K+ homeostasis in plants: Towards improved salt stress tolerance in crop plants. Genet. Mol. Biol. 2017, 40, 326–345. [Google Scholar] [CrossRef] [PubMed] [Green Version]
  2. Corwin, D.L. Climate change impacts on soil salinity in agricultural areas. Eur. J. Soil Sci. 2021, 72, 842–862. [Google Scholar] [CrossRef]
  3. Jamil, A.; Riaz, S.; Ashraf, M.; Foolad, M.R. Gene expression profiling of plants under salt stress. CRC Crit. Rev. Plant Sci. 2011, 30, 435–458. [Google Scholar] [CrossRef]
  4. Taylor, R.G.; Scanlon, B.; Döll, P.; Rodell, M.; van Beek, R.; Wada, Y.; Longuevergne, L.; Leblanc, M.; Famiglietti, J.S.; Edmunds, M.; et al. Ground water and climate change. Nat. Clim. Chang. 2013, 3, 322–329. [Google Scholar] [CrossRef] [Green Version]
  5. Phang, T.-H.; Shao, G.; Lam, H.-M. Salt Tolerance in Soybean. J. Integr. Plant Biol. 2008, 50, 1196–1212. [Google Scholar] [CrossRef]
  6. Zeng, L.; Shannon, M.C. Salinity effects on seedling growth and yield components of rice. Crop Sci. 2000, 40, 996–1003. [Google Scholar] [CrossRef] [Green Version]
  7. Daei, G.; Ardekani, M.R.; Rejali, F.; Teimuri, S.; Miransari, M. Alleviation of salinity stress on wheat yield, yield components, and nutrient uptake using arbuscular mycorrhizal fungi under field conditions. J. Plant Physiol. 2009, 166, 617–625. [Google Scholar] [CrossRef]
  8. Katerji, N.; Van Hoorn, J.W.; Hamdy, A.; Karam, F.; Mastrorilli, M. Effect of salinity on water stress, growth, and yield of maize and sunflower. Agric. Water Manag. 1996, 30, 237–249. [Google Scholar] [CrossRef]
  9. Khan, M.H.; Panda, S.K. Alterations in root lipid peroxidation and antioxidative responses in two rice cultivars under NaCl-salinity stress. Acta Physiol. Plant. 2008, 30, 81–89. [Google Scholar] [CrossRef]
  10. Zhu, J.K. Plant salt tolerance. Trends Plant Sci. 2001, 6, 66–71. [Google Scholar] [CrossRef]
  11. Niu, X.; Bressan, R.A.; Hasegawa, P.M.; Pardo, J.M. lon Homeostasis in NaCl stress environments. Plant Physiol 1995, 109, 735–742. [Google Scholar] [CrossRef] [Green Version]
  12. Xing, J.; Cai, M.; Chen, S.; Chen, L.; Lan, H. Seed germination, plant growth and physiological responses of Salsola ikonnikovii to short-term NaCl stress. Plant Biosyst. 2013, 147, 285–297. [Google Scholar] [CrossRef]
  13. Garg, N.; Manchanda, G. ROS generation in plants: Boon or bane? Plant Biosyst. Int. J. Deal. Asp. Plant Biol. 2009, 143, 81–96. [Google Scholar] [CrossRef]
  14. Jbir-Koubaa, R.; Charfeddine, S.; Ellouz, W.; Saidi, M.N.; Drira, N.; Gargouri-Bouzid, R.; Nouri-Ellouz, O. Investigation of the response to salinity and to oxidative stress of interspecific potato somatic hybrids grown in a greenhouse. Plant Cell. Tissue Organ Cult. 2015, 120, 933–947. [Google Scholar] [CrossRef]
  15. Apel, K.; Hirt, H. Reactive Oxigen species: Metabolism, oxidative stress, and signal transduction. Annu. Rev. Plant Biol. 2004, 55, 373–399. [Google Scholar] [PubMed] [Green Version]
  16. McKersie, B.D.; Leshem, Y.Y. Stress and Stress Coping in Cultivated Plants; Springer: Dordrecht, The Netherlands, 1994. [Google Scholar]
  17. Chang, R.Z.; Chen, Y.W.; Shao, G.H.; Wan, C.W. Effect of salt stress on agronomic characters and chemical quality of seeds in soybean. Soybean Sci. 1994, 13, 101–105. [Google Scholar]
  18. Cirillo, V.; Masin, R.; Maggio, A.; Zanin, G. Crop-weed interactions in saline environments. Eur. J. Agron. 2018, 99, 51–61. [Google Scholar]
  19. Lu, P.; Li, J.; Jin, C.; Jiang, B.; Bai, Y. Different growth responses of an invasive weed and a native crop to nitrogen pulse and competition. PLoS ONE 2016, 11, e0156285. [Google Scholar] [CrossRef] [Green Version]
  20. Chen, Y.H.; Gols, R.; Benrey, B. Crop domestication and its impact on naturally selected trophic interactions. Annu. Rev. Entomol. 2015, 60, 35–58. [Google Scholar] [CrossRef] [Green Version]
  21. Clements, D.R.; Ditommaso, A.; Jordan, N.; Booth, B.D.; Cardina, J.; Doohan, D.; Onguevergne, L.; Leblanc, M.; Famiglietti, J.S.; Edmunds, M.; et al. Adaptability of plants invading North American cropland. Ecosyst. Environ. 2004, 104, 379–398. [Google Scholar] [CrossRef]
  22. Tanveer, M.; Shah, A.N. An insight into salt stress tolerance mechanisms of Chenopodium album. Environ. Sci. Pollut. Res. 2017, 24, 16531–16535. [Google Scholar] [CrossRef]
  23. Kraehmer, H.; Baur, P. Weed Anatomy, 1st ed.; Wiley-Blackwell: Hoboken, NJ, USA, 2013. [Google Scholar]
  24. Sartorato, I.; Berti, A.; Zanin, G. Estimation of economic thresholds for weed control in soybean (Glycine max (L.) Merr.). Crop Prot. 1996, 15, 63–68. [Google Scholar] [CrossRef]
  25. Shurtleff, J.L.; Coble, H.D. Interference of certain broadleaf weed species in soybeans (Glycine max). Weed Sci. 1985, 33, 654–657. [Google Scholar] [CrossRef]
  26. Bradford, M.M. A Rapid and Sensitive Method for the quantitation of microgram quantities of protein utilizing the principle of Protein-Dye Binding. Anal. Biochem. 1976, 72, 248–254. [Google Scholar] [CrossRef]
  27. Benzie, I.F.F.; Strain, J.J. The ferric reducing ability of plasma (FRAP) as a measure of “antioxidant power”: The FRAP assay. Anal. Biochem. 1996, 239, 70–76. [Google Scholar] [CrossRef] [Green Version]
  28. Nicoletto, C.; Santagata, S.; Bona, S.; Sambo, P. Influence of cut number on qualitative traits in different cultivars of sweet basil. Ind. Crops Prod. 2013, 44, 465–472. [Google Scholar]
  29. Nakano, Y.; Asada, K. Hydrogen peroxide is scavenged by ascorbate-specific peroxidase in spinach chloroplasts. Plant Cell Physiol. 1981, 22, 867–880. [Google Scholar]
  30. Rezaie, F.; Yarnia, M. Allelopathic effects of Chenopodium album, Amaranthus retroflexus and Cynodon dactylon on germination and growth of safflower. J. Food Agric. Environ. 2005, 7, 516–521. [Google Scholar]
  31. Reinhardt, C.F.; Meissner, R.; Labuschagne, N. Allelopathic interaction between Chenopodium album L. and certain crop species. S. Afr. J. Plant Soil 1994, 11, 45–49. [Google Scholar] [CrossRef]
  32. Alam, S.M.; Azmi, A.R.; Naqvi, S.S.M.; Khan, M.A.; Khanzada, B. Effect of aqueous leaf extract of common lambsquarters (Chenopodium album L.) and NaCl on germination and seedling growth of rice. Acta Physiol. Plant. 1997, 19, 91–94. [Google Scholar] [CrossRef]
  33. Mallik, M.A.B.; Puchala, R.; Grosz, F.A. A growth inhibitory factor from lambsquarters (Chenopodium album). J. Chem. Ecol. 1994, 20, 957–967. [Google Scholar] [CrossRef]
  34. Namvar, A.; Seyed Sharifi, R.; Molaei Igdir Üniversitesi, P. Influence of extracts of Chenopodium album and NaCl salinity on germination and seedling growth of soybean. Allelopath. J. 2009, 23, 193–202. [Google Scholar]
  35. Flowers, T.J.; Colmer, T.D. Salinity tolerance in halophytes. New Phytol. 2008, 179, 945–963. [Google Scholar] [CrossRef] [PubMed]
  36. Yao, S.; Chen, S.; Xu, D.; Lan, H. Plant growth and responses of antioxidants of Chenopodium album to long-term NaCl and KCl stress. Plant Growth Regul. 2010, 60, 115–125. [Google Scholar] [CrossRef]
  37. Wu, H.; Shabala, L.; Zhou, M.; Su, N.; Wu, Q.; Ul-Haq, T.; Zhu, J.; Mancuso, S.; Azzarello, E.; Shabala, S. Root vacuolar Na+ sequestration but not exclusion from uptake correlates with barley salt tolerance. Plant J. 2019, 100, 55–67. [Google Scholar] [CrossRef]
  38. Osmond, C.B.; Björkman, O.; Anderson, D.J. Physiological Processes in Plant Ecology. Toward a Synthesis with Atriplex; Springer: Berlin/Heidelberg, Germany, 1980. [Google Scholar]
  39. Wu, H.; Zhang, P.; Chen, G.; Pan, L.; Li, J.; Dong, L. Environmental factors on seed germination and seedling emergence of Phleum paniculatum Huds. Chil. J. Agric. Res. 2018, 78, 370–377. [Google Scholar] [CrossRef] [Green Version]
  40. Chen, Z.; Pottosin, I.I.; Cuin, T.A.; Fuglsang, A.T.; Tester, M.; Jha, D.; Zepeda-Jazo, I.; Zhou, M.; Palmgren, M.G.; Newman, I.A.; et al. Root plasma membrane transporters controlling K+/Na+ homeostasis in salt-stressed barley. Plant Physiol. 2007, 145, 1714–1725. [Google Scholar] [CrossRef] [Green Version]
  41. Ai-Rawahy, S.A.; Stroehlein, J.L.; Pessarakli, M. Dry-matter yield and nitrogen-15, Na+, and K+ content of tomatoes under sodium chloride stress. J. Plant Nutr. 1992, 15, 341–358. [Google Scholar] [CrossRef]
  42. Hamada, A.M.; El-Enany, A.E. Effect of NaCl salinity on growth, pigment and mineral element contents, and gas exchange of broad bean and pea plants. Biol. Plant. 1994, 36, 75–81. [Google Scholar] [CrossRef]
  43. Bulut, F.; Akıncı, Ş. The effect of salinity on growth and nutrient composition in broad bean (Vicia faba L.) seedlings Al and humic acid interactions on broad bean seedlings. Fresenius Environ. Bull. 2010, 19, 2901–2910. [Google Scholar]
  44. Tester, M.; Davenport, R. Na+ Tolerance and Na+ Transport in Higher Plants. Ann. Bot. 2003, 91, 503–527. [Google Scholar] [CrossRef]
  45. Debouba, M.; Gouia, H.; Suzuki, A.; Ghorbel, M.H. NaCl stress effects on enzymes involved in nitrogen assimilation pathway in tomato “Lycopersicon esculentum” seedlings. J. Plant Physiol. 2006, 163, 1247–1258. [Google Scholar] [CrossRef]
  46. Hasegawa, P.M.; Bressan, R.A.; Zhu, J.K.; Bohnert, H.J. Plant cellular and molecular responses to high salinity. Annu. Rev. Plant Biol. 2000, 51, 463–499. [Google Scholar] [CrossRef] [Green Version]
  47. Liu, H.; Song, J.; Dong, L.; Wang, D.; Zhang, S.; Liu, J. Physiological responses of three soybean species (Glycine soja, G. gracilis, and G. max cv. Melrose) to salinity stress. J. Plant Res. 2017, 130, 723–733. [Google Scholar] [CrossRef]
  48. Osman, M.S.; Badawy, A.A.; Osman, A.I.; Abdel Latef, A.A.H. Ameliorative impact of an extract of the halophyte Arthrocnemum macrostachyum on growth and biochemical parameters of soybean under salinity stress. J. Plant Growth Regul. 2020, 9, 1–12. [Google Scholar]
  49. Heuer, B. Role of proline in plant response to drought and salinity. In Handbook of Plant and Crop Stress; Pessarakli, M., Ed.; CRC Press: Boca Raton, FL, USA, 2010; pp. 213–238. ISBN 9781439813997. [Google Scholar]
  50. Haq, N.U.; Ammar, M.; Bano, A.; Luthe, D.S.; Heckathorn, S.A.; Shakeel, S.N. Molecular Characterization of Chenopodium album chloroplast small heat shock protein and its expression in response to different abiotic stresses. Plant Mol. Biol. Report. 2013, 31, 1230–1241. [Google Scholar] [CrossRef]
Figure 1. Experimental design of the hydroponic set-up. S = Soybean; C = C. album.
Agronomy 11 01481 g001
Figure 2. (A) Leaf fresh weight (FW) of soybean and C. album, treated and nontreated with NaCl. (B) Leaf dry weight (DW) of soybean and C. album, treated and nontreated with NaCl. (C) Root fresh weight (FW) of soybean and C. album treated and nontreated with NaCl. (D) Root dry weight (DW) of soybean and C. album, treated and nontreated with NaCl. Different letters within each group of bars indicate significant differences at p < 0.05, n = 6. S = soybean; C = C. album. The experiment was replicated twice, and only data from one representative experiment are shown.
Agronomy 11 01481 g002
Figure 3. (A) Average leaf fresh weight (FW), expressed as percentage of salt-treated samples over nontreated samples (% nt). (B) Species-competition interaction for average root dry weight (DW) of soybean and C. album (% nt). Values on the left refer to plants grown in the single-species set-up (no competition). Values on the right refer to plants grown in the mixed-species set-up (competition between soybean and C. album). Vertical bars denote the standard error. The experiment was replicated twice, and only data from one representative experiment are shown.
Agronomy 11 01481 g003
Figure 4. (A) Leaf dry weight (DW)/fresh weight (FW) ratios, expressed as percentage of salt-treated samples over nontreated samples (% nt). (B) Species-competition interaction for dry weight (DW)/fresh weight (FW) ratios of soybean and C. album roots (% nt). Values on the left refer to plants grown in single-species tanks (no competition). Values on the right refer to plants grown in mixed-species tanks (competition between soybean and C. album). Vertical bars denote the standard error. The experiment was replicated twice, and only data from one representative experiment are shown.
Agronomy 11 01481 g004
Figure 5. (A) Percentage of N in dried leaves of soybean and C. album, treated and nontreated with NaCl. (B) Protein content per gram of leaf fresh weight (FW) of soybean and C. album, treated and nontreated with NaCl. Different letters within each group of bars indicate significant differences at p < 0.05, n = 3. S = soybean; C = C. album. The experiment was replicated twice, and only data from one representative experiment are shown.
Agronomy 11 01481 g005
Figure 6. Na+ content in leaves (A) and roots (B) of soybean and C. album, treated and nontreated with NaCl. (C) Na+ translocation factor (TF) of soybean and C. album, treated and nontreated with NaCl. K+ content in leaves (D) and roots (E) of soybean and C. album, treated and nontreated with NaCl. (F) K+ translocation factor (TF) of soybean and C. album, treated and nontreated with NaCl. Different letters within each group of bars indicate significant differences at p < 0.05, n = 3. S = soybean; C = C. album. The experiment was replicated twice, and only data from one representative experiment are shown.
Agronomy 11 01481 g006
Figure 7. Total phenols in leaves (A) and roots (B) of soybean and C. album, treated and nontreated with NaCl. Ferric-reducing antioxidant power (FRAP), expressed as milligrams per kilogram of ferrous ion equivalent, in leaves (C) and roots (D) of soybean and C. album, treated and nontreated with NaCl. Different letters within each group of bars indicate significant differences at p < 0.05, n = 3. S = soybean; C = C. album. The experiment was replicated twice, and only data from one representative experiment are shown.
Agronomy 11 01481 g007
Figure 8. (A) Guaiacol peroxidase (GPX) activity in leaves of soybean and C. album, treated and nontreated with NaCl. (B) Catalase (CAT) activity in leaves of soybean and C. album, treated and nontreated with NaCl. (C) Ascorbate peroxidase (APX) activity in leaves of soybean and C. album, treated and nontreated with NaCl. (D) Lipid peroxidation, expressed as thiobarbituric acid reactive substances (TBARS) in leaves of soybean and C. album, treated and nontreated with NaCl. Different letters within each group of bars indicate significant differences at p < 0.05, n = 3. S = soybean; C = C. album. The experiment was replicated twice, and only data from one representative experiment are shown.
Agronomy 11 01481 g008
Figure 9. Species-competition interaction for average catalase (CAT) activity (A) and average ascorbate peroxidase (APX) activity (B) in fresh leaves of soybean and C. album, expressed as percentage of salt-treated samples over non-treated samples (% nt). Values on the left refer to plants grown in single-species tanks (no competition). Values on the right refer to plants grown in mixed-species tanks (competition between soybean and C. album). Vertical bars denote the standard error.
Agronomy 11 01481 g009
Figure 10. Proline content in leaves (A) and roots (B) of soybean and C. album, treated and nontreated with NaCl. Different letters within each group of bars indicate significant differences at p < 0.05, n = 3. S = soybean; C = C. album, FW = fresh weight. The experiment was replicated twice, and only data from one representative experiment are shown.
Agronomy 11 01481 g010
Figure 11. (A) Species-competition interaction for average proline content in fresh leaves of soybean and C. album, expressed as percentage of salt-treated samples over non-treated samples (% nt). (B) Species-competition interaction for average proline content in fresh roots of soybean and C. album (% nt). Values on the left refer to plants grown in single-species tanks (no competition). Values on the right refer to plants grown in mixed-species tanks (competition between soybean and C. album). Vertical bars denote the standard error.
Agronomy 11 01481 g011
Table 1. Treatment applied and corresponding acronyms in the figures.
Progressive NumberTreatmentAcronym
1 1Soybean No NaClS
2Soybean plus 100 mM NaClS+NaCl
3 2Soybean and C. album No NaClS+C
4Soybean and C. album plus 100 mM NaClS+C+NaCl
5C. album No NaCl C
6C. album plus 100 mM NaCl C+NaCl
7 2C. album and Soybean No NaCl C+S
8C. album and Soybean plus 100 mM NaCl C+S+NaCl
1 From treatment 1 to 4, soybean plants were analyzed, and between 5 and 7 C. album plants were analyzed. 2 Treatments 3 and 7 were performed and compared to evaluate possible allelopathic interferences between soybean and C. album plants when grown together (in the same tank).
Table 2. ANOVA significance for the effect of species (soybean and C. album), competition (single-species tanks or mixed-species tanks) and their interaction on the percentage of salt-treated samples over nontreated samples. (A) Fresh weight (FW), dry weight (DW) and DW/FW ratio of leaves and roots. (B) Content of N and soluble proteins in leaves. (C) Na+ and K+ content in leaves and roots, Na and K translocation factor (Na leaves/Na roots, K leaves/K roots). (D) Phenolic compounds in leaves and roots and antioxidant capacity via FRAP in leaves and roots. (E) Antioxidant enzyme activity (guaiacol peroxidase (GPX), ascorbate peroxidase (APX), catalase (CAT) and lipid peroxidation via malondialdehyde (MDA) assay in leaves. (F) Proline content in leaves and roots. ns = not significant.
ALeavesRootsLeavesRootsLeavesRoots
FWFWDWDWDW/FWDW/FW
Species0.005nsnsns0.0070.028
Competitionnsnsnsnsns0.001
Species × Competitionnsnsns0.003ns0.008
Bleavesleaves
N totProteins
Speciesnsns
Competitionnsns
Species × Competitionns0.038
CleavesleavesrootsrootsNa leaves/K leaves/
NaKNaKNa rootsK roots
Species0000.0450.0470
Competitionnsnsns0.011ns0.043
Species × Competitionnsnsns0.02nsns
Dleavesrootsleavesroots
PhenolsPhenolsFRAPFRAP
Speciesnsns0.01ns
Competitionnsnsnsns
Species × Competitionns0.0120.0120.003
Eleavesleavesleavesleaves
MDAGPXAPXCAT
Speciesns0.0380.0170.047
Competition0.031ns0.0040.023
Species × Competitionnsns0.0080.016
Fleavesroots
ProlineProline
Species0.0240
Competition0.0280
Species × Competition0.0080
Table 3. Na+/K+ ratios in leaves and root of soybean and C. album, treated and nontreated with NaCl. Letters along columns indicate significant differences within both species groups at p < 0.05, n = 3 (+SE). The experiment was replicated twice, and only data from one representative experiment are shown.
TreatmentNa+/K+
LeavesRoots
Soybean No NaCl 0.002 ± 0.000 d0.002 ± 0.000 d
Soybean plus 100 mM NaCl 0.618 ± 0.028 b0.324 ± 0.029 b
Soybean and C. album No NaCl 0.002 ± 0.000 d0.002 ± 0.000 d
Soybean and C. album plus 100 mM NaCl 0.506 ± 0.038 c0.249 ± 0.043 b
C. album No NaCl 0.008 ± 0.004 d0.028 ± 0.012 c
C. album plus 100 mM NaCl 1.601 ± 0.177 a0.569 ± 0.076 a
C. album and Soybean No NaCl 0.003 ± 0.000 d0.007 ± 0.002 d
C. album and Soybean plus 100 mM NaCl 1.156 ± 0.205 a0.483 ± 0.117 ab
Publisher’s Note: MDPI stays neutral with regard to jurisdictional claims in published maps and institutional affiliations.

