Article

Quality Evaluation, Phytochemical Characteristics and Estimation of Beta-Carotene Hydroxylase 2 (Chy2) Alleles of Interspecific Potato Hybrids

by
Oksana B. Polivanova
1,*,
Ekaterina M. Gins
1,
Evgeny A. Moskalev
1,
Maria S. Voinova
1,
Alina K. Koroleva
1,
Anatoly Zh. Semenov
1,
Anastasia B. Sivolapova
1,
Anna S. Ivanova
1,
Oleg G. Kazakov
1,
Evgeny A. Simakov
2,
Nadezhda A. Chalaya
3,
Elena V. Rogozina
3 and
Svetlana V. Goryunova
1
1
Laboratory of Cell and Genomic Technologies, Russian Potato Research Center, Moscow Region, 140051 Lyubertsy, Russia
2
Selection and Seed Centre, Russian Potato Research Center, 143080 Lyubertsy, Russia
3
Department of Potato Genetic Resources, N.I. Vavilov All-Russian Institute of Plant Genetic Resources, 190000 St. Petersburg, Russia
*
Author to whom correspondence should be addressed.
Submission received: 20 June 2021 / Revised: 9 August 2021 / Accepted: 10 August 2021 / Published: 14 August 2021
(This article belongs to the Special Issue Use of Wild Crop Relatives as Genetic Resources in Crop Breeding)

Abstract

:
Potatoes contain antioxidants such as flavonoids, carotenoids and ascorbic acid. High level consumption worldwide makes potato a valuable source of phytonutrients. Developing new potato varieties with high nutritional value in combination with resistance to pathogens is an important task. In this study, 25 interspecific potato hybrids with resistance to Synchytrium endobioticum, common scab, silver scab, rhizoctonia, nematodes and PVY were evaluated for total phenolics, total flavonoids, total carotenoids, ascorbic acid contents and antioxidant activity. The identification of the dominant allele related with yellow flesh color at the Chy locus was also performed by the specific CAPS marker. Total protein content was detected and ranged from 8.19 ± 0.59 to 30.17 ± 4.56 mg/g dry weight (DW). Total starch and total carbohydrate contents were in the range of 9.0–21.0% and 73.21 ± 20.94–676.36 ± 195.28, respectively. Total phenolic content of hybrids varied from 8.45 to 82.75 mg/100 g, and total flavonoids content—from 0.64 to 9.67 mg/100 g DW. It is possible to distinguish samples with high protein and carbohydrate contents, high level of substances with antioxidant activity and characterized by resistance to pathogens. Quality evaluation has shown that some of the samples have a high potential for processing and chip production in combination with high eating qualities. These samples can be used in breeding programs to develope varieties resistant to pathogens and with high nutritional value.

1. Introduction

Phenolic compounds are plants’ secondary metabolites associated with protection mechanisms against pathogens and pests, defense against radiation and attraction of pollinators signaling [1,2]. Phenolics demonstrate antioxidant activity along with other plant chemical compounds presented in plant foods. Carotenoids, ascorbic acid and vitamin E can neutralize reactive oxygen species (ROS) which cause damage to cell structures and are linked with some cancer types and cardiovascular diseases [3].
Potato (Solanum tuberosum L.) is the most widely available source of vitamins, minerals and phytonutrients due to the high level of consumption worldwide. Potatoes can be a good source of phenolic compounds especially phenolic acids such as chlorogenic acid, flavonoids (mainly quercetin) and anthocyanins. Carotenoids are also present in potatoes, especially in varieties with orange or yellow flesh. The level of phytonutrients with antioxidant activity in potatoes can vary greatly and depend on the variety, growth conditions and environment factors [4].
Potato interspecific hybrids have high potential as breeding material to obtain potato varieties as a source of functional food with health benefits. Interspecific potato hybrids are mostly used in breeding programs as donors of durable resistance to pathogens. Resistant to pathogen potato varieties in combinations with other economic traits, such as high antioxidant activity and nutritional value would be of interest to consumers and producers.
The aim of this study was to estimate the amount of total phenolics, total flavonoids, total carotenoids, ascorbic acid, low molecular soluble antioxidant and protein contents of 25 potato hybrids, which were previously selected based on pathogen resistance, yield, tuber shape and other economic traits. For functional food production and processing of potatoes, quality traits are also very important. Potato processing into chips and other products has a great potential in terms of handling and storage. This study also evaluated potato quality attributes such as starch content, chip quality and eating quality. Samples with increased levels of antioxidant compounds, high nutritional value and processing potential could be used for developing potato varieties with positive impact on human health.

2. Materials and Methods

2.1. Plant Material

Twenty-five interspecific potato hybrids created by the method of sexual hybridization with subsequent selection for resistance to diseases and pests (Table 1) were selected for this study. The samples were obtained from the Federal Research Center N. I. Vavilov All-Russian Institute of Plant Genetic Resources (VIR), Ministry of Science and Higher Education (Saint-Petersburg, Russia). The crossing involved wild South American potato species, which have not been included previously in breeding processes—Solanum alandiae Card. and S. okadae Hawkes et Hjerting. Among North and South American species, such as S. andigenum Juz. et Buk., S. chacoense Bitt., S. microdontum Bitt., S. phureja Juz. et Buk., S. pinnatisectum Dun., S. rybinii Juz. et Buk., S. spegazzinii Bitt. and S. stoloniferum Schlechtd., which have already presented in the pedigrees of modern varieties, valuable genotypes were selected for use in hybridization. Among S. tuberosum varieties involved in crossing are dihaploid of Atzimba variety, a high-yielding Bobr variety from Poland, which combines nematode resistance with productivity and low disease incidence and Svitanok Kievsky variety, slightly affected by late blight with a high starch content and some others. Crossings of two selected sources of valuable traits were carried out, or crosses of wild species with either demissoid varieties, selection clones, or both, were conducted. Crosses between previously created interspecific hybrids, isolated by a complex of valuable traits were also carried out. The pedigree of hybrid clones consisted of two to six tuber-forming species of Solanum spp. (Table 1).

Samples Preparation

Five medium-sized tubers of each hybrid were cut into slices and lyophilized during 24 h. After lyophilization the slices were ground to obtain a fine powder using a coffee grinder. Samples were kept at −20 °C until analysis.
For phenolic and flavonoid extraction, approximately 30 mg of the powder (precisely weighed quantity) was added to 2 mL of 96% ethanol. Tubes with extract were incubated at room temperature for 48 h in a shaking incubator at 500 rpm. After incubation, the tubes were centrifugated 15 min at 4000× g. Supernatants were used for estimation of total phenolic and flavonoid content.
For carotenoid extraction, 0.5 g of the powder was sequentially extracted with three portions of acetone (5, 7, 10 mL). Supernatants were then combined and petroleum ether and water were added. Tubes with extracts were shaken vigorously and centrifuged for 1 min at 4000× g to separate two phases. The top organic phase was removed and washed with water for subsequent analysis. Sodium sulphate anhydrous was used to absorb water from the organic phase [5].
For protein extraction, 15 mg of the powder was extracted with 5 mL of 0.5 M NaOH during 2.5 h. Obtained extracts were used for total protein content analysis.
For carbohydrate extraction, accurately weighed amounts of a sample (20 mg) were extracted with 2.5 mL of water for 1.5 h.

2.2. Bioactive Compounds Analysis

2.2.1. Total Phenolic Content

Total phenolic content was determined by a spectrophotometric method using Folin–Ciocalteu reagent [6]. Gallic acid solutions were used as a standard to develop a calibration curve. To 200 μL of ethanol extracts or standard solutions, 400 μL of Folin–Ciocalteu reagent and 1600 μL of 700 mM Na2CO3 solution were added. The absorption was measured at 765 nm (Varian Cary 50 UV-Vis, Agilent Technologies, Santa Clara, CA, USA) after two hours of incubation. The results were expressed in gallic acid equivalent (mg of GAE/100 g of dry weight of sample).

2.2.2. Total Flavonoids Content

Total flavonoid content was determined using a spectrophotometric method based on complexation reaction with aluminum chloride [7]. Quercetin solutions were used to develop a calibration curve. To 1 mL of ethanol extracts or standard solutions, 50 μL of 1 M potassium acetate solution and 50 μL of 10% aluminum chloride solution were added. The absorption was measured at 415 nm after 30 min of incubation. The results were expressed in mg of quercetin equivalent per 100 g of dry weight of sample.

2.2.3. Total Carotenoid Content and Analysis of Chy2 Allelic Composition Using a CAPS (Cleaved Amplified Polymorphic Sequence) Assay

The absorbance of previously weighted petroleum ether extracts was measured at 450 nm using pure petroleum ether as a blank. Total carotenoid content was calculated by the following equations:
C = A   × 10 0.65 × 2500
where C is the concentration of carotenoids in the extract (mg/g), A is the measured absorbance, 10 is the concentration of 1% solution (mg/mL), 0.65 is the petroleum ether density (g/mL) and 2500 is the absorbance of 1% solution.
TC = ( C × 1000 × W e ) / W s ,
where TC is total carotenoid content (mg/kg of dry weight); C is the concentration of carotenoids in the extract calculated above (mg/g), 1000 is the conversion factor from grams to kilograms; We is the weight of the extract (g) and Ws is the dry weight of the sample (g) [5].
For the dominant allele identification at the CHY2 locus the specific CAPS assay was used [8]. The samples genomic DNA was isolated from leaf tissue by the express method [9]. The genomic DNA was amplified with primers CHY2ex4F (5′ -CCATAGACCAAGAGAAGGAC C-3′) and Beta-R822 (5′ -GAAAGTAAGGCACGTTGGCA AT-3′) to obtain a 308 bp fragment. After AluI digestion, a fragment of 163 bp is related with the dominant allele 3, where the presence of other recessive alleles is indicated by a fragment of 237 bp. Amplification condition included: initial denaturation of 5 min at 95 °C followed by 35 cycles of 30 s denaturation at 94 °C, 30 s annealing 55 °C, 45 s elongation at 72 °C and final elongation at 72 °C for 5 min.

2.2.4. Ascorbic Acid Content Estimation

The content of the reduced form of ascorbic acid was determined by an iodometric method based on titration of ascorbic acid in colored extracts with potassium iodate in an acidic medium in the presence of potassium iodide and starch [10].

2.2.5. Determination of Total Antioxidants Concentration

Total antioxidants content was determined by the amperometric method, results were expressed in gallic acid (GA) equivalents (mg eq. GA/g). The ground samples were extracted in a certain volume of 70% ethanol at room temperature. The homogenate was then centrifuged at 10,000× g for 15 min at 4 °C. An aliquot of the supernatant was used to determine antioxidants content, diluting if necessary. The measurements were carried out on a “Tsvet-Yauza 01-AA” device (Radian, Saratov, Russia) in a constant-current mode. The amperometric method includes the measurement of the intensity of the current between a working electrode and a reference electrode, at a fixed value of potential. The current is generated by the oxidation/reduction of an electroactive analyte [11].

2.3. Nutritional Compounds Analysis

2.3.1. Total Protein Content

Total protein content was estimated according to the Bradford procedure with Coomasie Brilliant blue G-250 with adaptations for use as a screening method in potato tubers [12]. Furthermore, 400 μL of extract was added to 5 mL Coomasie Brilliant blue G-250 solution prepared according to the standard protocol. The absorbance of the resulting solution was read within 60 min at 595 nm. To construct the standard curve, bovine serum albumin (BSA) solutions with known concentrations were used. The final results were expressed in mg of BSA equivalent per g of dry weight of a sample.

2.3.2. Total Carbohydrates Content

Total carbohydrate content was detected by phenol-sulfuric acid method. Glucose standard solutions were used to create a calibration curve. To each test tube containing 2 mL of a sample, 50 μL of 80% phenol solution was added and mixed by vortex. Furthermore, 5 mL of H2SO4 was added rapidly. Test tubes were mixed and cooled to room temperature in a water bath (25 °C for 10 min). The absorption was measured at 490 nm. The results were expressed in mg of glucose equivalent per g of dry weight of a sample [13].

2.4. Quality Parameters

2.4.1. Starch Content Based on the Specific Gravity

The main method that combines the determination of dry matter and starch is the method based on specific gravity.
Six to four cleanly washed and dried tubers with a total mass of up to 500 g were weighed on a scale in the air. They were then placed in a wire basket, which was immersed in water, with a temperature of 17.5 °C, on a thread attached to a lever and connected to the scale pan and weighed again. The specific gravity was calculated by the following equation:
SG = (weight in air/weight in water × density water (g·cm−3))
Starch content (%) was calculated based on the specific gravity value using specific coefficients.

2.4.2. Eating Qualities Estimation

Eating qualities were determined by the organoleptic method immediately after boiling tubers in water. The number of tasters was nine, each of whom gave an assessment of three tubers on the following scale: 5—excellent; 4—good; 3—satisfactory; 2—tasteless, insipid; 1—unpleasant, bitter. Mealiness was assessed on a 9-point scale.

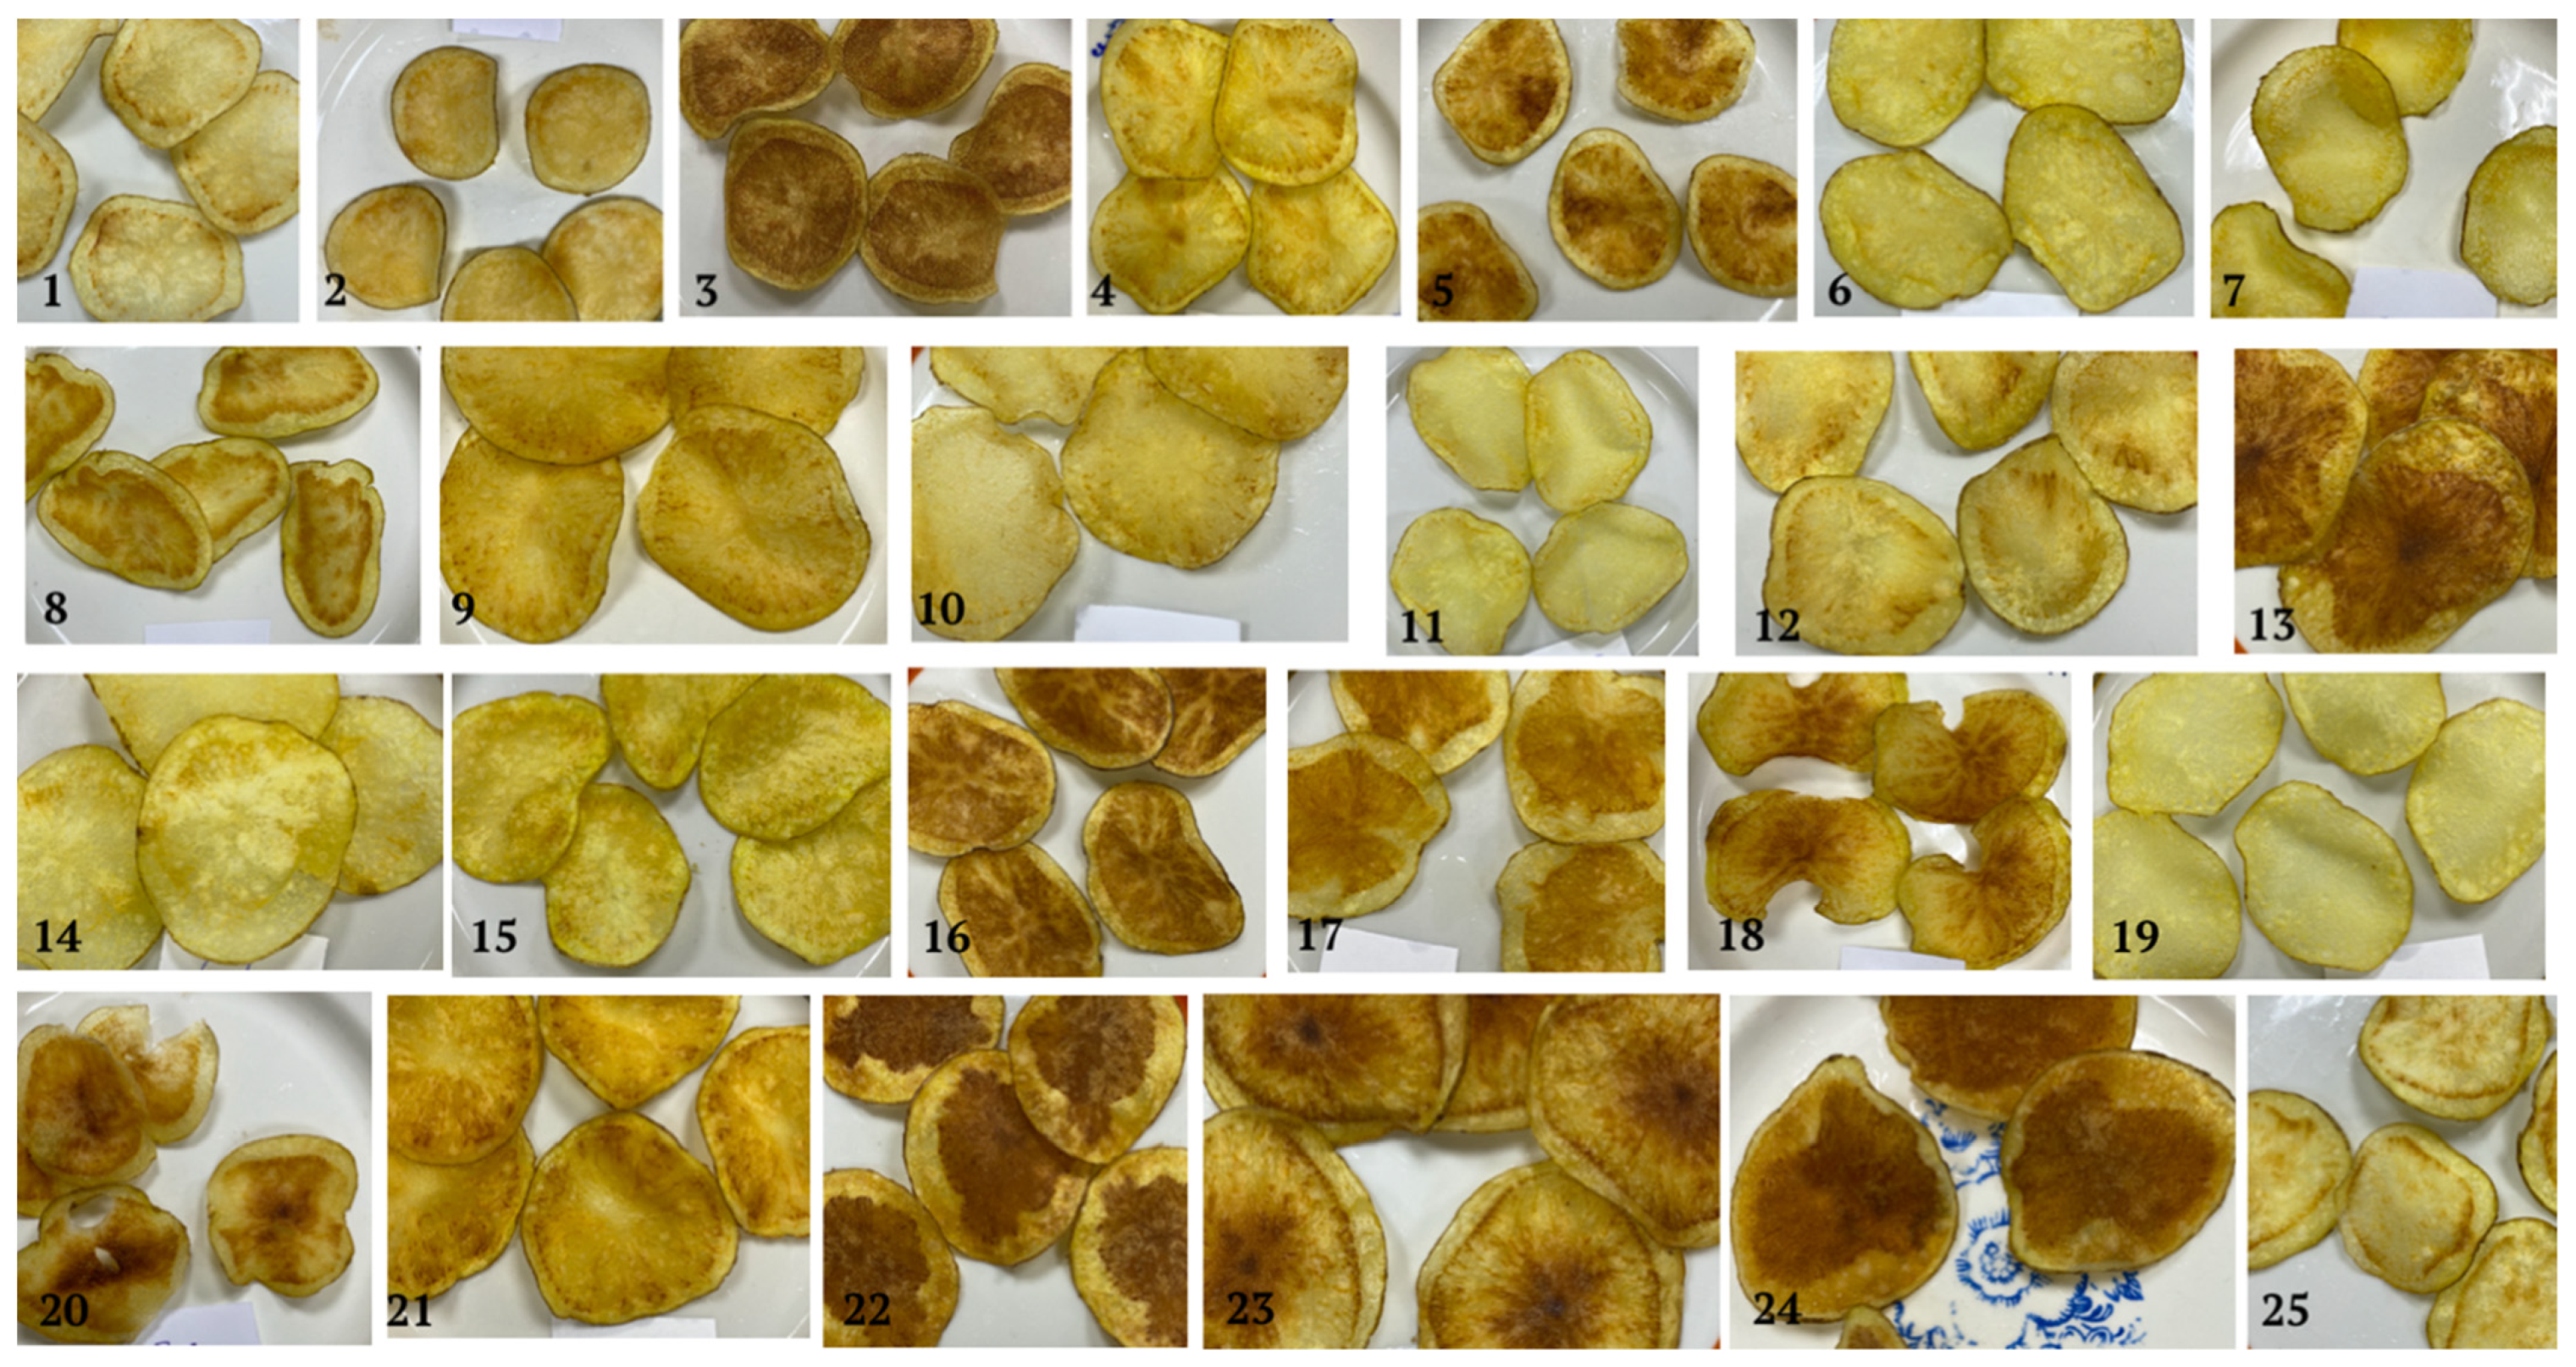
2.4.3. Chip Frying Test

Five potato tubers were washed and cut into thin slices (1.2 mm). To remove starch, the slices were rinsed in water and dried on paper towels. For chip preparation a deep fryer was used. The chips were fried using sunflower oil at a temperature of 180 °C for 2 min and then placed on paper towels to remove oil. The color of chips was measured based on standard chip color measurement. The quality of potato chips was assessed organoleptically according to the indicators, listed in Table 2.

2.5. Statistical Analysis

The results were expressed as mean ± confidence interval of three replication measurements. To determine significant difference (p < 0.05), two-way analysis of variance (ANOVA) and Duncan’s multiple range test were used. Normality of variance was checked by Shapiro–Wilk’s W test. Homoscedasticity of variances was tested using the Fisher test (Goldfeld–Quandt test). All statistical analyses were performed using Microsoft Excel (version 2019, Microsoft, USA) and Statistica software (version 10, Dell, USA).

3. Results and Discussion

3.1. Total Phenolic and Flavonoids Contents Estimation

Bioactive compound analysis showed significant variability of the studied interspecific potato hybrids in terms of phenol and flavonoid content. Table 3 lists total phenolic and flavonoid contents of the 25 potato hybrids. Total phenolic content in the studied samples varied from 8.45 to 82.75 mg/100 g dry weight (DW). The highest total phenolic contents were noted for samples with hybrid numbers SH3, SH18, SH19 and SH21. The same samples were characterized by a relatively high content of flavonoids (Table 3). Phenolic compounds are believed to be directly involved in plant defense against pathogens [14,15]. It was shown, for example, that the effect of the fungal elicitor from Trichothecium roseum on tubers increased total phenolic, flavonoids and lignin contents, and also increased expression levels of phenylpropanoid metabolic pathway key genes and pathogenesis-related genes—PAL, C4H, 4CL, GLU and CHT [16]. The effect of pathogens in the absence of genetic mechanisms of resistance is probably associated with the induction of phenolic compound accumulation and activation of the corresponding metabolic pathways. A meta-analysis confirmed that the total phenolic content increases in response to infection with bacterial and fungal microorganisms, as well as insects [17]. Among the studied hybrids with high levels of phenolics and flavonoids, significant differences in their resistance to phytopathogens were observed. For instance, samples with hybrid numbers SH18 and SH21 were resistant to S. endobioticum (pathotype 1), but were susceptible to rhizoctonia. Sample SH18 was also susceptible to common scab, while sample SH21 was resistant. Sample SH19 was susceptible to both S. endobioticum and common scab, despite having high concentrations of phenolics and flavonoids. Low concentrations of phenols and flavonoids were noted in samples with hybrid numbers SH1, SH10 and SH24. Among them, SH24 was noted with resistance to common scab and rhizoctonia. Thus, our results suggested that there is no relationship between susceptibility to pathogens and the total phenolic and flavonoids contents in the studied samples.
Published studies have shown that phenolic compound concentration and stability in potato tubers is determined by both genetic potential of a variety and environmental factors. Environmental factors affecting potato tubers’ phenolic content include ecological and climatic characteristics of growing area, weather conditions, cultivation methods, use of mineral fertilizers and pesticides [4,18]. The positive effect of organic farming in comparison with traditional cultivation methods on total phenolic content in tubers is emphasized [4,19,20]. The effect is explained by increased pressure from pathogens or decreased nitrogen availability. These factors enhance phenolic biosynthesis, leading to resistance against pests [20,21]. Many polyphenols are directly involved in plant stress response, such as thermal stress, trauma, exposure to ultraviolet radiation and ozone [22]. On the other hand, it has been shown that the genotype tends to have a greater impact on total phenolic content compared with the growth environment [4,23].

3.2. Total Carotenoids Content and CAPS Assay Results

The hybrids’ collection was genotyping at the Chy2 locus using a CAPS assay and total carotenoid content and tubers’ colors were estimated. The results are shown in Table 4.
Total carotenoid content of the studied hybrids ranged from 0.26 to 10.37 mg/kg DW and corelated with the color of tuber flesh. Total carotenoid content of samples with yellow tuber flesh varied from 3.12 to 10.37 mg/kg, and was the highest in samples SH3, SH21 and SH15. It was noted that samples with selection numbers SH3 and SH21 were distinguished by the highest concentrations of both phenolic compounds and flavonoids, and carotenoids.
Total carotenoid content of light-yellow samples ranged from 0.26 to 1.22 mg/kg; carotenoid level of creamy flesh samples varied from 0.41 to 2.62 mg/kg; two analyzed samples with white flesh contained 0.46 and 0.55 mg/kg of total carotenoids. Results are consistent with previously published reports on total carotenoid content in potato flesh. According to the reports, total carotenoid content in commercially available tubers was 1.90–8.75 mg/kg DW, and the highest concentrations were typical for samples with yellow or dark yellow flesh [5,24,25,26]. Data on the influence of environmental factors on carotenoid levels in tubers are insufficient. According to Tatarowska et al. [27], total carotenoid content in potato tubers are significantly affected by environmental factors, but it is impossible to control them, because these are dependent on the cultivation year. The variability in total carotenoid content did not demonstrate a strong association with applied cultivation systems. The total carotenoid content did not increase under organic conditions [27]. However, in another study, a significant increase in the concentration of carotenoids in the biodynamic farming systems in comparison with the conventional was noted [28].
Genotype has a significant impact on individual composition and concentration of carotenoids in potato tubers [29,30].
Yellow color of potato tubers flesh is dependent on the presence a dominant allele at the Y locus, which has been mapped on chromosome 3. The main gene candidate involved in yellow flesh color formation is beta-carotene hydroxylase (Chy2). The dominant Chy2 allele 3 has been determined as a major factor for carotenoid accumulation in tubers’ flesh [31]. The groups Phureja, Stenotonum and Goniocalyx have the highest concentration of carotenoids in potato flesh [32].
Previous studies on diploid and tetraploid clones showed that all studied genotypes with yellow or orange flesh were carrying allele 3 of CHY2 [8]. In our study, all samples with maximum carotenoid content (more than 3 mg/kg DW) were heterozygous for allele 3 (Table 4). Surprisingly, among the samples marked by the presence of the dominant allele 3, the total carotenoid content varied significantly, starting from values close to zero (for samples SH4, SH6, SH9, SH10, SH14 and SH16), but all those samples had yellow or light-yellow flesh color (Table 4). Among samples homozygous for recessive alleles, the total content of carotenoids varied from 0.41 to 2.62 mg/kg DW. At the same time, these samples were characterized by white and creamy flesh color, with the exception of sample SH7, which was characterized by a light-yellow flesh color. The dose of allele 3 was not determined in our study.
The significant variability in total carotenoid content of the samples characterized by the presence of the dominant allele 3 of the CHY2 locus can be related with influence of other genes involved in the accumulation of carotenoids in tetraploid potatoes. The presence of new alleles of the CHY2 gene in interspecific hybrids that are not detected by used genotyping method is also possible.
It is necessary to search for other genetic variants that have closer correlations with the total carotenoid content in tetraploid potatoes.

3.3. Estimation of Ascorbic Acid Content and Total Antioxidants Concentration

Antioxidant status and pathogen interaction in potato organisms are closely related [33]. A pathogen penetration into potato tubers is a powerful stress factor that causes excessive accumulation of ROS breaking redox balance of cells. Free radicals initiate cellular damage of tuber tissues, destroying membranes, proteins and DNA [34]. Rapid ROS formation is associated with innate plant immunity [35]. In some cases, ROS can act as signaling molecules [36].
Defense system formation in potato tuber is associated with low molecular weight metabolite synthesis such as organic acids and secondary metabolites with antioxidant activity [33]. Low molecular weight antioxidants serve many functions in plants, including the ability to neutralize ROS associated with plants’ resistance to diseases and pests [37]. Ascorbic acid accumulates in high concentration in potato tuber flesh near the peel and neutralizes ROS, preventing the development of oxidative stress from the penetration of pathogens [38].
Plant-based foods are the main source of vitamin C in the human diet and potato is among the most important ones due to high rate of contribution around the world. The possibility of increasing the ascorbic acid content of plants to improve their nutritive value has received considerable attention in recent years [39]. Thus, the development of new potato varieties with high ascorbic acid content is an important task.
The analysis showed that total ascorbic acid content and total antioxidant content vary by more than double between the samples of interspecific hybrids from 11 to 23 mg/100 g of DW and from 0.15 to 0.4 mg/100 g, respectively (Table 5).
The analyzed samples varied considerably in resistance to pathogens. For instance, two hybrids selected in the offspring from the crossing of S. chacoense k-19759 as a maternal form with Bobr variety, combining resistance to nematodes and PVY, contain ascorbic acid in the amount of 16 and 18 mg/100 g, respectively. At the same time, hybrid 135-3-2005, selected from crossing S. okadae × S. chacoense, was resistance to nematodes and high yield, however, it accumulated a small amount of ascorbic acid 13 ± 1 mg/100 g, and also had a low total content of alcohol-soluble antioxidants (0.18 mg eq. GA/g).
The interspecific hybrids included in the study differ by susceptibility to scab and rhizoctonia, pathogens invading tubers. In connection with the available data on the involvement of ascorbic acid in mechanisms of protection against pathogens, it was interesting to note possible relationships between ascorbic acid content and resistance to these pathogens.
Among ten scab-resistant hybrids, only half of them accumulated a large amount of ascorbic acid (from 18 to 23 mg/100 g) by the end of storage (samples SH4, SH8, SH20, SH21, SH22) (Table 5). Hybrids SH21, SH22, SH4 and SH8 contained the maximum amount of vitamin C (23 mg/100 g).
Among the hybrids that are not resistant to scab, sample 194-3 was distinguished by a high value of total antioxidant content (0.30 mg. eq. HA/g), and hybrid 134-2-2006 had a slightly smaller value (0.24 mg eq. GA/g), while other interspecific hybrids not resistant to scab were distinguished by a lower level of this indicator from 0.15 to 0.19 mg. eq. GA/g.
Thus, although some resistant hybrids samples showed increased levels of ascorbic acid and total antioxidant content, it is impossible to say that there was a significant relationship between these parameters. Tubers of the interspecific hybrids resistant to scab such as SH8, SH22, SH21 and SH16, as well as susceptible to scab, with selection numbers SH18 and SH19, represent a rich source of low molecular weight metabolites with antioxidant properties. These samples were also distinguished by relatively high phenolic and flavonoid content. Carotenoid content was higher in scab resistant samples.
In our study, no correlation was found with a high antioxidant content and the presence or absence of resistance to certain pathogens. The fact is that the total content of various groups of antioxidants, as well as the nutritional value of potatoes, is determined by a combination of many factors, such as climatic and weather conditions, cultivation methods and agricultural techniques, the use of fertilizers, pesticides and herbicides and pathogenic load. Taking into account and understanding the interaction of these factors is a complex task.

3.4. Total Protein and Carbohydrates Contents Determination

Although potatoes are not an important source of protein in diets, the total nutritional value of tubers is also determined by total protein content. Potato proteins are usually a by-product of potato processing and are regenerated in an aggregated denatured state, which limits their use as low-value livestock feed. However, undenatured potato proteins also have promising functional properties (for example, can serve as stabilizers) and a high nutritional value [40]. Increasing the total protein content of potatoes in combination with other quality traits, can make them more affordable and attractive for processing. The main soluble protein in tubers is a glycoprotein patatin with a Mr 40,000. A substantial study has been published on patatin structure and properties, its stability and thermal aggregation in relation to the high-scale functional proteins production [41,42].
According to previous publications, potato tubers’ total protein content significantly depends on variety, application of herbicides and biostimulants, as well as on atmospheric conditions [43,44]. The results of total protein content in the studied hybrids are presented in the Table 6.
The highest protein content was found in samples SH5, SH7 and SH13. Low protein concentrations were noted in samples SH24, SH25 and SH19.
The content of carbohydrates in potato tubers, especially low molecular weight carbohydrates, is an important quality factor for the food industry. The dominant sugars in potato tubers are glucose, fructose and sucrose. The total content and composition of carbohydrates change in stored potato tubers due to constant conversion of starch to sugars and of one sugar form to another. The main factors controlling the level of low molecular weight carbohydrates are variety, environmental conditions during the growth period and storage [45].
The highest carbohydrate content was noted for samples with breeding numbers SH5, SH3, SH23, SH24 and SH21. Many samples with high carbohydrate levels were unsuitable for making chips, as discussed below.

3.5. Starch Content Based on the Specific Gravity

The results of starch content calculations are presented in Table 7.
Total starch content ranged from 9.0 to 21.0%. Starch content also has a significant influence on potato processing quality. It changes due to multiple factors, such as location of cultivation, climatic conditions and application of fertilizers [46]. However, the most important factor is the variety. Starch content in potato tubers usually varies from 10 to 25%. Hight starch content potato cultivars contain 18–22% of starch [47].

3.6. Chip Frying Test and Eating Qualities Estimation

Potato taste and processing qualities are some of the most important criteria for breeding. Evaluation of potatoes for chip processing is carried out according to several criteria, such as dry matter content, sugar content and chip frying test. The resulting chip color after frying is the main quality indicator. The results of the chip frying test and eating quality estimation are presented in Table 8 and in Figure 1.
According to the results (Table 8), only the sample with selection number SH19 has excellent quality of crispy potatoes (7–9 points). Crispy potatoes with selection number SH15 have relatively high quality (6–8 points), and samples SH11, SH6, SH7, SH10 and SH14 are moderately suitable for chip production (6–7 points). Samples with selection numbers SH17 and SH24 scored less than 3 points and are not suitable for chip processing at this stage of the evaluation.
A correlation between the total carbohydrate content (in glucose equivalent) and chip quality was observed. Hybrids with numbers 3, 5, 13, 17, 21, 23 and 24 with the highest carbohydrate contents were not suitable for crisp production (Figure 1, Table 6 and Table 8). Changes in carbohydrate content and its metabolism are the main influences affecting the quality of final potato products. Enzymatic degradation of sucrose results in the formation of reducing sugars, which negatively effect the quality of fried potato.
Specific gravity also influences the processing efficiency. It has a direct relationship to the time and temperature of frying, yield of the finished chips, oil absorption, texture and flavor [48]. It has been suggested that the specific gravity for chips manufacturing should be in range of 1.08–1.09 [49].
The quality of potato chips depends not only on tuber characteristics but also on a variety factors such as storage condition before processing, thickness of slices, oil used for frying, temperature and frying time.
After assessment, all samples have excellent and good eating qualities (Table 8). It should be noted that the eating qualities of potatoes is a subjective indicator that includes complex characteristics such as texture, aroma, taste and moisture [50].

4. Conclusions

The transfer of genes for resistance to biotic and abiotic stresses into the cultivated potato genome is often the subject of potato research. Wild potato species are sources of multiple resistance, and the introduction of new genes from wild Solanum species into the tetraploid potato gene pool is a method of making progress in potato cultivar breeding. However, an important breeding task is also to obtain varieties with improved nutritional value. In addition, along with the main nutrients such as carbohydrates and proteins, it is important to account for phytonutrients content with antioxidant activity, such as phenolic compounds, carotenoids and vitamin C. It has been shown that high levels of phytonutrients, primarily phenolic compounds, are associated with pathogen penetration into plant organisms. These groups of substances not only stimulate the defense systems of plants, but also have a positive effect on human health. High worldwide potato consumption makes it an important source of phytonutrients.
Based on the results of our study, hybrids that combine resistance to pathogens and high concentrations of phytonutrients were noted. Among them, hybrids SH21 and SH15 were distinguished by a relatively high content of phenolic compounds, flavonoids, carotenoids and protein, as well as resistance to common scab. Further assessment of the influence of environmental factors on antioxidant content in the samples is assumed.
Potato samples that combine not only resistance to pathogens, but also improved nutritional value and processing qualities can serve as the basis for obtaining varieties for functional food production. Such varieties can be more affordable and attractive to the consumer and potato product manufacturers.

Author Contributions

Biochemical and molecular characteristics of hybrids, data analysis, manuscript preparation, O.B.P.; ascorbic acid analysis, E.M.G.; total antioxidant analysis, E.A.M.; chip quality test, M.S.V. and A.S.I.; preparation for eating quality estimation, starch content analysis, A.K.K.; DNA extraction and genotyping, A.B.S.; growing of plant material, selection and preparation of plant material for analysis, O.G.K. and A.Z.S.; methodology assistance, E.A.S.; development of hybrids (crossing and selection of valuable genotypes), E.V.R.; starch content analysis, N.A.C.; design of experiments, manuscript actualization, supervision, S.V.G. All authors have read and agreed to the published version of the manuscript.

Funding

This study was supported by the governmental program (project № 0441-2019-0001).

Institutional Review Board Statement

Not applicable.

Informed Consent Statement

Not applicable.

Conflicts of Interest

The authors declare that there is no conflict of interest.

References

  1. Naikoo, M.I.; Dar, M.I.; Raghib, F.; Jaleel, H.; Ahmad, B.; Raina, A.; Khan, F.A.; Naushin, F. Role and regulation of plants phenolics in abiotic stress tolerance: An overview. In Plant Signaling Molecules; Khan, I., Ferante, A., Reddy, P., Khan, N., Eds.; Woodhead Publishing: Shaxton, UK, 2019; pp. 157–168. [Google Scholar]
  2. Parr, A.J.; Bolwell, G.P. Phenols in the plant and in man. The potential for possible nutritional enhancement of the diet by modifying the phenols content or profile. J. Sci. Food Agric. 2000, 80, 985–1012. [Google Scholar] [CrossRef]
  3. Scalbert, A.; Manach, C.; Morand, C.; Rémésy, C.; Jiménez, L. Dietary Polyphenols and the Prevention of Diseases. Crit. Rev. Food Sci. Nutr. 2005, 45, 287–306. [Google Scholar] [CrossRef]
  4. Lombardo, S.; Pandino, G.; Mauromicale, G. The influence of growing environment on the antioxidant and mineral content of “early” crop potato. J. Food Compos. Anal. 2013, 32, 28–35. [Google Scholar] [CrossRef]
  5. Valcarcel, J.; Reilly, K.; Gaffney, M.; O’Brien, N. Total Carotenoids and l-Ascorbic Acid Content in 60 Varieties of Potato (Solanum tuberosum L.) Grown in Ireland. Potato Res. 2014, 58, 29–41. [Google Scholar] [CrossRef]
  6. Ainsworth, E.A.; Gillespie, K.M. Estimation of total phenolic content and other oxidation substrates in plant tissues using Folin–Ciocalteu reagent. Nat. Protoc. 2007, 2, 875–877. [Google Scholar] [CrossRef] [PubMed]
  7. Horszwald, A.; Andlauer, W. Characterisation of bioactive compounds in berry juices by traditional photometric and modern microplate methods. J. Berry Res. 2011, 1, 189–199. [Google Scholar] [CrossRef] [Green Version]
  8. Wolters, A.-M.A.; Uitdewilligen, J.G.A.M.L.; Kloosterman, B.A.; Hutten, R.C.B.; Visser, R.G.F.; van Eck, H.J. Identification of alleles of carotenoid pathway genes important for zeaxanthin accumulation in potato tubers. Plant Mol. Biol. 2010, 73, 659–671. [Google Scholar] [CrossRef] [Green Version]
  9. Hosaka, K. An easy, rapid, and inexpensive DNA extraction method, “one-minute DNA extraction,” for PCR in potato. Am. J. Potato Res. 2004, 81, 17–19. [Google Scholar] [CrossRef]
  10. Silva, C.R.; Simoni, J.A.; Collins, C.H.; Volpe, P.L.O. Ascorbic acid as a standard for iodometric titrations. An analytical experiment for general chemistry. J. Chem. Educ. 1999, 76, 1421. [Google Scholar] [CrossRef]
  11. Pisoschi, A.M.; Negulescu, G.P. Methods for Total Antioxidant Activity Determination: A Review. Biochem. Anal. Biochem. 2011, 1, 106. [Google Scholar] [CrossRef] [Green Version]
  12. Snyder, J.C.; Desborough, S.L. Rapid estimation of potato tuber total protein content with coomassie brilliant blue G-250. Theor. Appl. Genet. 1978, 52, 135–139. [Google Scholar] [CrossRef] [PubMed]
  13. BeMiller, J.N. Carbohydrate analysis. Ch. 10. In Food Analysis, 4th ed.; Food Science Text Series; Nielsen, S., Ed.; Springer: New York, NY, USA, 2010; pp. 333–360. [Google Scholar]
  14. Simon, M.; Hilker, M. Herbivores and pathogens on willow: Do they affect each other? Agric. For. Èntomol. 2003, 5, 275–284. [Google Scholar] [CrossRef]
  15. Stout, M.J.; Thaler, J.S.; Thomma, B.P. Plant-mediated interactions between pathogenic microorganisms and herbivorous arthropods. Annu. Rev. Èntomol. 2006, 51, 663–689. [Google Scholar] [CrossRef]
  16. Yu, X.-Y.; Bi, Y.; Yan, L.; Liu, X.; Wang, Y.; Shen, K.-P.; Li, Y.-C. Activation of phenylpropanoid pathway and PR of potato tuber against Fusarium sulphureum by fungal elicitor from Trichothecium roseum. World J. Microbiol. Biotechnol. 2016, 32, 142. [Google Scholar] [CrossRef] [PubMed]
  17. Wallis, C.M.; Galarneau, E.R. Phenolic compound induction in plant-microbe and plant-insect interactions: A meta-analysis. Front Plant Sci. 2020, 15, 580753. [Google Scholar] [CrossRef]
  18. Lachman, J.; Hamouz, K.; Orsák, M.; Pivec, V.; Dvořák, P. The influence of flesh colour and growing locality on polyphenolic content and antioxidant activity in potatoes. Sci. Hortic. 2008, 117, 109–114. [Google Scholar] [CrossRef]
  19. Keutgen, A.J.; Wszelaczyńska, E.; Pobereżny, J.; Przewodowska, A.; Przewodowski, W.; Milczarek, D.; Tatarowska, B.; Flis, B.; Keutgen, N. Antioxidant properties of potato tubers (Solanum tuberosum L.) as a consequence of genetic potential and growing conditions. PLoS ONE 2019, 14, e0222976. [Google Scholar] [CrossRef]
  20. Grudzińska, M.; Czerko, Z.; Zarzyńska, K.; Borowska-Komenda, M. Bioactive Compounds in Potato Tubers: Effects of Farming System, Cooking Method, and Flesh Color. PLoS ONE 2016, 11, e0153980. [Google Scholar] [CrossRef] [Green Version]
  21. Moschella, A.; Camin, F.; Misseli, F.; Parisi, B.; Versini, G.; Ranalli, P.; Bagnaresi, P. Markers of characterization of agricultural regime and geographical origin in potato. Agroindustria 2005, 4, 325–332. [Google Scholar]
  22. Ngadze, E.; Coutinho, T.; Icishahayo, D.; van der Waals, J. Effect of calcium soil amendments on phenolic compounds and soft rot resistance in potato tubers. Crop. Prot. 2014, 62, 40–45. [Google Scholar] [CrossRef] [Green Version]
  23. Reddivari, L.; Hale, A.L.; Miller, J.C. Genotype, Location, and Year Influence Antioxidant Activity, Carotenoid Content, Phenolic Content, and Composition in Specialty Potatoes. J. Agric. Food Chem. 2007, 55, 8073–8079. [Google Scholar] [CrossRef]
  24. Breithaupt, D.E.; Bamedi, A. Carotenoids and Carotenoid Esters in Potatoes (Solanum tuberosum L.): New Insights into an Ancient Vegetable. J. Agric. Food Chem. 2002, 50, 7175–7181. [Google Scholar] [CrossRef] [PubMed]
  25. Andre, C.M.; Ghislain, M.; Bertin, P.; Oufir, M.; Herrera, M.D.R.; Hoffmann, L.; Hausman, J.-F.; Larondelle, A.Y.; Evers, D. Andean Potato Cultivars (Solanum tuberosum L.) as a Source of Antioxidant and Mineral Micronutrients. J. Agric. Food Chem. 2007, 55, 366–378. [Google Scholar] [CrossRef] [PubMed]
  26. Burgos, G.; Salas, E.; Amoros, W.; Auqui, M.; Muñoa, L.; Kimura, M.; Bonierbale, M. Total and individual carotenoid profiles in Solanum phureja of cultivated potatoes: I. Concentrations and relationships as determined by spectrophotometry and HPLC. J. Food Compos. Anal. 2009, 22, 503–508. [Google Scholar] [CrossRef]
  27. Tatarowska, B.; Milczarek, D.; Wszelaczyńska, E.; Pobereżny, J.; Keutgen, N.; Keutgen, A.J.; Flis, B. Carotenoids Variability of Potato Tubers in Relation to Genotype, Growing Location and Year. Am. J. Potato Res. 2019, 96, 493–504. [Google Scholar] [CrossRef] [Green Version]
  28. Vaitkevičienė, N.; Kulaitienė, J.; Jarienė, E.; Levickienė, D.; Danillčenko, H.; Średnicka-Tober, D.; Rembiałkowska, E.; Hallmann, E. Characterization of Bioactive Compounds in Colored Potato (Solanum Tuberosum L.) Cultivars Grown with Conventional, Organic, and Biodynamic Methods. Sustainability 2020, 12, 2701. [Google Scholar] [CrossRef] [Green Version]
  29. Hamouz, K.; Pazderu, K.; Lachman, J.; Čepl, J.; Kotíková, Z. Effect of cultivar, flesh colour, locality and year on carotenoid content in potato tubers. Plant Soil Environ. 2016, 62, 86–91. [Google Scholar] [CrossRef] [Green Version]
  30. Hejtmánková, K.; Kotíková, Z.; Hamouz, K.; Pivec, V.; Vacek, J.; Lachman, J. Influence of flesh colour, year and growing area on carotenoid and anthocyanin content in potato tubers. J. Food Compos. Anal. 2013, 32, 20–27. [Google Scholar] [CrossRef]
  31. Brown, C.R.; Kim, T.S.; Ganga, Z.; Haynes, K.; De Jong, D.; Jahn, M.; Paran, I.; De Jong, W. Segregation of total carotenoid in high level potato germplasm and its relationship to beta-carotene hydroxylase polymorphism. Am. J. Potato Res. 2006, 83, 365–372. [Google Scholar] [CrossRef]
  32. Nesterenko, S.; Sink, K.C. Carotenoid Profiles of Potato Breeding Lines and Selected Cultivars. HortScience 2003, 38, 1173–1177. [Google Scholar] [CrossRef] [Green Version]
  33. Chung, I.-M.; Venkidasamy, B.; Upadhyaya, C.P.; Packiaraj, G.; Rajakumar, G.; Thiruvengadam, M. Alleviation of Phytophthora infestans Mediated Necrotic Stress in the Transgenic Potato (Solanum tuberosum L.) with Enhanced Ascorbic acid Accumulation. Plants 2019, 8, 365. [Google Scholar] [CrossRef] [PubMed] [Green Version]
  34. Lee, H.H.; Lee, S.G.; Shin, J.S.; Lee, H.Y.; Yoon, K.; Yong, W.J.; Dae, S.J.; Lee, K.T. P-coumaroyl anthocyanin mixture isolated from tuber epidermis of Solanum tuberosum attenuates reactive oxygen species and pro-inflammatory mediators by suppressing nf-κb and stat1/3 signaling in lps-induced raw264.7 macrophages. Biol. Pharm. Bull. 2017, 40, 1894–1902. [Google Scholar] [CrossRef] [Green Version]
  35. Kobayashi, M.; Yoshioka, M.; Asai, S.; Nomura, H.; Kuchimura, K.; Mori, H.; Doke, N.; Yoshioka, H. StCDPK5 confers resistance to late blight pathogen but increases susceptibility to early blight pathogen in potato via reactive oxygen species burst. New Phytol. 2012, 196, 223–237. [Google Scholar] [CrossRef] [PubMed]
  36. Torres, M.A.; Jones, J.D.G.; Dangl, J.L. Pathogen-induced, NADPH oxidase-derived reactive oxygen intermediates suppress spread of cell death in Arabidopsis thaliana. Nat. Genet. 2005, 37, 1130–1134. [Google Scholar] [CrossRef] [PubMed]
  37. Watkins, J.M.; Chapman, J.M.; Muday, G.K. Abscisic Acid-Induced Reactive Oxygen Species Are Modulated by Flavonols to Control Stomata Aperture. Plant Physiol. 2017, 175, 1807–1825. [Google Scholar] [CrossRef] [Green Version]
  38. Nahirñak, V.; Rivarola, M.; Almasia, N.I.; Barón, M.P.B.; Hopp, H.E.; Vile, D.; Paniego, N.; Rovere, C.V. Snakin-1 affects reactive oxygen species and ascorbic acid levels and hormone balance in potato. PLoS ONE 2019, 14, e0214165. [Google Scholar] [CrossRef]
  39. Gallie, D.R. Increasing Vitamin C Content in Plant Foods to Improve Their Nutritional Value—Successes and Challenges. Nutrients 2013, 5, 3424–3446. [Google Scholar] [CrossRef] [Green Version]
  40. Shewry, P.R. Tuber storage proteins. Ann. Bot. 2003, 91, 755–769. [Google Scholar] [CrossRef] [Green Version]
  41. Pots, A.M.; Grotenhuis, E.T.; Gruppen, H.; Voragen, A.G.J.; De Kruif, K.G. Thermal Aggregation of Patatin Studied in Situ. J. Agric. Food Chem. 1999, 47, 4600–4605. [Google Scholar] [CrossRef]
  42. Pots, A.M.; Gruppen, H.; De Jongh, H.H.J.; Van Boekel, M.A.J.S.; Walstra, P.; Voragen, A.G.J. Kinetic modeling of the thermal aggregation of patatin. J. Agric. Food Chem. 1999, 47, 4593–4599. [Google Scholar] [CrossRef]
  43. Zarzecka, K.; Gugała, M.; Mystkowska, I.; Sikorska, A. Total and True Protein Content in Potato Tubers Depending on Herbicides and Biostimulants. Agronomy 2020, 10, 1106. [Google Scholar] [CrossRef]
  44. Järvan, M.; Edesi, L. The effect of cultivation methods on the yield and biological quality of potato. Agron. Res. 2009, 7, 289–299. [Google Scholar]
  45. Malone, J.; Mittova, V.; Ratcliffe, R.G.; Kruger, N.J. The Response of Carbohydrate Metabolism in Potato Tubers to Low Temperature. Plant Cell Physiol. 2006, 47, 1309–1322. [Google Scholar] [CrossRef]
  46. Choi, I.; Chun, J.; Choi, H.-S.; Park, J.; Kim, N.-G.; Lee, S.-K.; Park, C.-H.; Jeong, K.-H.; Nam, J.-W.; Cho, J.; et al. Starch Characteristics, Sugars and Thermal Properties of Processing Potato (Solanum tuberosum L.) Cultivars Developed in Korea. Am. J. Potato Res. 2020, 97, 308–317. [Google Scholar] [CrossRef]
  47. Šimková, D.; Lachman, J.; Hamouz, K.; Vokál, B. Effect of cultivar, location and year on total starch, amylose, phosphorus content and starch grain size of high starch potato cultivars for food and industrial processing. Food Chem. 2013, 141, 3872–3880. [Google Scholar] [CrossRef] [PubMed]
  48. Kumlay, A.M.; Kaya, C.; Olgun, M.; Dursun, A.; Pehluvan, M.; Dizikisa, T. Comparison of seasonal change of specific gravity, dry matter accumulation and starch content of four potato (Solanum tuberosum L.) varieties. Acta Hortic. 2002, 579, 255–258. [Google Scholar] [CrossRef]
  49. Adams, J.B. Raw materials quality and the texture of processed vegetables. In Texture in Foods; Kilcast, D., Ed.; CRC Press: Boca Raton, FL, USA, 2004; Volume 2, pp. 342–363. [Google Scholar]
  50. John Wiley and Sons, Inc. Handbook of Fruit and Vegetable Flavors; Hui, Y.H., Ed.; Lebensmittelchemie: Garching, Germany, 2010; Volume 64, pp. 171–172. [Google Scholar]
Figure 1. Color of chips prepared from the hybrid samples.
Agronomy 11 01619 g001
Table 1. Hybrid’s origin and characteristics.
Note Breeding NumberOrigin of HybridsSolanum Species in PedigreeAdditional Information (Catalog)
1.SH1144-1-2013F28-05 (F4 S. pinnatisectum × Fausta)S. pinnatisectum, S. tuberosumLate blight resistance
2.SH2141-2-2013F272-04 (F4 S. pinnatisectum × Fausta)S. pinnatisectum, S. tuberosumLate blight resistance
3.SH3167-1-2008159-31 × LatonaS. andigenum, S. microdontum, S. rybinii, S. spegazzinii, S. stoloniferum, S. tuberosumRelatively resistant to the Colorado potato beetle
4.SH499-4-1180-1 × HerthaS. stoloniferum, S. tuberosumMid-season hybrid. Susceptible to S. endobioticum (pathotype 1) according to laboratory tests. Value 74–84% (average tuber weight 80–85 g). Tubers resistant to common scab, susceptible to silver scab and rhizoctonia. Relatively resistant to the Colorado potato beetle
5.SH599-10-1Bobr × S. chacoense k-19759S. chacoense, S. tuberosumMid-season hybrid. Early tuberization. Susceptible to S. endobioticum (pathotype 1) according to laboratory tests. Value 74–85% (average tuber weight 56–80 g).
6.SH694-5Bobr × S. chacoense k-19759S. chacoense, S. tuberosumMid-season hybrid. Early tuberization. Resistant to S. endobioticum (pathotype 1) according to laboratory tests. Value 47–65% (average tuber weight 48–64 g.). Tubers susceptible to rhizoctonia
7.SH788-2180-2 × HerthaS. stoloniferum, S. tuberosumEarly hybrid. Early tuberization. Resistant to S. endobioticum (pathotype 1) according to laboratory tests. Value 66–68% (to 87–92% with a high agricultural background) (average tuber weight 60–76 g). Tubers resistant to common scab, susceptible to silver scab and rhizoctonia
8.SH8134-6-200624-2 × Svitanok KievskyS. alandiae, S. tuberosumMiddle-early hybrid. Susceptible to S. endobioticum (pathotype 1) according to laboratory tests. Value 70–84% (average tuber weight 71–81 g, more than 100 g with a high agricultural background). Tubers resistant to common scab and rhizoctonia, susceptible to silver scab.
9.SH9160-1F2 97-155-1S. andigenum, S. rybinii, S. tuberosumMiddle-early hybrid. Susceptible to S. endobioticum (pathotype 1) according to laboratory tests. Value 36–95% (average tuber weight 86–113 g).
10.SH10160-17F2 97-155-1S. andigenum, S. rybinii, S. tuberosumMiddle-early hybrid. Susceptible to S. endobioticum (pathotype 1) according to laboratory tests. Value 65–94%, (average tuber weight 100–110 g). Tubers susceptible to common scab
11.SH11160-40F2 97-155-1S. andigenum, S. rybinii, S. tuberosumMid-season hybrid. Susceptible to S. endobioticum (pathotype 1) according to laboratory tests. Value 51–78% (average tuber weight 66–67 g).
12.SH1234-697-162-2 × 190-4S. andigenum, S. microdontum, S. rybinii, S. spegazzinii, S. stoloniferum, S. tuberosumMiddle-early hybrid. Susceptible to S. endobioticum (pathotype 1) according to laboratory tests. Value 50–84% (average tuber weight 65–96 g). Tubers susceptible to common scab and rhizoctonia
13.SH13135-3-2005S. okadae k-20921 × S. chacoense k-19759S. okadae, S. chacoenseMiddle-early hybrid. Resistant to S. endobioticum (pathotype 1) according to laboratory tests. Value 84–96% (average tuber weight 90–105 g). Tubers resistant to common scab and rhizoctonia
14.SH148-1-2004 (137)S. okadae k-20921 × S. chacoense k-19759S. okadae, S. chacoenseMiddle-early hybrid. Resistant to S. endobioticum (pathotype 1) according to laboratory tests. Value 73–90% (average tuber weight 74–95 g). Tubers susceptible to rhizoctonia
15.SH15123-3-200497-162-2 × 190-4 S. andigenum, S. microdontum, S. rybinii, S. spegazzinii, S. stoloniferum, S. tuberosumEarly tuberization. Susceptible to S. endobioticum (pathotype 1) according to laboratory tests. Value 53–88% (average tuber weight 58–81 g).
16.SH16135-2-2006Svitanok Kievsky × 24-2S. alandiae, S. tuberosumMiddle-early hybrid. Resistant to S. endobioticum (pathotype 1) according to laboratory tests. Value 53–79% (average tuber weight 57–73 g). Tubers resistant to common scab and rhizoctonia, susceptible to silver scab
17.SH17128-05-0297-155-1 × NajadaS. andigenum, S. rybinii, S. tuberosumMiddle-late hybrid. Resistant to S. endobioticum (pathotype 1) according to laboratory tests. Value 80–843% (average tuber weight 67–78 g).
18.SH18194-3Zagadka Pitera × 99-6-6S. andigenum, S. rybinii, S. tuberosumMiddle-early hybrid. Resistant to S. endobioticum (pathotype 1) according to laboratory tests. Value 62–93% (average tuber weight 60–114 g). Tubers susceptible to rhizoctonia and common scab
19.SH19134-2-200624-2 × Svitanok KievskyS. alandiae, S. tuberosumMiddle-early hybrid. Early tuberization. Susceptible to S. endobioticum (pathotype 1) according to laboratory tests. Value 76–90% (average tuber weight 74–92 g). Tubers susceptible to common scab.
20.SH20117-2Atzimba × S.alandiae k-21240S. alandiae, S. tuberosumMiddle-late hybrid. Susceptible to S. endobioticum (pathotype 1) according to laboratory tests. Value 61–81% (average tuber weight 91–111 g). Tubers susceptible to rhizoctonia and common scab
21.SH2197-159-3k-24517 (90-7-7 × 90-21-1)S. andigenum, S. rybinii, S. stoloniferum, S. tuberosumMiddle-late hybrid. Resistant to S. endobioticum (pathotype 1) according to laboratory tests. Value 69–87% (average tuber weight 58–66 g). Tubers resistant to common scab, susceptible to silver scab and stem rhizoctonia.
22.SH22159-1k-24523 (F2 90-7-7)S. andigenum, S. rybinii, S. stoloniferum, S. tuberosumMid-season hybrid. Susceptible to S. endobioticum (pathotype 1) according to laboratory tests. Value 58–88% (average tuber weight 73–78 g). Tubers susceptible to silver scab
23.SH23135-1-2006Svitanok Kievsky × 24-2S. alandiae, S. tuberosumMid-season hybrid. Early tuberization. Resistant to S. endobioticum (pathotype 1) according to laboratory tests. Value 78–93% (average tuber weight 65–95 g). Tubers resistant to common scab and rhizoctonia
24.SH2425-1-2007Elizaveta × (Atzimba × S. alandiae k-21240)S. alandiae, S. tuberosumMid-season hybrid. Value 74–94% (average tuber weight 68–78 g). Tubers resistant to common scab and rhizoctonia
25.SH25117-1Atzimba × S. alandiae k-21240S. alandiae, S. tuberosumMid-season hybrid. Early tuberization. Value 60–71% (average tuber weight 72–79 g).
All samples were grown on the experimental fields of the Russian Potato Research Center in 2020. The study was carried out 2 months after the harvest.
Table 2. Evaluation of potato chips quality in points.
Quality IndicatorsQuality LevelsPoint
View, shape and sizeEven, smooth slices9
Even, slightly wavy slices7
Medium-wavy slices5
Strong wavy slices3
Corrugated slices1
ColorUniform clear yellow of all shades (pale yellow, bright yellow, etc.)9
Uniform, less clear, yellow of all shades. No burnt slices7
Nonuniform unclear yellow of all shades5
Nonuniform with light brown, brown spots and burnt slices3
Nonuniform, most slices are burnt1
Texture Crunchy, tender9
Crunchy, less tender7
Crunchy, slightly hard5
Hard, slightly solid3
Hard, Solid1
Table 3. Total phenolic and total flavonoids contents in potato hybrids samples.
Note Breeding Number Total Phenolic Content, mg/100 g DWTotal Flavonoids Content, mg/100 g DW
1SH1144-1-201318.02   ±   2.55 bcd2.13   ±   0.28 bcde
2SH2141-2-20138.45   ±   449 a0.64   ±   0.2 2a
3SH3167-1-200869.97   ±   5.77 k6.83   ±   0.91 j
4SH499-4-126.81   ±   6.50 ef2.12   ±   0.86 bcde
5SH599-10-139.07   ±   4.85 ghi3.69   ±   0.58 fg
6SH694-528.52   ±   4.70 ef1.47   ±   0.35 abc
7SH788-263.32   ±   7.13 k6.92   ±   1.60 j
8SH8134-6-200634.35   ±   1.12 fg2.85   ±   0.27 ef
9SH9160-148.28   ±   9.23 j2.18   ±   0.51 bcde
10SH10160-1712.21   ±   4.03 ab1.47   ±   0.92 abc
11SH11160-4035.51   ±   1.61 fgh4.05   ±   0.67 g
12SH1234-644.14   ±   1.62 hij2.61   ±   0.35 cde
13SH13135-3-2005 34.93   ±   4.971 fgh4.74   ±   0.47 gh
14SH148-1-2004 35.40   ±   12.38 fgh5.58   ±   1.33 hi
15SH15123-3-200424.37   ±   1.34 de6.22   ±   0.75 ij
16SH16135-2-200638.45   ±   5.82 ghi3.80   ±   1.44 fg
17SH17128-05-0222.08   ±   4.80 cde2.72   ±   0.47 def
18SH18194-362.74   ±   6.86 k4.06   ±   1.40 g
19SH19134-2-2006 80.75   ±   17.41 l1.90   ±   0.74 bcde
20SH20117-2 15.53   ±   3.35 abc1.65   ±   0.07 abcd
21SH2197-159-3 82.75   ±   26.80 l9.67   ±   1.28 k
22SH22159-140.94   ±   7.26 ghij4.44   ±   0.65 g
23SH23135-1-2006 13.32   ±   3.24 abc1.87   ±   0.28 bcde
24SH2425-1-2007 9.20   ±   4.18 ab4.49   ±   0.00 g
25SH25117-145.52   ±   5.48 ij1.34   ±   0.94 ab
Data represent the mean of three replicates ± confidence interval. Results were analyzed by 2-way ANOVA. Means were subjected to Duncan post hoc test (p < 0.05). Different letters in the same column indicate significant differences according to post hoc test results.
Table 4. Allelic composition at the Chy2 locus, total carotenoid contents and color of the hybrids.
Breeding Number GenotypeTotal Carotenoid Content, mg/kg DWFlesh ColorSkin Color
CHY2 Presencechy2 Presence
1SH1 +2.15   ±   0.13 dcreamyyellow
2SH2 +0.55   ±   0.15 abwhiteviolet
3SH3++10.37   ±   0.80 jyellowyellow
4SH4++0.92   ±   0.65 bclight yellowyellow
5SH5++4.88   ±   0.17 fgyellowyellow
6SH6++0.38   ±   0.02 ablight yellowyellow
7SH7 +0.54   ±   0.03 ablight yellowyellow
8SH8++3.12   ±   0.74 eyellowyellow
9SH9++0.34   ±   0.07 ablight yellowyellow
10SH10++0.46   ±   0.23 ablight yellowyellow
11SH11++4.74   ±   0.27 fyellowyellow
12SH12++5.47   ±   0.24 hyellowwhite
13SH13++4.76   ±   0.06 fyellowcreamy
14SH14++0.26   ±   0.04 alight yellowyellow
15SH15++7.81   ±   0.43 iyellowyellow
16SH16++0.28   ±   0.16 ablight yellowviolet
17SH17 +2.62   ±   0.49 decreamyyellow
18SH18 +0.46   ±   0.12 abwhitepink
19SH19++1.22   ±   0.26 clight yellowyellow
20SH20 +0.47   ±   0.21 abcreamyyellow
21SH21++9.96   ±   0.55 jyellowred
22SH22++5.39   ±   0.47 ghyellowred
23SH23 +1.25   ±   0.14 ccreamyyellow
24SH24 +1.17   ±   0.21 abccreamyyellow
25SH25 +0.41   ±   0.20 acreamyyellow
Data represent the mean of three replicates ± confidence interval. Results were analyzed by 2-way ANOVA. Means were subjected to Duncan post hoc test (p < 0.05). Different letters in the same column indicate significant differences according to post hoc test results.
Table 5. Total ascorbic acid content and total antioxidants concentration.
Breeding Number Total Antioxidant Content, mg eq. HA/g. Total Ascorbic Acid Content, mg/100 g of DW
1SH10.15 ± 0.0111 ± 1
2SH20.16 ± 0.0118 ± 2
3SH30.22 ± 0.0119 ± 2
4SH40.17 ± 0.0118 ± 2
5SH50.16 ± 0.0116 ± 2
6SH60.18 ± 0.0118 ± 2
7SH70.21 ± 0.0114 ± 1
8SH80.27 ± 0.0121 ± 2
9SH90.17 ± 0.0117 ± 2
10SH100.17 ± 0.0122 ± 2
11SH110.22 ± 0.0116 ± 2
12SH120.15 ± 0.0118 ± 2
13SH130.18 ± 0.0113 ± 1
14SH140.27 ± 0.0114 ± 1
15SH150.19 ± 0.0116 ± 2
16SH160.40 ± 0.0216 ± 2
17SH170.16 ± 0.0116 ± 2
18SH180.30 ± 0.0218 ± 2
19SH190.24 ± 0.0119 ± 2
20SH200.19 ± 0.0121 ± 2
21SH210.17 ± 0.0123 ± 2
22SH220.25 ± 0.0123 ± 2
23SH230.21 ± 0.0112 ± 1
24SH240.21 ± 0.0113 ± 1
25SH250.20 ± 0.0112 ± 1
Data represent the mean of three replicates ± confidence interval. Results were analyzed by 2-way ANOVA.
Table 6. Total protein and carbohydrates contents of potato hybrids.
Breeding Number Total Protein Content, mg/g DWCarbohydrates Content, mg/g DW
1SH115.81 ± 5.60 bcde216.80 ± 57.70 abc
2SH216.87 ± 2.15 bcdef73.21 ± 20.94 a
3SH328.66 ± 2.35 hi493.33 ± 49.00 ef
4SH413.80 ± 4.13 abcd302.98 ± 94.06 bcd
5SH535.23 ± 2.30 jk539.21 ± 189.00 fg
6SH631.29 ± 4.05 i249.09 ± 46.92 abcd
7SH737.41 ± 3.83 k210.31 ± 116.80 abc
8SH820.25 ± 3.77 efg243.11 ± 169.65 abcd
9SH912.44 ± 4.253 abc409.00 ± 238.82 def
10SH1019.61 ± 5.62 defg287.56 ± 32.11 bcd
11SH1119.14 ± 5.90 defg267.02 ± 50.53 bcd
12SH1223.32 ± 4.75 gh208.25 ± 16.84 bcd
13SH1333.32 ± 4.37 ijk340.95 ± 101.88 bcde
14SH1422.86 ± 1.01 fghj349.97 ± 64.32 bcde
15SH1523.87 ± 3.28 gh250.29 ± 130.70 abcd
16SH1615.92 ± 1.54 bcde188.39 ± 23.51 abc
17SH1715.52 ± 1.39 bcde355.78 ± 89.00 cde
18SH1818.53 ± 1.89 cdefg160.79 ± 29.63 ab
19SH198.19 ± 0.59 a211.87 ± 78.92 abc
20SH2021.85 ± 5.65 efg205.61 ± 17.21 abc
21SH2119.41 ± 2.55 defg676.36 ± 195.28 cde
22SH2221.63 ± 5.20 efg260.83 ± 16.84 bcd
23SH2330.17 ± 4.56 ij422.75 ± 192.12 def
24SH2411.73 ± 3.31 ab425.36 ± 87.14 def
25SH259.39 ± 0.55 a293.69 ± 52.68 bcd
Data represent the mean of three replicates ± confidence interval. Results were analyzed by 2-way ANOVA. Means were subjected to Duncan post hoc test (p < 0.05). Different letters in the same column indicate significant differences according to post hoc test results.
Table 7. Starch content (%).
Breeding NumberStarch Content, %
1SH118.2
2SH216.4
3SH317.6
4SH417.3
5SH513.4
6SH617.5
7SH718.3
8SH821.0
9SH919.0
10SH1017.3
11SH1118.0
12SH1215.2
13SH1320.3
14SH1418.5
15SH1517.3
16SH1616.4
17SH1718.1
18SH189.0
19SH1917.9
20SH2016.1
21SH2116.2
22SH2217.5
23SH2319.2
24SH2416.8
25SH2516.0
Table 8. Evaluation of potato chips quality and eating quality.
Breeding NumberPotato Chips Quality, PointsEating Quality, Points
ViewColorTextureAverage (±SD) Taste (1–5) (±SD)Mealiness (1–9)Texture
1 SH15454.6 ± 0.63.4 ± 0.54hard
2 SH26465.3 ± 1.23.8 ± 0.86hard
3 SH35223.0 ± 1.73.8 ± 0.66soft
4 SH45485.6 ± 2.14.4 ± 0.94hard
5 SH55364.6 ± 1.53.8 ± 1.38hard
6 SH67676.6 ± 0.63.6 ± 0.97hard
7SH74696.3 ± 2.54.2 ± 0.87hard
8 SH86444.6 ± 1.24.2 ± 1.17hard
9 SH96455.0 ± 1.03.8 ± 1.16hard
10 SH105496.0 ± 2.64.3 ± 0.78hard
11 SH115696.6 ± 2.13.6 ± 1.37hard
12SH125485.6 ± 2.13.9 ± 1.17hard
13 SH135364.6 ± 1.54.0 ± 1.08soft
14 SH145586.0 ± 1.73.0 ± 0.78hard
15 SH156787.0 ± 1.04.4 ± 0.58hard
16 SH164243.3 ± 1.24.5 ± 0.67hard
17 SH173322.6 ± 0.63.5 ± 0.69hard
18SH183443.6 ± 0.63.5 ± 0.66hard
19SH19799 8.3 ± 1.23.8 ± 0.86soft
20 SH204374.6 ± 2.13.0 ± 1.27soft
21 SH215323.3 ± 1.53.9 ± 0.27soft
22 SH227234.0 ± 2.63.6 ± 0.98soft
23 SH235354.3 ± 1.24.2 ± 0.47soft
24 SH244122.3 ± 1.53.8 ± 0.85hard
25 SH255485.6 ± 2.14.4 ± 0.98soft
Data represent the mean of five replicates ± standard deviation. Results were analyzed by 2-way ANOVA.
Publisher’s Note: MDPI stays neutral with regard to jurisdictional claims in published maps and institutional affiliations.

