Article

Genome-Wide Association Study for Powdery Mildew and Rusts Adult Plant Resistance in European Spring Barley from Polish Gene Bank

by
Jerzy H. Czembor
1,*,
Elzbieta Czembor
1,
Radoslaw Suchecki
2 and
Nathan S. Watson-Haigh
3,4,5,6
1
Plant Breeding and Acclimatization Institute—NRI, 05-870 Blonie, Poland
2
CSIRO Agriculture and Food, Urrbrae, SA 5064, Australia
3
South Australian Genomics Centre, SAHMRI, North Terrace, Adelaide, SA 5000, Australia
4
Australian Genome Research Facility, Victorian Comprehensive Cancer Centre, Melbourne, VIC 3000, Australia
5
School of Biological Sciences, University of Adelaide, Adelaide, SA 5005, Australia
6
Genome Informatics & Bioinformatics Training, Flagstaff Hill, SA 5159, Australia
*
Author to whom correspondence should be addressed.
Submission received: 4 November 2021 / Revised: 9 December 2021 / Accepted: 16 December 2021 / Published: 21 December 2021

Abstract

:
Rusts and powdery mildew are diseases that have a major effect on yield loss in barley. Adult Plant Resistance (APR) is a post-seedling resistance mechanism and its expression is influenced by many factors, including host susceptibility and weather conditions, as well as the timing and severity of disease outbreaks. There are two mechanisms associated with APR: non-hypersensitive and minor gene APR. In this study, 431 European barley accessions were evaluated phenotypically over 2 years (2018–2019) under field conditions, scoring APR to powdery mildew (PM), barley brown rust (BBR), and stem rust (SR), and genotypically using DArTseq. Accessions were grouped into sub-collections by cultivation period (group A—cultivated prior 1985, B—cultivated after 1985, and C—Polish landraces) and by European country of origin or European region. GWAS was conducted for PM, BBR, and SR, and scored at the heading (HA) and milky-waxy (MW) seed stages in 2019 and maximum scores across all replicates were obtained 2018–2019. Disease severity was sufficient to differentiate the collection according to cultivation time and country of origin and to determine SNPs. Overall, the GWAS analysis identified 73 marker–trait associations (MTAs) with these traits. For PM resistance, we identified five MTAs at both the HA stage and when considering the maximal disease score across both growth stages and both years. One marker (3432490-28-T/C) was shared between these two traits; it is located on chromosome 4H. For BBR resistance, six MTAs at HA and one MTA at the MW stage in 2019 and seven MTAs, when considering the maximal disease score across both growth stages and both years, were identified. Of the 48 markers identified as being associated with SR resistance, 12 were on chromosome 7H, 1 was in the telomeric region of the short arm, and 7 were in the telomeric region of the long arm. Rpg1 has previously been mapped to 7HS. The results of this study will be used to create a Polish Gene Bank platform for precise breeding programs. The resistant genotypes and MTA markers will serve as a valuable resource for breeding for PM, BBR, and SR resistance in barley.

1. Introduction

Barley (Hordeum vulgare L.) is an economically important cereal crop that is known to be dry, cold, salt-tolerant, and well adapted to low-input environmental conditions and changing climates [1,2]. It is cultivated at high altitudes, commonly under rain-fed conditions. Barley is often grown in marginal agricultural areas with low annual precipitation, often less than 220 mm [3]. It is ranked fourth in terms of the most cultivated crop (by area) in the world, after wheat, maize, and rice. Almost half of the world’s barley growing area is in Europe, including Poland, where it is ranked second in terms of the most cultivated crop after wheat. It is used for livestock feed, malt, and foods. Although domestic Polish barley supply has fluctuated substantially in recent years, it tended to decline from 1969–2018 [4].
Fungal pathogens are an economically significant factor limiting the size and quality of barley grain. Barley is often infected by powdery mildew fungus (Blumeria graminis DC. hordei), brown rust caused by Puccinia hordei (Ph), stripe rust caused by P. striiformis f. sp. hordei (Psh), and stem rust caused by Puccinia graminis f. sp. tritici (Pgt). The loss of yield caused by powdery mildew can reach up to 30%, at an average of 5–10% [5,6]. Yield losses caused by barley brown rust can be up to 60% in susceptible varieties [6,7,8]. However, the average yield losses of barley due to barley brown or stem rust often reach 10–25% [9,10,11]. The obvious alternative to fungicide treatment against plant diseases is the use of genetically resistant cultivars [12,13,14,15].
The potential yield loss caused by disease depends not only on host susceptibility and weather conditions, but also on the timing and severity of disease outbreaks relative to crop growth stage. The greatest yield losses occur when one or more of these diseases occur before the heading stage of development, and can be potentially important for the detection of early-activated pathogen-associated molecular patterns, which can trigger nonspecific defense cascades. On the other hand, resistance during late stages of growth, such as the milky-waxy stage, can be important for the identification of key resistance proteins. The early detection and proper identification of pathogens are critical to in-season disease management, future variety selection, and the use of these genes in breeding programs [14,16,17].
Two types of barley rusts and powdery mildew resistance have been described: (1) hypersensitive resistance (HR), and (2) adult plant resistance (APR). Resistance genes are pathogen race-specific in their action; they are responsible for HR and mostly encode immune receptors for nucleotide binding leucine rich repeat (NB-LRR). They are effective throughout all growth stages. By contrast, APR genes are only functional in adult plants and usually confer only partial resistance, albeit in a non-race-specific manner [17,18].
At least 38 different race-specific resistance genes/alleles to powdery mildew are known and used in varieties grown throughout Europe [19,20]. Barley cultivars with effective genes for resistance to powdery mildew have been an efficient means for controlling this disease [11,15,20,21,22,23,24,25]. Barley breeders use the following major seedling resistance genes: Mla6, Mla7, Mla9, Mla12, and Mla13; and Mlk, Mlg, MlLa, Mlh, and Mlra, which originate in landraces and in the subspecies, H. vulgare ssp. spontaneum.
More than 25 Rph (resistance to P. hordei) genes have been identified and mapped in barley [26], including 21 as seedling resistance [27]. Rph5 and Rph6 on chromosome 3H, Rph9 and Rph12 on chromosome 5H, and Rph15 and Rph16 on chromosome 2H have been described as alleles of the same gene. Only Rph7, Rph15, and Rph16 are still effective in Europe [28] and the number of effective Rph genes available to breeders is decreasing rapidly [26]. Among all the known Rph genes, only Rph1 has been isolated recently, using a newly developed cloning approach called Mutant Chromosome Sequencing (MutChromSeq) in combination with genetic mapping [29]. Six genes are known to confer barley resistance upon Pgt in the US, including well-characterized Rpg1, Rpg4, and Rpg5, as well as the less studied Rpg2, Rpg3, and Rpg6 [30].
APR is considered potentially more durable for controlling barley rusts or powdery mildew than seedling resistance genes. The use of race-specific resistance genes in barley quickly results in the selection of virulent races of B. graminis f. sp. hordei (PM) or Puccinia spp. When a cultivar containing one dominant resistance gene is grown on a large acreage, new virulent races can emerge within 4–5 years. Virulence has been detected for most seedling resistance genes but is unknown for APR genes [17].
Two forms of durable resistance to powdery mildew are described. Mlo resistance (gene mlo) was identified as durable resistance to powdery mildew in barley landraces [31]. Since 1984, it has been well described and deployed in many barley cultivars throughout Europe [20,25,32,33]. The second form of durable resistance involves genes other than major R-genes. These may be expressed at one or more growth stages and include partial or quantitative resistance and adult plant resistance (APR). Three novel major-effect powdery mildew APR genes from landraces (Rbgh1, Rbgh2, and Rbgh3) were identified in the terminal regions of the barley chromosomes, 5HL, 7HS, and 1HS, respectively [34]. Among the genes for barley brown rust resistance, three genes, Rph20 and Rph24 on chromosome 5HS and 7HS, respectively, and Rph23 on chromosome 6HS, confer high, moderate, and low levels of APR, respectively [8,22,29,35,36,37,38,39].
World-wide, there are about 1800 gene banks, including more than 600 in Europe [40], with about 7.4 million accessions stored globally [41]. However, only 25–30% of these accessions are genetically unique [42]. There is a need for characterization of this germplasm in terms of its agronomic potential, including resistance to biotic and abiotic stresses and for establishing associations between markers and phenotypes. This knowledge is necessary to enable the use of specific accessions in breeding programs [42,43,44,45,46]. However, the genetic studies were conducted on a still limited number of accessions [47]. To determine the markers that determine a qualitative trait controlled by many genes, including APR, the assessed collection should be highly variable for these traits. Old European barley cultivars or landraces are an important source of genetic variation and resistance to biotic stresses, including powdery mildew and rusts [2,23,48,49,50,51,52,53,54].
The aim of this study was to associate genetic loci with adult plant resistance (APR) to powdery mildew (PM), barley brown rust (BBR) and barley stem rust (SR) at heading and the milky-waxy plant seed development stages. To achieve this, we used GWAS analysis of DArTseq-derived markers and phenotypic data relating to 431 barley accessions, which are stored in the Polish Gene Bank, segregating for these disease resistance traits.

2. Materials and Methods

2.1. Plant Material

A collection of 431 barley accessions, including landraces and old cultivars, stored at the Polish Gene Bank (National Centre for Plant Genetic Resources: NCPGR) were phenotyped and evaluated using DArTseq: 137 POL, 67 DEU, 38 SWE, 35 CSK, 34 FRA, 27 GBR, 25 DNK, 21 NLD, 12 AUT, 8 SUN, 6 NOR, 4 FIN, 3 IRL, 3 CAN, 2 USA, 2 HUN, 1 each from UKR, TUR, PRK, NZL, JPN, BEL, and 1 of unknown origin were evaluated. For evaluation using DArTseq 23, additional control genotypes were included.
Barley was one of the principal crops that accompanied the spread of agriculture into Europe during the 6th and 5th millennia BC and was dispersed along two main routes: a southern route along the Mediterranean, reaching the Iberian peninsula, and a northwards route passing through central Europe, eventually reaching northern Scotland [55,56]. Because of this, the accessions were grouped into sub-collections, either by country of origin or by European region. These sub-collections were: Polish; West-Central European (CSK, DEU, DNK, AUT); French; Great British; North European (FIN, NOR); and Swedish. The accessions were further classified into three groups: group A (206 accessions), representing old cultivars cultivated prior to 1985; group B (178 accessions), representing moderate and modern cultivars cultivated after 1985; and group C (37 accessions), representing Polish landraces (Table 1). These sub-collections correspond to barley domestication and adaptation in Europe and temporal trends in genetic diversity in European cultivars [57].
Landrace accessions are genotypes that were not improved by breeders. Old cultivars were improved and obtained based on selection during breeding programs.
The Polish accessions were selected to reflect the diversity of the Polish accessions held at the Gene Bank, with priority given to those with key phenotypic traits in Polish breeding programs. This was then supplemented with non-Polish accessions from countries where a particular trait is most frequent. The passport data, listed in Additional file 1 include: accession number (ACCENUMB), accession name (ACCENAME), country of origin (ORIGCTY), institute code (INSTCODE)/institute name, acquisition date (ACQDATE), donor institution code (DONORCODE)/donor institute name (DONORNAME), and type of germplasm storage (STORAGE).

2.2. Field Experiments and Phenotypic Evaluation

Field experiments were conducted in 2018 and in 2019 on the experimental fields of the Plant Breeding and Acclimatization Institute—National Research Institute (PBAI-NRI), Radzikow, near Warsaw, Poland. No specific permissions were required. No endangered or protected species were involved.
The experimental trials were conducted in a randomized complete block design. In 2018, seeds were sown in three replications (blocks), and in 2019 in two replications, in rows (row length of 2.0 m), with a plant spacing of 4.0 cm and a row spacing of 20.0 cm.
The powdery mildew (PM), stem rust (SR), and barley brown rust (BBR) were scored according to IPGRI descriptors (https://cropgenebank.sgrp.cgiar.org/index.php/learning-space-mainmenu-454/manuals-and-handbooks-mainmenu-533/descriptors-mainmenu-547 (accessed on 29 October 2021)), using a 1–9 scale, where 1 means no symptoms of the disease (immune reaction).
In 2019, a trait measurement was conducted at the heading stage (HA), when half of the heads had emerged for 50% of the plants in a plot (Z55, according to the Zadoks growth scale) and, 2 weeks later, at the early milky-waxy seed maturity stage (MW; Z75, according to the Zadoks growth scale) [58]. In 2018, the measurement was conducted once, in the milky-waxy stage.

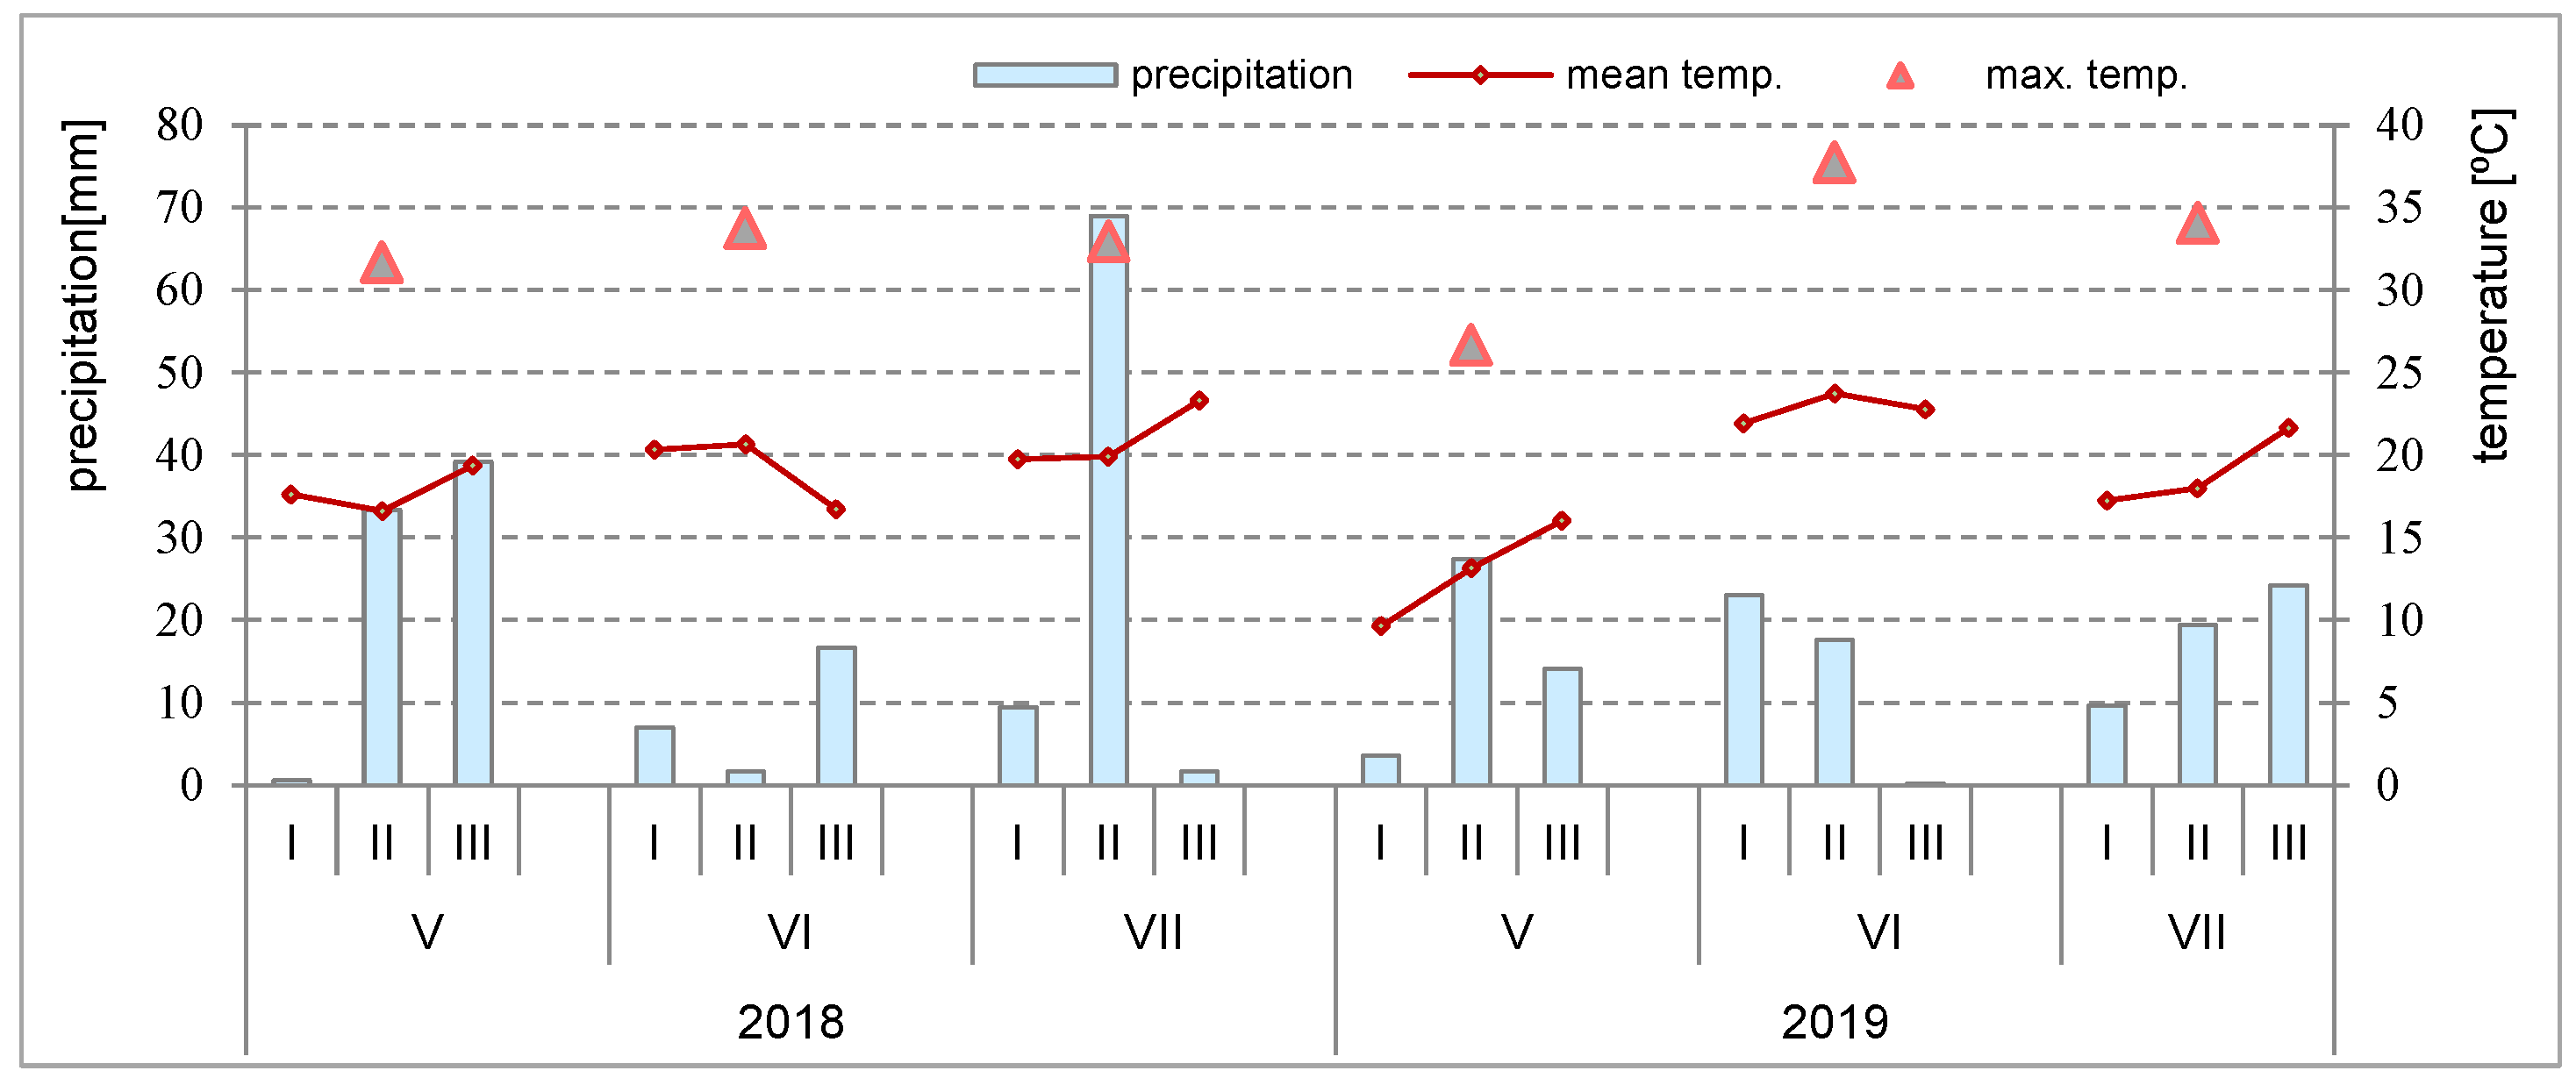
2.3. Weather Conditions

The weather conditions, including the mean and maximum temperatures (°C) and precipitation (mm), were monitored during the second quarter of 2018 and 2019 (May–July) (Figure 1). This was a period when the plants were in the heading to physiological maturity and harvest stages.
The average air temperature and precipitation are presented for 10 days of each month. The maximum temperature is the maximum temperature that occurred in the month.

2.4. Statistical Analysis

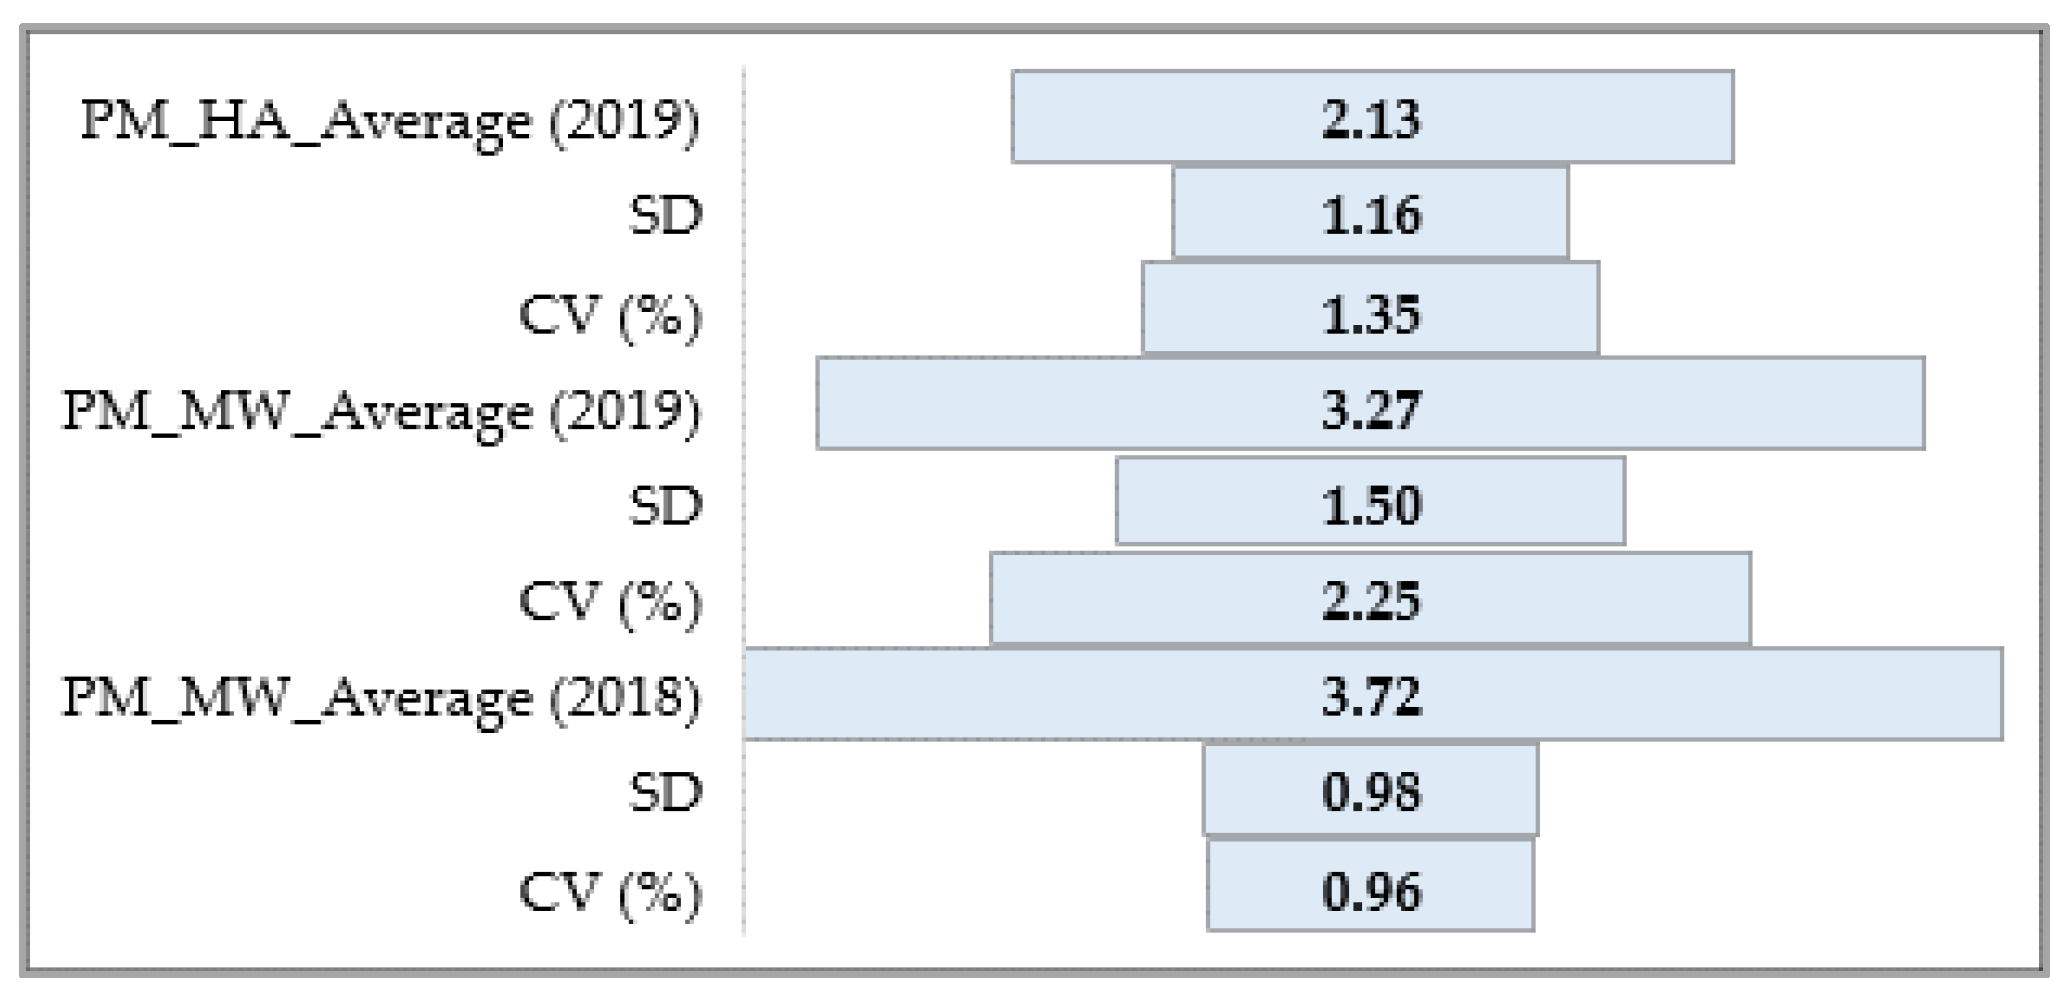
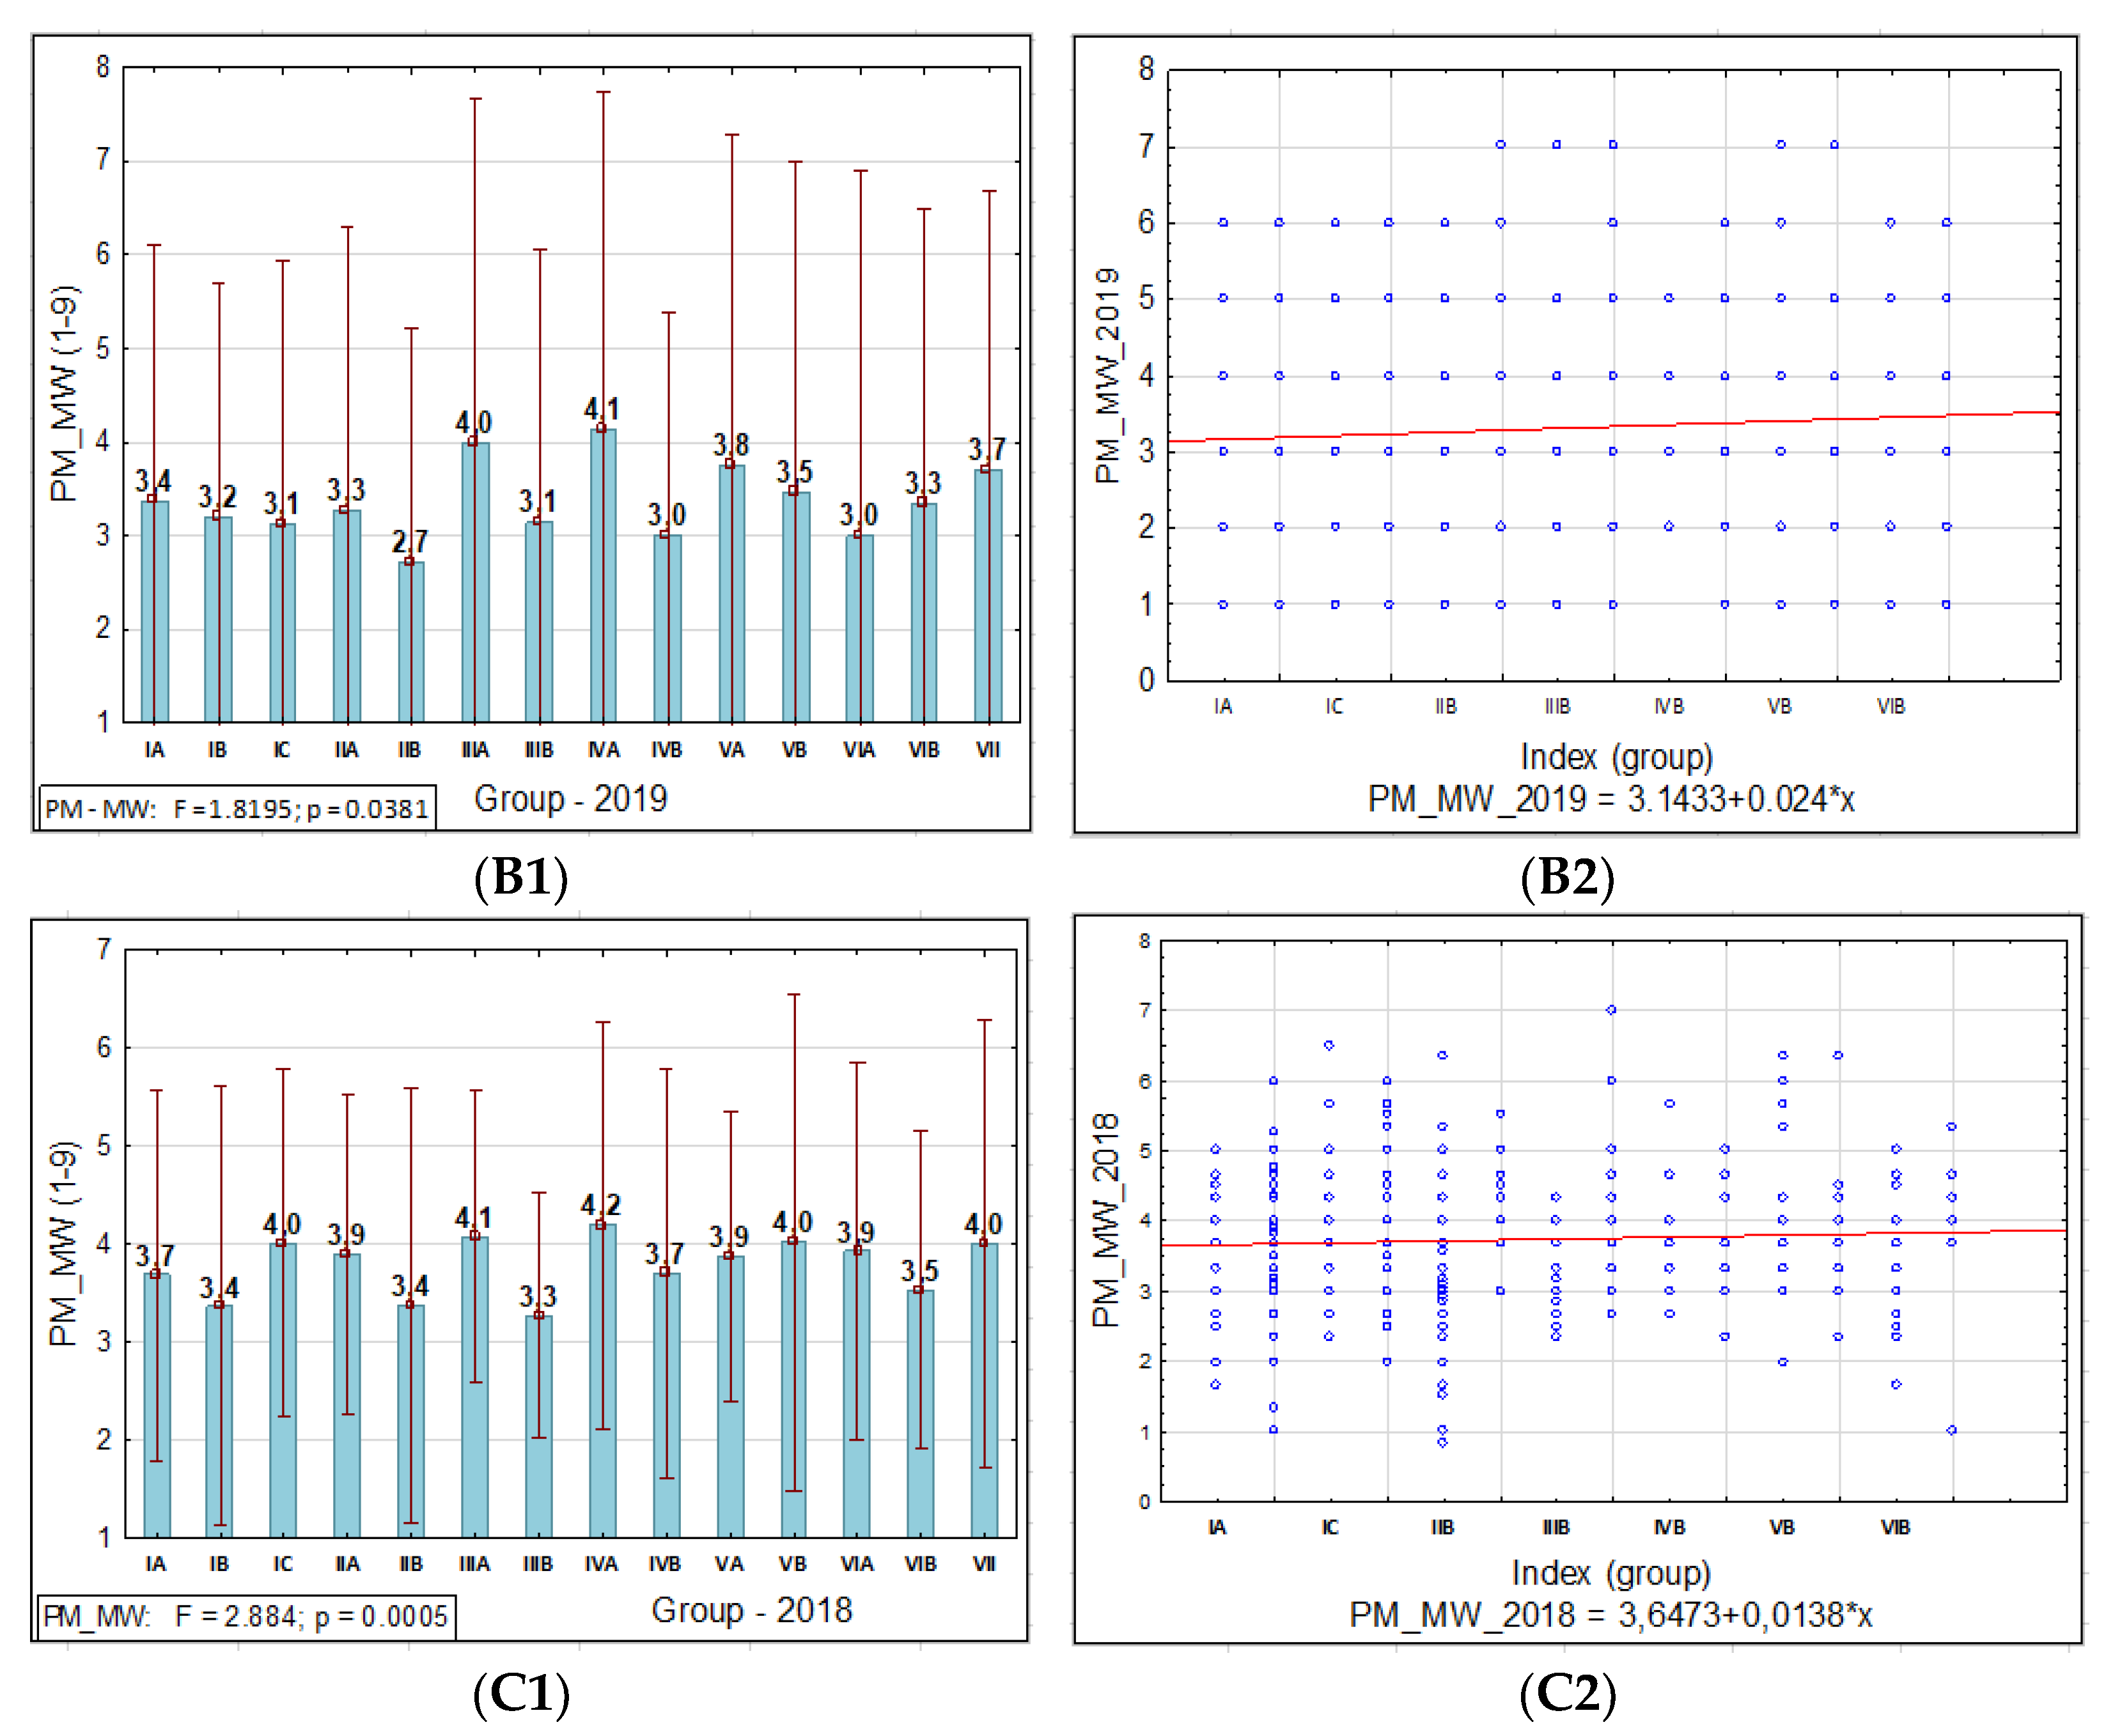
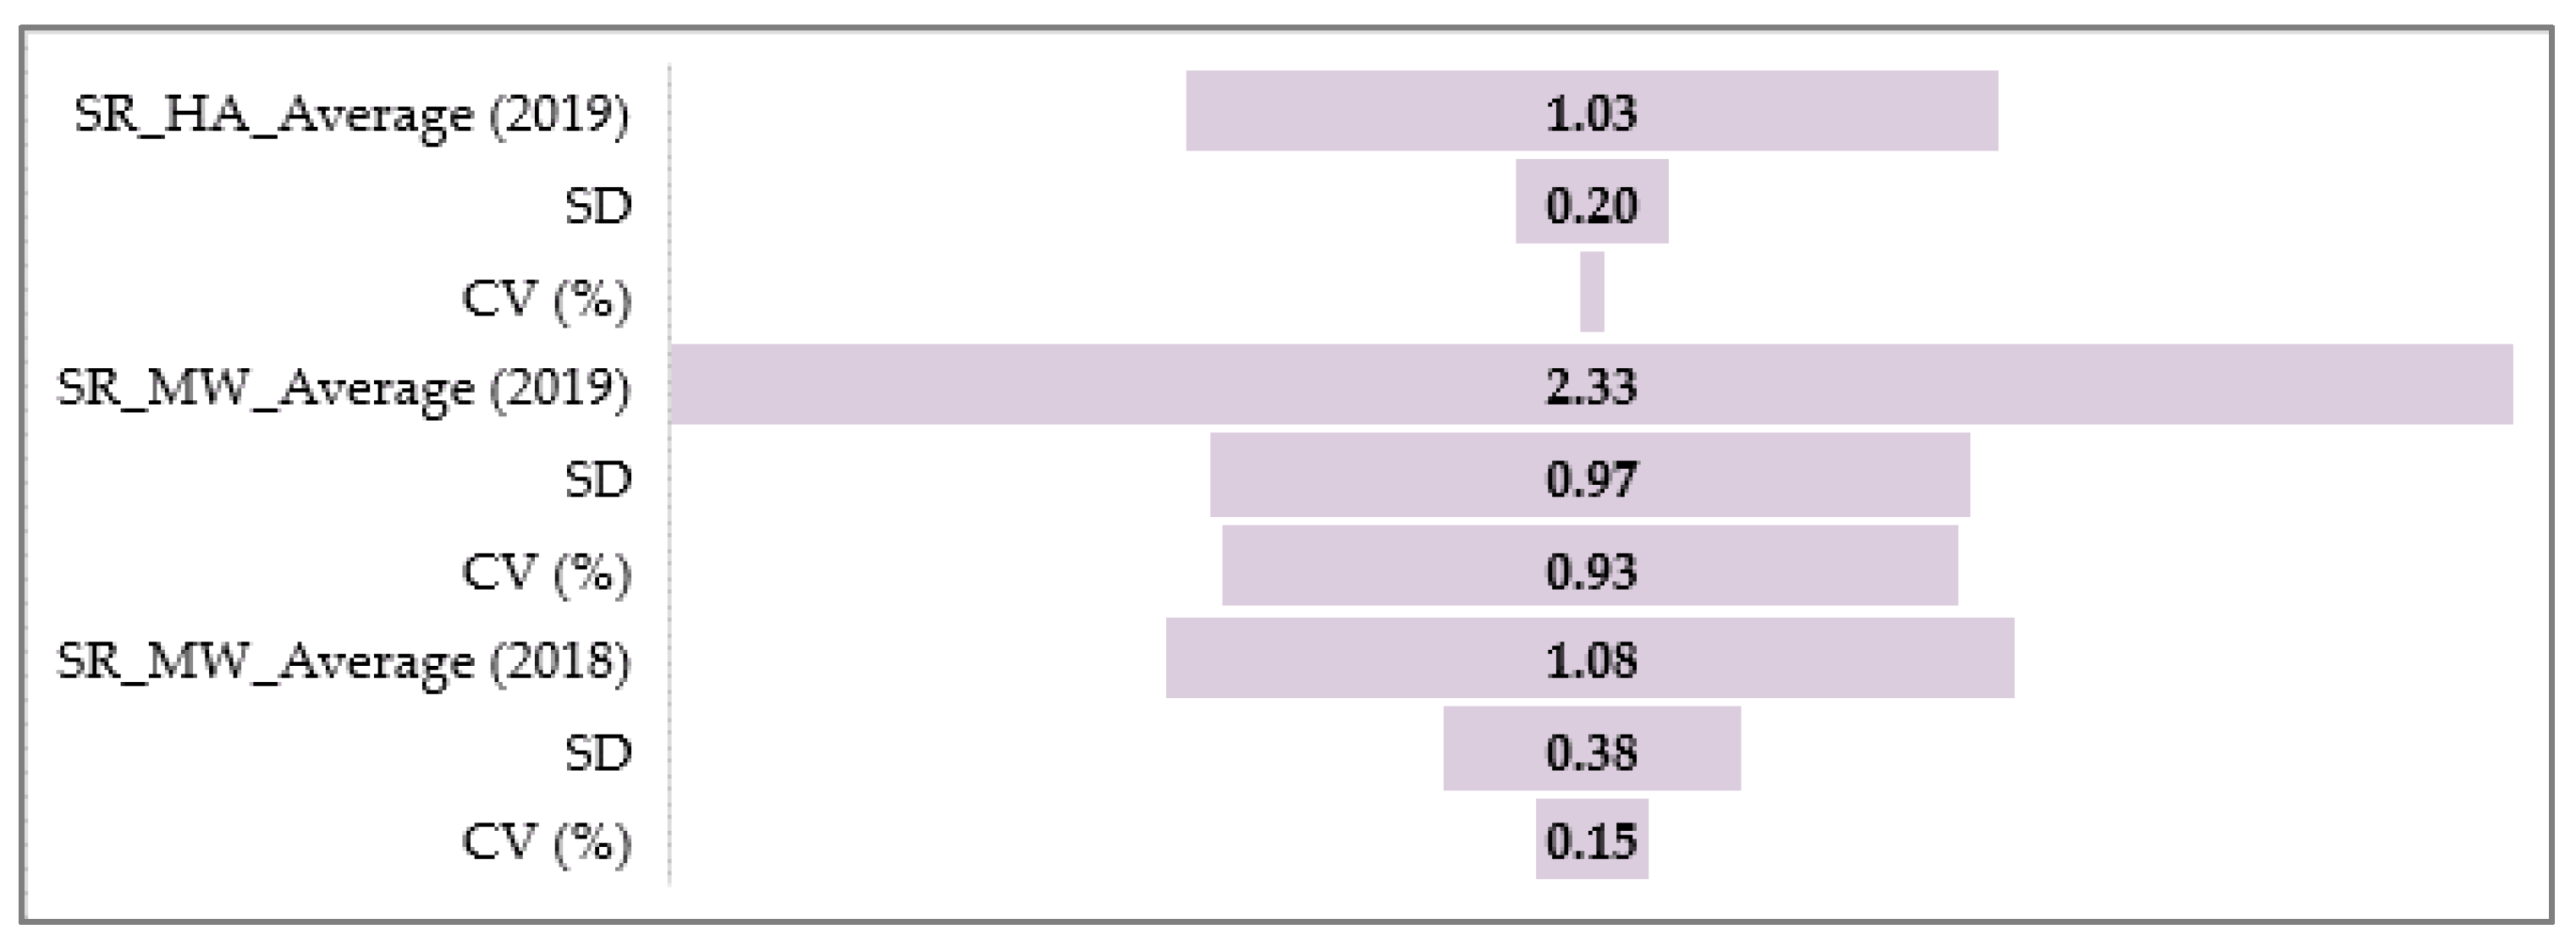
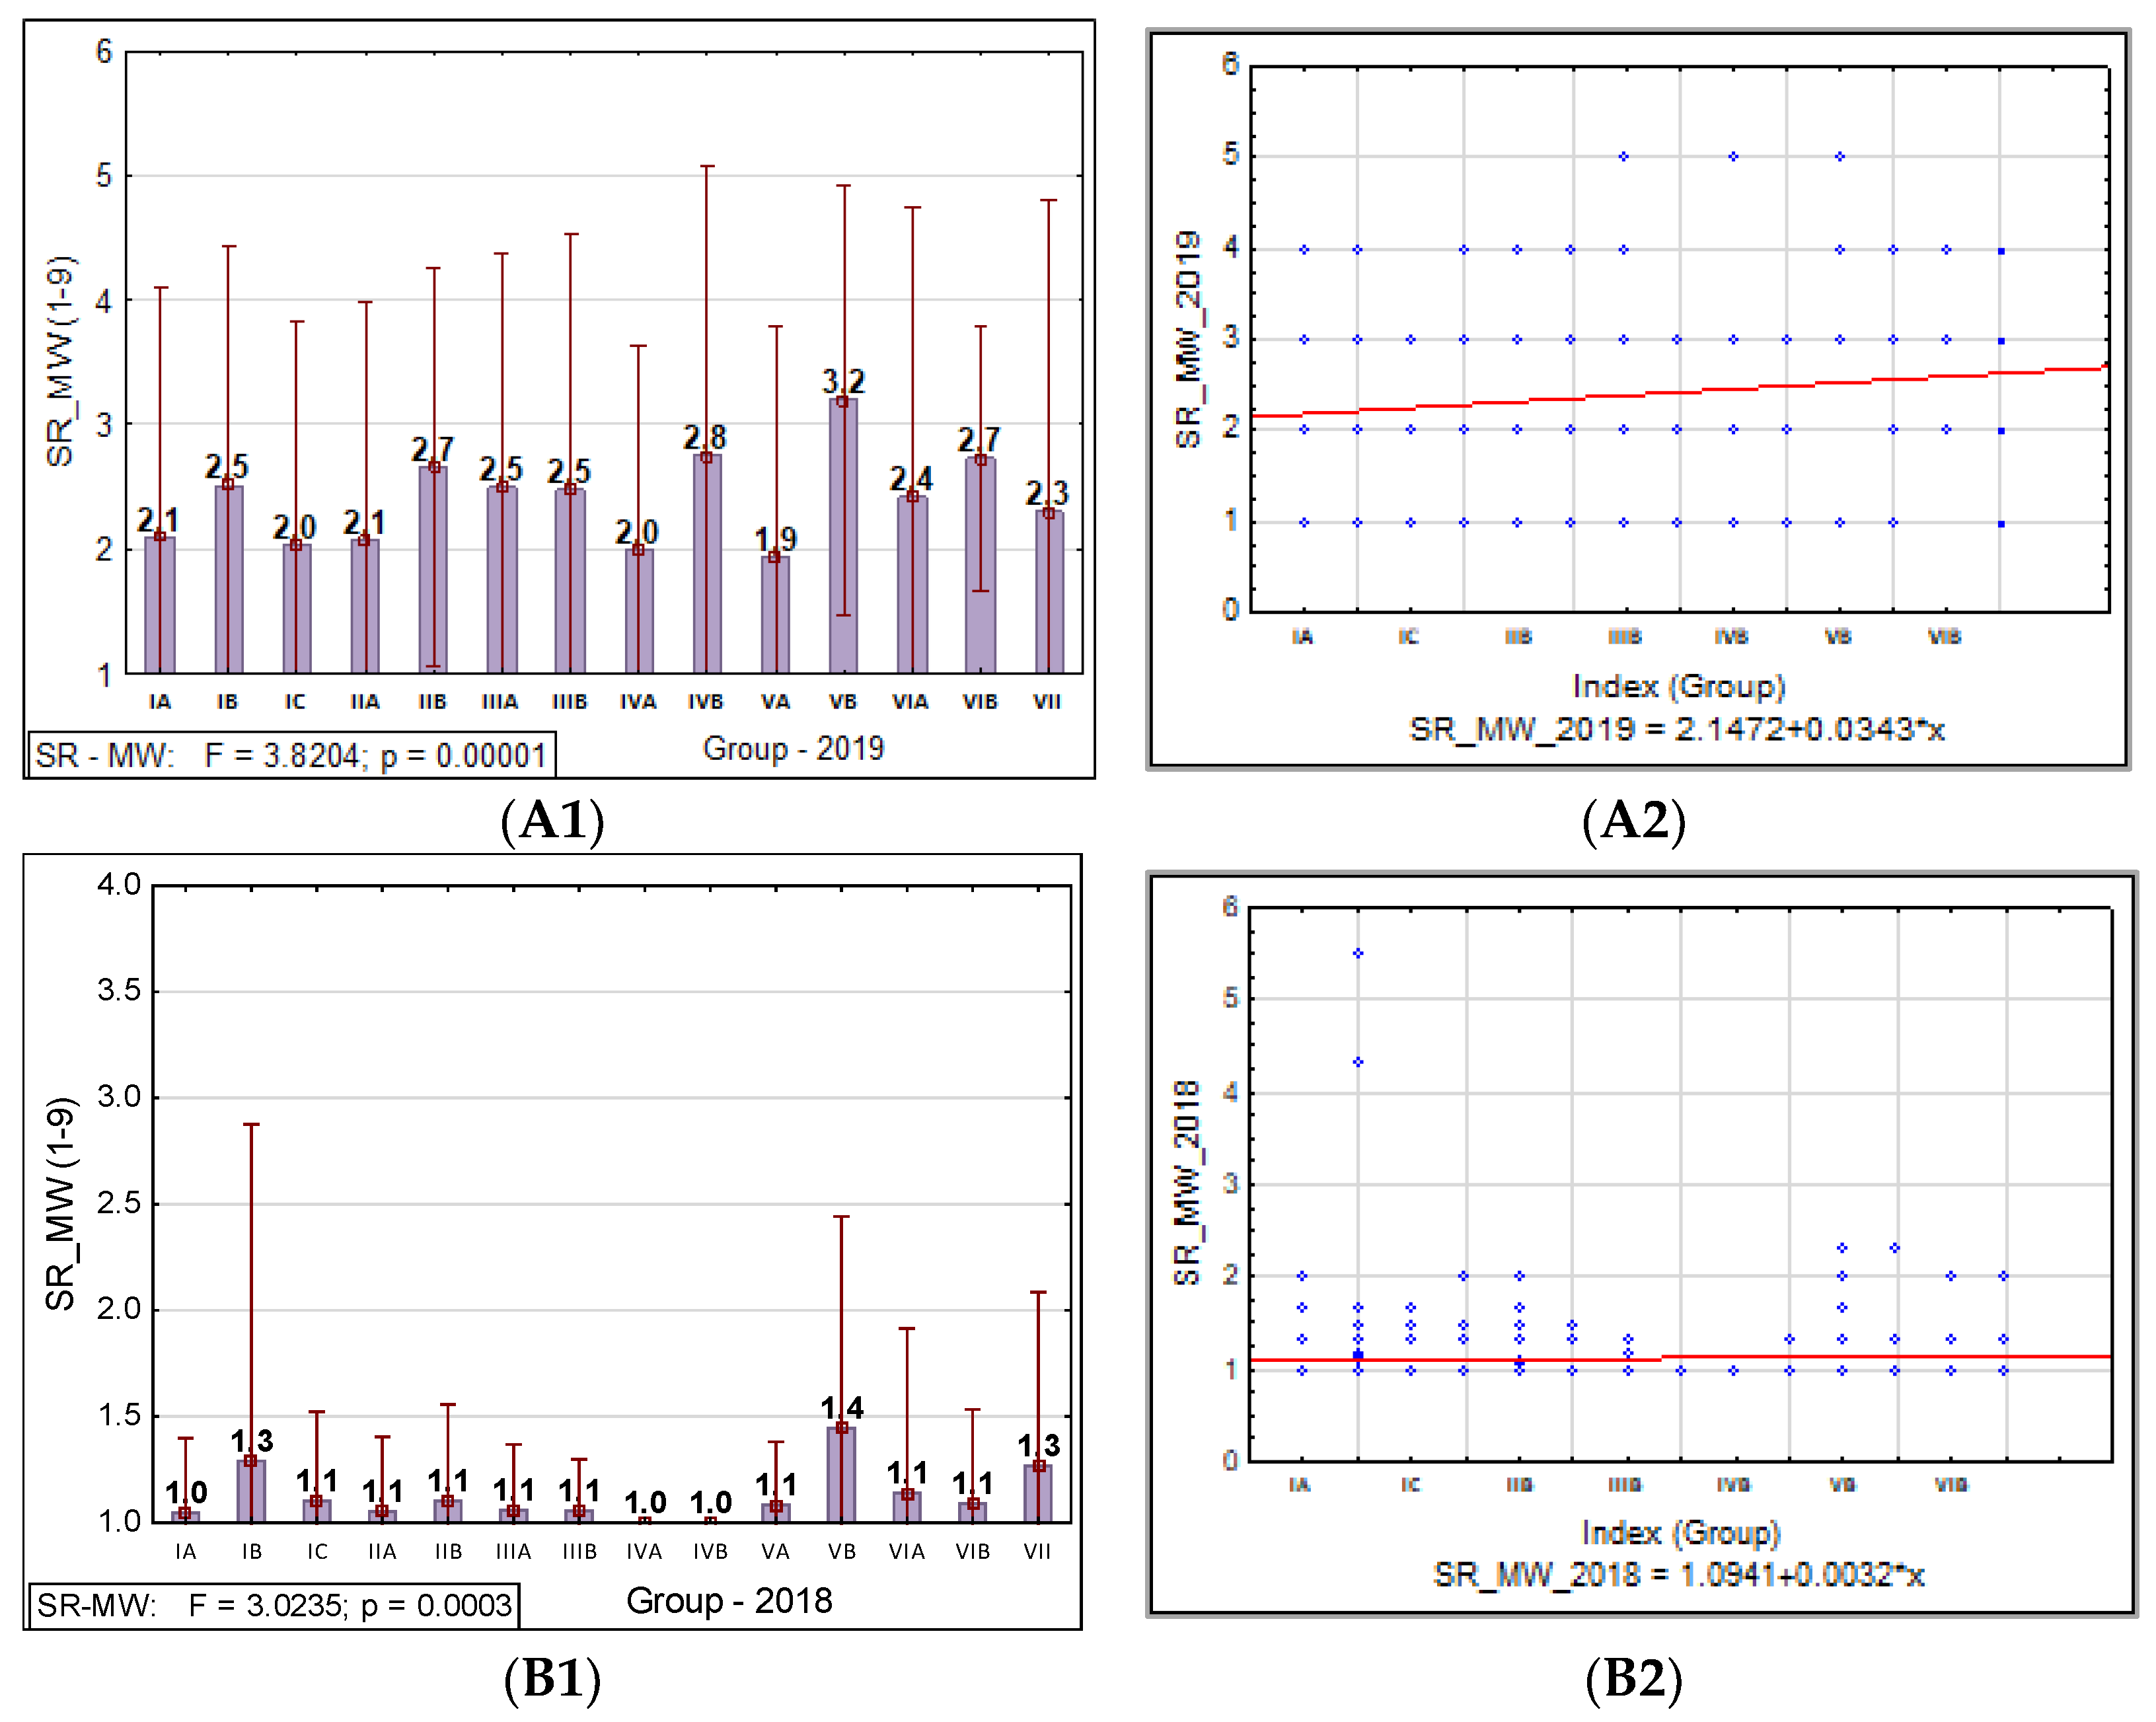
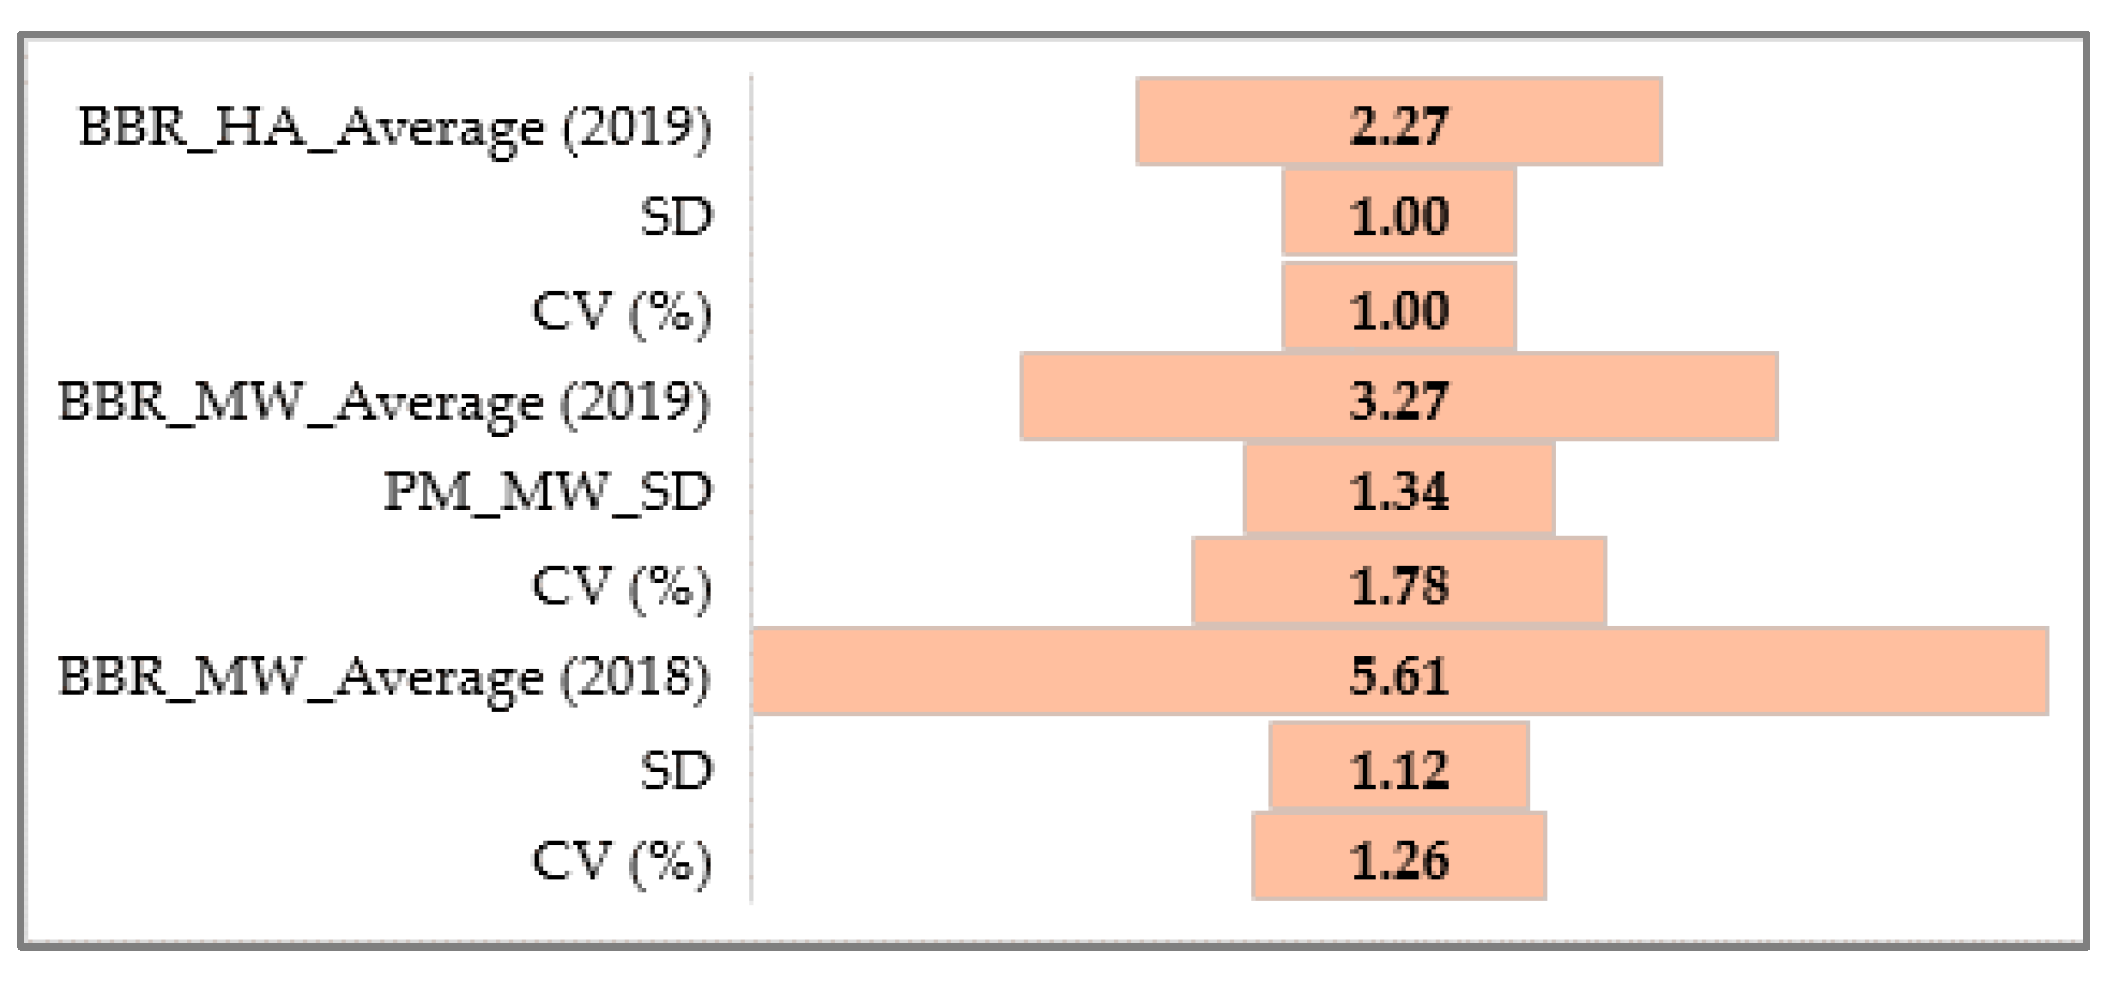
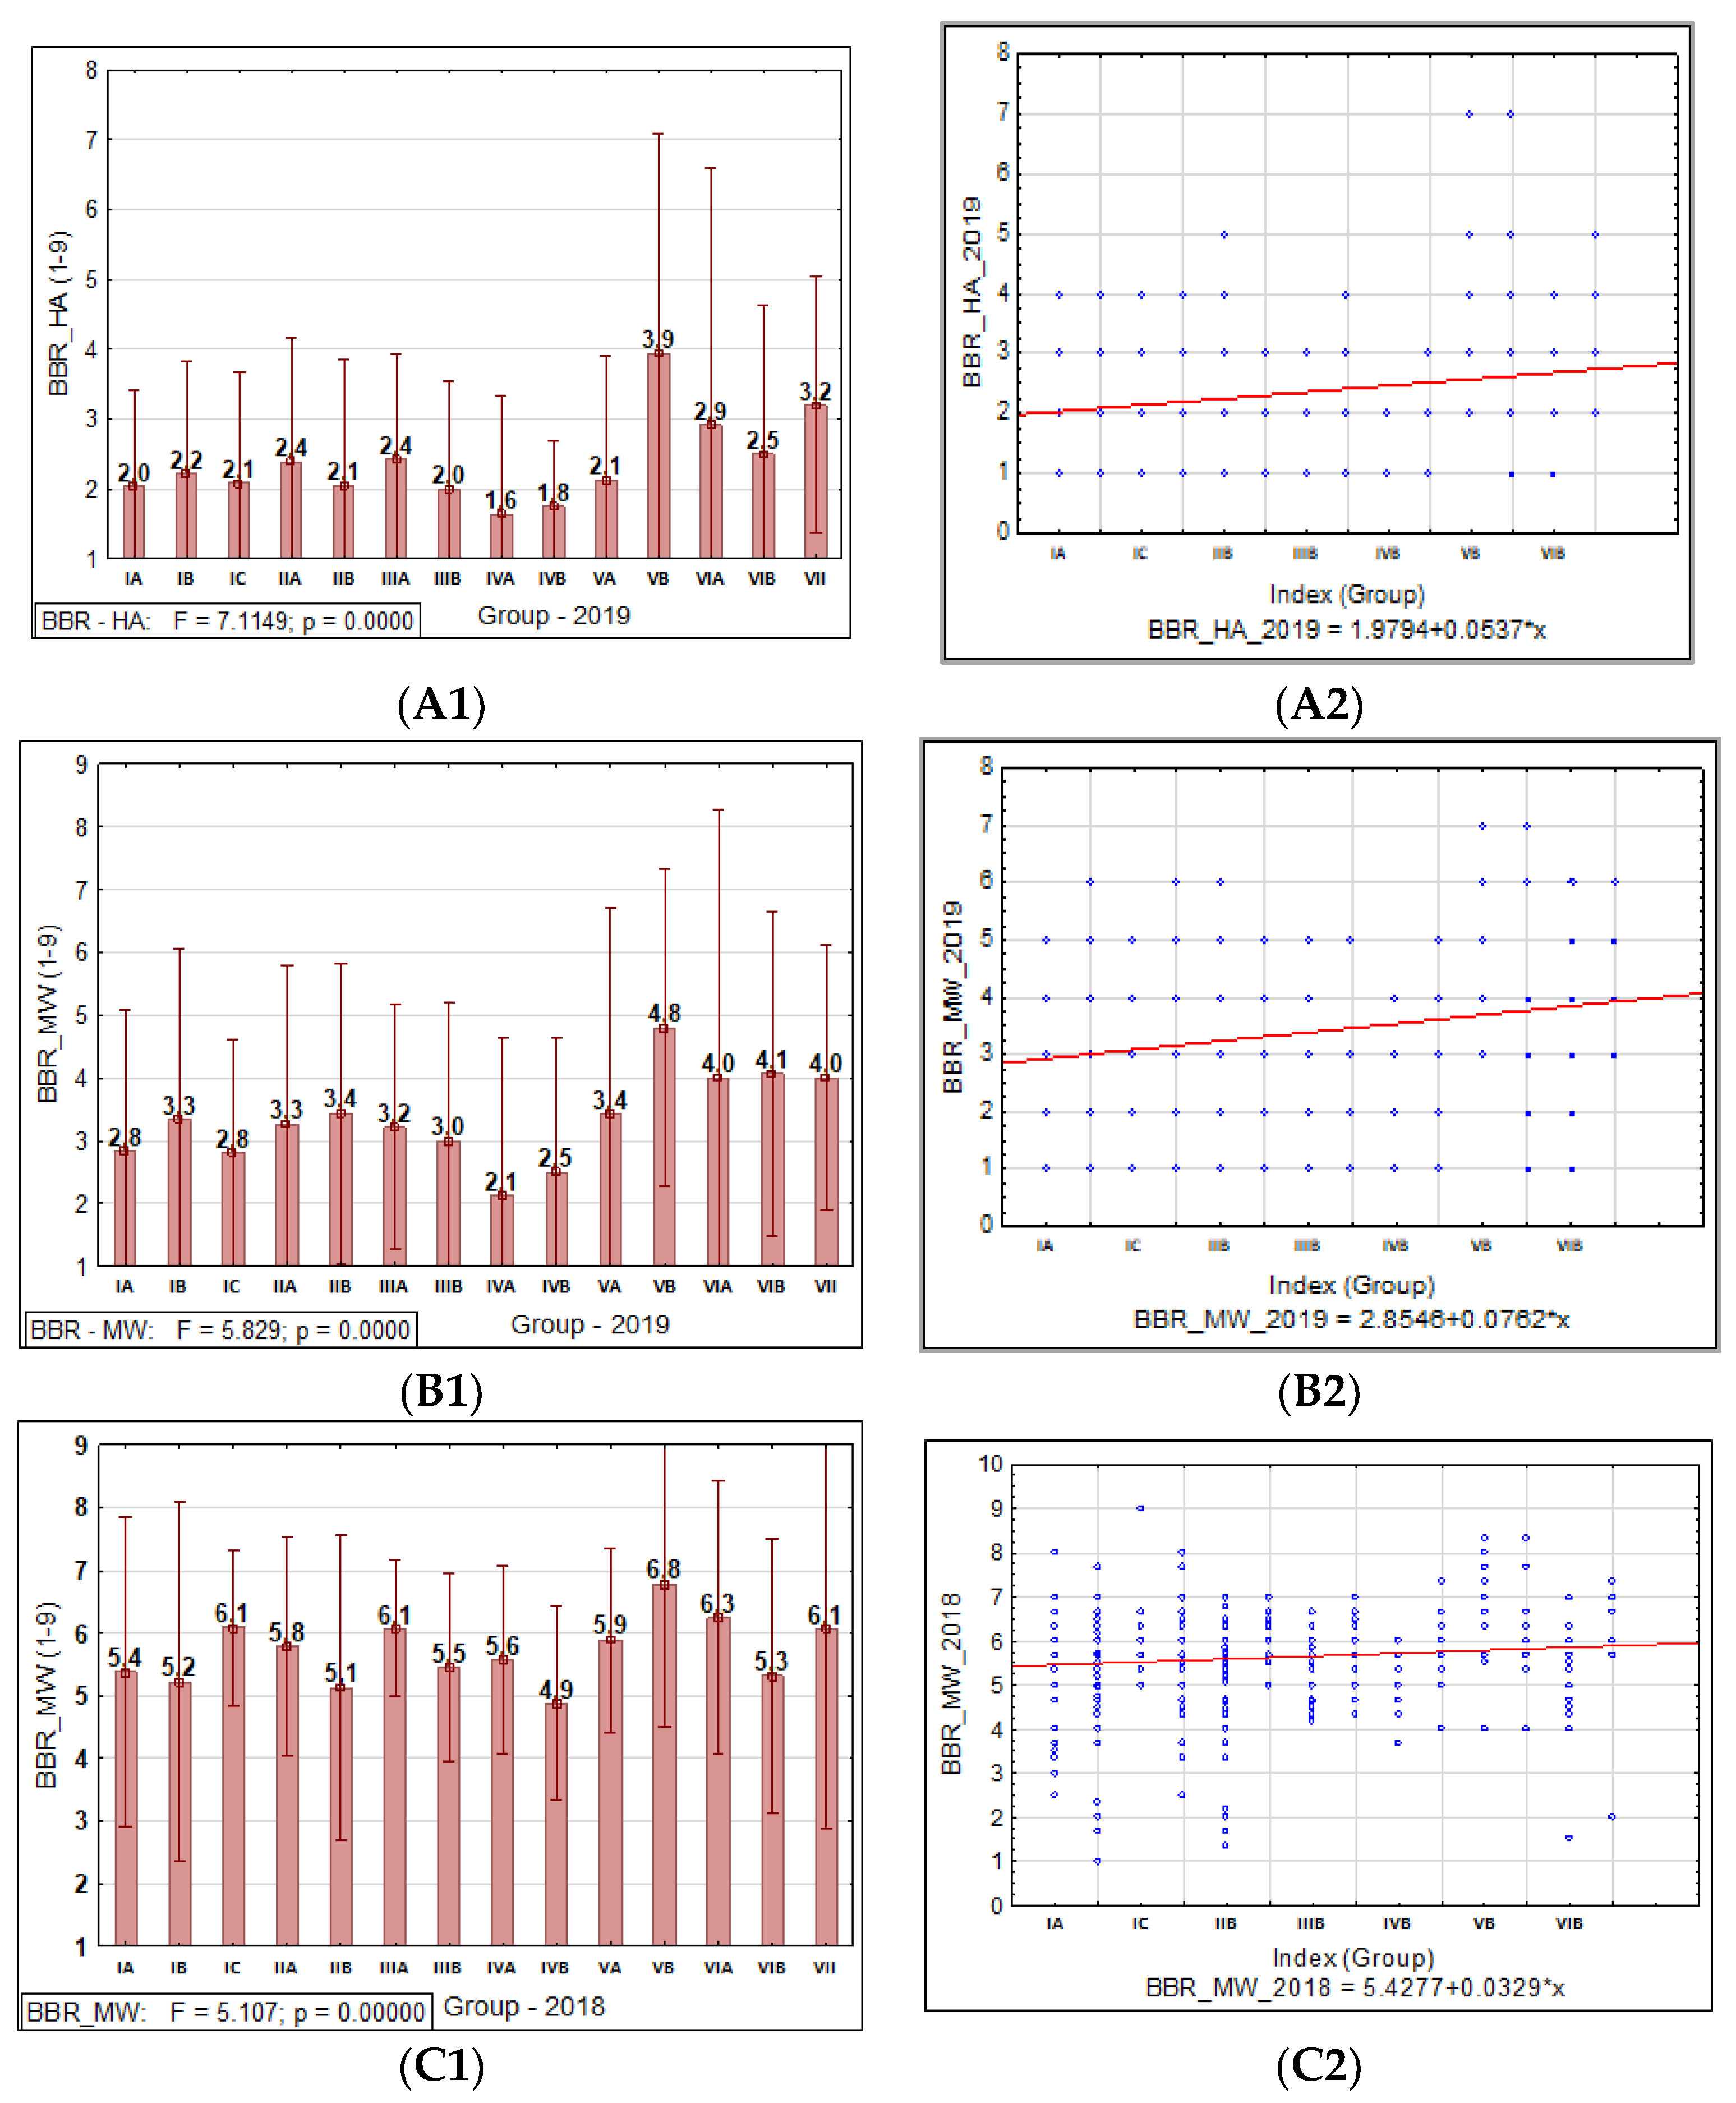
A statistical analysis of all the traits, PM, SR, and BBR resistance at the HA and MW stages, was conducted using Statistica software (version 13.31984-2017 TIBCO Software). It was used to obtain the range, mean, standard deviation (SD), coefficient of variation (CV), and analysis of variance (ANOVA test; α ≤ 0.05) values to confirm the significance of the differences in PM, SR, and BBR resistance between the accessions and the sub-collections. The sub-collections were created using two criteria: (1) cultivation period or registration of cultivars (group A—cultivated prior 1985, B—cultivated after 1985 and C—Polish landraces) and (2) country of origin or geographical region. For the sub-collections, the results are presented in the form of graphs with ANOVA and SD bars. Based on the differences between the sub-collections, it was possible draw conclusions about the progress (gain) in the breeding programs over the years.
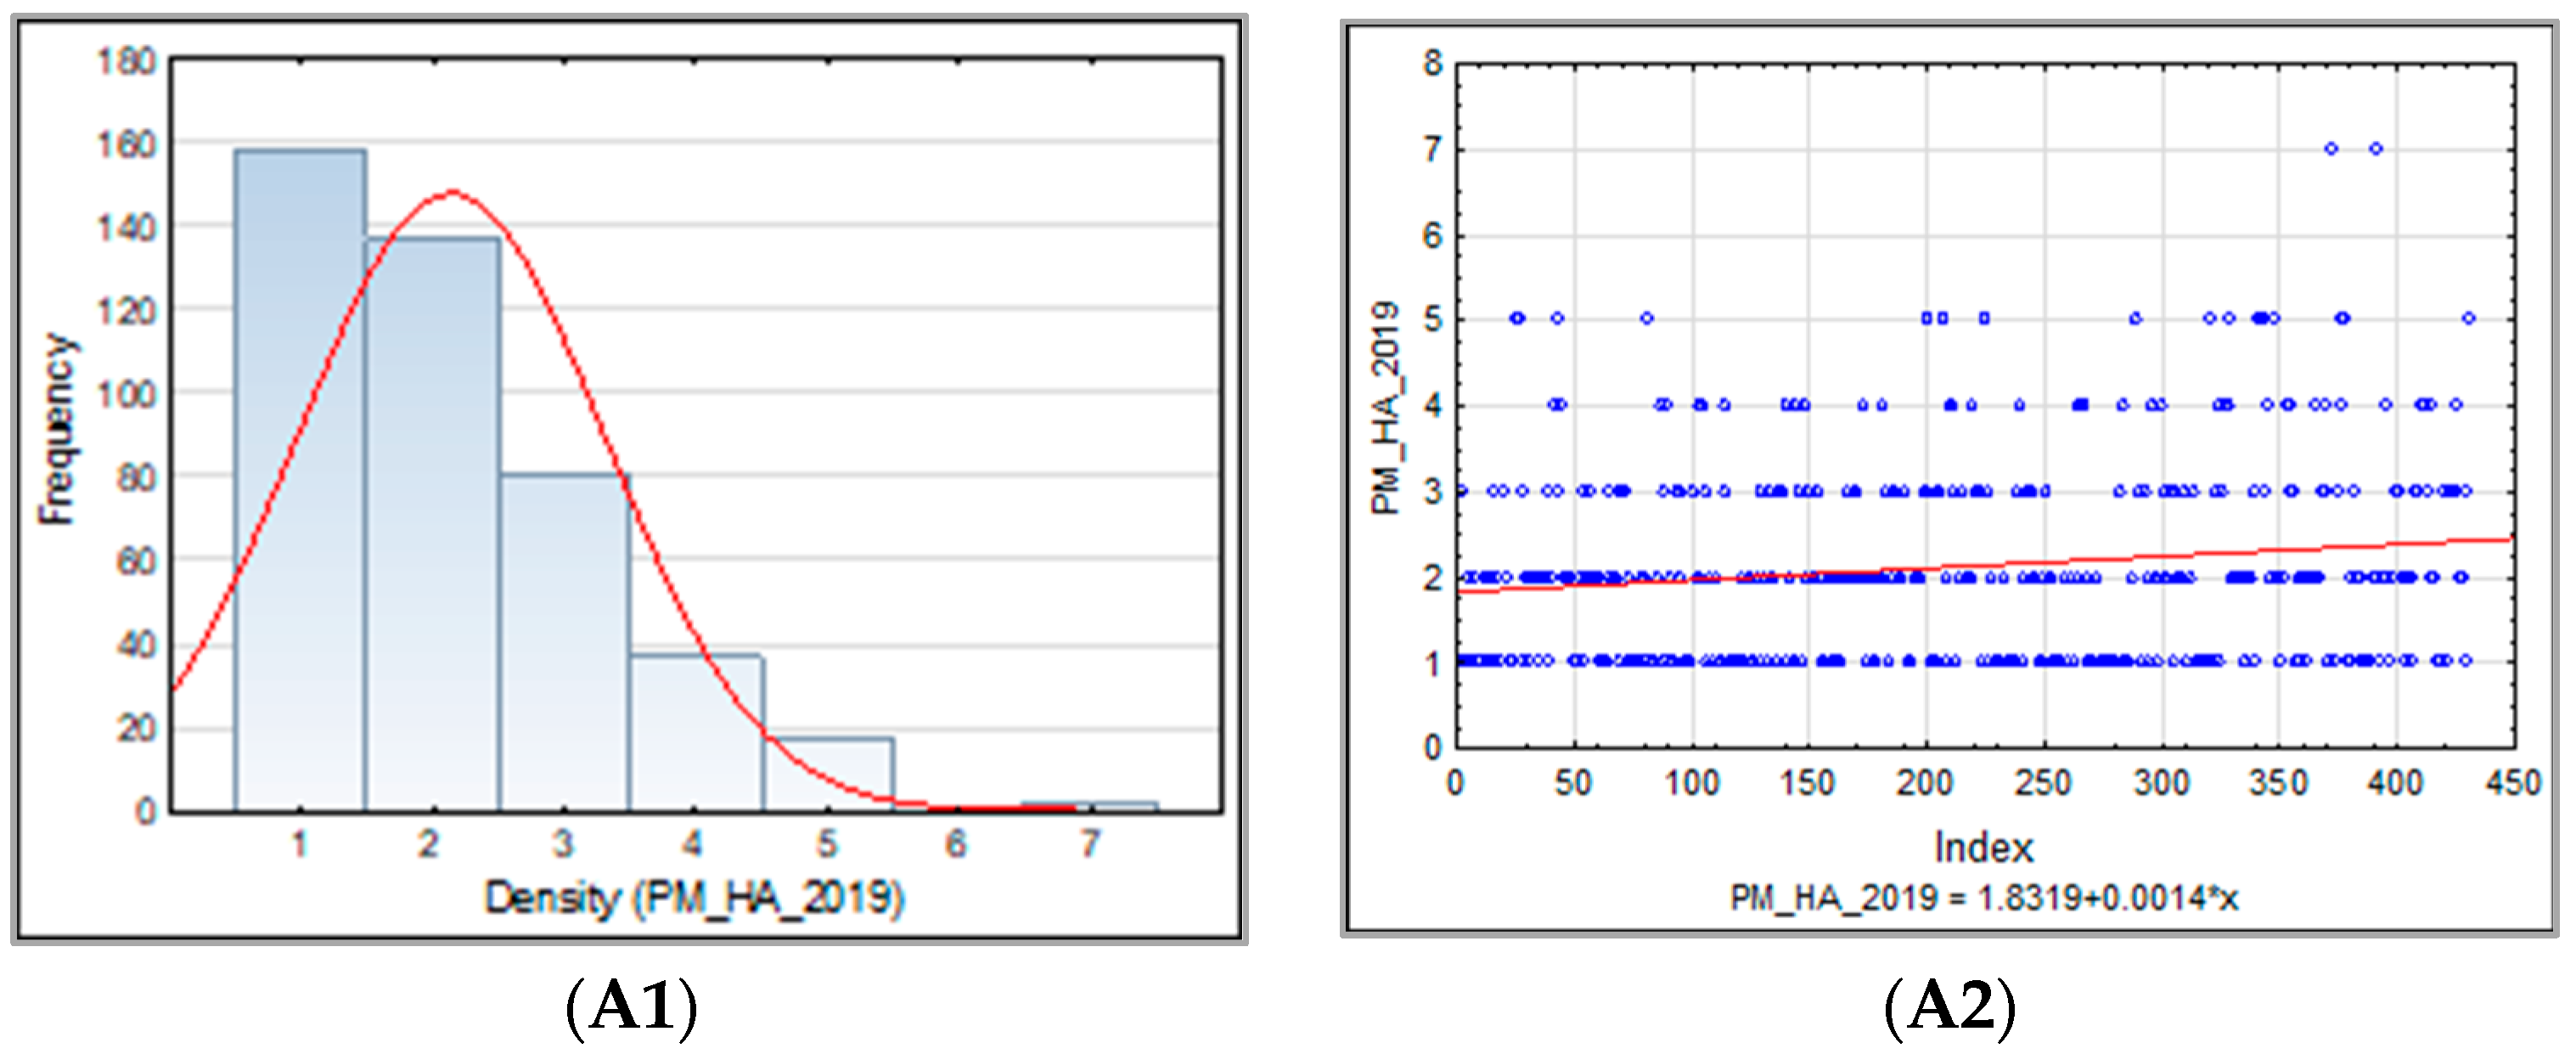
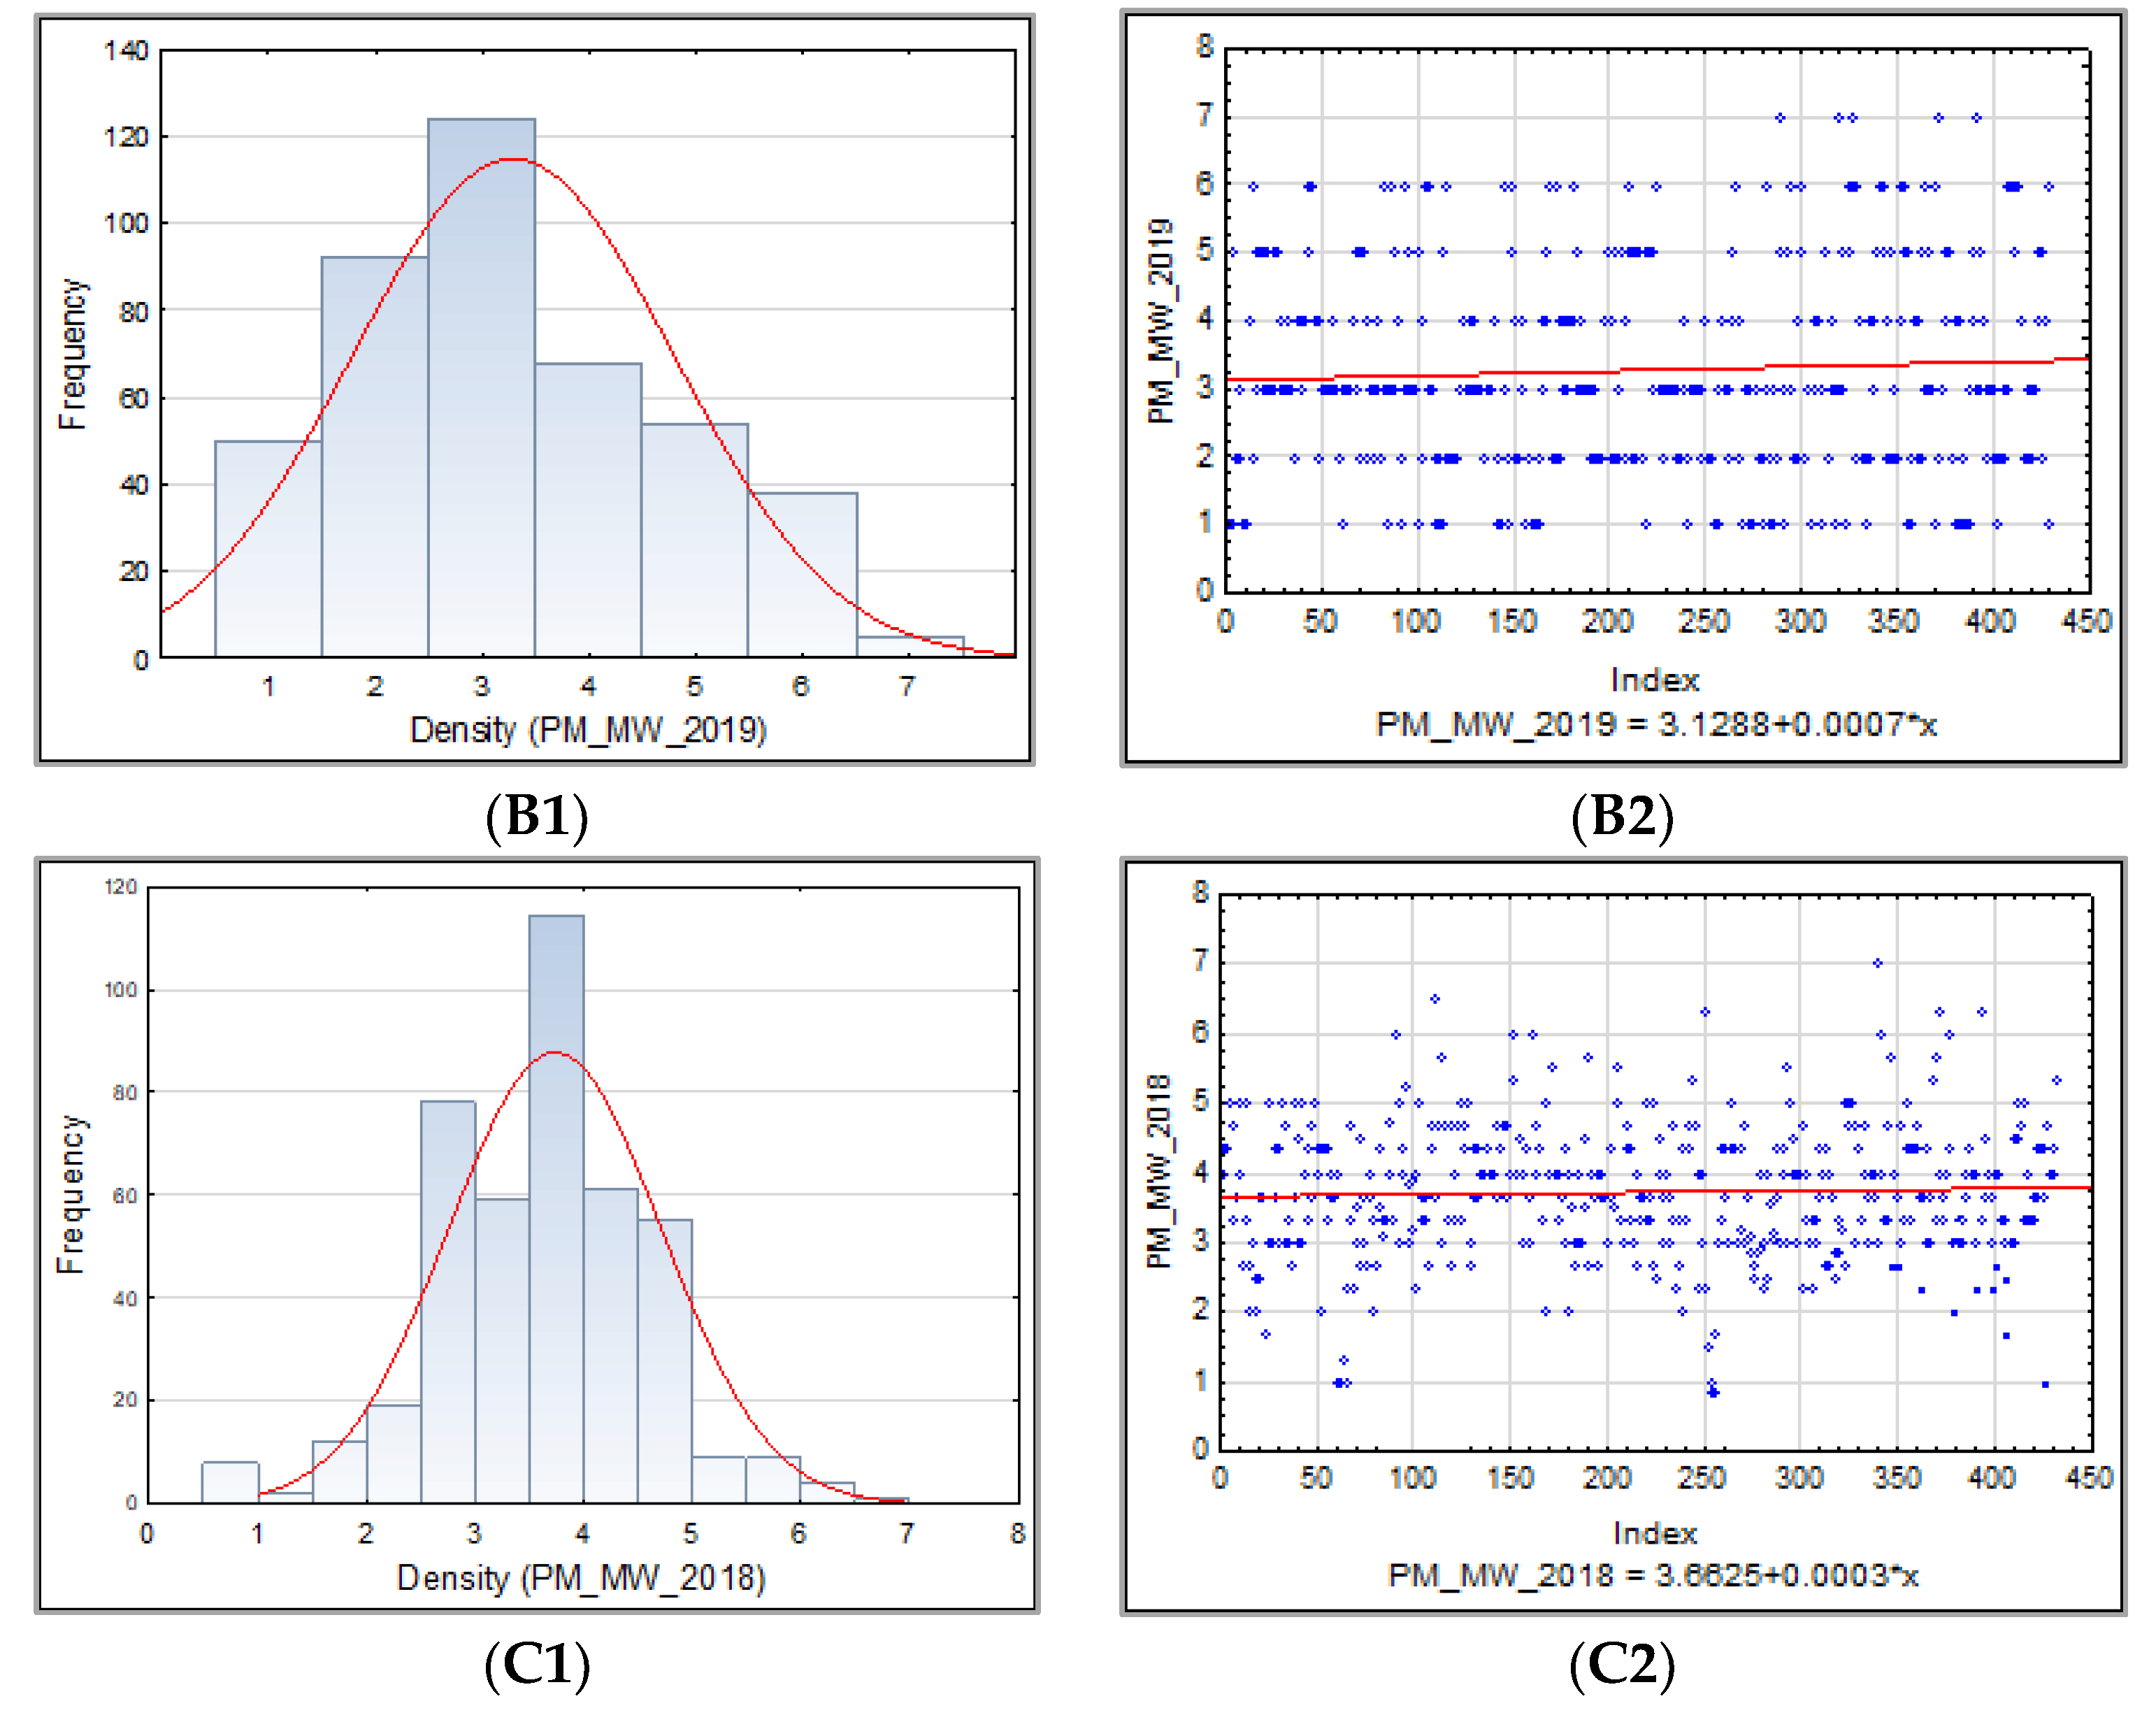
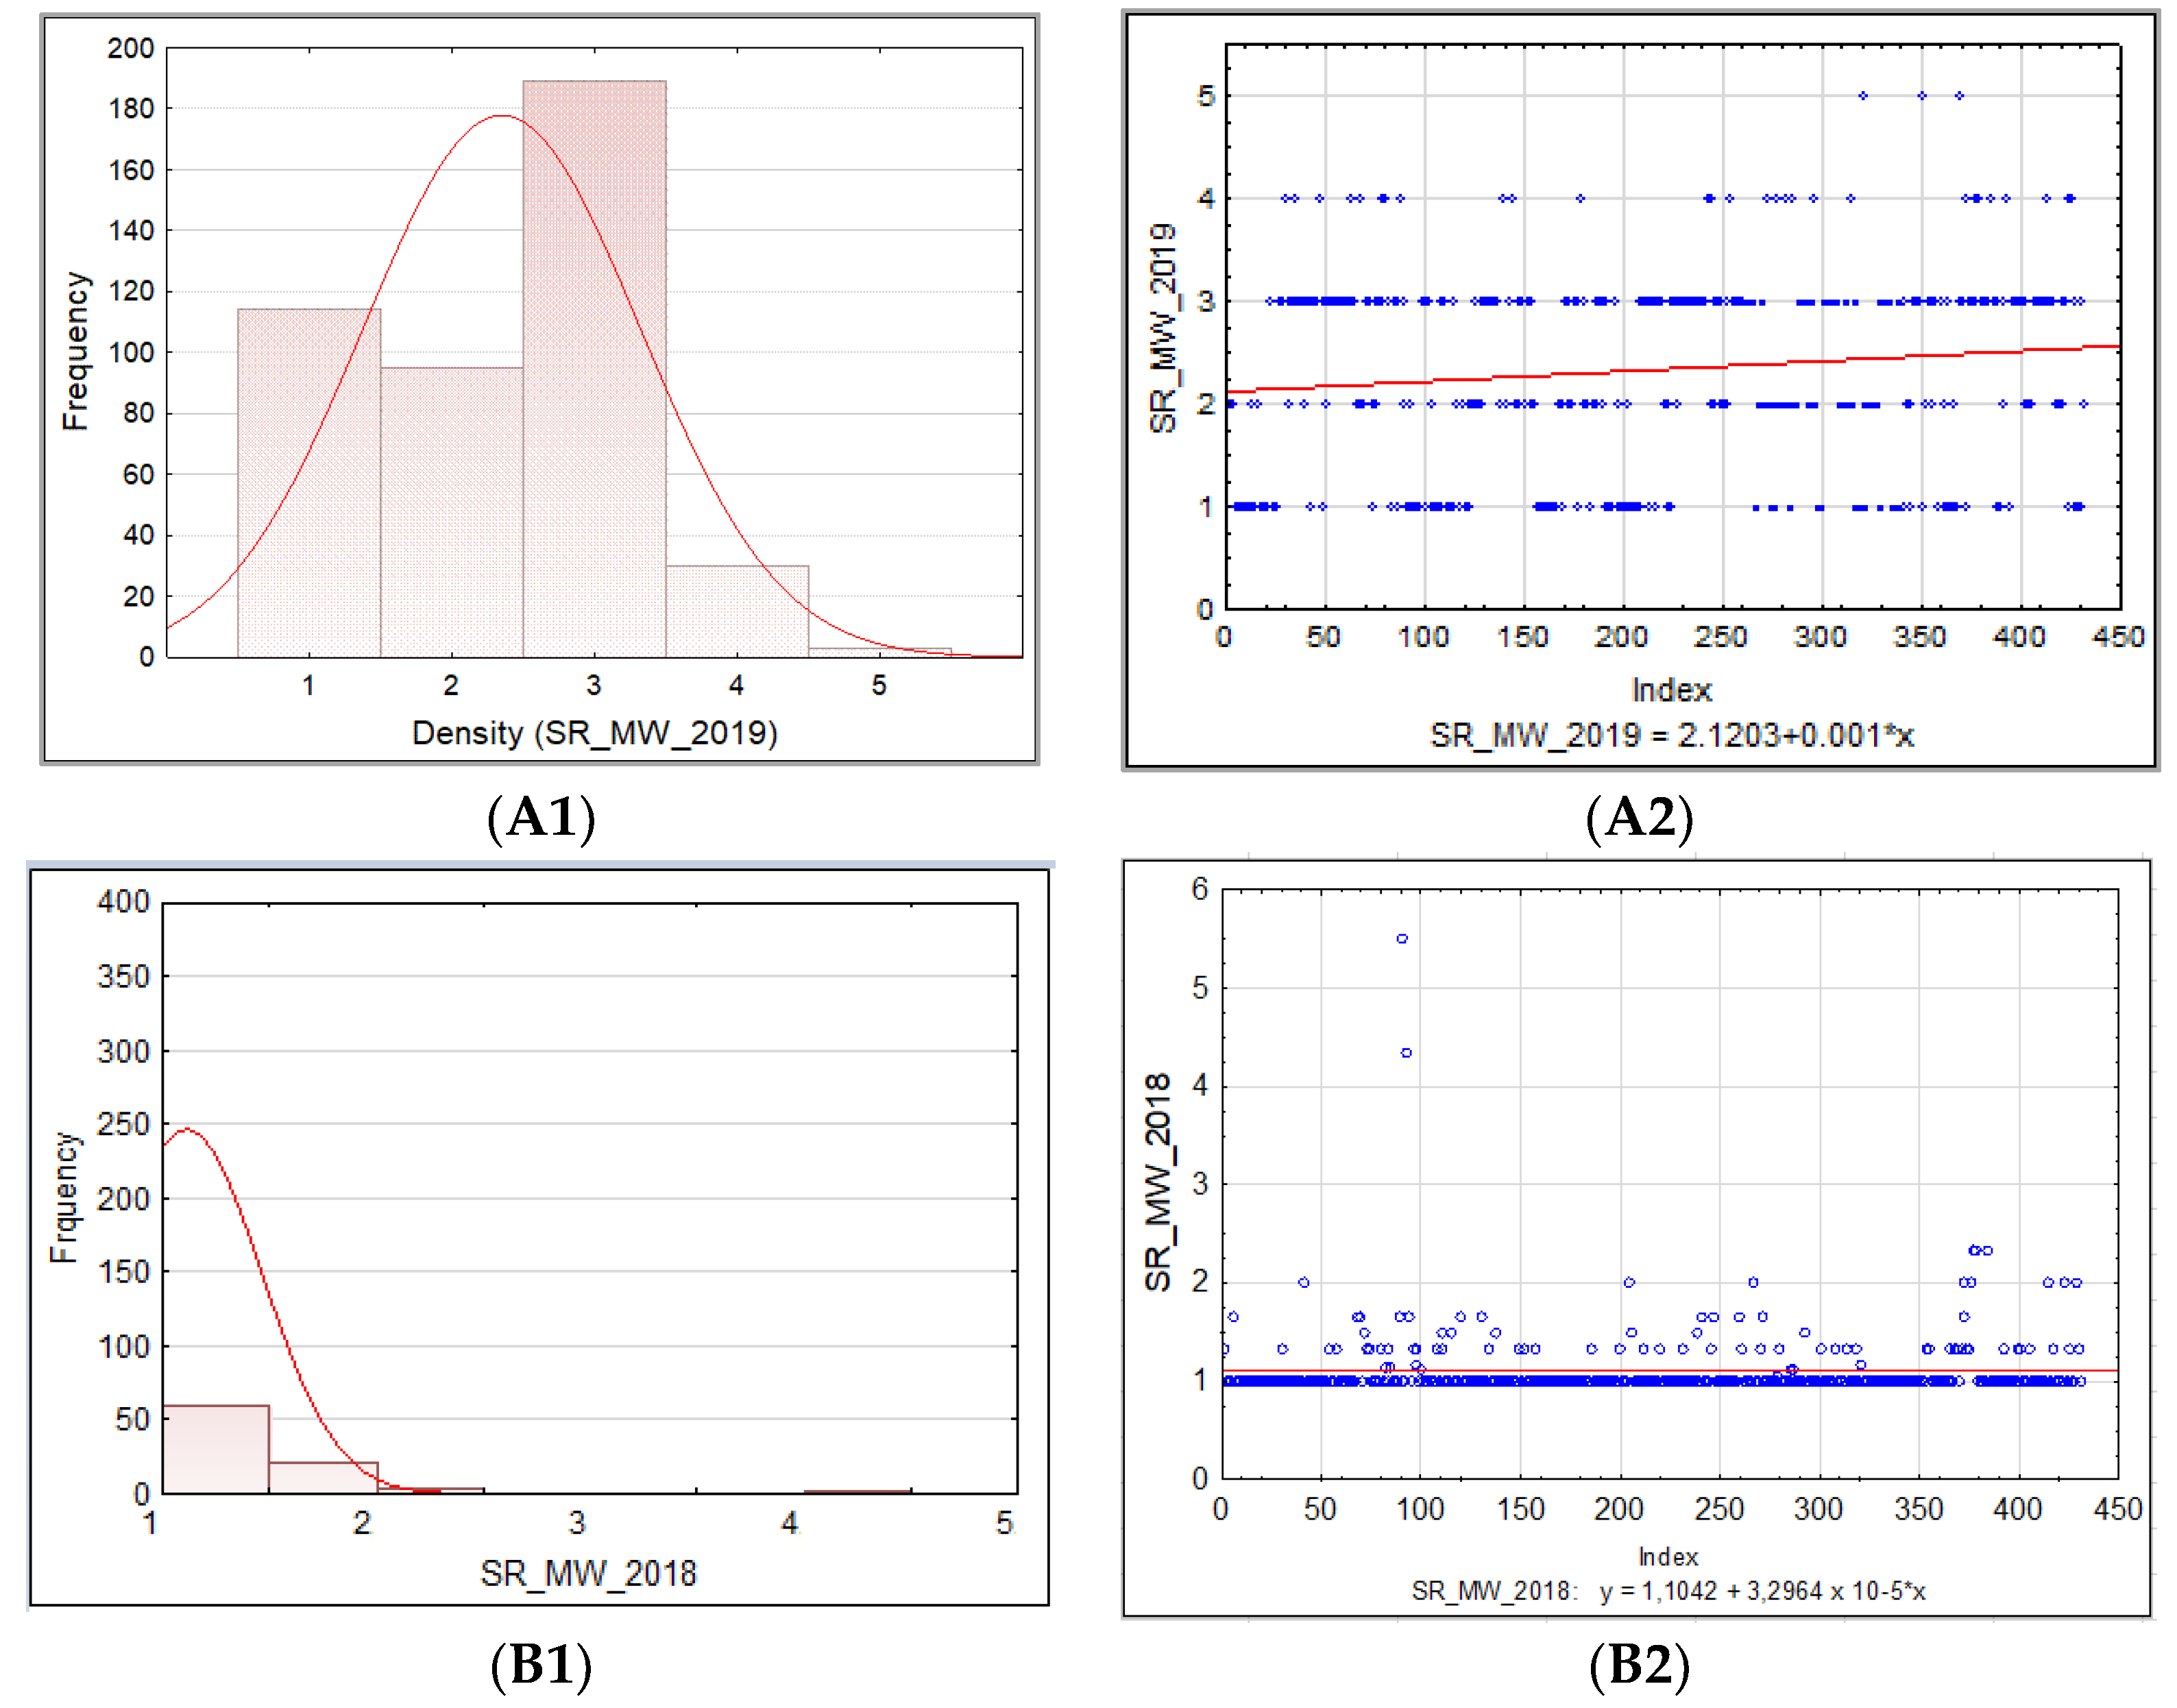
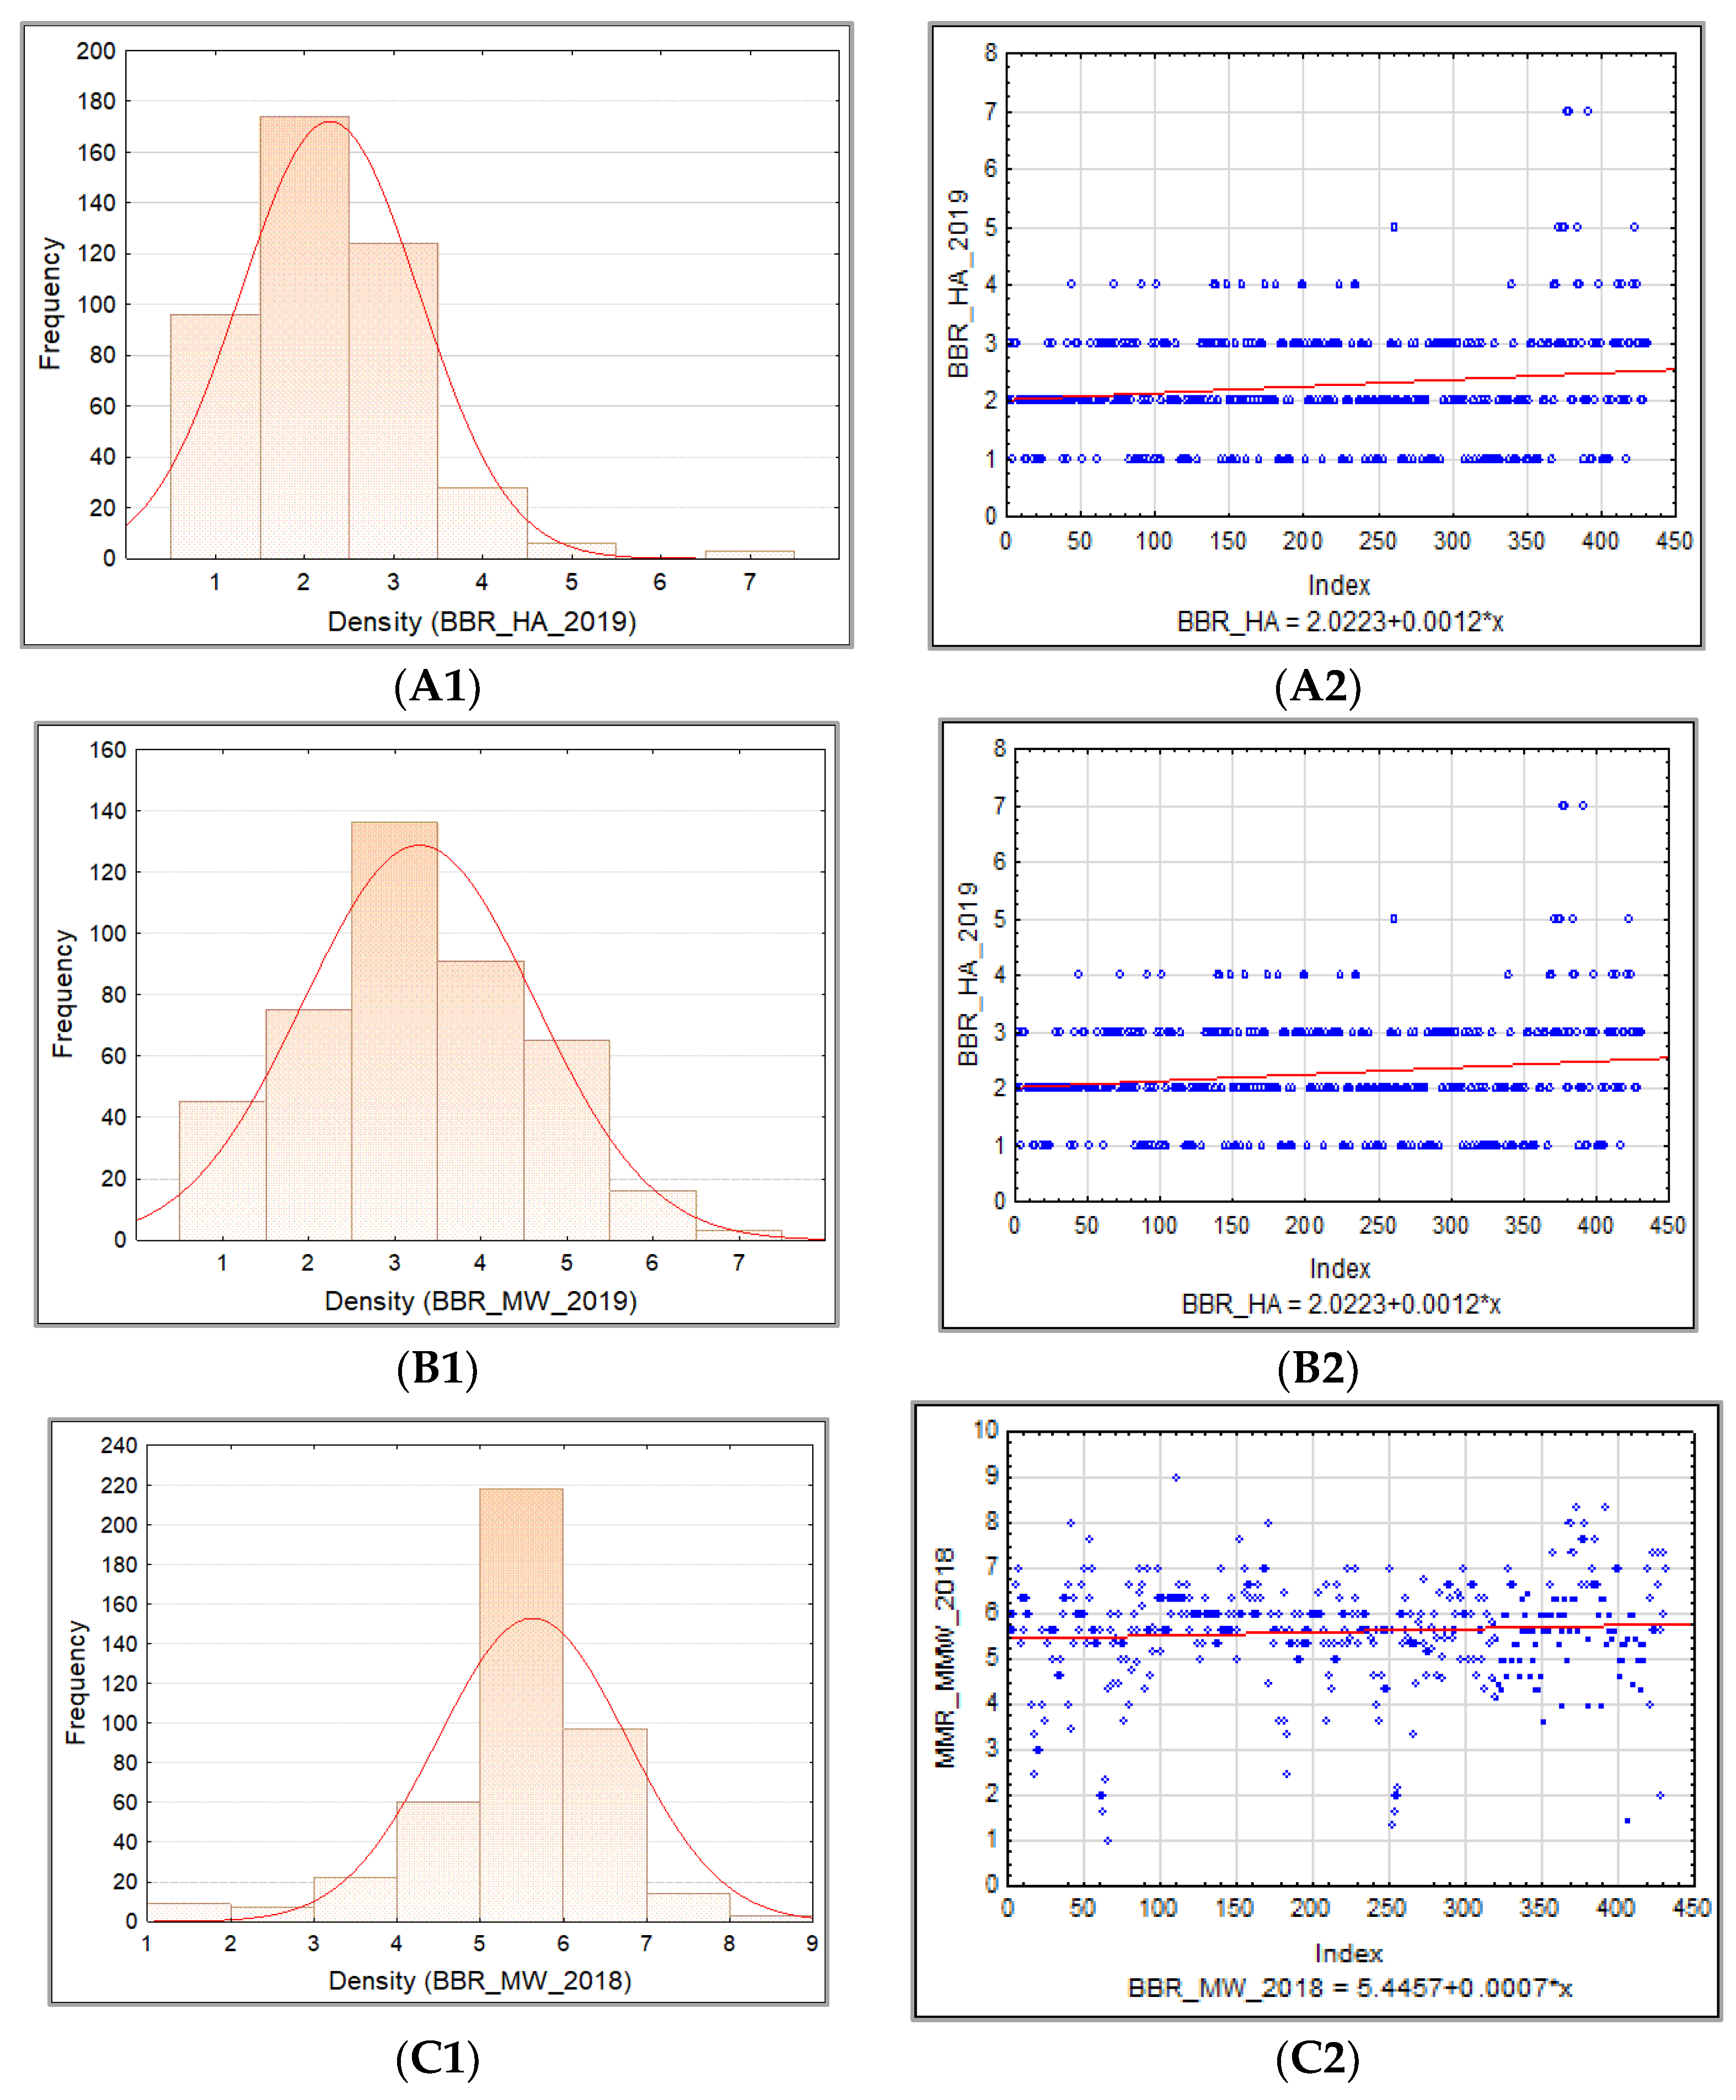
The frequency distribution of the barley accession scores for PM, BBR, and SR in 2018–2019 was presented for collection and for each sub-collection separately in the form of the normal Gauss frequency distribution and as a regression analysis model to estimate the relationship between the disease resistance scores (accessions) and the frequency index. Correlations between traits were also analyzed.

2.5. Genotyping

In total, 454 barley accessions were genotyped by using Diversity Arrays Technology (DArT) Pty Ltd., Monana, Australia, using DArTseq [59]. The SNP decisions were taken using IBSC Barley Morex v2 assembly [60]. The Barley GBS 1.0 platform DArT genotyping service returned 28,530 in-silico DArT-seq markers.

2.6. Data Filtering Process

The DArT data were handled in the same manner as described previously for soybean [61]. That is, we used the dartR v1.1.11 package [62] in the R programming language. SNPs and genotypes were removed if SNP markers contained >5% missing data and genotypes contained >10% missing data, respectively. SNPs with a reproducibility score (RepAvg) <100% were removed. Where SNPs originated from the same fragment, a random SNP was retained while the others were discarded. Non-informative monomorphic SNPs were removed, as were rare SNPs with a minor allele frequency of <1%. After filtering, 453 (as well as 1 individual, which was removed due to having >10% missing calls) and 10,153 SNPs were retained for further analysis.

2.7. Genome-Wide Association Study (GWAS)

A GWAS analysis was conducted using the GAPIT v2018.08.18 R package [63,64]. We used the recently developed Bayesian information and Linkage disequilibrium Iteratively Nested Keyway (BLINK) model, which has been shown to produce fewer false positives, identify more true positives and scale very large data sets [63,64,
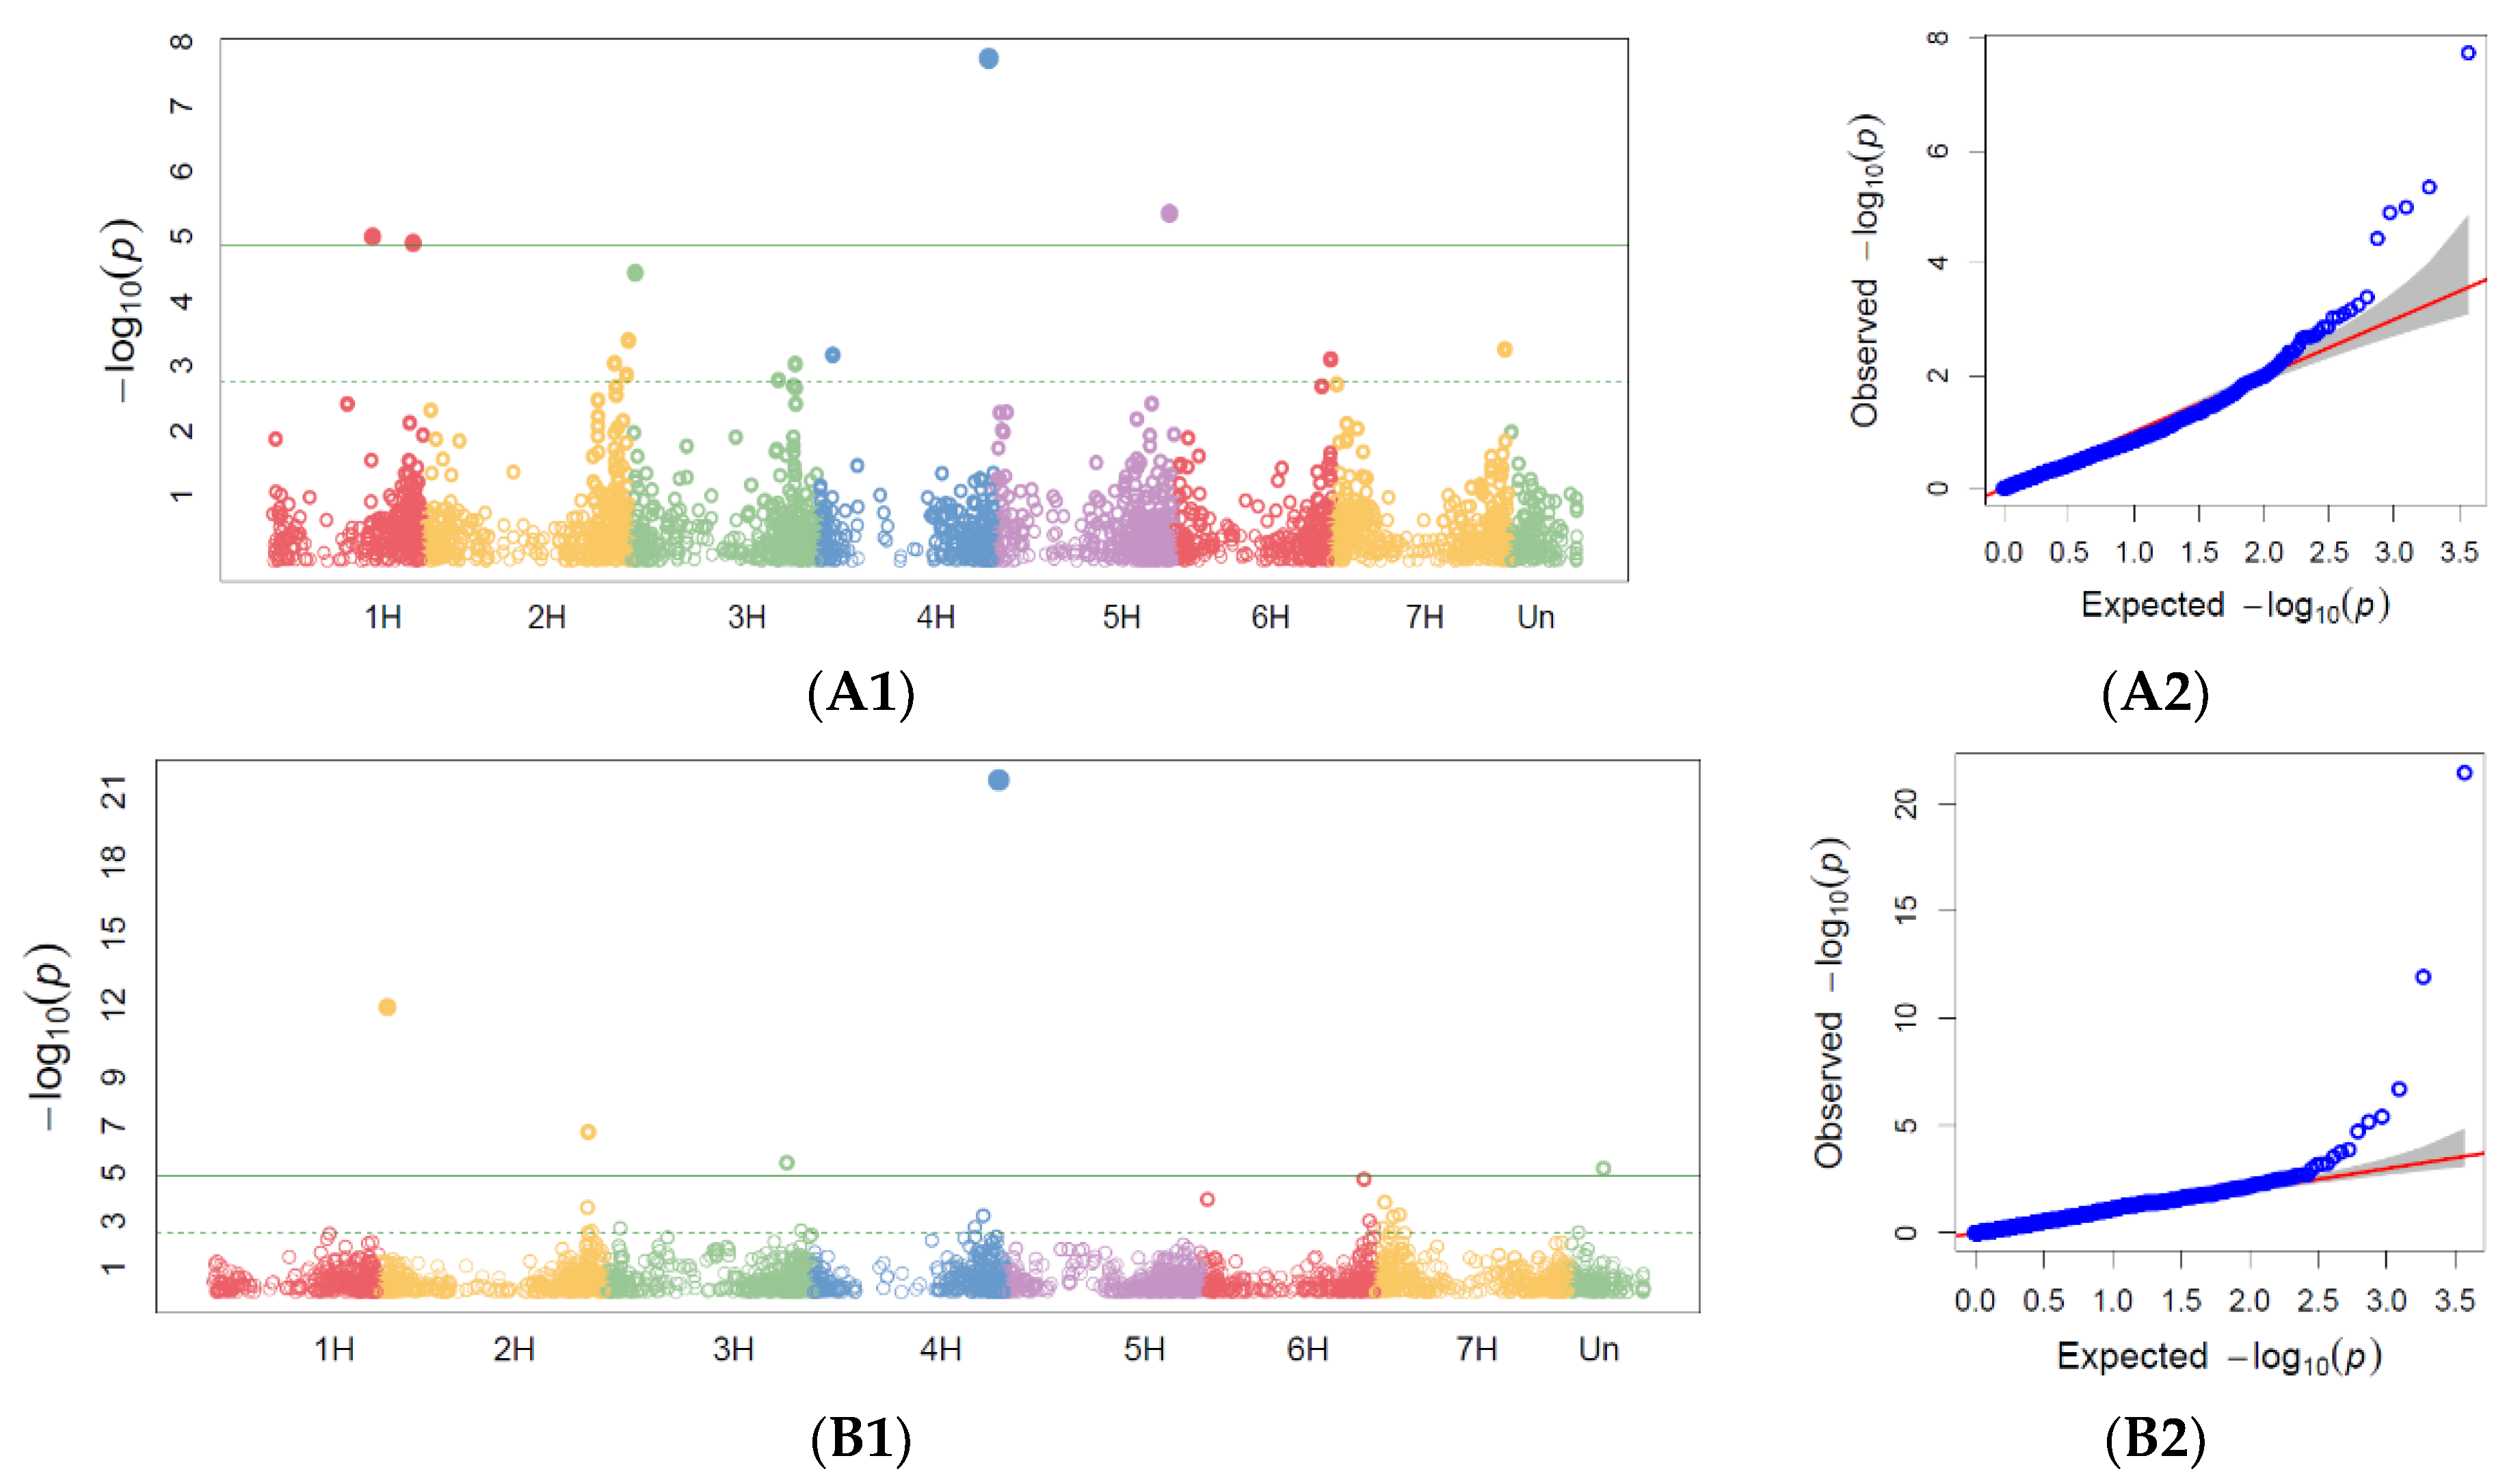
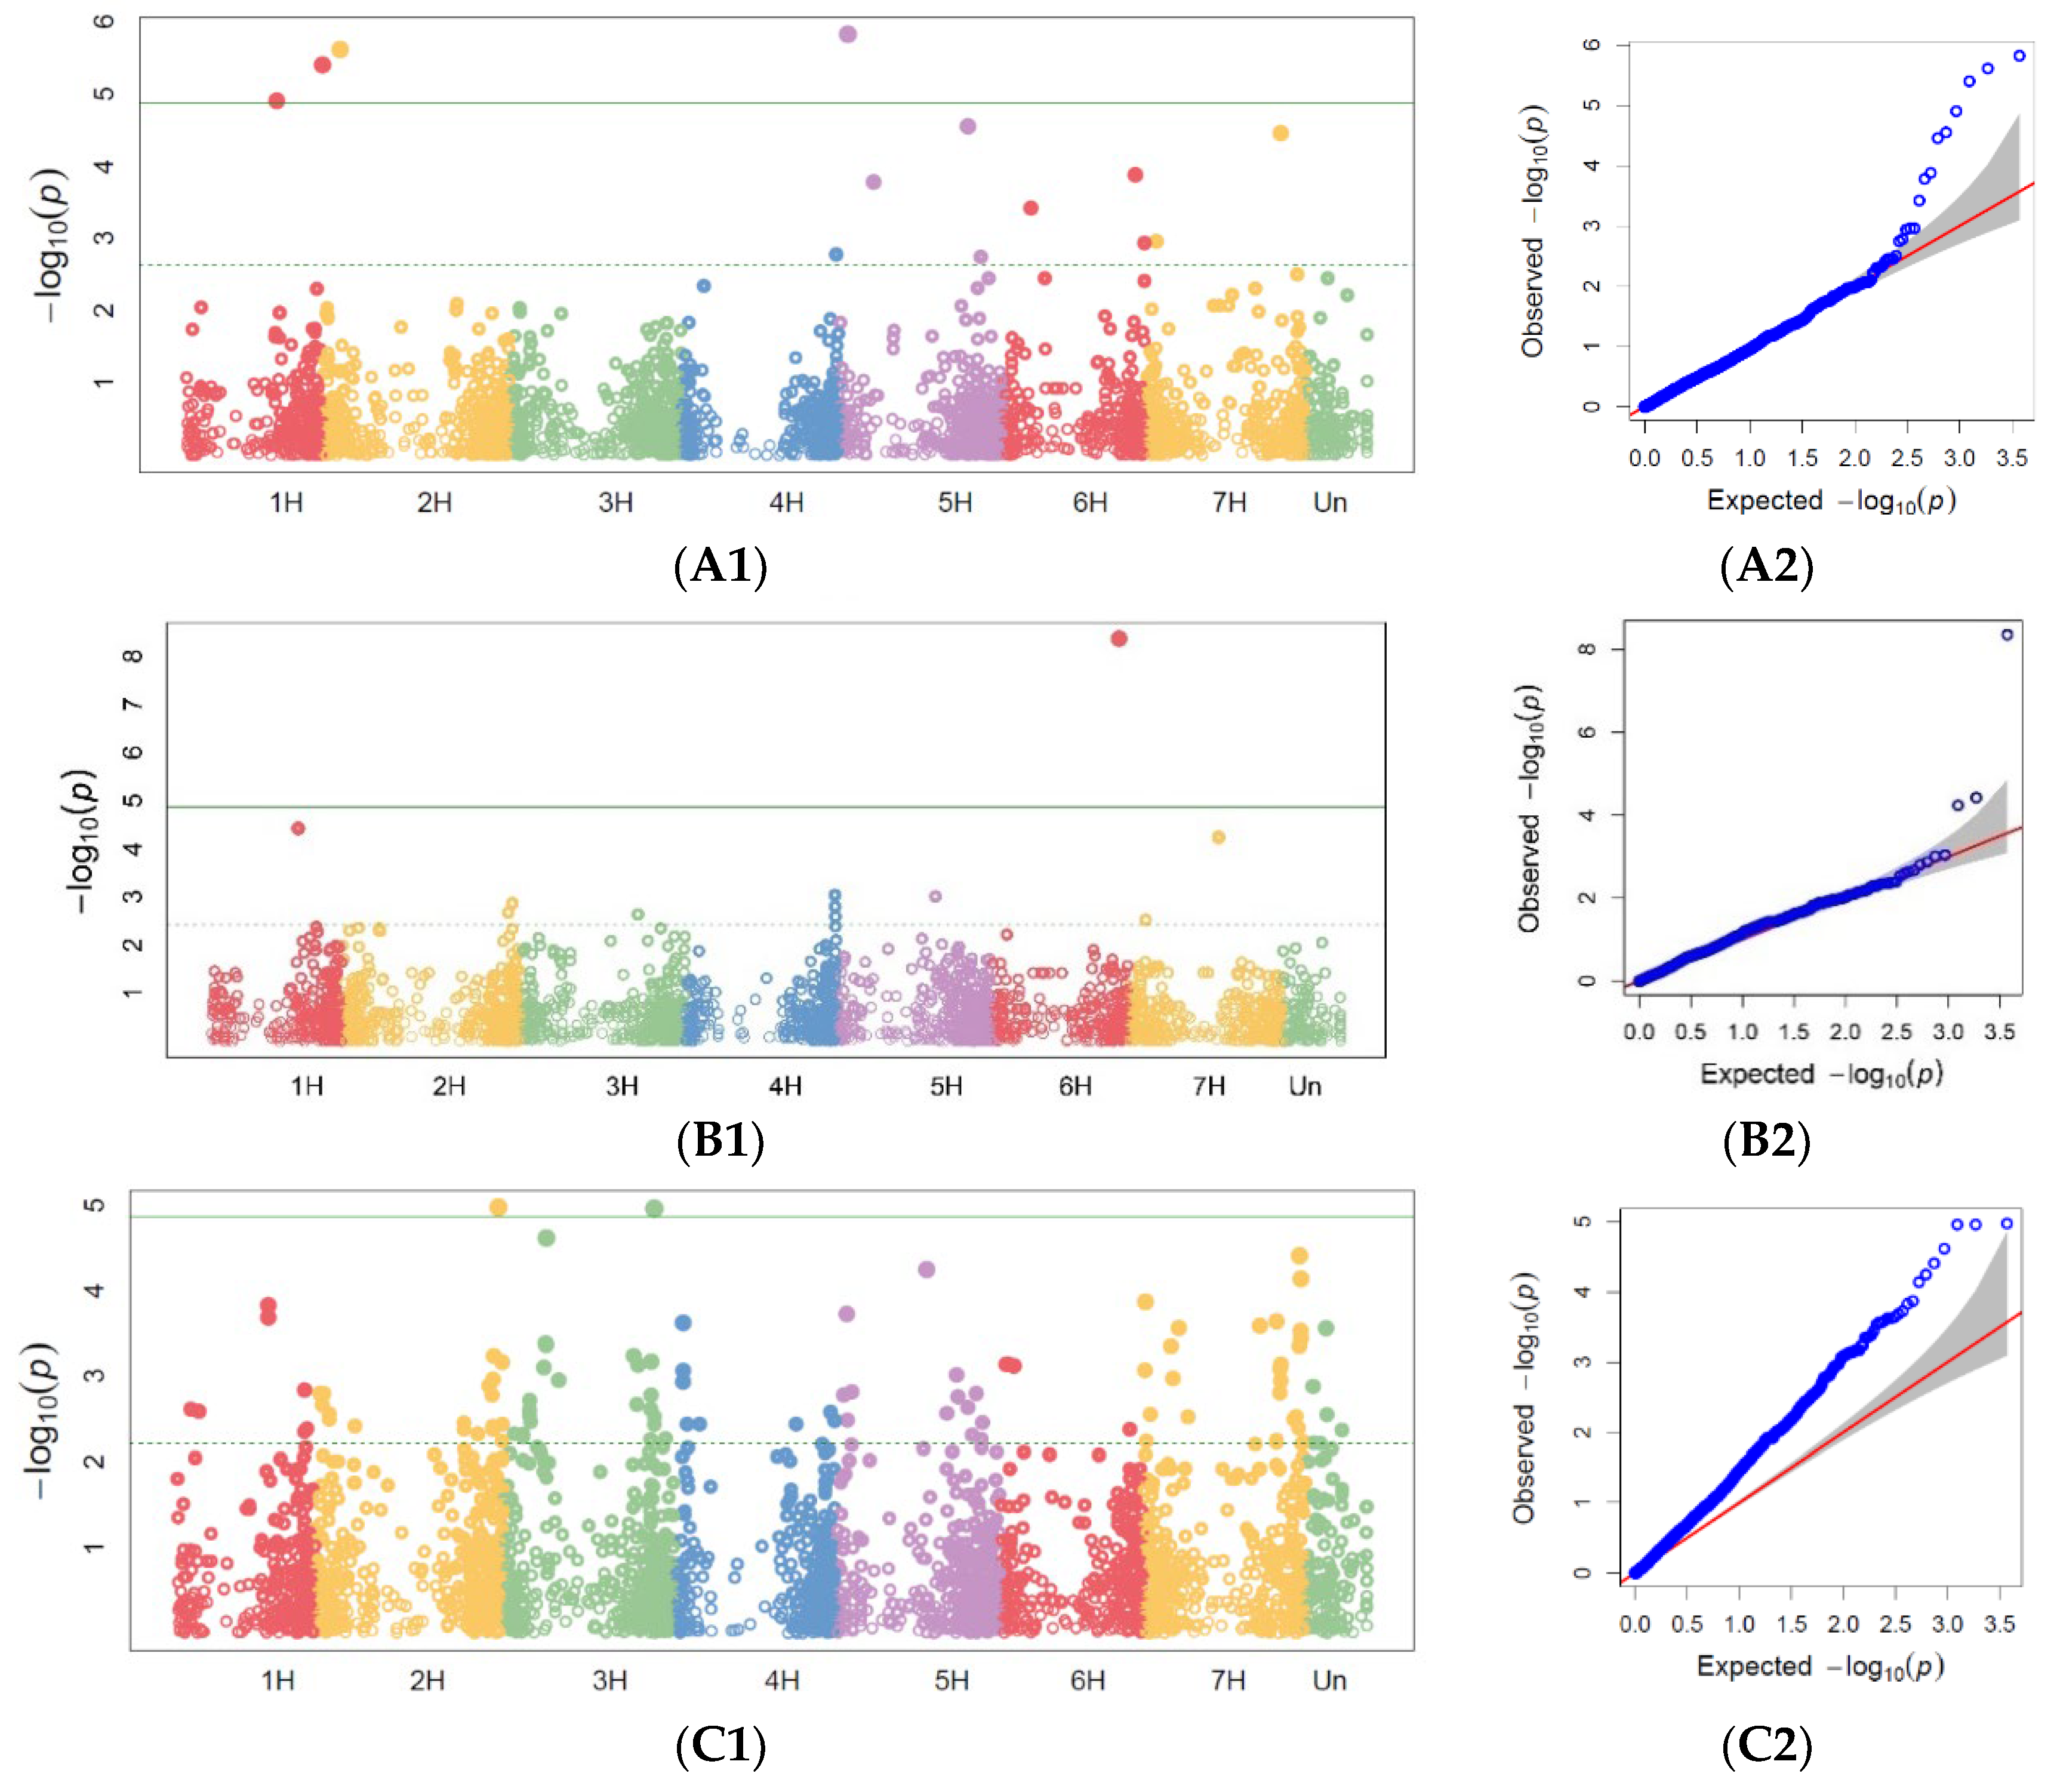
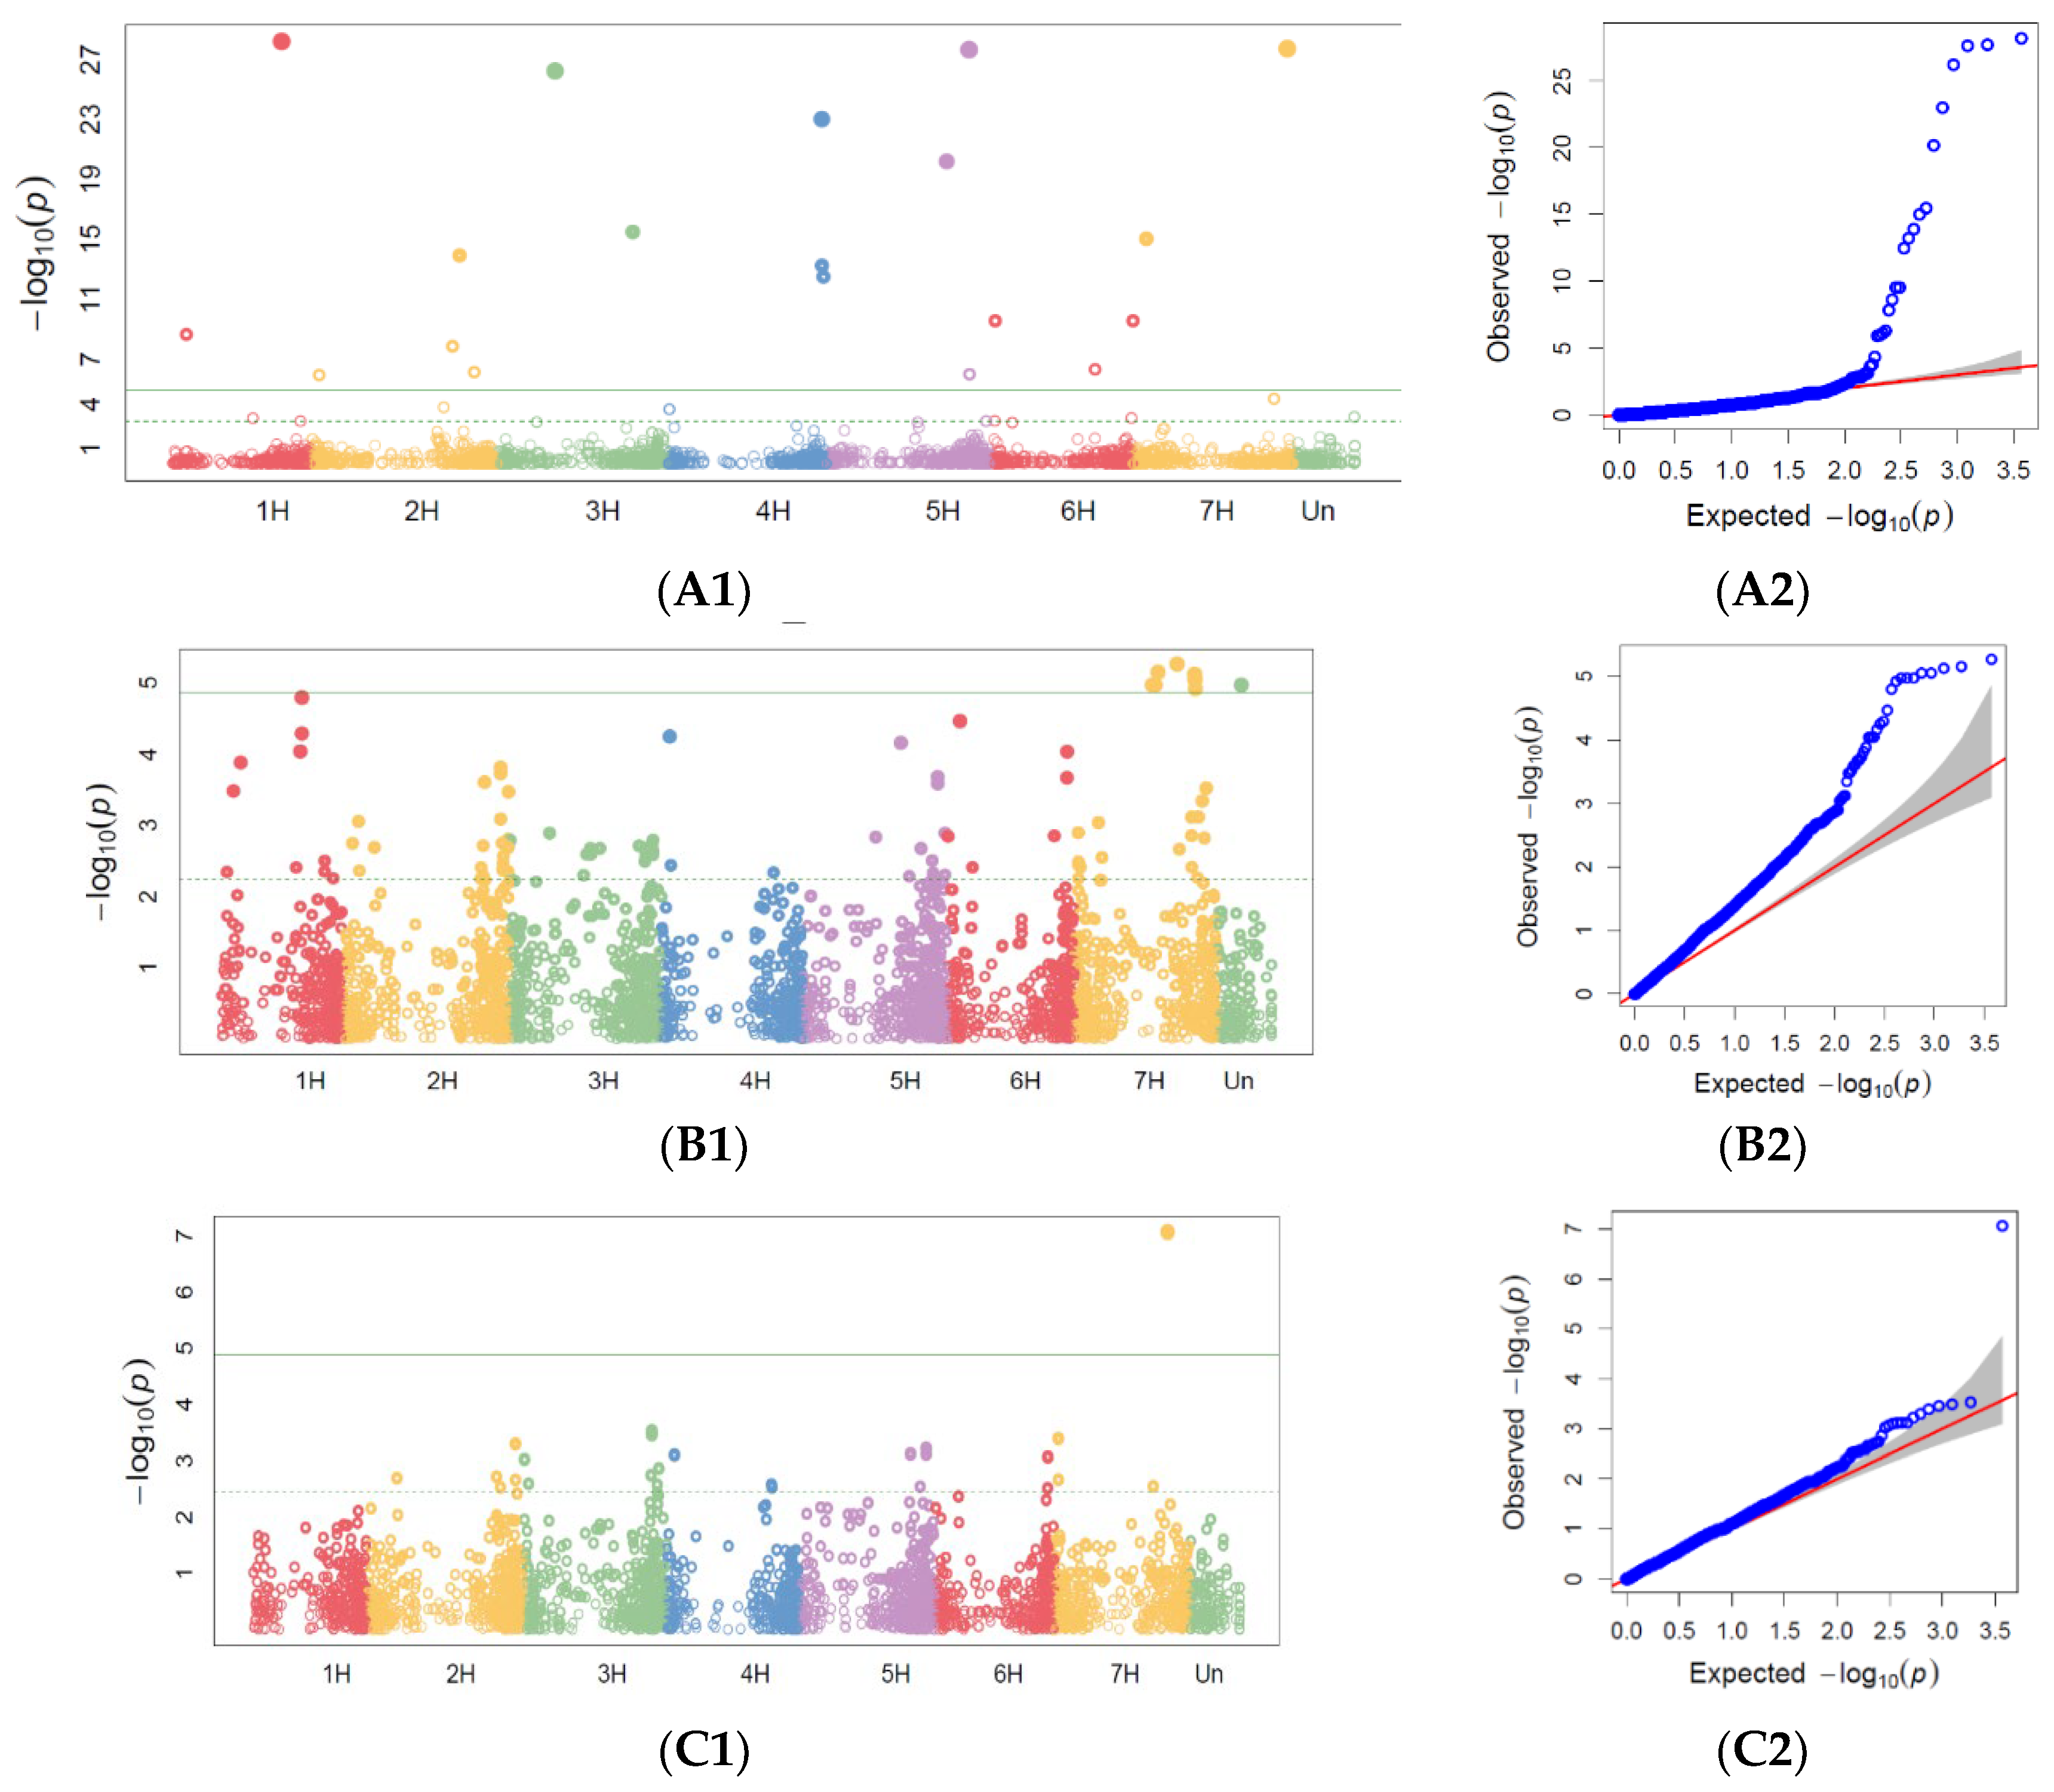
65]. The physical genome positions of the markers were derived from the DArTseq SNP genotype file. Only markers with a physical position on one of the chromosomes and zero missing data were used as inputs to the GWAS analysis. GWAS for PM, SR, and BBR was conducted for disease resistance scoring at the heading and milky-waxy seed stages in 2019 and for maximum scores across all replicates in 2018–2019 based on the fact that, because of drought (temperatures were relatively very high during spring, while precipitation was at a low level), on average, the disease severity observed in the accessions was scored at a low level. In order to show the distribution of SNPs over the chromosome, Manhattan plots were also generated.

3. Results

The collection of 431 accessions evaluated under field conditions for powdery mildew (PM), barley brown rust (BBR), and barley stem rust (SR) was grouped into sub-collections according to cultivation time (group A: old cultivars cultivated prior to 1985, group B: moderate and modern cultivars cultivated after 1985, group C: Polish landrace) and country of origin. In 2018 and 2019, during the field experiments, there was a drought (temperatures were relatively very high during spring and precipitation was at a low level). Therefore, on average, the disease severity observed on the accessions was scored at a low level. However, the range of adult plant resistance (APR) variability to PM, BBR, and SR at both the heading (HA) and milky-waxy (MW) seed growth stages was sufficient to determine marker–trait associations (MTAs) with the investigated traits. Genome-wide associations were conducted for disease resistance scoring at the HA and MW stages in 2019 and for the maximum scores across all the replicates during 2018–2019.
Overall, an analysis of the GWAS for resistance to powdery mildew (PM), stem rust (SR), and barley brown rust (BBR) at the HA and MW stages in 2019 and for maximum scores across all the replicates during 2018–2019 indicate 73 markers associated with these traits. The highest number of significant markers identified was associated with SR resistance (Table 2).

3.1. Phenotypic Assessment of PM, SR, and BBR

The phenotypic data on PM, SR, and BBR severity at the HA and MW stages in 2019 and the MW stage in 2018 are presented in Supplementary File S2 and as summary statistics in Supplementary File S3. The frequency distributions of the barley accessions based on the PM, SR, and BBR resistance scores in both years in the two growth stages are presented in the figures with the normal Gauss frequency distribution models and with the regression analysis models to estimate the relationship between the resistance scores and the frequency index.

3.1.1. Powdery Mildew

In 2019, the average PM severity at the HA stage was scored at 2.1 in a scoring range from 1.0–7.0 with a standard deviation (SD) of 1.16 and a coefficient variation (CV) of 1.35%. At the MW stage, the PM severity was scored at 3.3 within the same range of scores, 1.0–7.0 (SD = 1.50, CV = 2.3%). In 2018, the disease severity at the MW stage was scored at 3.7 (SD = 0.98, CV = 0.96%) within the same range of scores, 1.0–7.0 (Figure 2, Supplementary Files S2 and S3).
On average, in 2019, the genetic variation index of the population at the MW stage (CV = 2.2%) was greater than at the HA stage (CV = 1.2%). The frequency distribution of the barley accessions based on the PM at the HA and MW in 2018 and 2019, along with the regression analysis model estimating the relationship between the PM resistance scores and the frequency index, is presented on the Figure 3.
The ANOVA suggested that the sub-collections differed for the PM resistance; this is shown in Figure 4 (Figure 4(A1). PM at HA stage in 2019: F = 3.1369, p = 0.0002; Figure 4(B1). PM at MW stage in 2019: F = 1.8195, p = 0.0381; Figure 4(C1). PM at MW stage in 2018: F = 2.884, p = 0005).
In general, the accessions belonging to the old cultivars (cultivated prior to 1985) group were more susceptible for PM than the modern cultivars (cultivated after 1985) (Figure 4). The most susceptible accessions originated in the Netherlands, Finland, and Norway (Group VA and VB), and the old accessions originated in France (Group IIIA).
Based on the results obtained in 2019, it was possible to observe positive genetic progress (gain) over time for Groups III and IV at the MW stages.

3.1.2. Barley Stem Rust

On average, the SR severity in the barley accessions was scored at a low level in both years. In 2019, at the HA stage, and in 2018, at the MW stage, symptoms of the disease were observed with a low frequency. At the MW stage, the severity of this disease was scored, on average, at 2.3 on a 1.0–5.0 range, with CV = 0.93% (Figure 5, Supplementary File S3).
The frequency distribution of the spring barley accessions for the stem rust resistance scores during 2018–2019 with the regression analysis model estimating the relationship between SR the resistance scores and the frequency index is presented in Figure 6.
The differences in SR resistance between the sub-collections were significant; this is presented in Figure 7 (Figure 7(A1) at MW stage in 2019: F = 3.8204, p < 0.0001; Figure 7(B1) at MW stage in 2018: F = 3.0235, p < 0.0001). The highest variability at the MW stage was observed for the sub-collection IVB—modern cultivars originating in Great Britain (CV = 1.36%) and the sub-collection VIA—old collections originating in Sweden (CV = 1.36%) (Figure 7, Supplementary File S3).

3.1.3. Barley Brown Rust

On average, the genetic variation index at the MW stage (CV = 1.78% in 2018 and CV = 1.26% in 2019) was higher than at the HA (CV = 1.0% in 2019) (Figure 8, Supplementary File S3).
In 2019, the average severity of BBR at the heading stage showed the highest resistance in both old cultivars (average = 1.6; CV = 0.72%) and modern cultivars (average = 2.1; CV = 1.0%).
Figure 9 presents the frequency distribution of the barley accessions based on BBR at the HA and MW in 2018 and 2019 and the regression analysis models estimating the relationship between the BBR resistance scores and the frequency index.
The summary statistics for the BBR accessions belonging to the sub-collections evaluated during 2018–2019 are presented in Supplementary File S3. The differences between the sub-populations for the BBR and the accession distribution based on the BBR are presented in Figure 10 (Figure 10A1. BBR at HA stage in 2019: F = 7.1146, p < 0.0001; Figure 10B1. BBR at MW stage in 2019: F = 5.829, p < 0.0001; Figure 10C1. BBR at MW stage in 2018: F = 5.107, p < 0.0001). At the MW stage, the cultivars that belonged to group IVA (cultivated prior to 1985 and originating in Great Britain) were scored at 2.1 on average (CV = 1.55%) and group IVB scored at 2.4 on average (CV = 1.14%). Similarly, at the HA stage, the accessions originating in Great Britain were the most resistant (with average disease severity of the IVA group at 1.6 and of the IVB group at 1.8) and the most susceptible were the VA and VB sub-collections from the Netherlands, Finland, and Norway.
At the MW stage, the most susceptible were the accessions from group V: NLD, FIN and group VI: SWE (with average disease severity in a range from 4.1–4.8). On average, the cultivars from the VA sub-collections (cultivated prior to 1985) were more resistant than the modern varieties at the HA and MW stages. The most resistant were the accessions originating in Great Britain (with an average disease severity in the IVA group at 2.1 and in the IVB group at 2.5) and old cultivars and the landraces from Poland (with an average disease severity of 2.8 in both groups). In 2018, the severity of disease at the MW stage scored significantly higher than in 2019 (average = 5.6, range = 1.0–9.0).
In 2018, the most resistant were the modern cultivars from Great Britain (with average disease severity scored at 4.9) and the most susceptible were from the Netherlands, Finland, and Norway (Group V).

3.1.4. Relationship between PM, BBR, and SR

In 2019, the PM severity scored at the HA stage strongly correlated with the PM scored at the MW stage (r = 0.771 ***, p ≤ 0.001) (Table 3). A weaker positive linear relationship between BBR and PM scored at the heading stage in 2019 was observed (r = 0.309 **, p ≤ 0.01). BBR, scored at the milky-waxy stage in 2019, strongly correlated with PM scored at the same stage in 2019 (r = 0.488 ***, p ≤ 0.001). In 2018, a linear relationship between BBR disease severity and SR at the milky-wax stage was observed (r = 0.383 **, p ≤ 0.01).

3.2. GWAS Analysis for Marker Trait Associations

We identified 73 marker–trait associations with the 9 traits investigated. Of these, six markers were significantly associated with multiple traits (Figure 11).

3.2.1. Powdery Mildew GWAS

The GWAS for powdery mildew (PM) resistance identified five marker–trait associations (MTAs) at both the heading stage and when considering the maximal disease score across both growth stages and both years (Table 2 and Table 4, Figure 12). Only one marker (3432490-28-T/C) was shared between these two traits; this resided on 4H.

3.2.2. Barley Brown Rust GWAS

The GWAS for barley brown rust (BBR) resistance identified six MTAs at the 2019 heading stage, one MTA at the 2019 milky-waxy stage and seven MTAs when considering the maximal disease scores across both growth stages and both years (Table 2 and Table 5, Figure 13).

3.2.3. Stem Rust GWAS

The GWAS for stem rust (SR) resistance identified 22 MTAs at the 2019 heading stage, 26 MTAs at the 2019 milky-waxy stage and 1 MTA when considering the maximal disease score across both growth stages and both years (Table 2 and Table 6, Figure 14). One marker (7242068-56-C/G) was shared between the heading and milky-waxy stages.

4. Discussion

This study is a part of a larger effort focused on developing and implementing a national management system for major crop plant genetic resources stored in the Polish Gene Bank, which incorporates phenotypic and genotypic data (https://agrobank.cdr.gov.pl/index.php (accessed on 29 October 2021)). This management system, with data sets for major crops, will facilitate more effective breeding of new cultivars well adapted to changing climate conditions.
There are many examples of the utility of landraces or old cultivars as potential sources of new genes and alleles for crop breeding. In barley, the genetic variability of old cultivars or landraces was not fully exploited at the beginning of modern breeding.
Among barley diseases, the most relevant in Europe, including Poland, as well as Australia, Asia, and the US, are Blumeria graminis f. sp. hordei (Bgh), which causes powdery mildew; Puccinia hordei (Ph), which causes barley brown rust; P. striiformis f. sp. hordei (Psh), which causes stripe rust; and Puccinia graminis f. sp. tritici (Pgt), which causes stem rust. Seedling tests using sets of isolates virulent or avirulent to known resistance genes provide a means to differentiate resistance to such pathogens. However, the use of specific resistance genes in barley quickly results in the selection of virulent races of Rbgh, Rpg, and Rph.
Adult plant resistance (APR) is considered to be potentially more durable for controlling barley disease development and yield losses. This is complicated due to many factors influencing the final yield losses caused by disease. For instance, during the development stage at which infection first occurs, agroclimatic conditions favorable for pathogen development and the plant’s resistance to the infection all play a role. Because of this, there is a need for developing genome-assisted breeding strategies, in parallel with genomic studies, to understand these traits. The most important stages of plant development connected with final yield are the heading and milky-waxy seed stages [66].
In this study, we aimed to determine the markers for a qualitative trait such as APR to PM, BBR, and SR in a collection of 431 accessions covering a large range of origins and years. The accessions were stored as a seed sample at the Polish Gene Bank (National Centre for Plant Genetic Resources—NCPGR) at the Plant Breeding and Acclimatization Institute—National Research Institute (PBAI-NIR).
Like other gene banks, the Polish Gene Bank, not only plays an important role in the conservation of plant genetic resources, but also as a source of new genetic alleles. Gene banks are invaluable sources of genetic material for important traits in breeding programs [40]. Without well curated genetic collections, material stored in gene banks will continue to be underutilized. Therefore, the long-term development plans of traditional gene banks should pivot to becoming biological resource centers and provide access to the wealth of metadata connected with their accessions. This should include phenotypic data (e.g., stress tolerance).
The introgression of new alleles into elite cultivars is performed more simply and effectively with old cultivars and landraces than with wild relatives [17,67,68]. For this reason, old barley cultivars and landraces collected in European countries should be thoroughly mined for new genes [12,69,70].
Based on our study, we found that accessions originating in Northern Europe were more susceptible to PM, SR, and BBR than genotypes originating in other European countries. The genetic gain obtained during breeding programs for PM in the sub-collection originating in Great Britain was the highest. This is consistent with the breeding history in this region, since PM was responsible for significant yield losses during the 1960s and 1970s. This resulted in breeders paying particular attention to this disease in subsequent years.
Previous studies have identified multiple markers associated with powdery mildew resistance on chromosome 7H, which explained 8.9% of the total genetic variance [71]. Other reports have described PM resistance markers on 3H, 4H, and 5H [72] as well as novel major-effect APR genes for PM (Rbgh1, Rbgh3, and Rbgh3) on chromosomes 5HL, 7HS, and 1HS, respectively, in landraces [34]. Our findings suggest that of the five markers associated with the maximum PM disease score, two are on chromosome 2H and may represent novel sources of resistance. APR to PM is very important since the resistance of most high-yielding European spring barley cultivars is determined by mlo [20].
Previous studies have reported markers for BBR resistance on chromosome 5H, which correspond to a region containing the APR gene Rph20 [33,37], on chromosome 2H [37] and the APR-to-BBR resistance gene Rph23, located on chromosome 7HS [38]. We confirmed markers localized on the chromosome 5H and 7H and identified additional markers on chromosome 1H and 3H.
However, symptoms of the SR occurred on the barley plants later than the HA; resistance to this disease is among the most serious problems preventing barley grain yield [73,74,75,76]. Rpg1 is the resistance gene deployed in many barley varieties and provides remarkably durable resistance to most races of this pathogen. The Rpg4 and Rpg5 genes were well characterized [30]. In our study, the frequency of the accessions with disease symptoms at the HA stage was very low, but it was possible to find some markers associated with this disease. This should be confirmed during our next study. Of the 48 markers identified as being associated with SR resistance, 12 were on chromosome 7H, 1 was in the telomeric region of the short arm, and 7 were in the telomeric region of the long arm. Rpg1 was previously mapped to 7HS [76].
This study confirmed that old barley cultivars and landraces are an important source of genetic variation and valuable sources of resistance to biotic stresses, including powdery mildew and rusts [2,23,48,49,50,51,52,53,54]. The method of GWAS with DArT data used in this study was proven to be very efficient at identifying markers of APR to PM, BBR, and SR.
This will help plant breeders to use characterized germplasm for APR to PM, BBR, and SR in their breeding programs.
Moreover, the APR markers identified in this study can be used in combination with major R-genes in the same cultivar or in different cultivars with different R-genes, both in spring and winter barley. APR exerts less selective pressure for pathogens on developing plants than R-gene resistance and it can serve as an additional and important resistance factor in case of the breakdown in effectiveness of specific R-genes. Such diverse deployment of many sources of resistance to both APR and R-genes will result in more durable and efficient genetic control of PM, BBR, and SR [34,76].
Our study provided genotypic and phenotypic information on a diverse set of previously un-characterized Polish Gene Bank accessions. This work was conducted to develop and implement a national management system for crop plant genetic resources as part of the AGROBANK project at the Polish Gene Bank (NCPGR) (https://agrobank.cdr.gov.pl/index.php (accessed on 29 October 2021)). It will play a leading role in incorporating the phenotypic and genotypic data of crop plants of agronomic importance to Polish agriculture and food production, such as wheat and barley (http://dane.agrobank.pcss.pl/jbrowse/ (accessed on 29 October 2021)).

5. Conclusions

Gene banks play an important role in the conservation of plant genetic resources, and are sources of new genetic alleles.
The present study provides new knowledge about the genomic regions associated with barley APR to PM, BBR, and SR and confirmed the observation, in a previous study, that GWAS with DArT data can efficiently indicate markers associated with such traits. This study provides an opportunity to create a gene bank platform containing descriptions of these traits that would be suitable for use in breeding programs and research [44,77,78].
This study suggests that the APR mechanism is influenced by many factors, including the timing and severity of disease outbreaks. For PM resistance, we identified at the marker (3432490-28-T/C) on chromosome 4H at the heading stage. For BBR resistance, we confirmed markers localized on the chromosomes 5H and 7H and identified additional markers on chromosomes 1H and 3H. For SR, we confirmed localization markers on chromosome 7H, where gene Rpg1 has previously been mapped.
The evaluated landraces and old cultivars may offer the added value of use in the preservation of agrobiodiversity through a range of diverse strategies.

Supplementary Materials

The following are available online at https://www.mdpi.com/article/10.3390/agronomy12010007/s1. Supplementary Table S1. Passport data of evaluated barley accessions. Supplementary Table S2. Phenotypic data collected for the GWAS panel. Supplementary Table S3. Summary statistic for the phenotypic data collected for the GWAS panel.

Author Contributions

Conceptualization, J.H.C., E.C. Methodology, E.C., J.H.C., R.S., N.S.W.-H. Investigation: E.C. and J.H.C. Phenotypic assessment and statistical analysis of data, N.S.W.-H. Bioinformatics analysis. N.W-H., E.C. Visualization. N.S.W.-H., E.C. Project administration: E.C. Project co-ordination and resources: J.H.C. All authors (E.C., N.S.W.-H., J.H.C., R.S.) contributed to developing the first draft, reviewing, and editing the manuscript. All authors have read and agreed to the published version of the manuscript.

Funding

This platform is a part of the AGROBANK project, “Development of bioinformatic management system of national crop plant genetic resources and development of social and economic resources of Poland by the protection and use of these means in the process of agricultural advisory services” (1/394826/10/NCBR/2018) https://agrobank.cdr.gov.pl/index.php (accessed on 17 December 2021), financed by the National Center for Research and Development as part of the first round of competitive research grants under the strategic research and development program, GOSPOSTRATEG, “Social And Economic Development Of Poland In The Context Of Globalizing Markets”.

Data Availability Statement

All the data generated or analyzed during this study are included in this published article and its supplementary information files. The relevant contact is Jerzy H. Czembor, IHAR-PIB Radzikow, 05-870 Blonie, Poland.

Acknowledgments

We thank the Polish Gene Bank (National Centre for Plant Genetic Resources—KCRZG at the Plant Breeding and Acclimatization Institute—National Research Institute, Radzikow, Poland) for providing the seed samples.

Conflicts of Interest

The authors declare any personal circumstances or interest that may be perceived as inappropriately influencing the representation or interpretation of reported research results. Any role of the funders in the design of the study; in the collection, analyses or interpretation of data; in the writing of the manuscript, or in the decision to publish the results must be declared in this section.

References

  1. Karagöz, A.; Özbek, K.; Akar, T.; Ergün, N.; Aydoğan, S.; Sayim, İ. Agro-morphological variation among an ancient world barley collection. Tarim Bilim. Derg. 2017, 23, 444–452. [Google Scholar] [CrossRef]
  2. Kumar, A.; Verma, R.P.S.; Singh, A.; Kumar Sharma, H.; Devi, G. Barley landraces: Ecological heritage for edaphic stress adaptations and sustainable production. Environ. Sustain. Indic. 2020, 6, 100035. [Google Scholar] [CrossRef]
  3. Dawson, I.K.; Russell, J.; Powell, W.; Steffenson, B.; Thomas, W.T.B.; Waugh, R. Barley: A translational model for adaptation to climate change. New Phytol. 2015, 206, 913–931. [Google Scholar] [CrossRef]
  4. Food, W. Statistics Statistical Yearbook; Food & Agriculture Organization: Rome, Italy, 2020; p. 366. ISBN 9789251333945. [Google Scholar]
  5. Wolfe, M.S.; Brändle, U.; Koller, B.; Limpert, E.; McDermott, J.M.; Müller, K.; Schaffner, D. Barley mildew in Europe: Population biology and host resistance. Euphytica 1992, 63, 125–139. [Google Scholar] [CrossRef]
  6. Agostinetto, L.; Casa, R.T.; Bogo, A.; Sachs, C.; Reis, E.M.; Kuhnem, P.R. Critical yield-point model to estimate damage caused by brown spot and powdery mildew in barley. Ciência Rural 2014, 44, 957–963. [Google Scholar] [CrossRef]
  7. Griffey, C.A.; Das, M.K.; Baldwin, R.E.; Waldenmaier, C.M. Yield losses in winter barley resulting from a new race of Puccinia hordei in North America. Plant Dis. 1994, 78, 256–260. [Google Scholar] [CrossRef]
  8. Park, R.F.; Golegaonkar, P.G.; Derevnina, L.; Sandhu, K.S.; Karaoglu, H.; Elmansour, H.M.; Dracatos, P.M.; Singh, D. Leaf Rust of Cultivated Barley: Pathology and Control. Annu. Rev. Phytopathol. 2015, 53, 565–589. [Google Scholar] [CrossRef]
  9. Murray, G.M.; Brennan, J.P. Estimating disease losses to the Australian barley industry. Australas. Plant Pathol. 2010, 39, 85–96. [Google Scholar] [CrossRef]
  10. Al-Abdallat, A.M.; Karadsheh, A.; Hadadd, N.I.; Akash, M.W.; Ceccarelli, S.; Baum, M.; Hasan, M.; Jighly, A.; Abu Elenein, J.M. Assessment of genetic diversity and yield performance in Jordanian barley (Hordeum vulgare L.) landraces grown under Rainfed conditions. BMC Plant Biol. 2017, 17, 191. [Google Scholar] [CrossRef] [PubMed] [Green Version]
  11. Çelik Oğuz, A.; Karakaya, A. Genetic Diversity of Barley Foliar Fungal Pathogens. Agronomy 2021, 11, 434. [Google Scholar] [CrossRef]
  12. Czembor, H.J.; Czembor, J.H. Leaf rust resistance in spring barley cultivars and breeding lines. Plant Breed. Seed Sci. 2007, 55, 5–20. [Google Scholar]
  13. Yang, L.; Zhang, X.; Zhang, X.; Wang, J.; Luo, M.; Yang, M.; Wang, H.; Xiang, L.; Zeng, F.; Yu, D.; et al. Identification and evaluation of resistance to powdery mildew and yellow rust in a wheat mapping population. PLoS ONE 2017, 12, e0177905. [Google Scholar] [CrossRef] [Green Version]
  14. Lamichhane, J.R.; Arseniuk, E.; Boonekamp, P.; Czembor, J.; Decroocq, V.; Enjalbert, J.; Finckh, M.R.; Korbin, M.; Koppel, M.; Kudsk, P.; et al. Advocating a need for suitable breeding approaches to boost integrated pest management: A European perspective. Pest Manag. Sci. 2018, 74, 1219–1227. [Google Scholar] [CrossRef]
  15. Hoseinzadeh, P.; Zhou, R.; Mascher, M.; Himmelbach, A.; Niks, R.E.; Schweizer, P.; Stein, N. High resolution genetic and physical mapping of a major powdery mildew resistance locus in barley. Front. Plant Sci. 2019, 10, 146. [Google Scholar] [CrossRef] [Green Version]
  16. McDonald, B.A.; Linde, C. Pathogen population genetics, evolutionary potential, and durable resistance. Annu. Rev. Phytopathol. 2002, 40, 349–379. [Google Scholar] [CrossRef] [Green Version]
  17. Forsberg, N.E.G.; Russell, J.; Macaulay, M.; Leino, M.W.; Hagenblad, J. Farmers without borders - genetic structuring in century old barley (Hordeum vulgare). Heredity 2015, 114, 195–206. [Google Scholar] [CrossRef] [PubMed] [Green Version]
  18. Marcel, T.C.; Varshney, R.K.; Barbieri, M.; Jafary, H.; De Kock, M.J.D.; Graner, A.; Niks, R.E. A high-density consensus map of barley to compare the distribution of QTLs for partial resistance to Puccinia hordei and of defence gene homologues. Theor. Appl. Genet. 2007, 114, 487–500. [Google Scholar] [CrossRef] [PubMed] [Green Version]
  19. Arabi, M.I.E.; Al-Shehadah, E.; Jawhar, M. Diallel analysis of barley resistance to Blumeria graminis. Cereal Res. Commun. 2019, 47, 455–462. [Google Scholar] [CrossRef]
  20. Dreiseitl, A. Specific resistance of barley to powdery mildew, its use and beyond. A concise critical review. Genes 2020, 11, 971. [Google Scholar] [CrossRef] [PubMed]
  21. Dreiseitl, A. Differences in powdery mildew epidemics in spring and winter barley based on 30-year variety trials. Ann. Appl. Biol. 2011, 159, 49–57. [Google Scholar] [CrossRef]
  22. Ziems, L.A.; Hickey, L.T.; Platz, G.J.; Franckowiak, J.D.; Dracatos, P.M.; Singh, D.; Park, R.F. Characterization of Rph24: A gene conferring adult plant resistance to Puccinia hordei in barley. Phytopathology 2017, 107, 834–841. [Google Scholar] [CrossRef] [Green Version]
  23. Dreiseitl, A.; Zavřelová, M. Identification of barley powdery mildew resistances in gene bank accessions and the use of gene diversity for verifying seed purity and authenticity. PLoS ONE 2018, 13, e0208719. [Google Scholar] [CrossRef] [PubMed]
  24. Piechota, U.; Czembor, P.C.; Słowacki, P.; Czembor, J.H. Identifying a novel powdery mildew resistance gene in a barley landrace from Morocco. J. Appl. Genet. 2019, 60, 243–254. [Google Scholar] [CrossRef] [PubMed] [Green Version]
  25. Piechota, U.; Słowacki, P.; Czembor, P.C. Identification of a novel recessive gene for resistance to powdery mildew (Blumeria graminis f. sp. hordei) in barley (Hordeum vulgare). Plant Breed. 2020, 139, 730–742. [Google Scholar] [CrossRef]
  26. Kavanagh, P.J.; Singh, D.; Bansal, U.K.; Park, R.F. Inheritance and characterization of the new and rare gene Rph25 conferring seedling resistance in Hordeum vulgare against Puccinia hordei. Plant Breed. 2017, 136, 908–912. [Google Scholar] [CrossRef]
  27. Fazlikhani, L.; Keilwagen, J.; Kopahnke, D.; Deising, H.; Ordon, F.; Perovic, D. High resolution mapping of RphMBR1012 conferring resistance to Puccinia hordei in barley (Hordeum vulgare L.). Front. Plant Sci. 2019, 10, 640. [Google Scholar] [CrossRef] [PubMed]
  28. Niks, R.E.; Walther, U.; Jaiser, H.; Martinez, F.; Rubiales, D.; Andersen, O.; Flath, K.; Gymer, P.; Heinrichs, F.; Jonsson, R.; et al. Resistance against barley leaf rust (Puccinia hordei) in West-European spring barley germplasm. Agronomie 2000, 20, 769–782. [Google Scholar] [CrossRef] [Green Version]
  29. Dracatos, P.M.; Haghdoust, R.; Singh, R.P.; Huerta Espino, J.; Barnes, C.W.; Forrest, K.; Hayden, M.; Niks, R.E.; Park, R.F.; Singh, D. High-density mapping of triple rust resistance in barley using DArT-seq markers. Front. Plant Sci. 2019, 10, 467. [Google Scholar] [CrossRef]
  30. Sharma Poudel, R.; Al-Hashel, A.F.; Gross, T.; Gross, P.; Brueggeman, R. Pyramiding rpg4- And Rpg1-mediated stem rust resistance in barley requires the Rrr1 gene for both to function. Front. Plant Sci. 2018, 871, 1789. [Google Scholar] [CrossRef] [Green Version]
  31. Czembor, J.H.; Czembor, E. Mlo resistance to powdery mildew (Blumeria graminis f. sp. hordei) in barley landraces collected in Yemen. Agronomy 2021, 11, 1582. [Google Scholar] [CrossRef]
  32. Jørgensen, I.H. Discovery, characterization and exploitation of Mlo powdery mildew resistance in barley. Euphytica 1992, 63, 141–152. [Google Scholar] [CrossRef]
  33. Czembor, J.H.; Czembor, E. Mlo resistance of barley to powdery mildew (Blumeria graminis f.sp. hordei). Part I. Genetics, phenotype, mechanism and molecular investigations. Biul. IHAR 2003, 230, 335–354. [Google Scholar]
  34. Ge, C.; Wentzel, E.; D’Souza, N.; Chen, K.; Oliver, R.P.; Ellwood, S.R. Adult resistance genes to barley powdery mildew confer basal penetration resistance associated with broad-spectrum resistance. Plant Genome 2021, 1–13. [Google Scholar] [CrossRef]
  35. Hickey, L.T.; Lawson, W.; Platz, G.J.; Dieters, M.; Arief, V.N.; Germán, S.; Fletcher, S.; Park, R.F.; Singh, D.; Pereyra, S.; et al. Mapping Rph20: A gene conferring adult plant resistance to Puccinia hordei in barley. Theor. Appl. Genet. 2011, 123, 55–68. [Google Scholar] [CrossRef]
  36. Liu, F.; Gupta, S.; Zhang, X.Q.; Jones, M.; Loughman, R.; Lance, R.; Li, C. PCR markers for selection of adult plant leaf rust resistance in barley (Hordeum vulgare L.). Mol. Breed. 2011, 28, 657–666. [Google Scholar] [CrossRef]
  37. Singh, D.; Ziems, L.A.; Dracatos, P.M.; Pourkheirandish, M.; Tshewang, S.; Czembor, P.; German, S.; Fowler, R.A.; Snyman, L.; Platz, G.J.; et al. Genome-wide association studies provide insights on genetic architecture of resistance to leaf rust in a worldwide barley collection. Mol. Breed. 2018, 38, 43. [Google Scholar] [CrossRef]
  38. Singh, D.; Dracatos, P.; Derevnina, L.; Zhou, M.; Park, R.F. Rph23: A new designated additive adult plant resistance gene to leaf rust in barley on chromosome 7H. Plant Breed. 2015, 134, 62–69. [Google Scholar] [CrossRef]
  39. Mehnaz, M.; Dracatos, P.; Pham, A.; March, T.; Maurer, A.; Pillen, K.; Forrest, K.; Kulkarni, T.; Pourkheirandish, M.; Park, R.F.; et al. Discovery and fine mapping of Rph28: A new gene confereing resistance to Puccinia hordei from wild barley. Theor. Plant Genet. 2021, 134, 2167–2179. [Google Scholar] [CrossRef] [PubMed]
  40. Weise, S.; Lohwasser, U.; Oppermann, M. Document or lose it—on the importance of information management for genetic resources conservation in genebanks. Plants 2020, 9, 1050. [Google Scholar] [CrossRef] [PubMed]
  41. FAO. The Second Report on the State of the World’s Animal Genetic Resources for Food and Agriculture; FAO: Rome, Italy, 2015; p. 562. ISBN 9789251065341. [Google Scholar]
  42. Milner, S.G.; Jost, M.; Taketa, S.; Mazón, E.R.; Himmelbach, A.; Oppermann, M.; Weise, S.; Knüpffer, H.; Basterrechea, M.; König, P.; et al. Genebank genomics highlights the diversity of a global barley collection. Nat. Genet. 2019, 51, 319–326. [Google Scholar] [CrossRef] [Green Version]
  43. Wang, X.; Xu, Y.; Hu, Z.; Xu, C. Genomic selection methods for crop improvement: Current status and prospects. Crop J. 2018, 6, 330–340. [Google Scholar] [CrossRef]
  44. Rasheed, A.; Hao, Y.; Xia, X.; Khan, A.; Xu, Y.; Varshney, R.K.; He, Z. Crop Breeding Chips and Genotyping Platforms: Progress, Challenges, and Perspectives. Mol. Plant 2017, 10, 1047–1064. [Google Scholar] [CrossRef] [PubMed] [Green Version]
  45. Crossa, J.; Pérez-Rodríguez, P.; Cuevas, J.; Montesinos-López, O.; Jarquín, D.; de los Campos, G.; Burgueño, J.; González-Camacho, J.M.; Pérez-Elizalde, S.; Beyene, Y.; et al. Genomic Selection in Plant Breeding: Methods, Models, and Perspectives. Trends Plant Sci. 2017, 22, 961–975. [Google Scholar] [CrossRef] [PubMed]
  46. König, P.; Beier, S.; Basterrechea, M.; Schüler, D.; Arend, D.; Mascher, M.; Stein, N.; Scholz, U.; Lange, M. BRIDGE—A Visual Analytics Web Tool for Barley Genebank Genomics. Front. Plant Sci. 2020, 11, 701. [Google Scholar] [CrossRef] [PubMed]
  47. Jing, R.; Ambrose, M.A.; Knox, M.R.; Smykal, P.; Hybl, M.; Ramos, Á.; Caminero, C.; Burstin, J.; Duc, G.; van Soest, L.J.M.; et al. Genetic diversity in European Pisum germplasm collections. Theor. Appl. Genet. 2012, 125, 367–380. [Google Scholar] [CrossRef] [Green Version]
  48. Newton, A.C.; Akar, T.; Baresel, J.P.; Bebeli, P.J.; Bettencourt, E.; Bladenopoulos, K.V.; Czembor, J.H.; Fasoula, D.A.; Katsiotis, A.; Koutis, K.; et al. Cereal landraces for sustainable agriculture. A review. Agron. Sustain. Dev. 2010, 30, 237–269. [Google Scholar] [CrossRef] [Green Version]
  49. Dreiseitl, A. Heterogeneity of powdery mildew resistance revealed in accessions of the icarda wild barley collection. Front. Plant Sci. 2017, 8, 202. [Google Scholar] [CrossRef]
  50. Parzies, H.K.; Spoor, W.; Ennos, R.A. Genetic diversity of barley landrace accessions (Hordeum vulgare ssp. vulgare) conserved for different lengths of time in ex situ gene banks. Heredity 2000, 84, 476–486. [Google Scholar] [CrossRef]
  51. Amezrou, R.; Gyawali, S.; Belqadi, L.; Chao, S.; Arbaoui, M.; Mamidi, S.; Rehman, S.; Sreedasyam, A.; Verma, R.P.S. Molecular and phenotypic diversity of ICARDA spring barley (Hordeum vulgare L.) collection. Genet. Resour. Crop Evol. 2018, 65, 255–269. [Google Scholar] [CrossRef]
  52. Brbaklić, L.; Trkulja, D.; Mikić, S.; Mirosavljević, M.; Momčilović, V.; Dudić, B.; Procházková, L.; Aćin, V. Genetic diversity and population structure of serbian barley (Hordeum vulgare L.) collection during a 40-year long breeding period. Agronomy 2021, 11, 118. [Google Scholar] [CrossRef]
  53. Marone, D.; Russo, M.A.; Mores, A.; Ficco, D.B.M.; Laidò, G.; Mastrangelo, A.M.; Borrelli, G.M. Importance of landraces in cereal breeding for stress tolerance. Plants 2021, 10, 1267. [Google Scholar] [CrossRef]
  54. Piechota, U.; Czembor, P.C.; Czembor, J.H. Evaluating barley landraces collected in North Africa and the Middle East for powdery mildew infection at seedling and adult plant stages. Cereal Res. Commun. 2020, 48, 179–185. [Google Scholar] [CrossRef] [Green Version]
  55. Jones, H.; Civá, P.; Cockram, J.; Leigh, F.J.; Smith, L.M.J.; Jones, M.K.; Charles, M.P.; Molina-Cano, J.L.; Powell, W.; Jones, G.; et al. Evolutionary history of barley cultivation in Europe revealed by genetic analysis of extant landraces. BMC Evol. Biol. 2011, 11, 320. [Google Scholar] [CrossRef] [Green Version]
  56. Aoki, K. A three-population wave-of-advance model for the European early Neolithic. PLoS ONE 2020, 15, e0233184. [Google Scholar] [CrossRef] [PubMed]
  57. Malysheva-Otto, L.; Ganal, M.W.; Law, J.R.; Reeves, J.C.; Röder, M.S. Temporal trends of genetic diversity in European barley cultivars (Hordeum vulgare L.). Mol. Breed. 2007, 20, 309–322. [Google Scholar] [CrossRef]
  58. 58 Zadoks, J.C.; Chang, T.T.; Konzak, C.F. A decimal code for the growth stages of cereals. Weed Res. 1974, 14, 415–421. [Google Scholar] [CrossRef]
  59. Elshire, R.J.; Glaubitz, J.C.; Sun, Q.; Poland, J.A.; Kawamoto, K.; Buckler, E.S.; Mitchell, S.E. A robust, simple genotyping-by-sequencing (GBS) approach for high diversity species. PLoS ONE 2011, 6, e19379. [Google Scholar] [CrossRef] [Green Version]
  60. Mascher, M.; Gundlach, H.; Himmelbach, A.; Beier, S.; Twardziok, S.O.; Wicker, T.; Radchuk, V.; Dockter, C.; Hedley, P.E.; Russell, J.; et al. A chromosome conformation capture ordered sequence of the barley genome. Nature 2017, 544, 427–433. [Google Scholar] [CrossRef] [Green Version]
  61. Czembor, E.; Czembor, J.H.; Suchecki, R.; Watson-Haigh, N.S. DArT-based evaluation of soybean germplasm from Polish Gene Bank. BMC Res. Notes 2021, 14, 343. [Google Scholar] [CrossRef]
  62. Gruber, B.; Unmack, P.J.; Berry, O.F.; Georges, A. dartr: An r package to facilitate analysis of SNP data generated from reduced representation genome sequencing. Mol. Ecol. Resour. 2018, 18, 691–699. [Google Scholar] [CrossRef] [PubMed]
  63. Paradis, E. Pegas: An R package for population genetics with an integrated-modular approach. Bioinformatics 2010, 26, 419–420. [Google Scholar] [CrossRef] [Green Version]
  64. Huang, M.; Liu, X.; Zhou, Y.; Summers, R.M.; Zhang, Z. BLINK: A package for the next level of genome-wide association studies with both individuals and markers in the millions. Gigascience 2018, 8, giy154. [Google Scholar] [CrossRef]
  65. Alqudah, A.M.; Sallam, A.; Stephen Baenziger, P.; Börner, A. GWAS: Fast-forwarding gene identification and characterization in temperate cereals: Lessons from Barley—A review. J. Adv. Res. 2020, 22, 119–135. [Google Scholar] [CrossRef]
  66. Alqudah, A.M.; Schnurbusch, T. Heading date is not flowering time in spring barley. Front. Plant Sci. 2017, 8, 896. [Google Scholar] [CrossRef] [PubMed] [Green Version]
  67. Monteagudo, A.; Casas, A.M.; Cantalapiedra, C.P.; Contreras-Moreira, B.; Gracia, M.P.; Igartua, E. Harnessing novel diversity from landraces to improve an elite barley variety. Front. Plant Sci. 2019, 10, 434. [Google Scholar] [CrossRef] [PubMed]
  68. Czembor, J.H.; Pietrusinska, A.; Piechota, U. Hordeum bulbosum—Jako źródło efektywnej odporności na rdzę karłową jęczmienia. Biul. IHAR 2017, 5, 57–58. [Google Scholar]
  69. Czembor, J.H.; Czembor, H.J.; Attene, G.; Papa, R.; Agraria, V.; Nicola, V.D.; Dago, M. Leaf rust resistance in selections from barley landraces collected in Sardinia. Plant Breed. Seed Sci. 2007, 56, 73–84. [Google Scholar]
  70. Dreiseitl, A. A novel way to identify specific powdery mildew resistance genes in hybrid barley cultivars. Sci. Rep. 2020, 10, 18930. [Google Scholar] [CrossRef] [PubMed]
  71. Tsai, H.Y.; Janss, L.L.; Andersen, J.R.; Orabi, J.; Jensen, J.D.; Jahoor, A.; Jensen, J. Genomic prediction and GWAS of yield, quality and disease-related traits in spring barley and winter wheat. Sci. Rep. 2020, 10, 3347. [Google Scholar] [CrossRef]
  72. Hickey, L.T.; Lawson, W.; Platz, G.J.; Fowler, R.A.; Arief, V.; Dieters, M.; German, S.; Fletcher, S.; Park, R.F.; Singh, D.; et al. Mapping Quantitative Trait. Loci for Partial Resistance to Powdery Mildew in an Australian Barley Population. Crop Sci. 2012, 52, 1021–1032. [Google Scholar] [CrossRef]
  73. Turuspekov, Y.; Ormanbekova, D.; Rsaliev, A.; Abugalieva, S. Genome-wide association study on stem rust resistance in Kazakh spring barley lines. BMC Plant Biol. 2016, 16, 13–21. [Google Scholar] [CrossRef] [PubMed] [Green Version]
  74. Ledesma-Ramírez, L.; Solís-Moya, E.; Iturriaga, G.; Sehgal, D.; Reyes-Valdes, M.H.; Montero-Tavera, V.; Sansaloni, C.P.; Burgueño, J.; Ortiz, C.; Aguirre-Mancilla, C.L.; et al. GWAS to Identify Genetic Loci for Resistance to Yellow Rust in Wheat Pre-Breeding Lines Derived from Diverse Exotic Crosses. Front. Plant. Sci. 2019, 10, 1390. [Google Scholar] [CrossRef]
  75. Almerekova, S.; Genievskaya, Y.; Abugalieva, S.; Sato, K.; Turuspekov, Y. Population structure and genetic diversity of two-rowed barley accessions from Kazakhstan based on snp genotyping data. Plants 2021, 10, 2025. [Google Scholar] [CrossRef] [PubMed]
  76. Brueggeman, R.; Rostoks, N.; Kudrna, D.; Kilian, A.; Han, F.; Chen, J.; Druka, A.; Steffenson, B.; Kleinhofs, A. The barley stem rust-resistance gene Rpg1 is a novel disease-resistance gene with homology to receptor kinases. Proc. Natl. Acad. Sci. USA 2002, 99, 9328–9333. [Google Scholar] [CrossRef] [PubMed] [Green Version]
  77. Wenz, P.; Raman, R.; Wang, J.; Zhou, M.; Huttner, E.; Kilian, A. A DArT platform for quantitative bulked segregant analysis. BMC Genom. 2007, 8, 196. [Google Scholar] [CrossRef]
  78. Kilian, A.; Huttneri, E.; Wenzl, P.; Jaccoud, D.; Carling, J.; Gaig, V.; Eversi, M.; Heller-Uszynska, K.; Uszynski, G.; Cayla, C.; et al. The Fast and the Cheap: SNP and DArT-Based Whole Genome Profiling for Crop Improvement. In Proceedings of the International Congress “In the Wake of the Double Helix: From the Green Revolution to the Gene Revolution”, Bologna, Italy, 27–31 May 2003; Tuberosa, R., Phillips, R.L., Gale, M., Eds.; Avenue Media: Bologna, Italy, 2005; pp. 443–461. [Google Scholar]
Figure 1. Temperature and precipitation in the fields where the experiment was performed: mean and maximum temperatures and precipitation during plant development stages from heading to physiological maturity in 2018 and 2019.
Agronomy 12 00007 g001
Figure 2. Summary data for powdery mildew (PM) severity on spring barley accessions phenotyped under field conditions in 2018–2019. Average value of disease severity, SD (p ≤ 0.05) and CV (%) at the heading (PM_HA) and the milky-waxy (PM_MW) stages in 2019 and at the milky-waxy (PM_MW) stage in 2018. Disease severity was scored on the 1–9 scale (1 = immune reaction).
Agronomy 12 00007 g002
Figure 3. Frequency distribution of the barley accessions for powdery mildew (PM) resistance scores at heading (HA) and milky-wax (MW) stages in 2019 and MW stage in 2018. Figures (A1), (B1), and (C1) present the normal Gauss frequency distribution. Figures (A2), (B2), and (C2) present regression analysis model to estimate relationship between PM resistance scores and frequency index. Disease severity scored on the 1–9 scale (1 = immune reaction).
Agronomy 12 00007 g003aAgronomy 12 00007 g003b
Figure 4. Powdery mildew (PM) resistance accessions belong to the sub-collections evaluated in 2018–2019 and their frequency distribution for the PM resistance scores. Figures (A1), (B1), and (C1) present the results of the ANOVA (p ≤ 0.05) and the bars represent the SD (p ≤ 0.05). Figures (B1), (B2), and (C2) present the regression analysis model estimating the relationship between the PM resistance scores and the frequency index. The sub-collections (groups) of accessions were created using two criteria: (1) cultivation period and registration of cultivars (group A—cultivated prior to 1985, B—cultivated after 1985 and C—Polish landraces) and (2) country of origin or geographical region: I—POL; II: CSK, DEU, DNK, AUT; III: FRA; IV: GBR, IRL; V: NLD, FIN, NOR; VI SWE; VII: other non-European.
Agronomy 12 00007 g004aAgronomy 12 00007 g004b
Figure 5. Summary data for stem rust severity in spring barley accessions phenotyped under field conditions in 2018–2019. Average value of disease severity, SD (p ≤ 0.05) and CV (%) at the heading (SR_HA) and milky-waxy (SR_MW) stages in 2019 and at the milky-waxy (SR_MW) stage in 2018. Disease severity was scored on the 1–9 scale (1 = immune reaction).
Agronomy 12 00007 g005
Figure 6. Frequency distribution of the barley accessions for stem rust (SR) resistance scores at milky-wax (MW) stage in 2018 and 2019. Frequency distribution of the barley accessions for SR at MW stage in 2019 Figures (A1) and (A2). Frequency distribution of the barley accessions for SR at MW stage in 2018 Figures (B1) and (B2). Figures (A1) and (B2) present the regression analysis model estimating the relationship between the SR resistance scores and the frequency index. Disease severity was scored on the 1–9 scale (1 = immune reaction).
Agronomy 12 00007 g006
Figure 7. Stem rust (SR) resistance accessions belong to the sub-collections evaluated in 2018–2019 and their frequency distribution for the SR resistance scores. Figures (A1) and (B1) present the results of the ANOVA SD (p ≤ 0.05) and the bars represent SD (p ≤ 0.05). Figures (B1) and (B2) show the regression analysis model estimating the relationship between the SR resistance scores and the frequency index. The sub-collections (groups) of accessions were created using two criteria: (1) cultivation period and registration of cultivars (group A—cultivated prior to 1985, B—cultivated after 1985 and C—Polish landraces) and (2) country of origin or geographical region: I—POL; II: CSK, DEU, DNK, AUT; III: FRA; IV: GBR, IRL; V: NLD, FIN, NOR; VI SWE; VII: other non-European.
Agronomy 12 00007 g007
Figure 8. Summary data for barley brown rust severity on spring barley accessions phenotyped under field conditions during 2018–2019. Average values of disease severity, SD (p ≤ 0.05) and CV (%) at the heading (BBR_HA) and the milky-waxy (BBR_MW) stages in 2019 and at the milky-waxy (BBR_MW) stage in 2018. Disease severity was scored on the 1–9 scale (1 = immune reaction).
Agronomy 12 00007 g008
Figure 9. Frequency distribution of the barley accessions for the barley brown rust (BBR) resistance scores at the heading (HA) and milky-wax (MW) stages in 2019 and MW stage in 2018. Figures (A1), (B1), and (C1) present the normal Gauss frequency distribution. Figures (A2), (B2), and (C2) present regression analysis model to estimate relationship between the BBR resistance scores and the frequency index. Disease severity scored on the 1–9 scale (1 = immune reaction).
Agronomy 12 00007 g009
Figure 10. Barley brown rust (BBR) resistance accessions belong to the sub-collections evaluated in 2018–2019 and their frequency distribution for the BBR resistance scores. Figures (A1), (B1), and (C1) present the results of the ANOVA (p ≤ 0.05)) and the bars represent SD (p ≤ 0.05). Figures (B1), (B2), and (C2) show the regression analysis model estimating the relationship between the BBR resistance scores and the frequency index. The sub-collections (groups) of accessions were created using two criteria: (1) cultivation period and registration of cultivars (group A—cultivated prior 1985, B—cultivated after 1985 and C—Polish landraces) and (2) country of origin or geographical region: I—POL; II: CSK, DEU, DNK, AUT; III: FRA; IV: GBR, IRL; V: NLD, FIN, NOR; VI: SWE; VII: other non-European.
Agronomy 12 00007 g010
Figure 11. UpSet plot showing the number of marker–trait associations (MTAs) identified via GWAS. Markers identified as significant for more than one trait are shown as intersects between sets.
Agronomy 12 00007 g011
Figure 12. Single-nucleotide polymorphism (SNP) significantly associated with powdery mildew (PM) resistance in barley identified by genome-wide association study (GWAS) with BLINK model. Manhattan plot and quantile–quantile plot for 2019 heading stage Figures (A1) and (A2); Manhattan plot and quantile–quantile plot for maximum disease scores across both growth stages and years Figures (B1) and (B2).
Agronomy 12 00007 g012
Figure 13. Single-nucleotide polymorphism (SNP) significantly associated with barley brown rust (BBR) resistance in barley identified by genome-wide association study (GWAS) with BLINK model. Manhattan plot and quantile–quantile plot for 2019 heading stage Figures (A1) and (A2); Manhattan plot and quantile–quantile plot for 2019 milky-waxy stage Figures (B1) and (B2); Manhattan plot and quantile–quantile plot for maximum disease scores across both growth stages and years Figures (C1) and (C2).
Agronomy 12 00007 g013
Figure 14. Single-nucleotide polymorphism (SNP) significantly associated with stem rust (SR) resistance in barley identified by genome-wide association study (GWAS) with BLINK model. Manhattan plot and quantile–quantile plot for 2019 heading stage Figures (A1) and (A2); Manhattan plot and quantile–quantile plot for 2019 milky-waxy stage Figures (B1) and (B2); Manhattan plot and quantile–quantile plot for maximum disease scores across both growth stages and years Figures (C1) and (C1).
Agronomy 12 00007 g014
Table 1. Number of accessions per sub-collection and groupings. Group A corresponds to old cultivars cultivated prior to 1985, group B corresponds to moderate and modern cultivars cultivated after 1985, and group C corresponds to Polish landraces.
Sub-CollectionCountry of OriginGroupGermplasm Numbers (n)
PolishPOLIA51
B49
C37
West-Central EuropeanCSK, DEU, DNK, AUTIIA91
B59
FrenchFRAIIIA14
B21
Great BritishGBR, IRLIVA22
B8
Other European countriesNLD, FIN, NORVA16
B15
SwedishSWEVIA12
B26
Other non-European countriesVII 10
Total 431
Table 2. Summary of the number of significant (false discovery rate adjusted to ≤0.05) marker–trait associations per chromosome per trait.
ChromosomePowdery Mildew (PM)Stem Rust (SR)Barley Brown Rust (BBR)
2019Maximum Scores Across All Replicates 2018–20192019Maximum Scores Across All Replicates 2018–20192019Maximum Scores Across All Replicates 2018–2019
Heading Stage (HA)Milky-Waxy Stage (MW)Heading Stage (HA)Milky-Waxy Stage (MW)Heading Stage (HA)Milky-Waxy Stage (MW)
1H200260200
2H002540101
3H101200003
4H101410000
5H100330201
6H001330010
7H000391102
Total50522261617
Table 3. Pearson correlation coefficients between resistance to powdery mildew, barley brown rust, and stem rust at heading (HA) and milky-waxy (MW) seed stages.
DiseaseYearGrowth StagePowdery Mildew (PM)Barley Brown Rust (BBR)Stem Rust (SR)
20192018201920182019
HAMWMWHAMWMWHAMW
Powdery mildew (PM)2019HA1.000
MW0.771 ***1.000
2018MW0.315 **0.186 *1.000
Barley brown rust (BBR)2019HA0.309 **0.194 *0.149 *1.000
MW0.215 **0.123 *0.0890.695 ***1.000
2018MW0.144 *0.0500.488 ***0.329 **0.122 *1.000
Stem rust (SR)2019HA0.174*0.126 *0.0220.166 *0.133 *0.0541.000
MW0.174 *0.092−0.0120.277 **0.231 **−0.0120.0741.000
2018MW0.100 *0.0360.347 ***0.227 **0.174 *0.383 ***0.062−0.019
*, **, *** significance at the level 5%, p ≤ 0.05, 1%, p ≤ 0.01 and 0.1%, p ≤ 0.001, respectively.
Table 4. Significant marker–trait associations (MTAs) for resistance to powdery mildew (PM) at heading stage (PM_HA) and maximum disease scores across all replicates 2018–2019.
TraitSNP IDChromosomeAllelesSNP Physical Localizationp-ValueFDR_Adjusted_p-Values
PM-HA3911365-451HG/A368985776<0.00010.0698
PM-HA3262583-221HA/C5190718520.78630.9757
PM-HA3259998-683HG/C176708010.01140.6563
PM-HA3432490-284HT/C6274413920.34380.8421
PM-HA4169584-265HG/T6503185600.03620.6563
PM6278248-382HT/C706966122<0.0001<0.0001
PM3255391-293HG/A611444890<0.0001<0.0001
PM3432490-284HT/C627441392<0.0001<0.0001
PM6270346-596HC/G3525664400.08260.7632
PM3254946-372HC/T691996310.25540.9025
Table 5. Significant marker–trait associations (MTAs) for resistance to BBR MW seeds stage and maximum disease scored across all replicates 2018–2019.
TraitSNP IDChromosomeAllelesSNP Physical Localizationp-ValueFDR_Adjusted_p-Value
BBR-MW3432368-456HA/G541093516<0.0001<0.0001
BBR3254780-212HC/T7450713360.27540.7942
BBR3255391-293HG/A6114448900.51330.9340
BBR3398205-73HA/G6115544170.51330.9340
BBR3432906-233HT/G1734458900.10950.7760
BBR3256738-345HA/G3717081310.41080.8968
BBR3919209-427HG/C6327378380.35510.8500
BBR5260969-177HT/G6382761930.68410.9699
Table 6. Significant marker–trait associations (MTAs) for resistance to stem rust (SR) at heading, (HA) milky-wax (MW) seed stage and maximum disease scored across all replicates 2018–2019.
TraitSNP IDChromosomeAllelesSNP Physical Localizationp-ValueFDR_Adjusted_p-Value
SR-HA3916722-61HG/A443692735<0.0001<0.0001
SR-HA7242068-561HC/G54281150<0.0001<0.0001
SR-HA3257827-542HA/G612548328<0.0001<0.0001
SR-HA3254861-282HT/G672603288<0.0001<0.0001
SR-HA3920041-343HG/A553941251<0.0001<0.0001
SR-HA100017008-293HT/G236509272<0.0001<0.0001
SR-HA3260326-225HC/T584321761<0.0001<0.0001
SR-HA3911523-285HG/A582296115<0.0001<0.0001
SR-HA3926286-96HT/C582688589<0.0001<0.0001
SR-HA8658544-486HC/A19549390<0.0001<0.0001
SR-HA3665999-276HG/A894153410.00180.2114
SR-HA6437148-277HG/C6258981880.99981.0000
SR-HA7242117-497HG/T576216690<0.00010.0086
SR-MW3911365-451HG/A368985776<0.00010.0059
SR-MW3924215-361HC/T3689839470.00010.0157
SR-MW3255467-461HA/G3616489930.00010.0200
SR-MW6429360-141HC/T3616490590.00010.0200
SR-MW4007106-271HT/A873535000.00010.0269
SR-MW7242068-561HC/G542811500.00030.0462
SR-MW3256098-572HA/G7245765710.00020.0300
SR-MW4329845-192HG/C7246525730.00020.0344
SR-MW3256445-312HG/T6511603680.00020.0398
SR-MW3255089-302HG/C7609307490.00030.0462
SR-MW3924288-414HA/G369455440.00010.0160
SR-MW14350408-635HT/C4536398490.00010.0183
SR-MW3254700-125HC/G6229599550.00020.0360
SR-MW3398368-65HC/G6230605740.00030.0398
SR-MW7244989-236HG/A56338324<0.00010.0115
SR-MW3261100-76HG/A5491714290.00010.0200
SR-MW4790439-146HC/G5482889360.00020.0360
SR-MW3925588-207HT/G472163680<0.00010.0049
SR-MW4792770-437HA/G384858359<0.00010.0049
SR-MW3918497-647HA/G552832603<0.00010.0049
SR-MW3920255-117HG/A553641369<0.00010.0049
SR-MW6277097-237HC/G555109356<0.00010.0049
SR-MW3432458-597HT/C357545360<0.00010.0049
SR-MW5258884-147HG/T372119583<0.00010.0049
SR-MW13142583-107HG/A556433100<0.00010.0049
SR-MW3258004-517HT/C6060947890.00030.0445
SR3918497-647HA/G552832603<0.00010.0049
Publisher’s Note: MDPI stays neutral with regard to jurisdictional claims in published maps and institutional affiliations.

