
Location of Fruits by Counting: A Point-to-Point Approach
1
College of Artificial Intelligence, Nanjing Agricultural University, Nanjing 210095, China
2
Nanjing Artificial Intelligence Research of IA, Nanjing 210000, China
*
Author to whom correspondence should be addressed.
Agronomy 2022, 12(11), 2863; https://0-doi-org.brum.beds.ac.uk/10.3390/agronomy12112863
Submission received: 14 October 2022
/
Revised: 11 November 2022
/
Accepted: 14 November 2022
/
Published: 16 November 2022
(This article belongs to the Special Issue Machine Vision Systems in Digital Agriculture)
Abstract
:The emergence of deep learning-based methods for harvesting and yield estimates, including object detection or image segmentation-based methods, has notably improved performance but has also resulted in large annotation workloads. Considering the difficulty of such annotation, a method for locating fruit is developed in this study using only center-point labeling information. To address point labeling, the weighted Hausdorff distance is chosen as the loss function of the corresponding network, while deep layer aggregation (DLA) is used to contend with the variability in the visible area of the fruit. The performance of our method in terms of both detection and position is not inferior to the method based on Mask-RCNN. Experiments on a public apple dataset are provided to further demonstrate the performance of the proposed method. Specifically, no more than two targets had positioning deviations exceeding five pixels within the field of view.
1. Introduction
With the development of smart agriculture, computer vision technology has begun to play an important role in the perception of crops and their growth environments. The perception of fruit is the first step in yield estimation and picking, two classic applications of agricultural automation, and involves both the detection and positioning of fruits.
The research on fruit detection began first to aid in yield estimation. Pioneering works on yield estimation included grapes [1,2], apples [3,4], tomatoes [5,6] and cotton [7]. Some visual features obtained by artificial selection, such as color, size, texture or shape, are used to accomplish the detection task. Vulnerable to the influence of the environment and light, the detection recall rate in these papers ranges from to . This means lots of fruit are ignored. With the great success of deep learning in the field of computer vision, the performance in yield estimation has improved by feature extraction [8], object detection [9] and image segmentation [10,11] to around 90%. As one other application, obtaining the position of fruits is useful for automatic harvesting, which requires judgment of stress points. Meanwhile, the geometric model of fruit is often regarded as a priori knowledge. Hence, accurate positioning on the central point of fruit plays a crucial role in successful harvesting. In past works, when the accuracy of perception technology on an RGB image was inadequate, the researchers often met positioning requirements by adding new sources of information or weakening the degree of complexity of the background [12,13,14,15,16,17,18,19,20].
However, due to its low cost, research on monocular vision-based localization continues. Conforming to the development trend of computer vision, image segmentation technology based on deep convolutional neural networks is advantageous in locating fruit. Semantic segmentation is first used to distinguish the different tissues of plants, and then, the fruit template is used to search for morphologically similar targets in the result [21]; instance segmentation is also used to further improve the positioning accuracy [22,23,24]. Note that a deep learning method not only improves the accuracy but also results in a large annotation workload [25]. The short harvesting season does not allow a sufficient number of annotations to finetune the network parameters [26]. Hence, we attempt to involve a training network in a way that allows easy labeling: by empirically identifying only the centers of fruits, called the point-to-point approach, as in [25] to use point information to produce proper bounding boxes as ground truth for detection algorithm. Point-based approaches have emerged with the demand of counting objects with a large density, such as crowd counting. The “detecting then counting” approaches [27,28,29] are gradually being replaced by approaches based on estimating by a density map [30,31,32,33] due to the requirements for the bounding-box or instance mask annotations, which are much more labor-intensive in dense crowds. However, in addition to yield estimation, precision agriculture also requires the positioning of fruit for harvesting. Therefore, a method of “estimating then positioning” is adopted, and average Hausdorff distance is used to achieve point-to-point positioning.
In this paper, we propose a deep learning-based fruit location method with annotation only for estimating fruit centers. To distinguish the fruit from the background, a multi-task neural network is designed to identify the presence of fruit centers with higher activation in the output layer and to output the estimated number of fruits simultaneously. Our contribution is reducing the annotation workload for fruit detection and positioning. It includes the identification of an appropriate loss function for the tasks described in this paper and the use of a special backbone for a multi-task network according to the specific visible appearance characteristics of fruit. Thus, a multi-task deep neural network with branched outputs is developed to accurately locate the instance of each fruit with an extremely limited annotation workload for various complex environments, without limitations regarding illumination, occlusion, number of fruits, etc. Moreover, an end-to-end inference on fruit detection can ensure a real-time yield estimation with GPU acceleration.
The remainder of the paper is organized as follows: first, in Section 2, to verify the effectiveness of our method, the data preparation process for a public dataset is introduced, and the entire method is detailed. Then, for the tasks of detection and positioning, we compare the performance of our method to that of Mask-RCNN in Section 3, in which the features and limitations of our method are also discussed. Finally, conclusions and aspirations for future work are given in Section 4.
2. Materials and Methods
2.1. Image Dataset
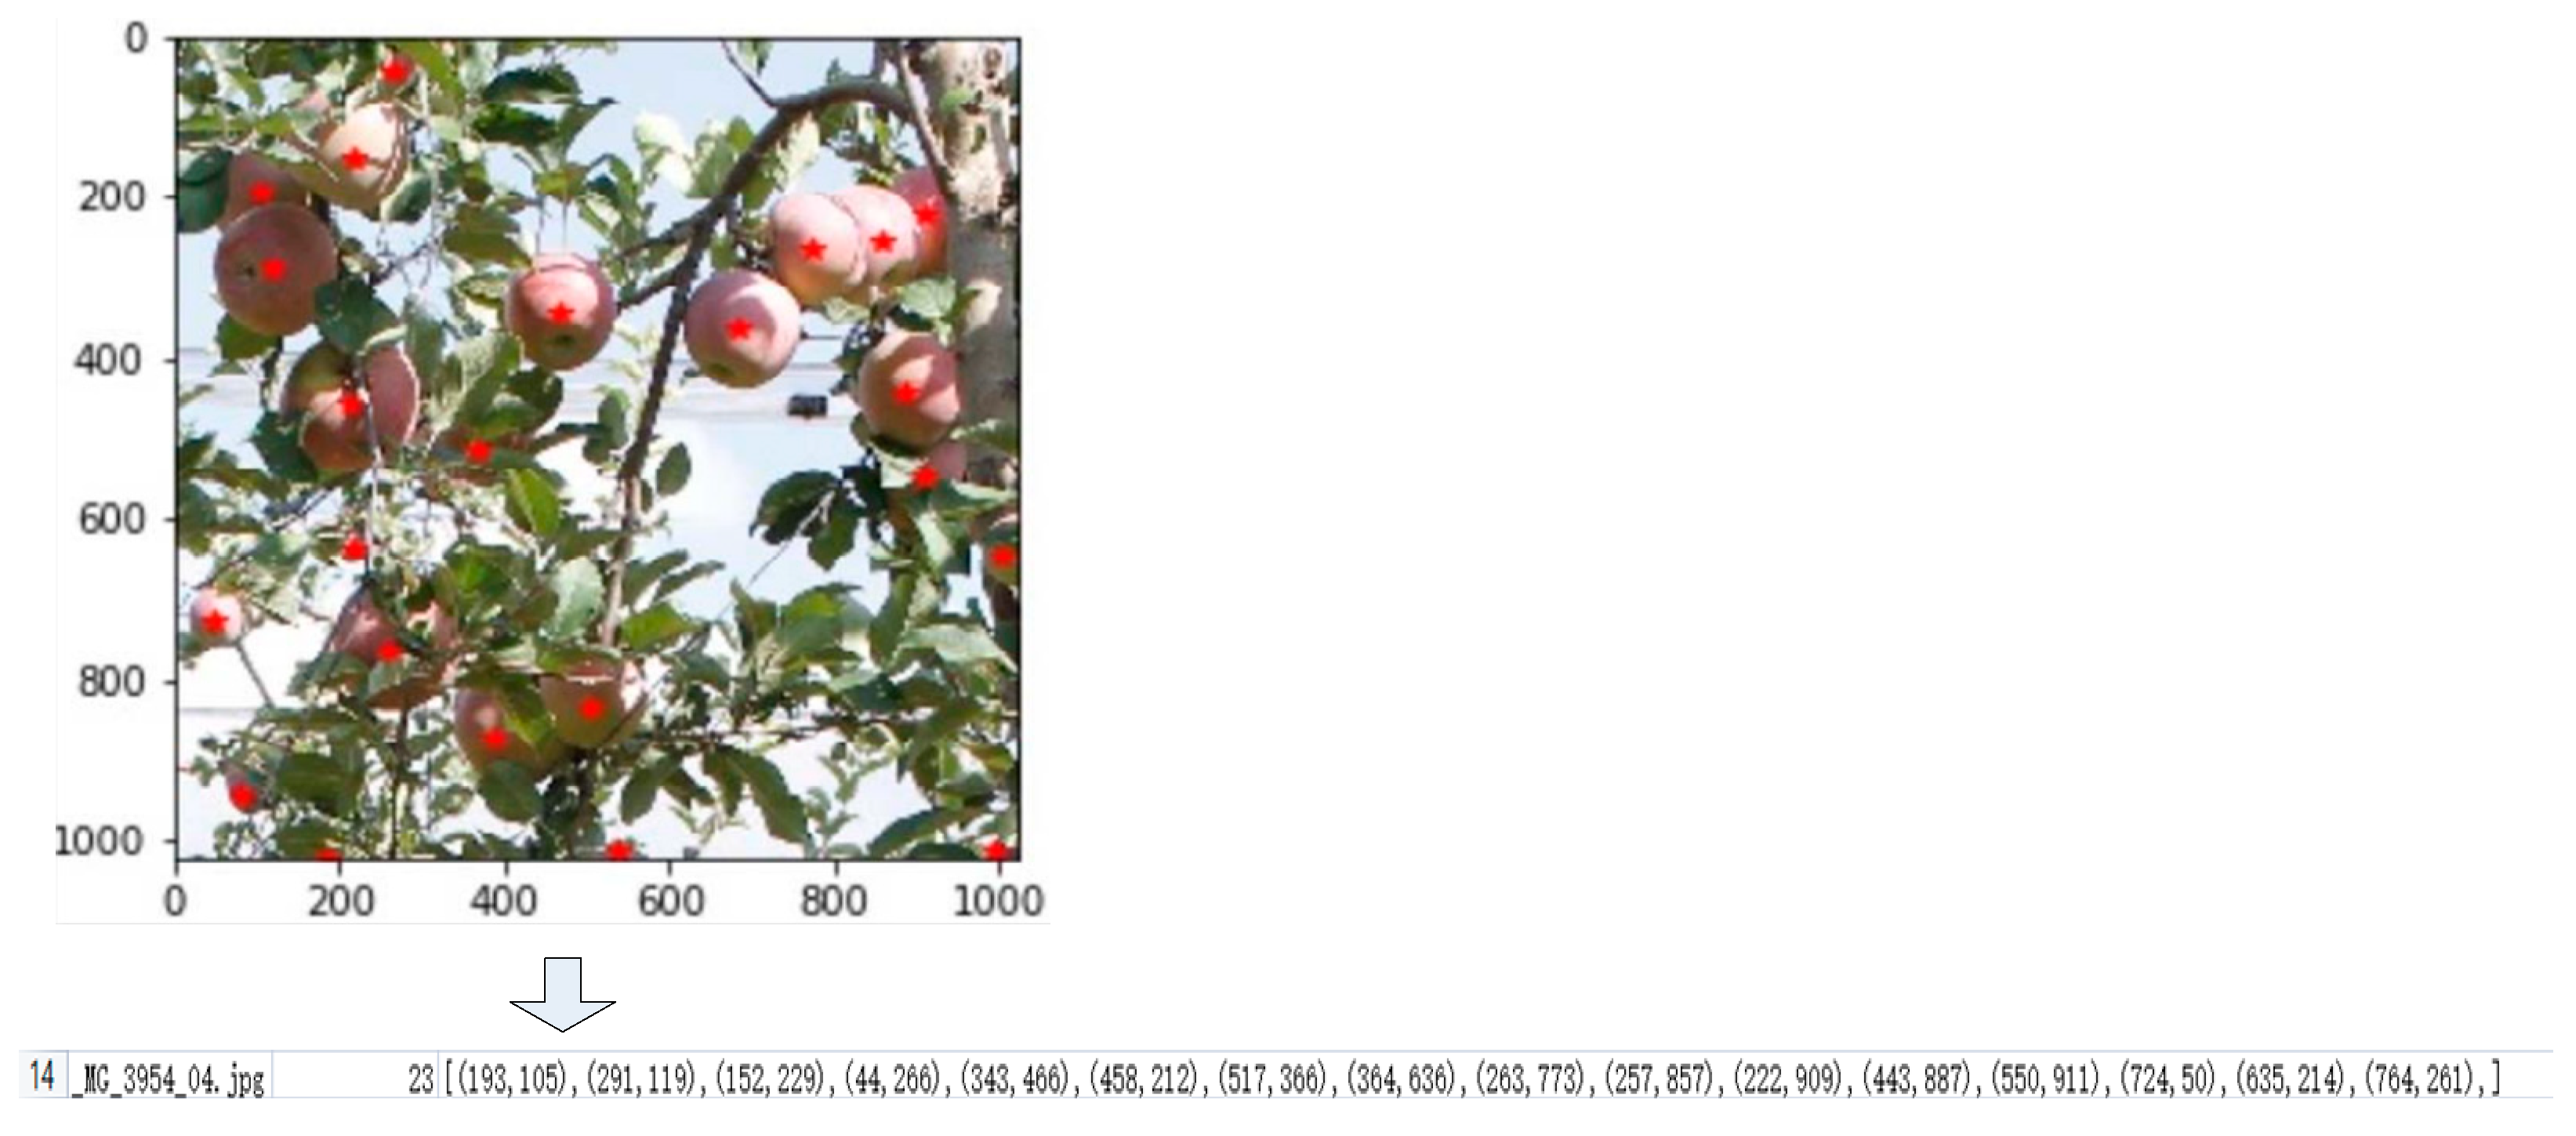
For convenience in the verification of the effectiveness of our method, a public dataset [24] was chosen for the tasks of detection and positioning of fruit. This dataset contains raw apple images with dimensions of under different natural lighting conditions. All images have corresponding manual annotations in the form of boxes. In this paper, we only use the information on the central point of the fruit targets. As shown in Figure 1, the ground truth of this information is the center point of the annotated boxes in the database, which is in the form of . Note that and are the coordinates of center point and is the number of apples in the image.
2.2. Method Framework
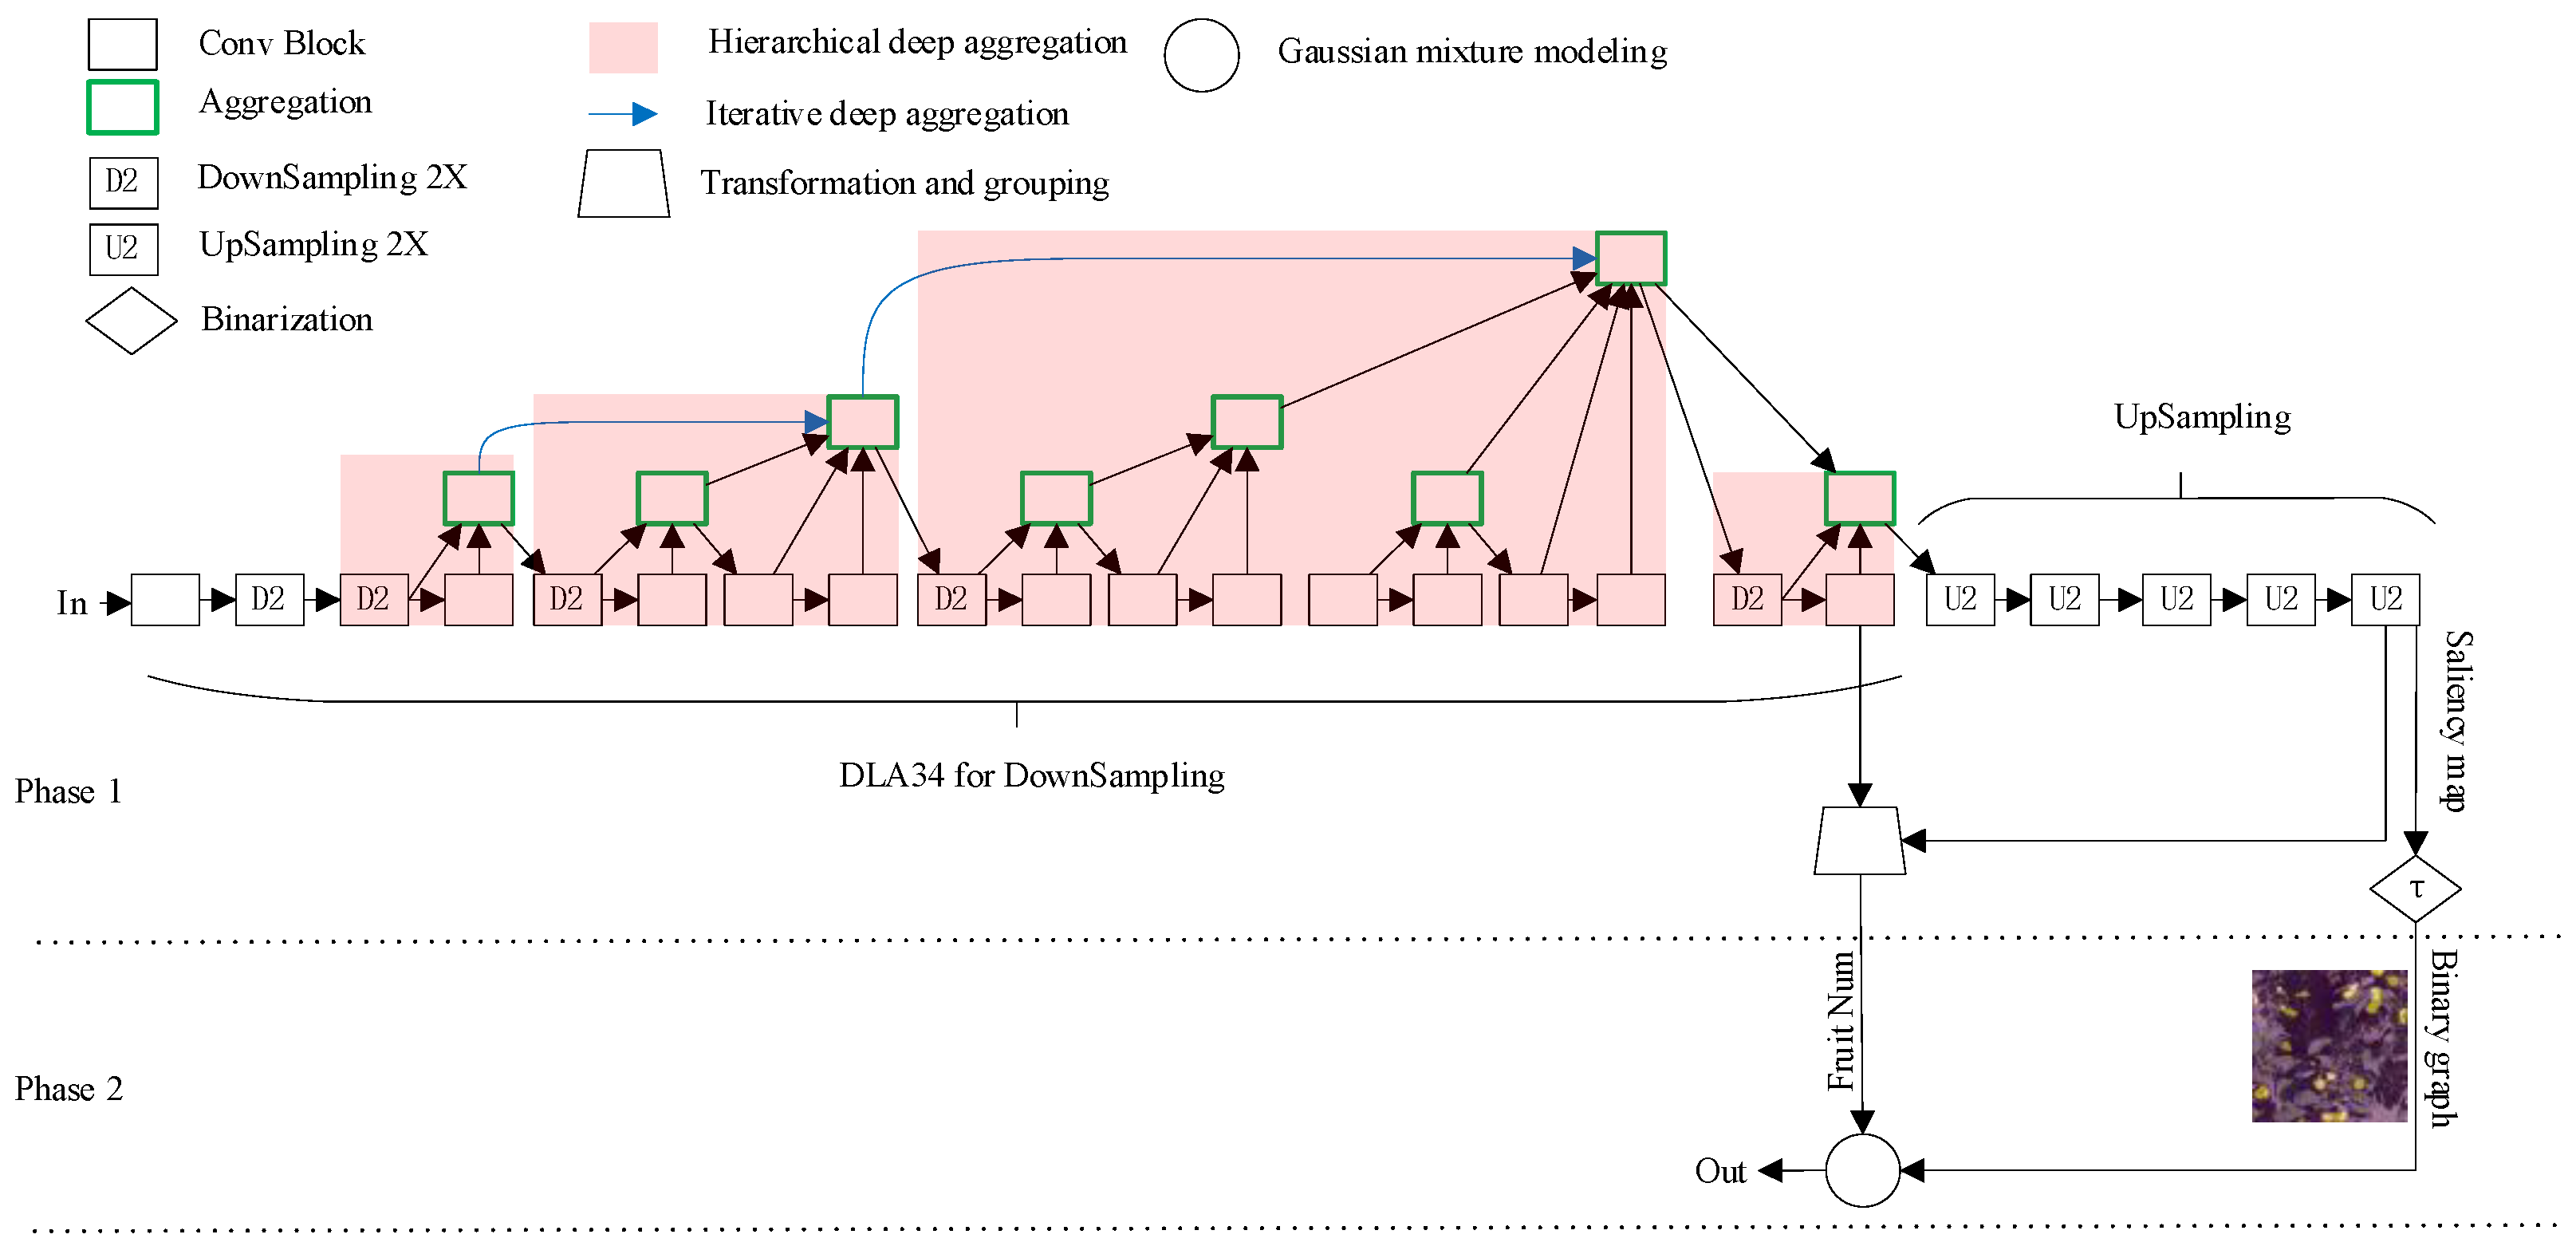
In this paper, a fruit detection algorithm is proposed to solve the location problem utilizing the concept of segmentation in computer vision. A brief flowchart of the proposed algorithm is shown in Figure 2. The main procedure can be divided into two phases, i.e., network inference and pixel clustering. In the first phase, a multi-task deep neural network (DNN) is trained to export the binary segmentation graph and estimated number of fruits. As a classical backbone for semantic segmentation, the deep layer aggregation segmentation network (DLASeg) is taken as the core element of the multi-task DNN.
After feature extraction, the saliency map branch consists of five upsampling operations to output a probability map, and the other branch used to estimate the number of objects in the image is based on information from the features in the deepest level and from the estimated probability map. Two sets of features, namely the feature vector and the probability map, are transformed into two 64-dimensional feature vectors respectively. Then, the vectors are grouped into a hidden layer together to output a single number. After that, ReLU is implemented to ensure that the output is positive. Then, this output is rounded to the closest integer as the final estimation on the number of fruits, which is named as and can be used for yield estimation.
After inference, the saliency map branch outputs , where is the confidence that a fruit exists at the pixel coordinate in the image . For fruit positioning, we threshold the whole map to obtain fruit pixels by , where is set to in this paper. The saliency map is converted into a binary segmentation graph for the fruits and background. Finally, a Gaussian mixture model is used to fit the points F by the expectation maximization (EM, [34]) algorithm. The centers of Gaussian distributions are the estimated centers of fruits for picking.
2.3. Network Backbone
Recent fruit detection approaches have made use of a variety of backbone architectures, but the most popular among them are usually the VGGnet [35] and ResNet families of architecture [36]. Although these architectures have proven benefits across a variety of tasks, we believe that more recent developments in the field can be leveraged to achieve more successful fruit detection. To this end, we make use of the DLA-34 backbone presented in [37]. The deep layer aggregation (DLA) family of models employs two forms of aggregation, named iterative deep aggregation (IDA) and hierarchical deep aggregation (HDA), to form an architecture that extends densely connected networks [38] and feature pyramid networks with hierarchical and iterative skip connections that deepen the representation and refine the resolution. In detail, IDA focuses on fusing resolutions and scales, while HDA focuses on merging features from all modules and channels. In a real environment, the visible area of the fruit is affected by the distance from the camera and its own growth and occlusion, resulting in considerable shape changes. Using the above-described architecture, the DLA family of models leverages deep layer aggregation, which unifies semantic and spatial fusion for better localization and semantic interpretation. We believe these are desirable properties for the tasks of fruit detection and segmentation.
2.4. Loss Function for Network
In this paper, the loss function for the fruit position network is based on the average Hausdorff distance . In detail, taking an image in a harvest environment as an example, the estimated fruit center points are marked as , while the centers set in ground truth are marked as . The commonly used Euclidean distance is used to measure the distance between the two categories of pixels, and it can be recorded as , where and . Hence, can be formulated as follows:
where and are the numbers of points in and , respectively. Since both and are non-empty sets required for calculation, images without fruit targets cannot be used for training. Meanwhile, the heatmap output by the network backbone cannot give accurate fruit location coordinates. Thus, Equation (1) is modified into a weighted Hausdorff distance [39] as follows:
where is the pixel coordinate of I, is the maximum diagonal pixel distance of each image and is the single-valued output of the network at pixel coordinate . Moreover,
is the sum of the probabilities of whether the pixels in the figure belong to the fruit and is used as the generalized mean, and is set to , while
where and is the number of pixels in the heatmap.
Meanwhile, we designed the loss function for fruit counting with a smooth loss for regression of the fruit count. Hence, the total loss function of the network is defined as follows:
where is the actual number of fruits and is the estimated number of fruits.
2.5. Performance Measures
2.5.1. Software and Experimental Settings
In this paper, the whole approach is implemented in the Python programming language with support from OpenCV, an open-source library for computer vision. In addition to PyTorch, the training and inference of our deep CNN in a multi-task framework require GPU acceleration; other algorithms in our approach are processed on a CPU. The GPU and CPU of our platform are a Tesla P40 and a Core i5-8400, respectively. ImageNet is used with pretrained weights for the DLA-34 backbone and the inputs are normalized accordingly. The batch size is set to 32. Meanwhile, an Adam optimizer with a learning rate of 10−4 and a momentum of 0.9 was chosen for training. Augmentation of the training images was conducted via horizontal flipping operation as performed in [24].
2.5.2. Evaluation Metrics
To demonstrate the effectiveness of our approach, we evaluated its performance in fruit detection. Following [24], three indexes are considered in the evaluation:
where is the total number of fruits in the dataset, is the number of detected fruits and is the number of true positives (detection points in the areas of ground truth).
We also report the mean absolute error (MAE), root mean squared error (RMSE) and mean absolute percentage error (MAPE) to evaluate the positioning accuracy (a true positive is counted if an estimated location is at most at distance r from a ground truth point):
where , is the number of images, is the true object count in the image and is our estimate.
3. Experimental Results and Discussion
3.1. Experimental Results on Detection
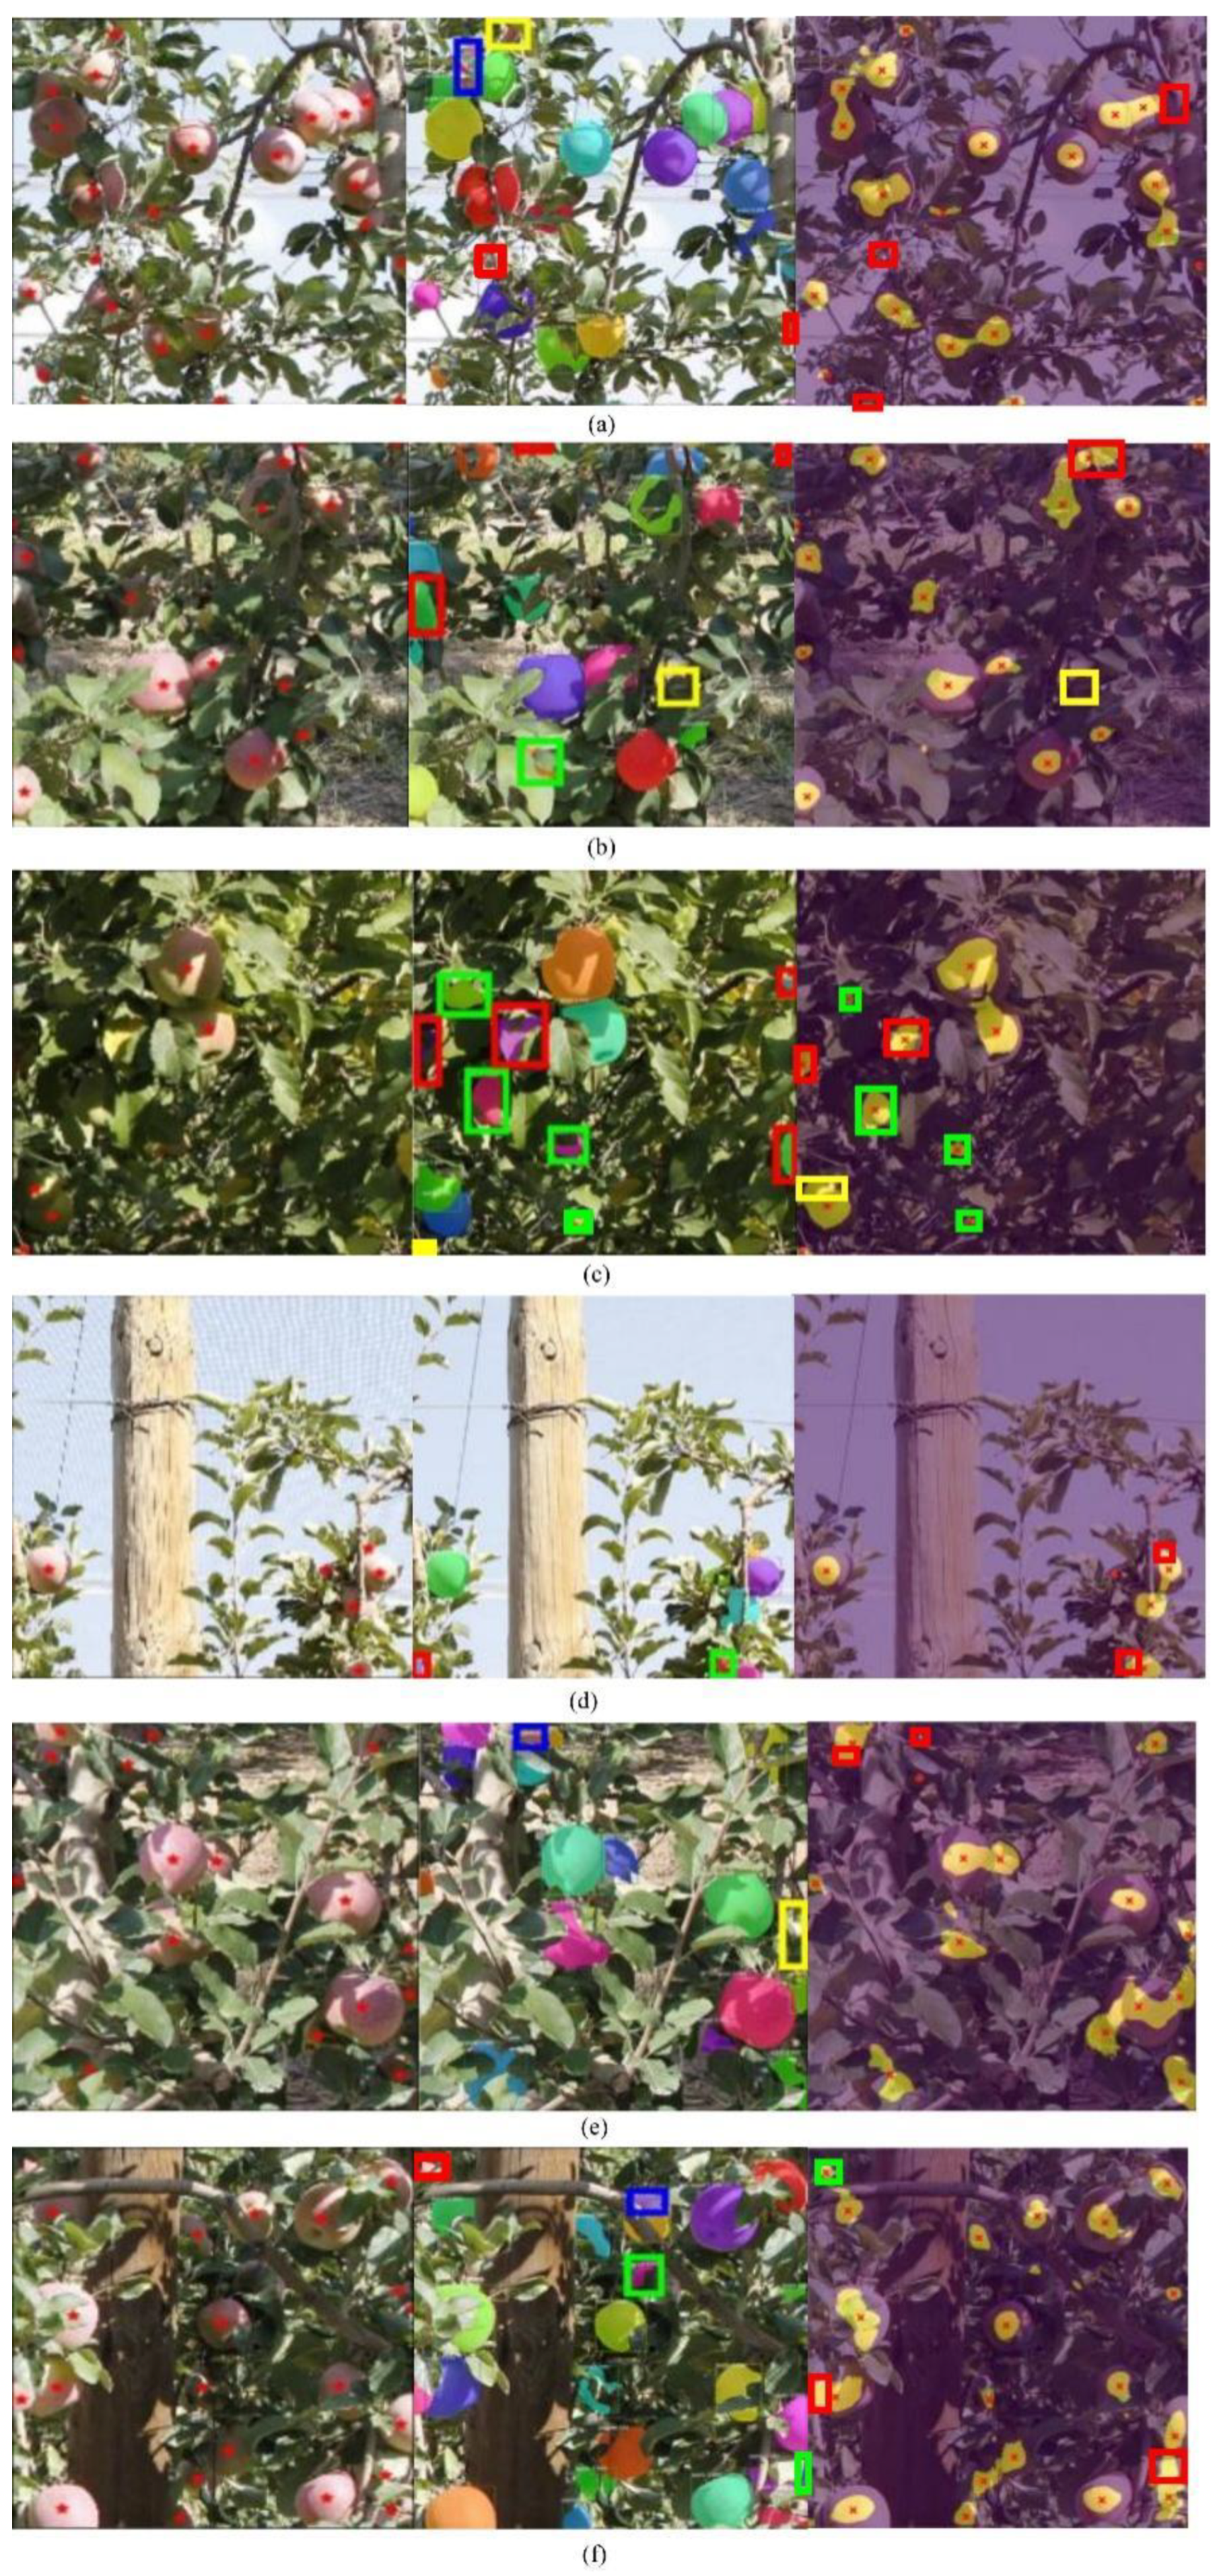
In this section, using the apple dataset mentioned in Section 2, we present the detection results of our method and compare them with those of Mask-RCNN, described in [24]. As shown in Table 1, compared with Mask-RCNN, our method is less susceptible to environmental factors (such as illumination and color) and misjudgment of the background as fruit, so it has an obvious advantage in precision. Our method is easily confused by overlaps between fruits, however (especially those between large apples and small apples). In addition, small pieces captured in the segmentation results were easily missed as targets. Therefore, the performance of our method is similar to Mask-RCNN in terms of recall, as shown in Table 1; however, in general, our method achieved a better performance in terms of the F1-score.
To more intuitively visualize the advantages and disadvantages of the two methods, we show the detection results for some images in the test set. As shown in subsets (a), (e) and (f) of Figure 3, Mask-RCNN is easily affected by occlusion and splits an apple into multiple targets. In contrast, our algorithm easily confuses them into one target due to the overlap between fruits. In production estimation, the former readily leads to overestimation, while the latter leads to underestimation.
3.2. Experimental Results on Position
Within different allowable center point deviation distances, the number of apples to be located was counted and compared with the real number of apples. The statistical results are shown in Table 2. Using our method, we found that a large portion of the positions detected deviated from the center of the fruit by more than one pixel. However, if the allowable range for the positioning error was relaxed to five pixels, on average, there were only approximately 1 to 2 false detections per image. It makes little sense to allow the positioning error to be relaxed to 10 pixels because positioning errors are mainly caused by misdetection. Additionally, because most of the false positives from Mask-RCNN are caused by multiple detections or misjudgments of the background, most fruits are detected; furthermore, it is not easily influenced by the overlap between fruits and thus performs better than our method. Hence, our algorithm only performs worse than Mask-RCNN for an allowable error boundary of one pixel. However, the two methods perform similarly for an allowable positioning error boundary of 5 or 10 pixels.
3.3. Discussion on the Features of Our Method
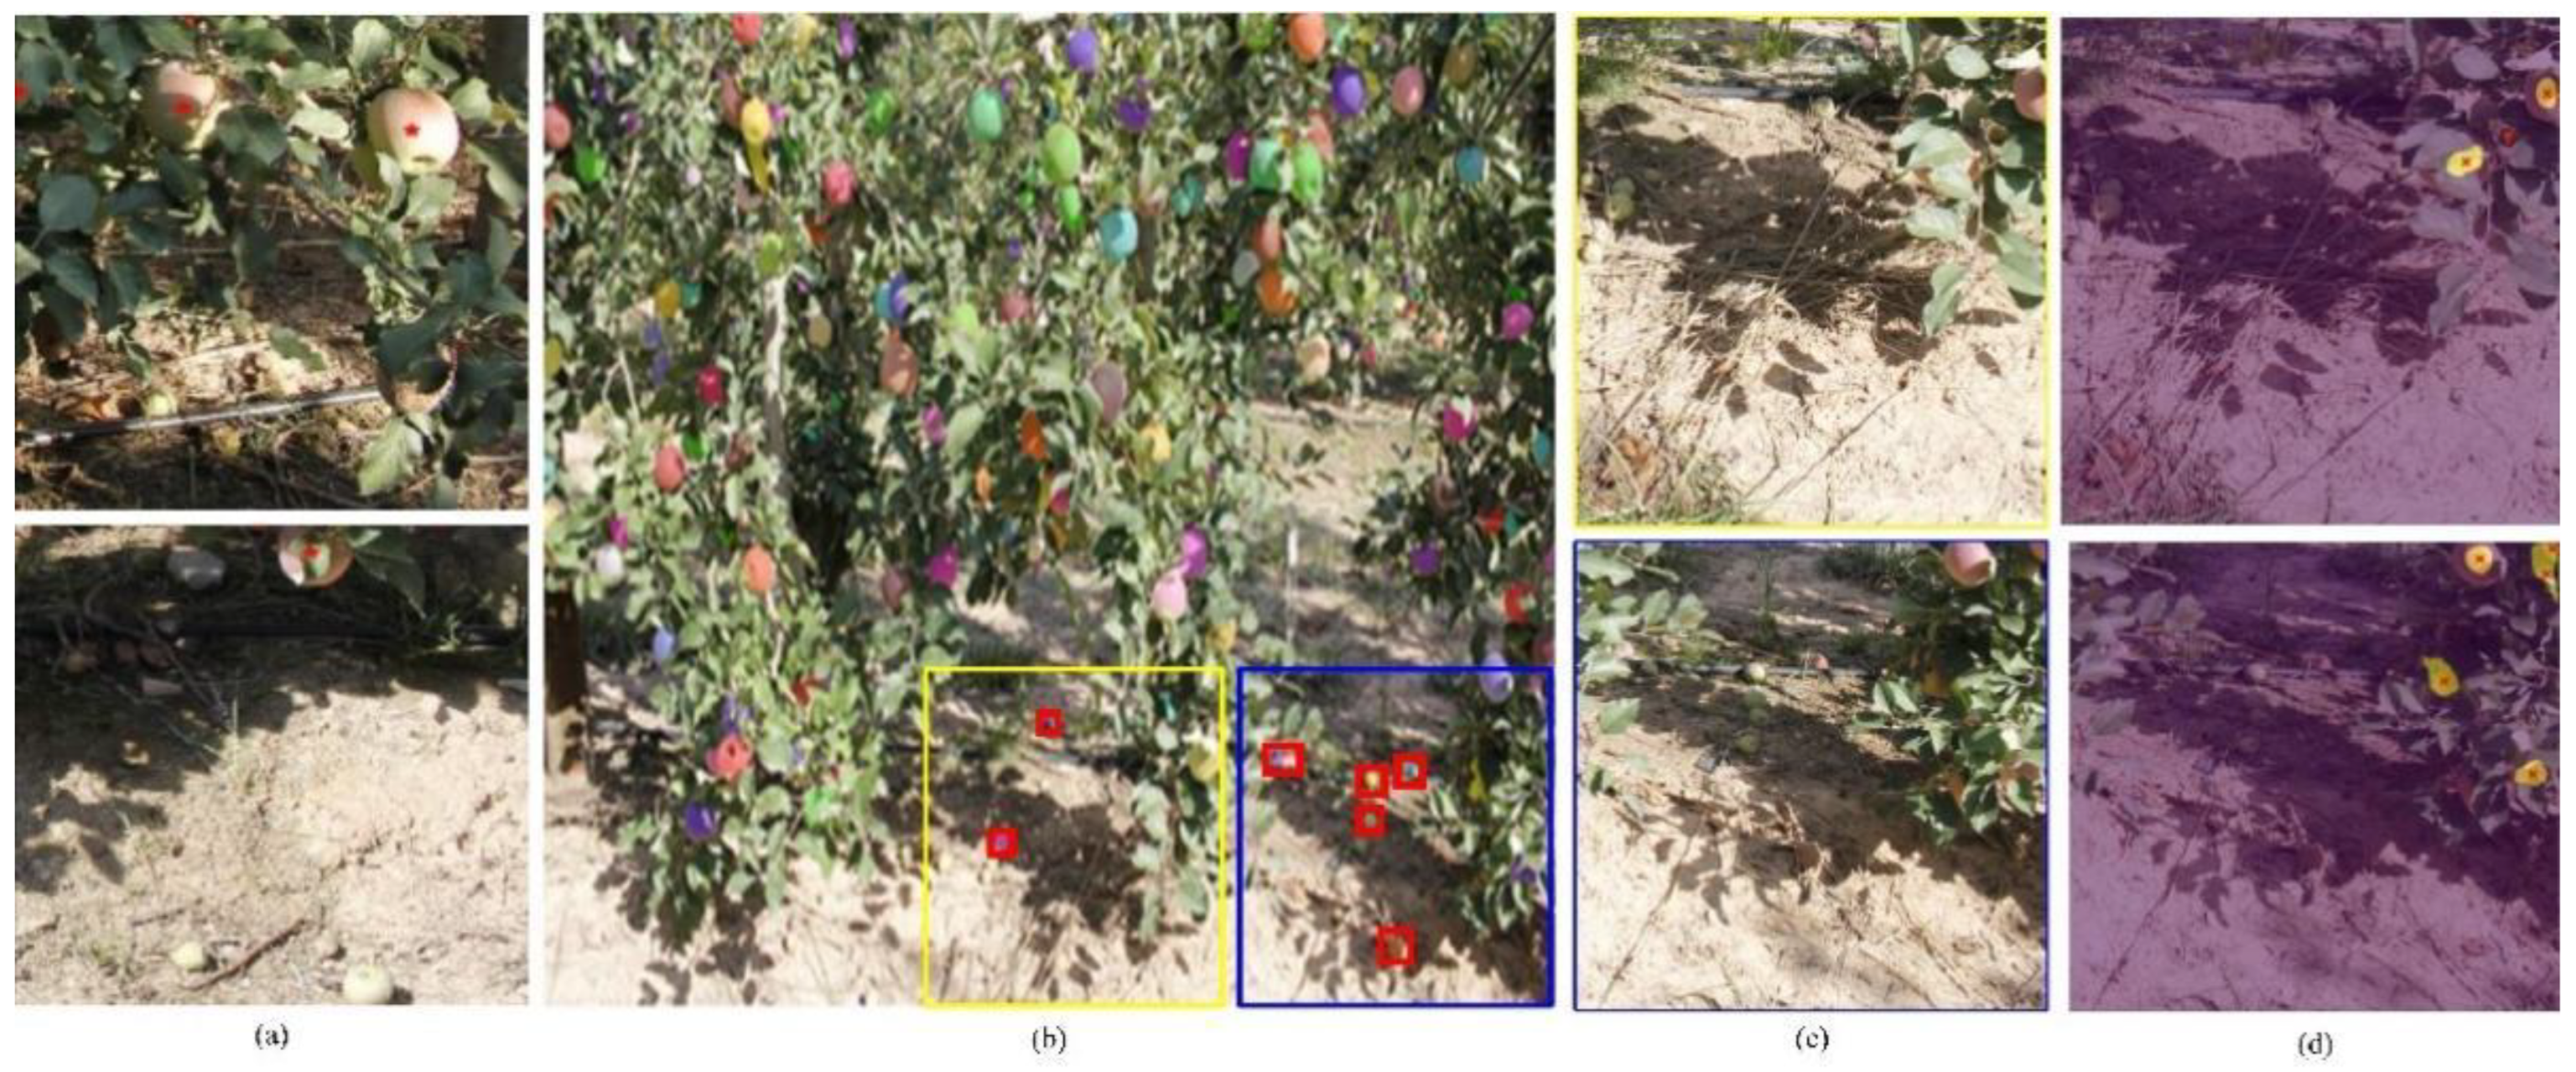
- Apples on the ground: Apples on the ground should not be included in the final yield or regarded as the picking target because they are not fresh. Hence, we provide examples in Figure 4 to show that our method can distinguish fruit on the branches from fruit on the ground. In the training set, apples on the ground were not considered annotation targets. Thus, our method clearly learns this better than Mask-RCNN.
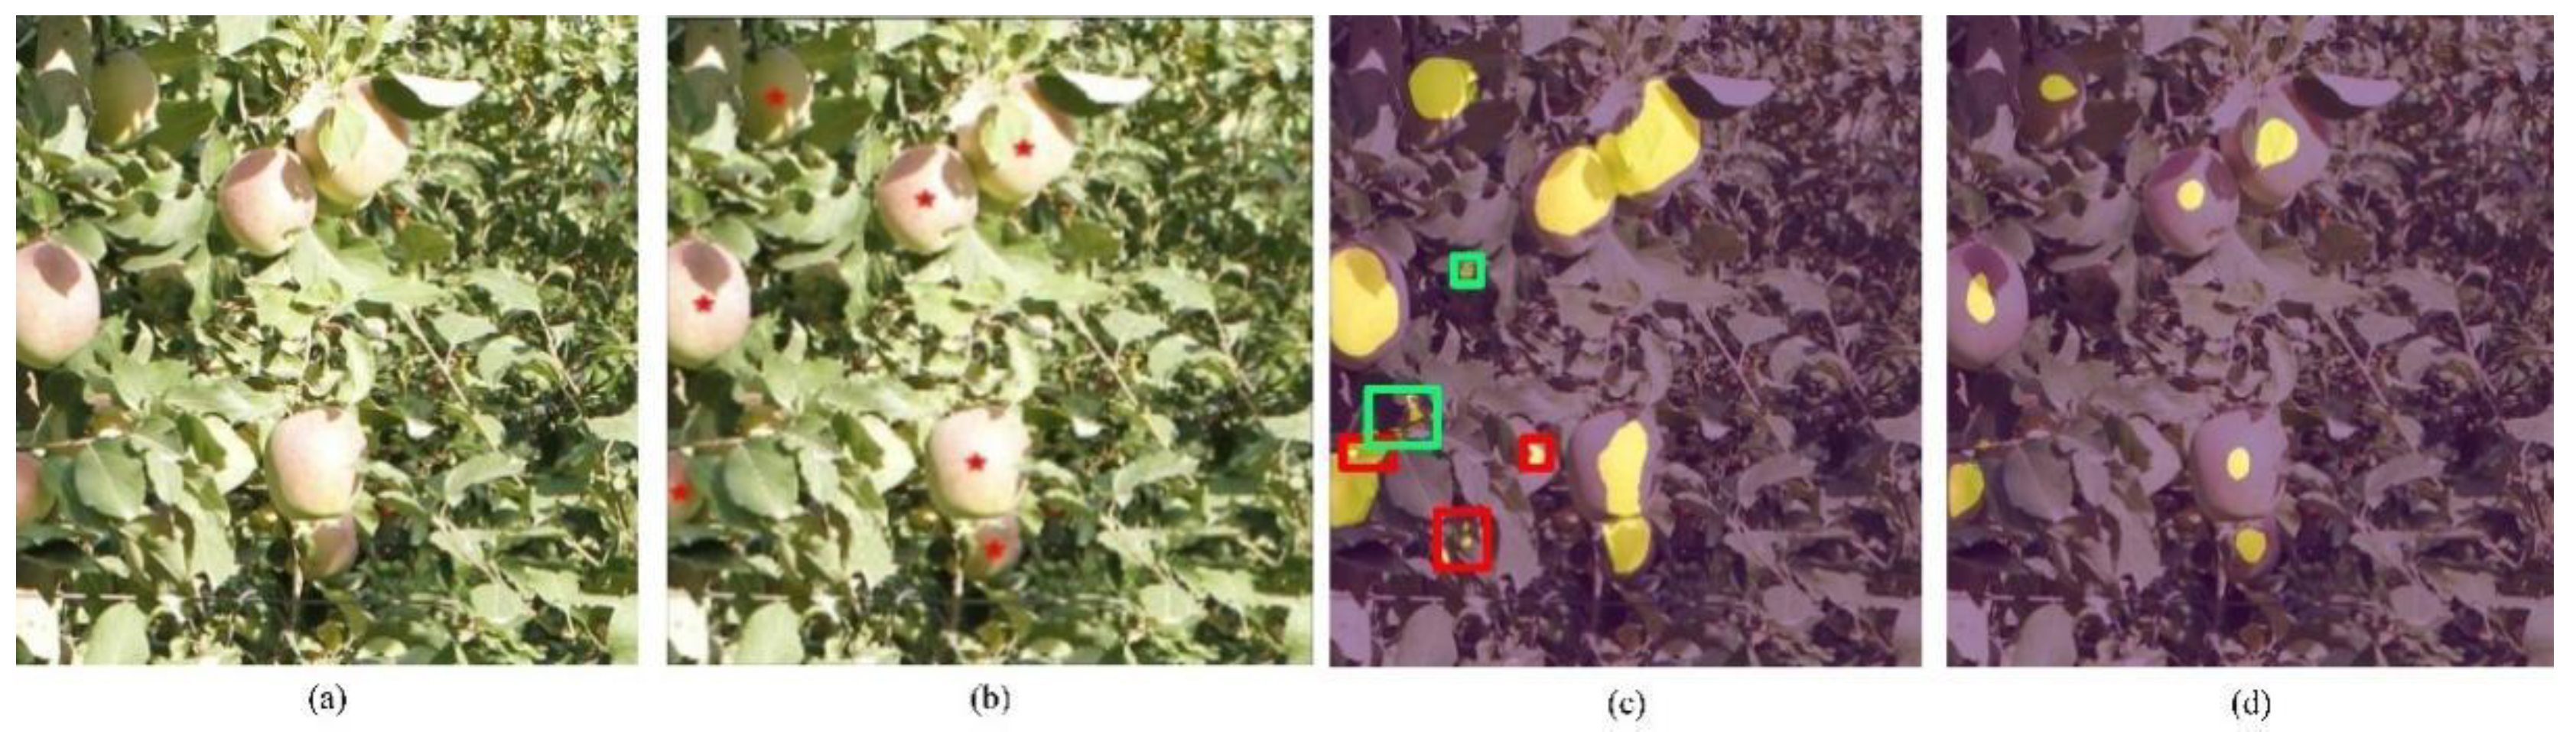
- Learning process: In Figure 5, the heatmap gradually changes as the learning process advances. In the process of focusing on fruit areas, small and broken fruit areas (green boxes) are also ignored along with falsely detected background (red boxes).
- Impact of augmentation operation: The horizontal flipping operation could improve the performance of our method from 86.97% to 87.43% in terms of precision and from 84.88% to 85.32% in terms of recall.
3.4. Discussion of Limitations
Our method cannot distinguish apples with overlapping areas well; overlaps among several apples led to a continuous hot spot in the heatmap. Additionally, while it directly improves upon the difficulty of segmentation, it causes a large offset in the center point positioning. In particular, if one apple occupies a dominant part of the fruit area, other apples are easily ignored. To reduce the impact of the above limitations, we tended to choose models with lower loss so that the hot spot corresponding to the central point will shrink and continuous areas will be interrupted. However, the disadvantage of this choice is that small fruit areas may be ignored, as shown in Figure 5d.
4. Conclusions
In this paper, we presented a point-to-point approach for locating fruit. The framework of our approach consists of two corresponding module selections for fruit location scenarios: (i) For considerable fruit shape changes, DLA-34 was chosen as the backbone of our approach. IDA was used for handling the changes at the coarse level and HDA tackled the changes at the fine level. (ii) A modified loss function based on average Hausdorff distance was chosen to not only predict the number of fruits but also estimate fruit locations. This proposed approach reduces the annotation workload with only a click on the center point of the fruit. Furthermore, the performance of our approach in the detection or positioning of fruit was similar to that of Mask-RCNN on a public dataset. This approach meets the requirements for yield estimation and harvesting, but in the future, an end-to-end central point detection network will be the focus of our research to avoid the time-consuming EM process. Meanwhile, an appropriate combination of augmentation strategies [40] will be adopted to further improve the performance of our approach.
Author Contributions
Conceptualization, B.L.; methodology, C.C.; software, C.C.; validation, C.C.; writing—original draft preparation, C.C.; writing—review and editing, B.L.; funding acquisition, B.L. All authors have read and agreed to the published version of the manuscript.
Funding
This research was funded by the Jiangsu Agricultural Science and Technology Innovation Fund (grant number CX(21)3057) and the National Natural Science Foundation of China (grant number 61503187).
Data Availability Statement
Data are available from the corresponding author on request.
Conflicts of Interest
The authors declare no conflict of interest.
References
- Nuske, S.; Achar, S.; Bates, T.; Narasimhan, S.; Singh, S. Yield estimation in vineyards by visual grape detection. In Proceedings of the International Conference on Intelligent Robots and Systems, Francisco, CA, USA, 25–30 September 2011. [Google Scholar]
- Gongal, A.; Silwal, A.; Amatya, S.; Karkee, M.; Zhang, Q.; Lewis, K. Automated visual yield estimation in vineyards. J. Field Robot. 2014, 31, 837–860. [Google Scholar]
- Wang, Q.; Nuske, S.; Bergerman, M.; Singh, S. Automated crop yield estimation for apple orchards. In Proceedings of the Internation Symposium on Experimental Robotics, Québec City, QC, Canada, 18–21 June 2012. [Google Scholar]
- Linker, R.; Cohen, O.; Naor, A. Determination of the number of green apples in rgb images recorded in orchards. Comput. Electron. Agric. 2012, 81, 45–57. [Google Scholar] [CrossRef]
- Schillaci, G.; Pennisi, A.; Franco, F.; Longo, D. Detecting tomato crops in greenhouses using a vision based method. In Proceedings of the International Conference Ragusa SHWA2012, Ragusa Ibla, Italy, 3–6 September 2012; pp. 252–258. [Google Scholar]
- Yamamoto, K.; Guo, W.; Yoshioka, Y.; Ninomiya, S. On Plant Detection of Intact Tomato Fruits Using Image Analysis and Machine Learning Methods. Sensors 2014, 14, 12191–12206. [Google Scholar] [CrossRef] [PubMed] [Green Version]
- Li, Y.; Cao, Z.; Lu, H.; Xiao, Y.; Zhu, Y.; Cremers, A.B. In-field cotton detection via region-based semantic image segmentation. Comput. Electron. Agric. 2016, 127, 475–486. [Google Scholar] [CrossRef]
- Rahnemoonfar, M.; Sheppard, C. Deep Count: Fruit Counting Based on Deep Simulated Learning. Sensors 2017, 17, 905. [Google Scholar] [CrossRef] [Green Version]
- Chen, Y.; Lee, W.S.; Gan, H.; Peres, N.; Fraisse, C.; Zhang, Y.; He, Y. Strawberry Yield Prediction Based on a Deep Neural Network Using High-Resolution Aerial Orthoimages. Remote Sens. 2019, 11, 1584. [Google Scholar] [CrossRef] [Green Version]
- Ni, X.; Li, C.; Jiang, H.; Takeda, F. Deep learning image segmentation and extraction of blueberry fruit traits associated with harvestability and yield. Hortic. Res. 2020, 7, 110. [Google Scholar] [CrossRef]
- Ilyas, T.; Kim, H. A Deep Learning Based Approach for Strawberry Yield Prediction via Semantic Graphics. In Proceedings of the 21st International Conference on Control, Automation and Systems, Jeju, Korea, 12–15 October 2021. [Google Scholar]
- Bac, C.; Hemming, J.; van Henten, E. Pixel classification and post-processing of plant parts using multispectral images of sweet-pepper. IFAC Proc. Vol. 2013, 46, 150–155. [Google Scholar] [CrossRef] [Green Version]
- Bac, C.; Hemming, J.; van Henten, E. Robust pixelbased classification of obstacles for robotic harvesting of sweet-pepper. Comput. Electron. Agric. 2013, 96, 148–162. [Google Scholar] [CrossRef]
- Van Henten, E.; Van Tuijl, B.; Hemming, J.; Kornet, J.; Bontsema, J.; Van Os, E. Field Test of an Autonomous Cucumber Picking Robot. Biosyst. Eng. 2003, 86, 305–313. [Google Scholar] [CrossRef]
- Kitamura, S.; Oka, K.; Ikutomo, K.; Kimura, Y.; Taniguchi, Y. A distinction method for fruit of sweet pepper using reflection of led light. In Proceedings of the 2008 SICE Annual Conference, Chofu, Japan, 20–22 August 2008; pp. 491–494. [Google Scholar]
- Bulanon, D.; Kataoka, T. Fruit detection system and an end effector for robotic harvesting of fuji apples. Agric. Eng. Int. CIGR 2010, 12, 203–210. [Google Scholar]
- Hemming, J.; Bac, C.; van Tuijl, B.; Barth, R.; Bontsema, J.; Pekkeriet, E.; van Henten, E. A robot for harvesting sweet-pepper in greenhouses. In Proceedings of the International Conference of Agricultural Engineering, Pune, India, 21–23 February 2014. [Google Scholar]
- Nguyen, T.T.; Vandevoorde, K.; Kayacan, E.; Baerdemaeker, J.D.; Saeys, W. Apple detection algorithm for robotic harvesting using a RGB-D camera. In Proceedings of the International Conference of Agricultural Engineering, Pune, India, 21–23 February 2014. [Google Scholar]
- Gongal, A.; Silwal, A.; Amatya, S.; Karkee, M.; Zhang, Q.; Lewis, K. Apple crop-load estimation with over-the-row machine vision system. Comput. Electron. Agric. 2016, 120, 26–35. [Google Scholar] [CrossRef]
- Lehnert, C.; English, A.; McCool, C.; Tow, A.W.; Perez, T. Autonomous Sweet Pepper Harvesting for Protected Cropping Systems. IEEE Robot. Autom. Lett. 2017, 2, 872–879. [Google Scholar] [CrossRef] [Green Version]
- Barth, R.; Hemming, J.; Van Henten, E.J. Angle estimation between plant parts for grasp optimisation in harvest robots. Biosyst. Eng. 2019, 183, 26–46. [Google Scholar] [CrossRef]
- Chen, C.; Li, B.; Liu, J.; Bao, T.; Ren, N. Monocular positioning of sweet peppers: An instance segmentation approach for harvest robots. Biosyst. Eng. 2020, 196, 15–28. [Google Scholar] [CrossRef]
- Mao, S.; Li, Y.; Ma, Y.; Zhang, B.; Zhou, J.; Wang, K. Automatic cucumber recognition algorithm for harvesting robots in the natural environment using deep learning and multi-feature fusion. Comput. Electron. Agric. 2020, 170, 105254. [Google Scholar] [CrossRef]
- Gené-Mola, J.; Sanz-Cortiella, R.; Rosell-Polo, J.R.; Morros, J.-R.; Ruiz-Hidalgo, J.; Vilaplana, V.; Gregorio, E. Fruit detection and 3D location using instance segmentation neural networks and structure-from-motion photogrammetry. Comput. Electron. Agric. 2020, 169, 105165. [Google Scholar] [CrossRef]
- Biffi, L.; Mitishita, E.; Liesenberg, V.; Santos, A.; Gonçalves, D.; Estrabis, N.; Silva, J.; Osco, L.P.; Ramos, A.; Centeno, J.; et al. ATSS Deep Learning-Based Approach to Detect Apple Fruits. Remote Sens. 2020, 13, 54. [Google Scholar] [CrossRef]
- Williams, H.A.; Jones, M.H.; Nejati, M.; Seabright, M.J.; Bell, J.; Penhall, N.D.; Barnett, J.J.; Duke, M.D.; Scarfe, A.J.; Ahn, H.S.; et al. Robotic kiwifruit harvesting using machine vision, convolutional neural networks, and robotic arms. Biosyst. Eng. 2019, 181, 140–156. [Google Scholar] [CrossRef]
- Zhang, S.; Wen, L.; Bian, X.; Lei, Z.; Li, S.Z. Occlusion-aware r-cnn: Detecting pedestrians in a crowd. In Proceedings of the European Conference on Computer Vision, Munich, Germany, 8–14 September 2018. [Google Scholar]
- Zhou, S.; Wang, J.; Meng, D.; Liang, Y.; Gong, Y.; Zheng, N. Discriminative Feature Learning With Foreground Attention for Person Re-Identification. IEEE Trans. Image Process. 2019, 28, 4671–4684. [Google Scholar] [CrossRef] [Green Version]
- Xu, Y.; Xu, D.; Hong, X.; Ouyang, W.; Rongrong, J.; Min, X.; Zhao, G. Structured modeling of joint deep feature and prediction refinement for salient object detection. In Proceedings of the IEEE International Conference on Computer Vision, Seoul, Korea, 27 October–2 November 2019. [Google Scholar]
- Cao, X.; Wang, Z.; Zhao, Y.; Su, F. Scale aggregation network for accurate and effificient crowd counting. In Proceedings of the European Conference on Computer Vision, Munich, Germany, 8–14 September 2018. [Google Scholar]
- Idrees, H.; Tayyab, M.; Athrey, K.; Zhang, D.; Al-Maadeed, S.; Rajpoot, N.; Shah, M. Composition loss for counting, density map estimation and localization in dense crowds. In Proceedings of the European Conference on Computer Vision, Munich, Germany, 8–14 September 2018. [Google Scholar]
- Ranjan, V.; Le, H.; Hoai, M. Iterative crowd counting. In Proceedings of the European Conference on Computer Vision, Munich, Germany, 8–14 September 2018. [Google Scholar]
- Ma, Z.; Wei, X.; Hong, X.; Gong, Y. Bayesian loss for crowd count estimation with point supervision. In Proceedings of the IEEE Conference on Computer Vision and Pattern Recognition, Long Beach, CA, USA, 16–20 June 2019; pp. 6142–6151. [Google Scholar]
- Moon, T.K. The expectation-maximization algorithm. IEEE Signal Process. Mag. 1996, 13, 47–60. [Google Scholar] [CrossRef]
- Simonyan, K.; Zisserman, A. Very deep convolutional networks for large-scale image recognition. arXiv 2014, arXiv:1409.1556. [Google Scholar]
- He, K.; Zhang, X.; Ren, S.; Sun, J. Deep residual learning for image recognition. In Proceedings of the IEEE Conference on Computer Vision and Pattern Recognition, Las Vegas, NV, USA, 27–30 June 2016; pp. 770–778. [Google Scholar]
- Yu, F.; Wang, D.; Shelhamer, E.; Darrell, T. Deep layer aggregation. In Proceedings of the IEEE conference on computer vision and pattern recognition, Salt Lake City, UT, USA, 18–22 June 2018; pp. 2403–2412. [Google Scholar]
- Huang, G.; Liu, Z.; Van Der Maaten, L.; Weinberger, K.Q. Densely connected convolutional networks. In Proceedings of the IEEE conference on computer vision and pattern recognition, Honolulu, HI, USA, 21–26 June 2017; pp. 4700–4708. [Google Scholar]
- Javier, R.; GÜera, D.; Chen, Y.; Delp, E.J. Locating objects without bounding boxes. In Proceedings of the IEEE conference on computer vision and pattern recognition, Long Beach, CA, USA, 16–17 June 2019. [Google Scholar]
- Ilyas, T.; Jin, H.; Siddique, M.; Lee, S.; Kim, H.; Chua, L. A deep learning-based paprika plant disease and pest phenotyping system with disease severity analysis. Front. Plant Sci. 2022, 13, 3862. [Google Scholar] [CrossRef] [PubMed]
Figure 1.
Illustration of ground truth processing. Top is a visualization of the annotation result, where the stars represent the marked center points of fruit. And bottom is the record for this annotation; its header is composed of the record number, the file name of the raw RGB image, the fruit count in each image and the center point coordinates of the fruits.

Figure 2.
Flowchart of the two-phase positioning approach. In the first phase, network inference is realized on the apples to produce a binary segmentation graph and estimate the number of apples. In the second phase, based on the binary segmentation graph, the apple pixels are modeled by a Gaussian mixture model to obtain their center points.

Figure 3.
Six pictures are chosen from the public database for illustration, which are listed from (a–f). From left to right per line, the ground truth and the outcomes of Mask-RCNN and our method, respectively, are shown. False positives due to network failures (red rectangles), false positives due to misannotated apples (green rectangles), false positives due to multi-detection (blue rectangles) and false negatives (yellow rectangles) are also shown.

Figure 4.
Performance for apples on the ground. (a) In images from the training set, apples on the ground were not labeled as targets in the annotation. (b) Outcome of Mask-RCNN: two areas were not handled well—one framed in yellow, the other framed in blue. The apples on the ground were detected and are labeled by red boxes. (c) Greater detail on the two areas not handled well by Mask-RCNN. (d) Results of our method on these two areas.

Figure 5.
Learning process. (a) Raw image. (b) Ground truth. (c) Heatmap of the earlier learning stage. Red boxes are false detections due to network failures and green boxes are false positives due to misannotated apples. (d) Heatmap of the later learning stage.
Figure 5.
Learning process. (a) Raw image. (b) Ground truth. (c) Heatmap of the earlier learning stage. Red boxes are false detections due to network failures and green boxes are false positives due to misannotated apples. (d) Heatmap of the later learning stage.


Table 1.
Comparison of detection performance between Mask-RCNN and our algorithm with the testing dataset.
Table 1.
Comparison of detection performance between Mask-RCNN and our algorithm with the testing dataset.
| Algorithm | Precision (P) | Recall (R) | F1-Score (F1) |
|---|---|---|---|
| Mask-RCNN 1 | 85.97% | 85.69% | 85.83% |
| Our method 2 | 87.43% | 85.32% | 86.36% |
1 If the IoU is over 50%, the fruit is detected. The confidence level is 0.9, which leads to the best performance in detection. 2 . Speed of detection could reach 34 FPS.
Table 2.
Comparison of positioning performance between Mask-RCNN and our algorithm with the testing dataset.
Table 2.
Comparison of positioning performance between Mask-RCNN and our algorithm with the testing dataset.
| Algorithm | r 1 | MAE | RMSE | MAPE |
|---|---|---|---|---|
| Mask-RCNN | 1 | 2.9 | 3.0 | 27.5% |
| 5 | 1.8 | 2.5 | 17.7% | |
| 10 | 1.4 | 1.5 | 13.2% | |
| Our method 2 | 1 | 4.0 | 4.1 | 37.7% |
| 5 | 1.9 | 3.8 | 18.4% | |
| 10 | 1.4 | 1.5 | 13.2% |
1 r is in pixels. A higher r value indicates greater ease in locating an object. 2 Speed on position could reach 7 FPS.
Publisher’s Note: MDPI stays neutral with regard to jurisdictional claims in published maps and institutional affiliations. |
© 2022 by the authors. Licensee MDPI, Basel, Switzerland. This article is an open access article distributed under the terms and conditions of the Creative Commons Attribution (CC BY) license (https://creativecommons.org/licenses/by/4.0/).
Share and Cite
MDPI and ACS Style
Li, B.; Chen, C. Location of Fruits by Counting: A Point-to-Point Approach. Agronomy 2022, 12, 2863. https://0-doi-org.brum.beds.ac.uk/10.3390/agronomy12112863
AMA Style
Li B, Chen C. Location of Fruits by Counting: A Point-to-Point Approach. Agronomy. 2022; 12(11):2863. https://0-doi-org.brum.beds.ac.uk/10.3390/agronomy12112863
Chicago/Turabian StyleLi, Bo, and Cheng Chen. 2022. "Location of Fruits by Counting: A Point-to-Point Approach" Agronomy 12, no. 11: 2863. https://0-doi-org.brum.beds.ac.uk/10.3390/agronomy12112863
Note that from the first issue of 2016, this journal uses article numbers instead of page numbers. See further details here.