
Border Effect on Ratoon Crop Yield in a Mechanized Rice Ratooning System

1
Rice Research Institute, Anhui Academy of Agricultural Sciences, Hefei 230031, China
2
College of Plant Science and Technology, Huazhong Agricultural University, Wuhan 430070, China
3
Chizhou Institute of Agricultural Sciences, Chizhou 247000, China
*
Author to whom correspondence should be addressed.
Agronomy 2022, 12(2), 262; https://0-doi-org.brum.beds.ac.uk/10.3390/agronomy12020262
Submission received: 6 January 2022
/
Revised: 18 January 2022
/
Accepted: 19 January 2022
/
Published: 20 January 2022
(This article belongs to the Special Issue Crop Yield and Quality Response to Cultivation Practices)
Abstract
:Yield loss of ratoon crops caused by the rolling damage to the left stubble from mechanically harvesting main crops has been reported in previous studies. However, limited attention has been paid to identify the effect of the mechanical harvesting of the main crop on the yield of a non-rolled zone (NRZ) of a ratoon crop. A two-year field experiment on ratoon rice with two harvest methods (mechanical harvesting: MEH; manual harvesting: MAH) of a main crop was conducted to identify whether there is a border effect on the yield of the NRZ, and to evaluate whether the border effect will compensate for the yield loss of the ratoon crop. On average, MEH reduced the grain yield of the ratoon crop by 17.6% compared with MAH. The yield of the rolled zone (RZ) in MEH was 66.1–70.3% lower than that of MAH, which was attributed to the lower panicle m−2, grain filling percentage, total dry weight, and harvest index. In contrast, the yield of the NRZ in MEH was 2.7–10.8% higher than that of MAH. The yield differences of the non-rolled single row (R1), side row (R2), and middle row (R3) in the NRZ compared with MAH were 22.9%, 8.5%, and −10.1%, respectively, which were mainly explained by the panicle m−2, spikelets m−2, total dry weight, and regeneration rate. These results suggest that rolling during the mechanical harvesting of the main crop induced a border effect on the yield of the NRZ, which reduced the yield loss of the ratoon crop. The yield gain of the NRZ was attributed to the increased yield of R1 and R2 rather than R3.
1. Introduction
Rice is the staple food for more than 65% of the population in China [1]. As the largest producer and consumer of rice worldwide, China has many rice cropping systems, with each presenting a suitable planting area [2]. Middle-season rice (MR) and double-season rice (DR) are the dominant rice systems in the middle and lower reaches of the Yangtze River [3]. In recent decades, the DR in this region has progressively shifted to MR due to labor shortages, increased production costs, and low economic profits, resulting in a serious reduction in the planting area of DR [4,5]. Although MR has many advantages compared with DR, it produces a lower annual yield than DR [5]. If the transition from DR to MR continues, it will inevitably reduce total rice production in China. To guarantee the safe production of rice, there is an urgent need to identify an alternative rice system that can increase productivity and profitability while reducing labor costs and environmental impacts.
Ratoon rice is the practice of harvesting a first crop (main crop) and further obtaining a second crop (ratoon crop) sprouting from the stem nodes on the rice stubble left behind after the first crop’s harvest [6]. Previous studies have shown that ratoon rice has demonstrated lower production costs, lower global warming potential (GWP), and higher economic profit than DR and produced higher annual yields and economic profits and lower yield-scaled GWP than MR [5,7]. Recently, ratoon rice has become a popular cropping system in the middle and lower reaches of the Yangtze River, such as Hubei and Anhui provinces, due to the improvement of new rice cultivars with a high regeneration ability and the development of crop management and mechanical harvesting techniques [8]. The total planting area of ratoon rice in China in 2020 was over 1.24 million hectares [9]. A mechanized ratoon rice system is considered an alternative cropping system that can meet production, economic, and environmental goals [5,10]. However, rolling damage to stubble during mechanical harvesting of the main crop often leads to serious yield losses of ratoon crops, which severely limits the further extension of the mechanized ratoon rice system [11,12]. Xiao [13] reported that the mechanical harvesting of the main crop resulted in an 18.7–20.1% yield loss in the ratoon crop compared with manual harvesting. Yield loss may be further increased in the case of inappropriate water management or rainy weather before harvesting the main crop [12,14]. Hence, a full understanding of the population structure and yield components of mechanically-harvested ratooning crops may provide technical support for reducing yield loss.
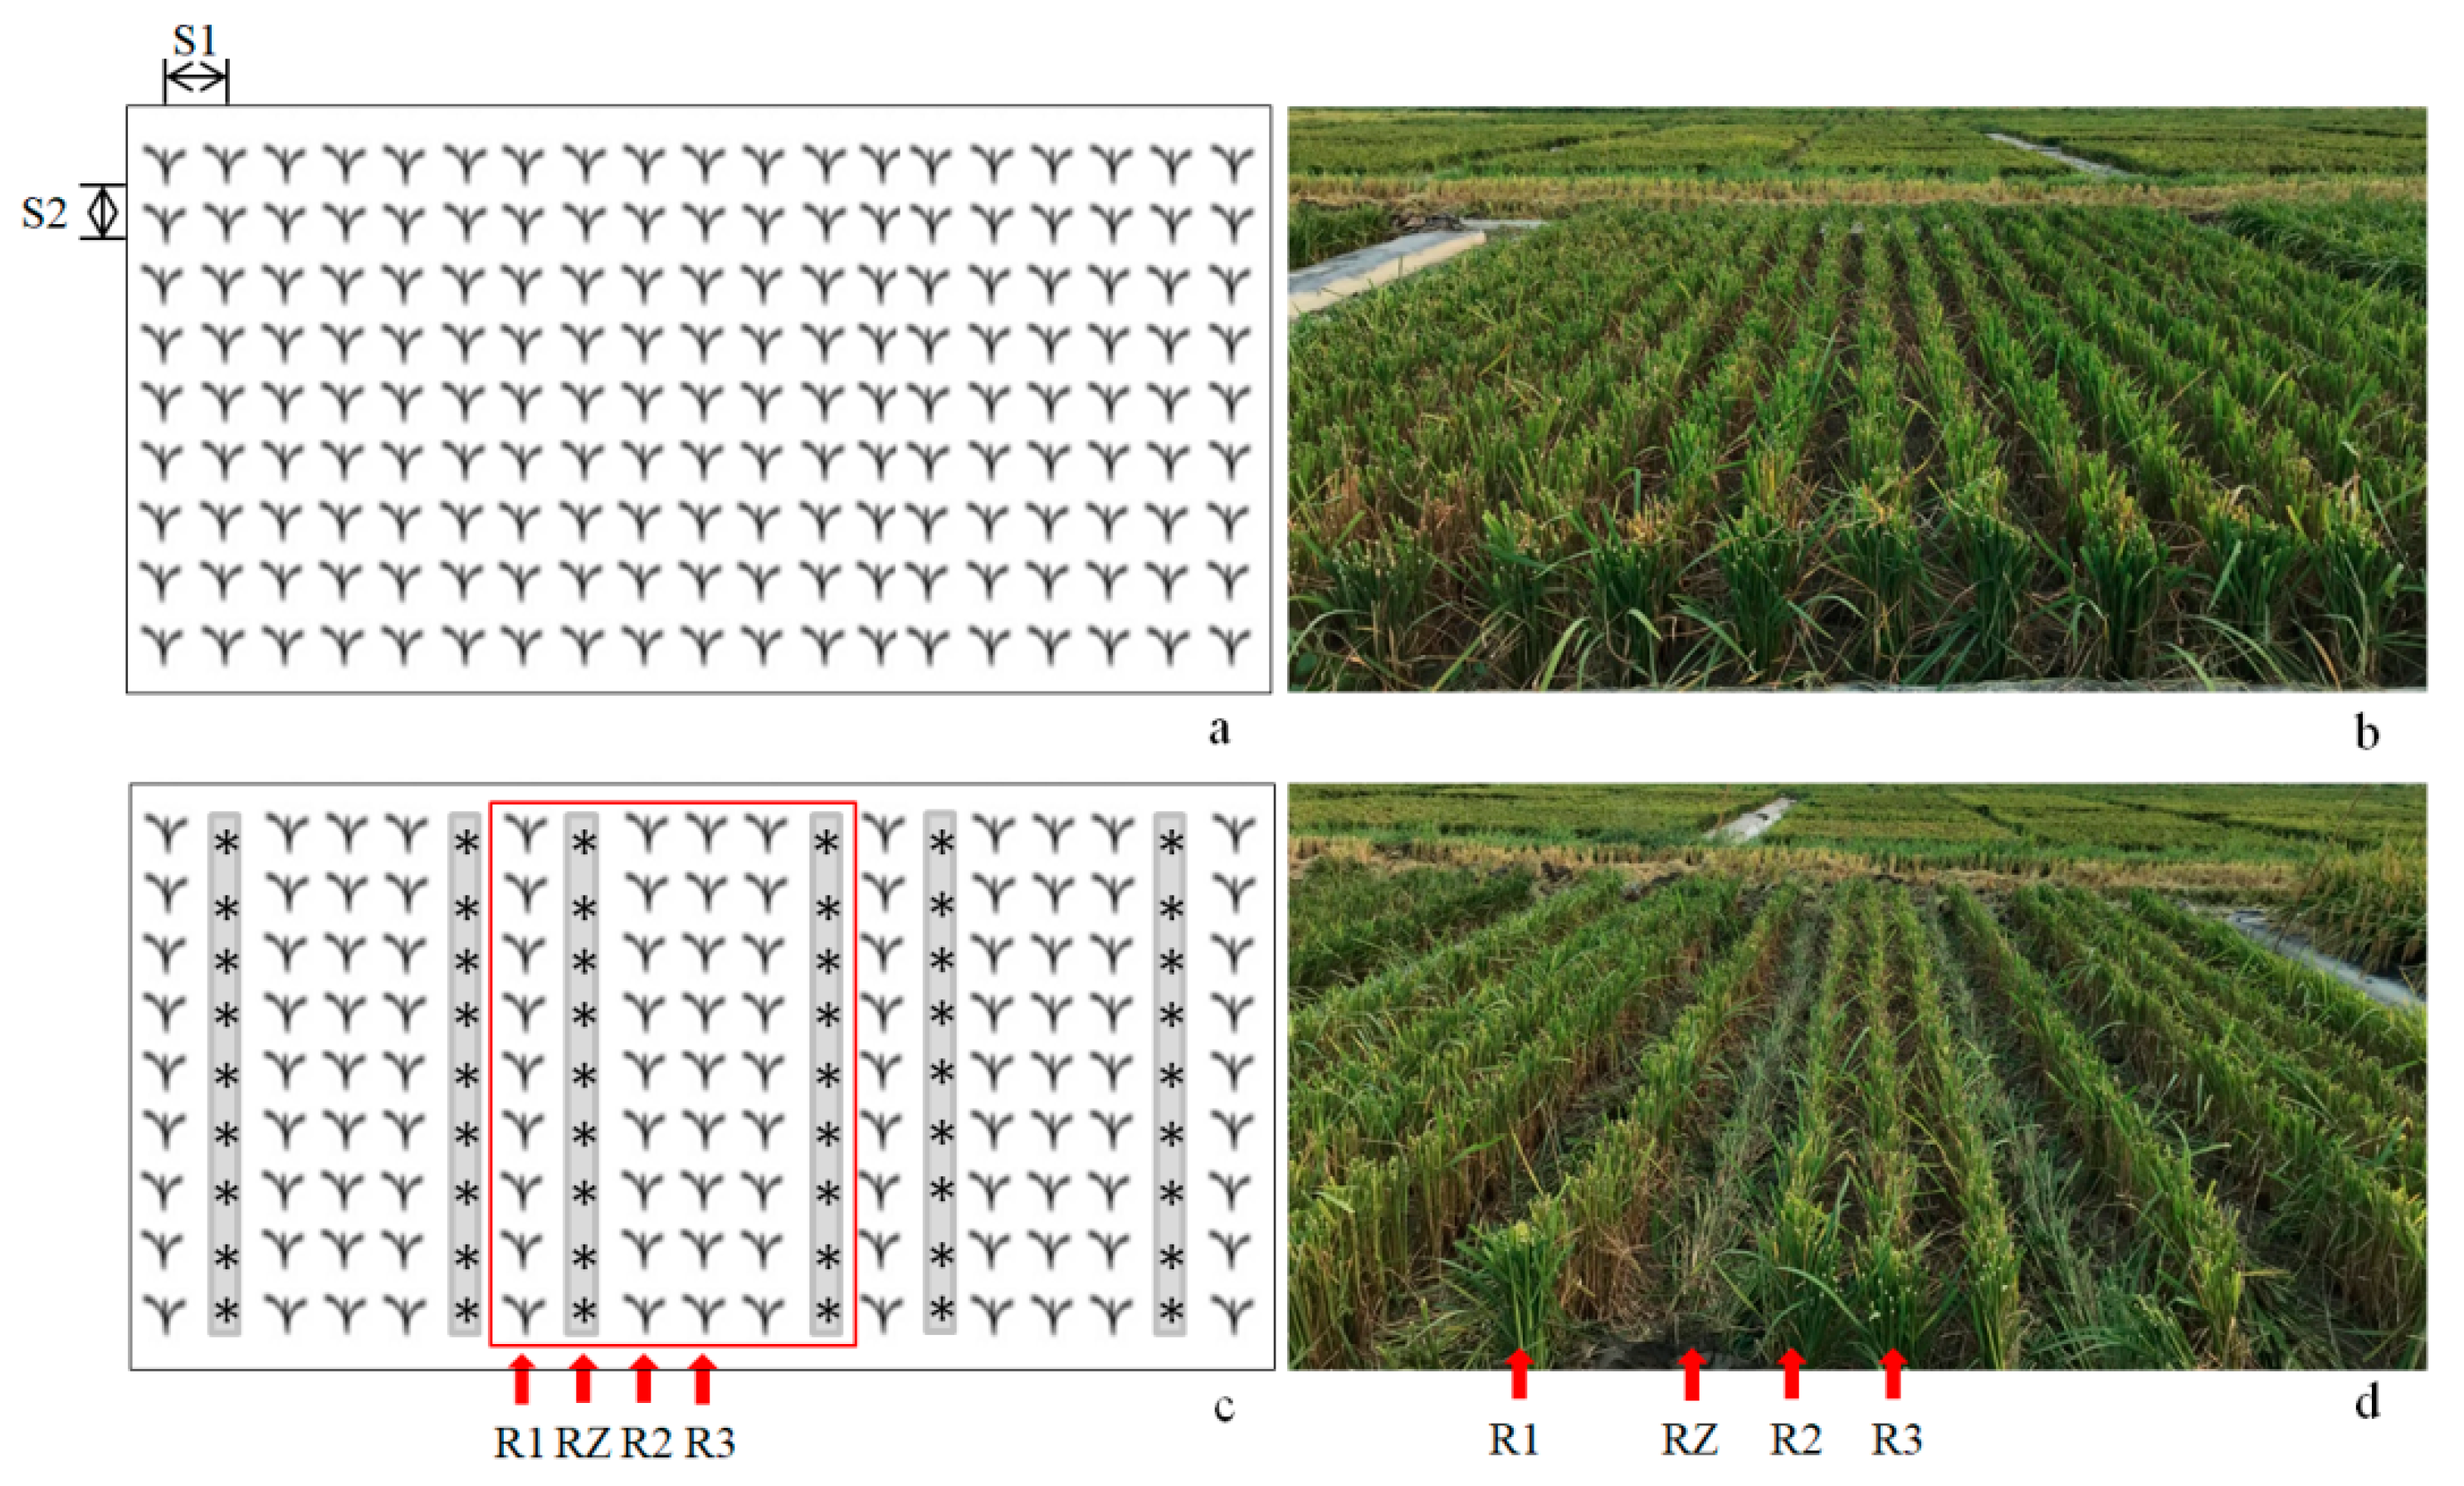
To our knowledge, rolling during the mechanical harvesting of a main crop changes the population structure of the ratoon crop, forming a rolled zone (RZ) and non-rolled zone (NRZ), in which the NRZ includes non-rolled single row (R1), non-rolled side row (R2), and non-rolled middle row (R3), with each row experiencing different lighting and ventilation conditions (Figure 1). Previous studies on rice have shown that border rows have a significant yield advantage, namely, the so-called border effect, due to more solar energy, better ventilation, and less nutrient competition than center rows [15]. Hence, we hypothesized that rolling during mechanical harvesting of the main crop induces a border effect on the yield of the NRZ, which may compensate for the yield loss of the ratoon crop caused by mechanical rolling to a certain degree. To test this hypothesis, a two-year filed experiment with two harvest methods (mechanical harvesting: MEH; manual harvesting: MAH) of the main crop and two cultivars (Fengliangyouxiang 1: FLYX1, Quanliangyou 2118: QLY2118) was conducted to evaluate differences in the yield and yield attributes of a ratoon crop among RZ, NRZ, and MAH.
2. Materials and Methods
The field experiment for ratoon rice was conducted in a farmer’s field at Meicun Township, Chizhou County, Anhui Province, China (30°36′ N, 117°43′ E) in 2019 and repeated in the same field in 2020. Soil samples from the upper 20-cm layer were collected for the analysis of properties before the rice was transplanted in the first year. The soil had a clay loam texture with a pH of 5.6, organic matter of 31.6 g kg−1, total N of 2.15 g kg−1, available P of 30.9 mg kg−1, and available K of 162.5 mg kg−1.
Experiments were arranged in a split-plot design with harvest methods of the main crop as the main plots and the cultivars as the subplots with four replications. The subplot was 48 m2 (6 × 8 m). The two harvest methods of the main crop were MEH and MAH. For the MEH treatment, the harvest machine went straight along the plot rows and turned around into the trackways (400 cm wide) located outside the plots. The harvest machine was a combined machine (WORLD-DR4LZ-4.0E, WORLD GROUP, Danyang, Jiangsu, China) commonly used in the study region, with a cutting width of 200 cm, a track width of 45 cm, and a track-to-track distance of 70 cm (measured between the insides of two tracks). According to farmers’ practices, seven rows of the main crop were cut by the harvest machine in one run, and one of them was cut again in the next run. Therefore, six rows were considered as a harvest unit, which included two rolled rows, one non-rolled single row, two non-rolled side rows, and one non-rolled middle row (Figure 1). The stubble height in both the MEH and MAH was approximately 40 cm above ground. Two widely-grown two-line indica hybrid rice cultivars in Anhui Province, FLYX1 and QLY2118, were used as experimental materials. FLYX1 was developed in 2006 with Guangzhan63s as the female parent and Fengxianghui 1 as the male parent (CRDC, 2021). QLY2118 was developed in 2018 with Quan211S as the female parent and YR0822 as the male parent. When these two cultivars were grown as middle-season rice in Anhui Province, the plant heights of FLYX1 and QLY2118 were 120 cm and 118 cm, respectively, and the growth duration were 135 and 136 days, respectively.
Pre-germinated seeds were sown into seedbeds on 23 March 2019 and 25 March 2020. Seedbeds were covered with transparent plastic film to protect seedlings from the low temperature. The seedlings were transplanted into the paddy field on 28 April 2019 and 29 April 2020 at a spacing of 30.0 × 13.3 cm with two seedlings per hill. In both years, a main crop fertilizer dose of 180:40:75 of N:P:K kg ha−1 was applied to all treatments. All of the P and K and 50% of the N were applied at the basal stage (1 day before transplanting), while 20% and 30% of the N were top-dressed at the early tillering (7 days after transplanting) and panicle initiation stages, respectively. For the ratoon crop, a fertilizer dose of 150:75 of N:K kg ha−1 was applied to all treatments. All of the K and 50% of the N were applied as a bud-promoting fertilizer 15 days after heading the main crop, while the other 50% of the N was applied as a tiller-promoting fertilizer 3 days after harvest of the main crop. The sources of N, P, and K fertilizers were urea, calcium superphosphate, and potassium chloride, respectively. During the main season, the field was flooded after transplanting, and a floodwater depth of 3–5 cm was maintained until 10 days before maturity except that the water was drained at a maximum tillering stage to reduce unproductive tillers. The plants were re-watered immediately to obtain a water depth of 1–2 cm after harvest of the main crop. Then, a water depth of 3–5 cm was maintained until heading of the ratoon crop, and alternate wetting and drying irrigation was used from heading to maturity of the ratoon crop. Weeds, pests, and diseases were intensively controlled to avoid yield loss.
At the maturity of the ratoon crop, 12 hills were sampled from each plot of MAH. For the ratoon crop of MEH, 12 hills in the RZ, R1, R2, and R3 were sampled separately from each plot. After recording the number of panicles, the plant samples were separated into leaves, stems (culm plus sheath), panicles, and stubbles. The dry weights of the leaves, stems, and stubbles were determined after oven drying at 80 °C to a constant weight. The yield components, aboveground total dry weight, and harvest index were determined according to Zhou et al. [16]. The regeneration rate was calculated as the ratio of “the number of panicles in the ratoon crop” to “the number of panicles in the main crop”.
For the ratoon crop of MAH, the grain yield was determined from a 4.79 m2 area (10 × 12 = 120 hills) in the center of each plot. For the ratoon crop of MEH, 50 hills in the NRZ, R1, R2, and R3 were sampled separately from the center of each plot to determine their respective grain yields. The grain yields were adjusted to a 14% moisture content. The grain moisture content was determined by a digital moisture tester (PM-8188A, Kett Electric Laboratory, Japan). The yields of the NRZ and MEH were calculated as follows:
YNRZ = 1/4 × YR1 + 1/2 × YR2 + 1/4 × YR3.
YMEH = 1/3 × YRZ + 1/6 × YR1 + 1/3 × YR2 + 1/6 × YR3.
The border effect was calculated as follow:
where YA represents the grain yield of the NRZ, R1, R2, or R3, and YMAH represents the grain yield of the ratoon crop in MAH.
Border effect (%) = (YA − YMAH)/YMAH × 100
Climate parameters, including the daily minimum/maximum temperatures and solar radiation, were obtained from a weather station located near the experimental site.
Statistical data analysis was performed using analysis of variance (Statistix 9.0, Analytical software, Tallahassee, FL, USA), and the means of the treatments were compared based on the least significant difference (LSD) test at the 0.05 probability level.
3. Results
3.1. Weather Conditions
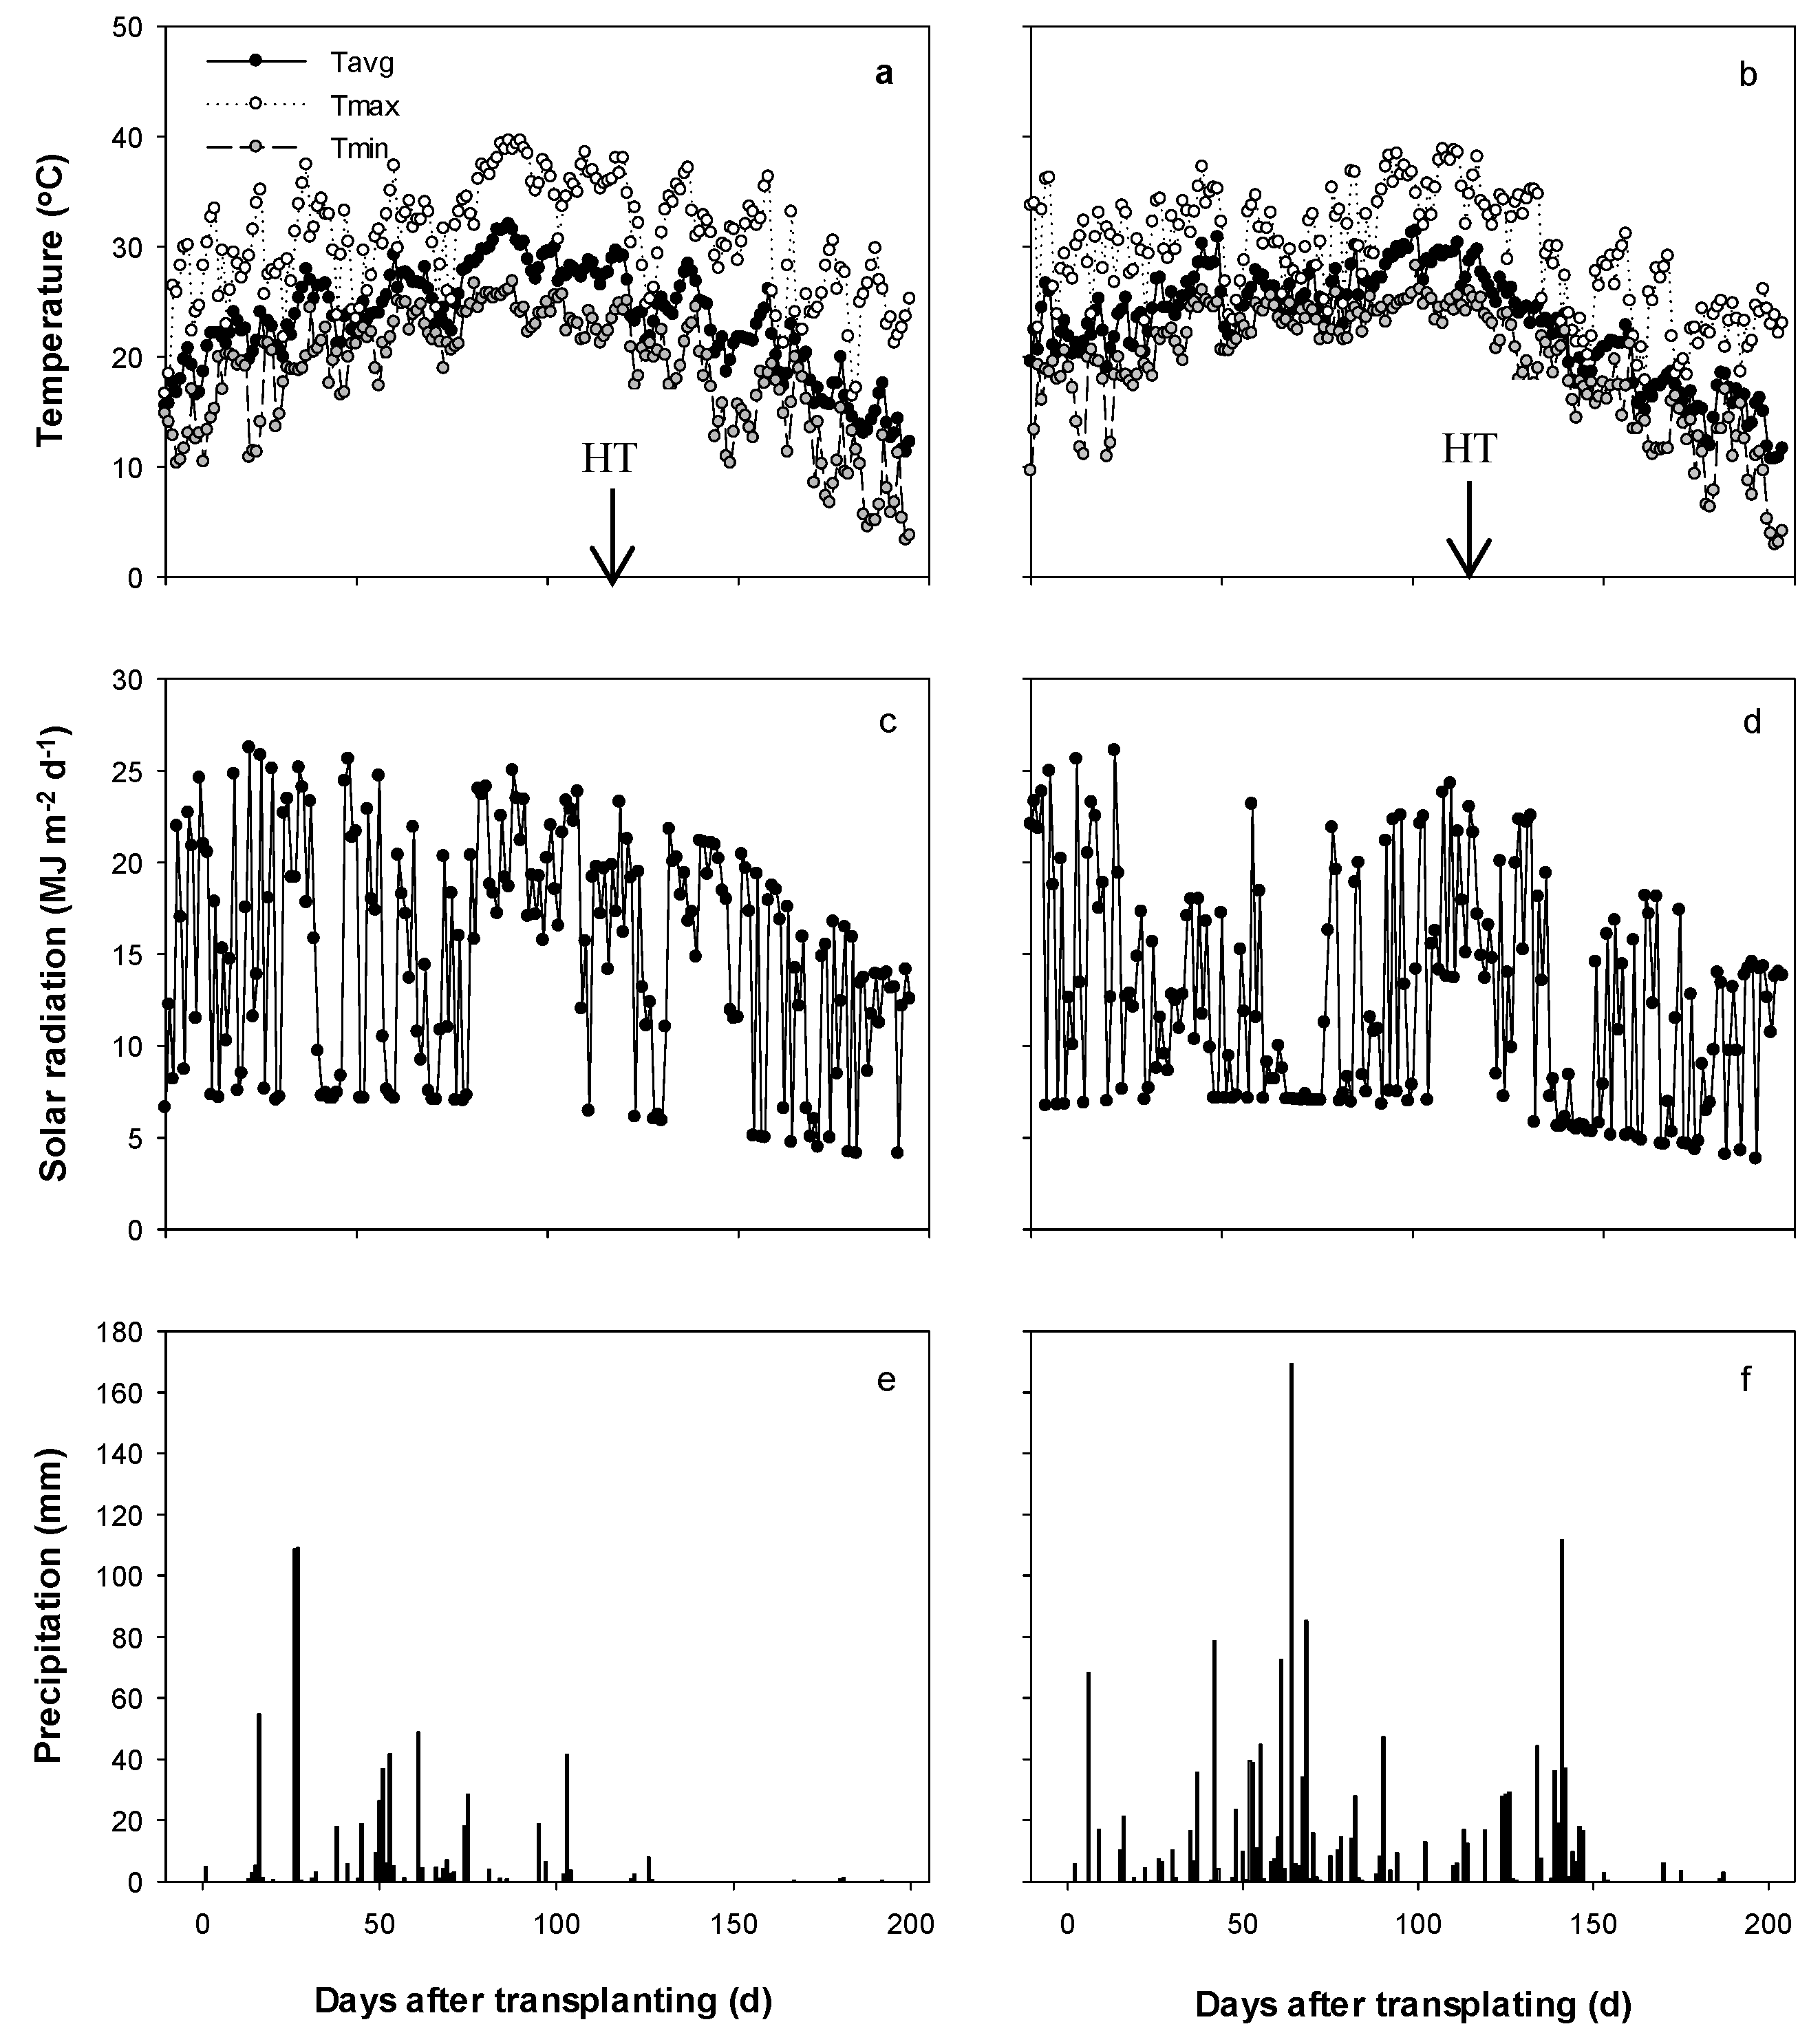
The daily minimum temperature, maximum temperature, and mean temperature showed increasing trends during the main season but decreasing trends during the ratoon season in both years (Figure 2). For the main season, the average daily mean temperature was similar between the two years, but the average daily solar radiation decreased by 19.1% and the total precipitation increased by 59.5% in 2020 compared with 2019 (Table 1). For the ratoon season, the average daily mean temperature and daily solar radiation in 2020 decreased by 1.0 °C and 2.6 megajoule m−2 day−1 (18.7%), respectively compared with 2019. The total precipitation for the ratoon season was 459.5 mm in 2020, which was 444.6 mm higher than that in 2019.
3.2. Effects of Harvest Method of the Main Crop on Yield of the Ratoon Crop
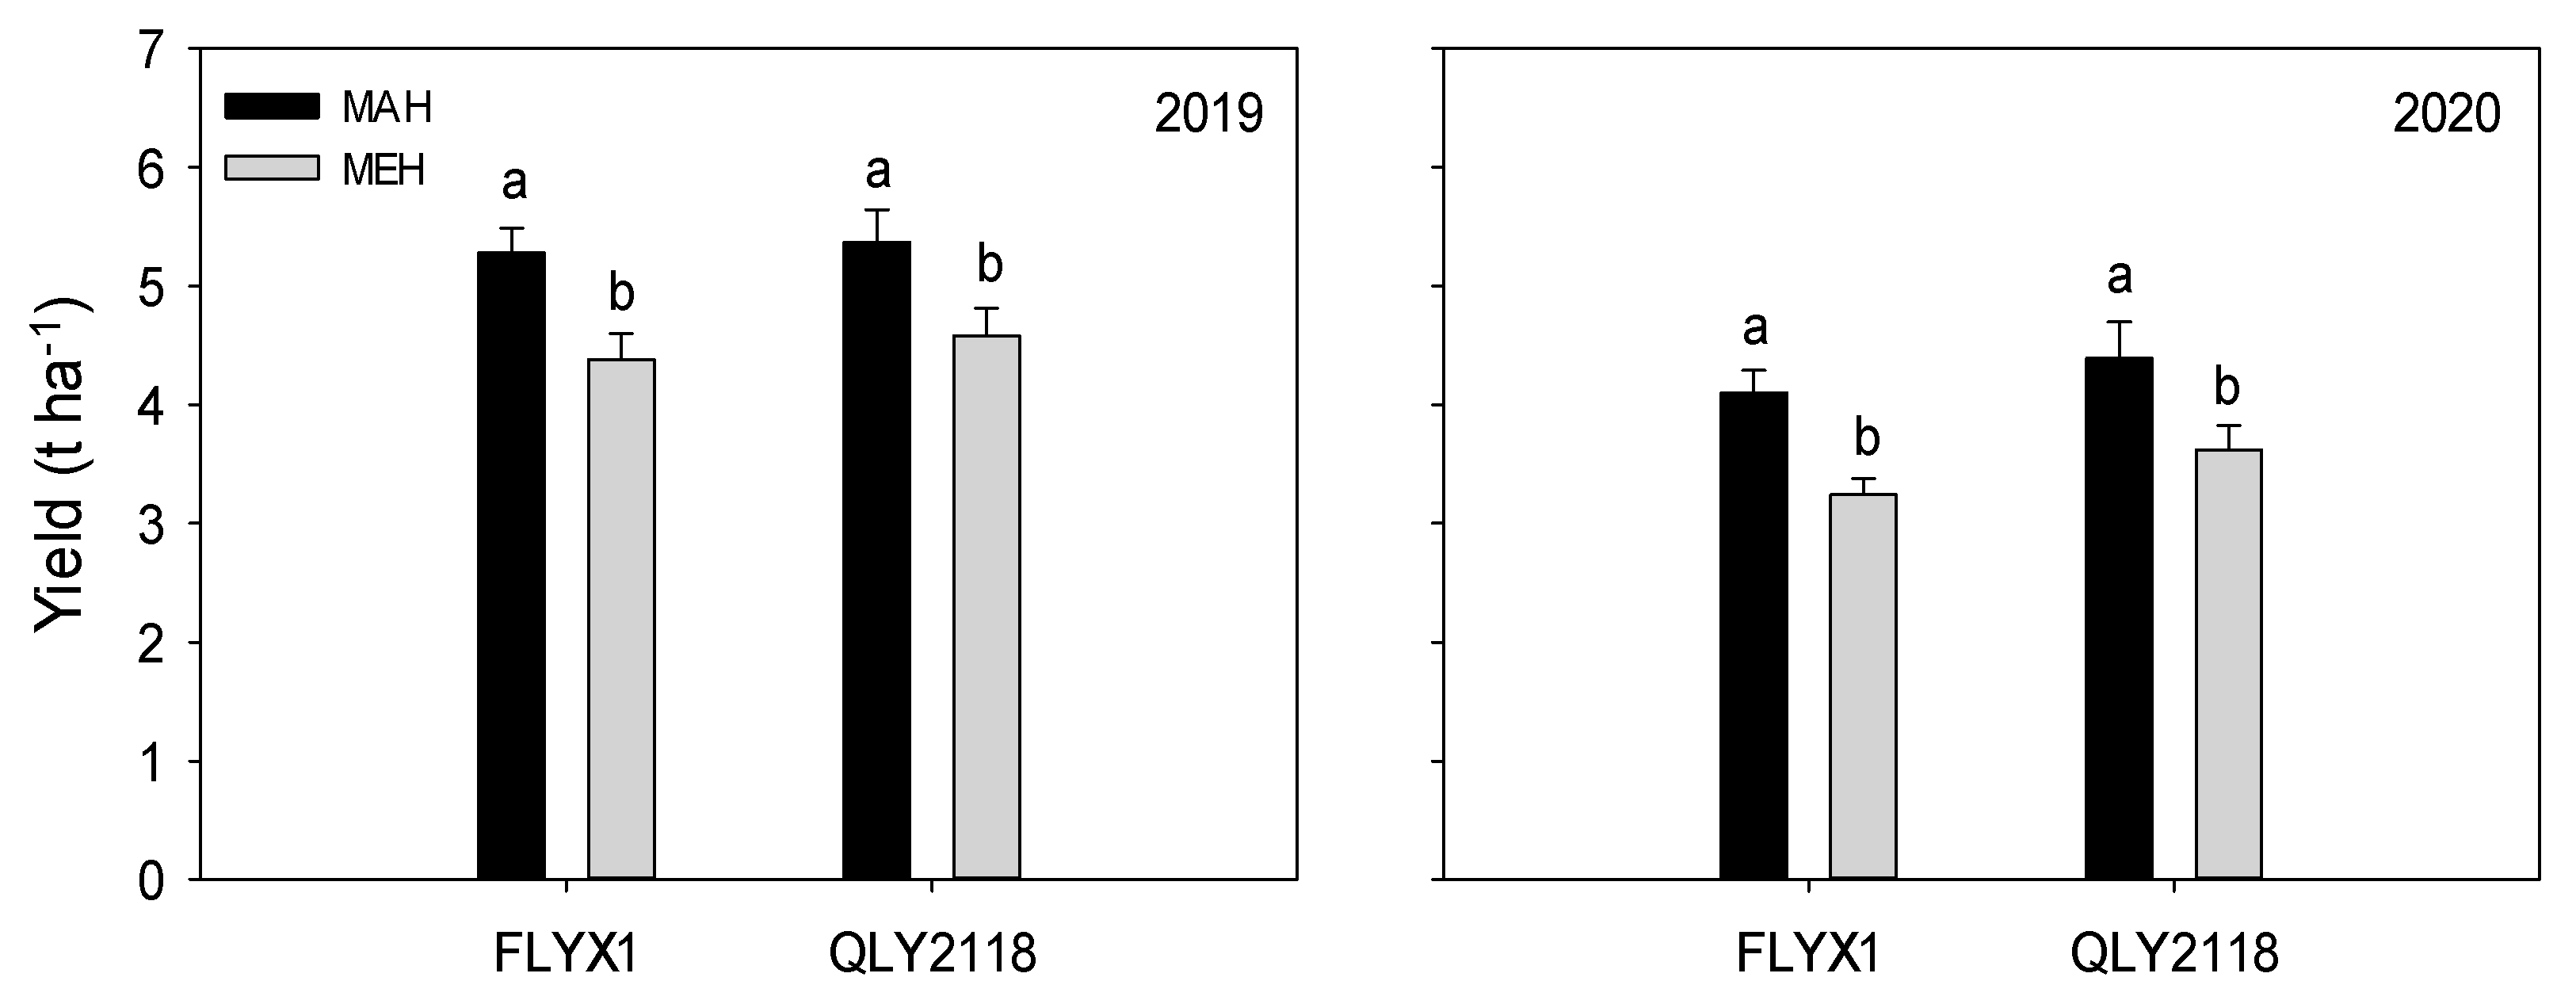
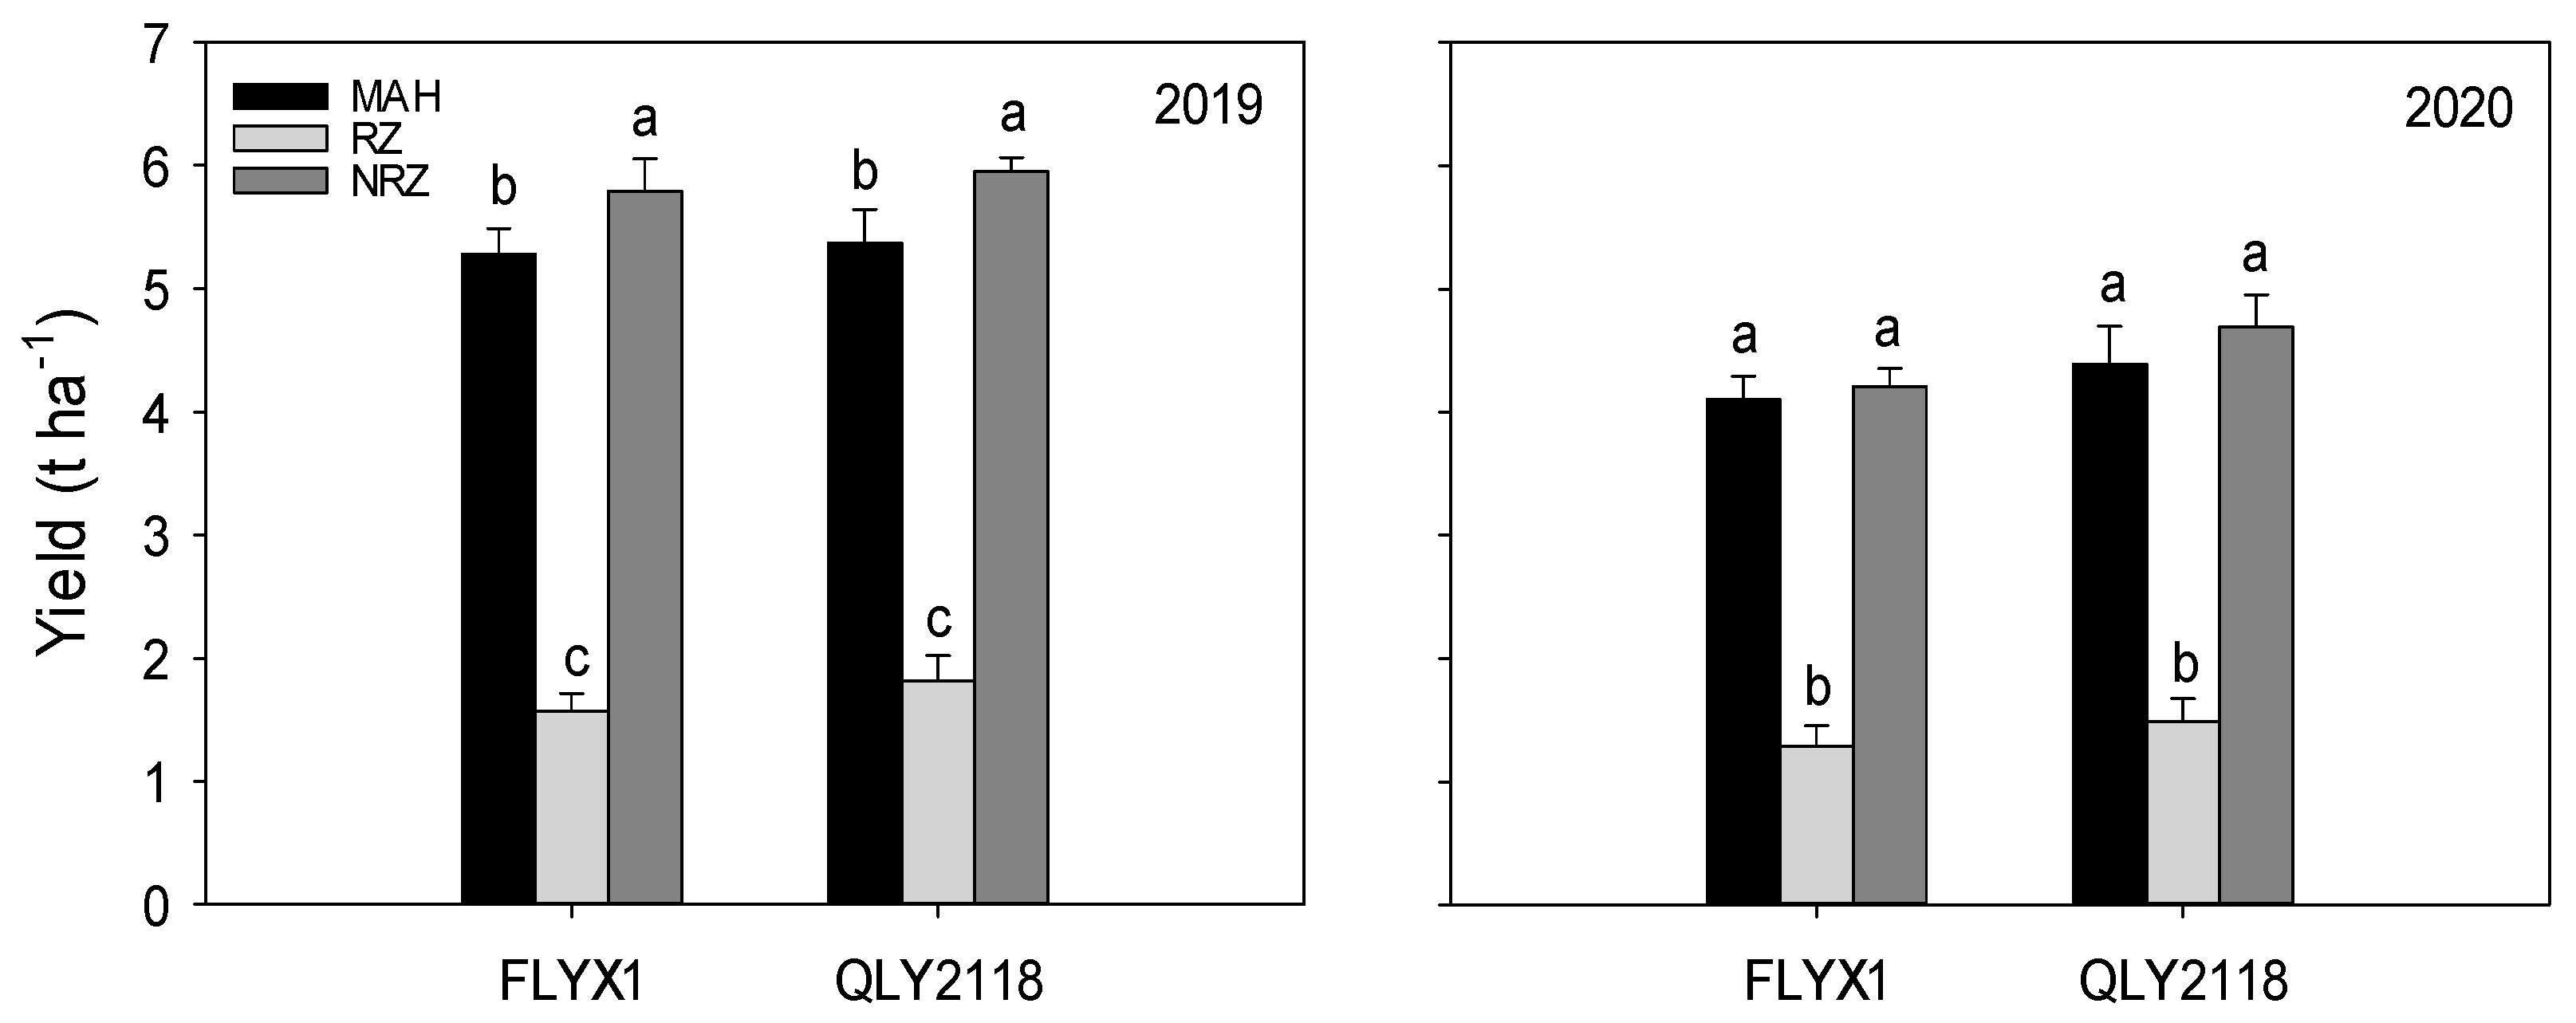
The harvest methods of the main crop had significant effects on the grain yield of the ratoon crop (Figure 3 and Table 2). Interactive effects between the harvest method and year, between the harvest method and cultivar, and among the harvest method, year, and cultivar on ratoon crop yield were insignificant. On average, MEH reduced the grain yield of the ratoon crop by 15.9% and 19.3% compared with MAH in 2019 and 2020, respectively. Although the yield of the RZ was significantly reduced by 66.1–70.3% compared with MAH across years and cultivars, the yield of the NRZ was increased by 2.7–10.8%, and the yield gains were significant for both cultivars in 2019 (Figure 4 and Table 3). Significant yield differences were observed among the R1, R2, R3, and MAH (Table 4). Interactive effects between the year and cultivar, between the cultivar and row, and among the year, cultivar, and row on the ratoon crop yield were not significant. Averaged across years and cultivars, the border effects on the yield of R1, R2, and R3 were 22.9%, 8.5%, and −10.1%, respectively. Both the cultivar and year had a significant effect on ratoon crop yield (Table 2). In general, QLY2118 produced a higher grain yield than FLYX1. Overall, the grain yield of the ratoon crop was 27.6% higher in 2019 than in 2020.
3.3. Agronomic Mechanism of Yield Difference of Ratoon Crop between the Two Harvest Methods of the Main Crop
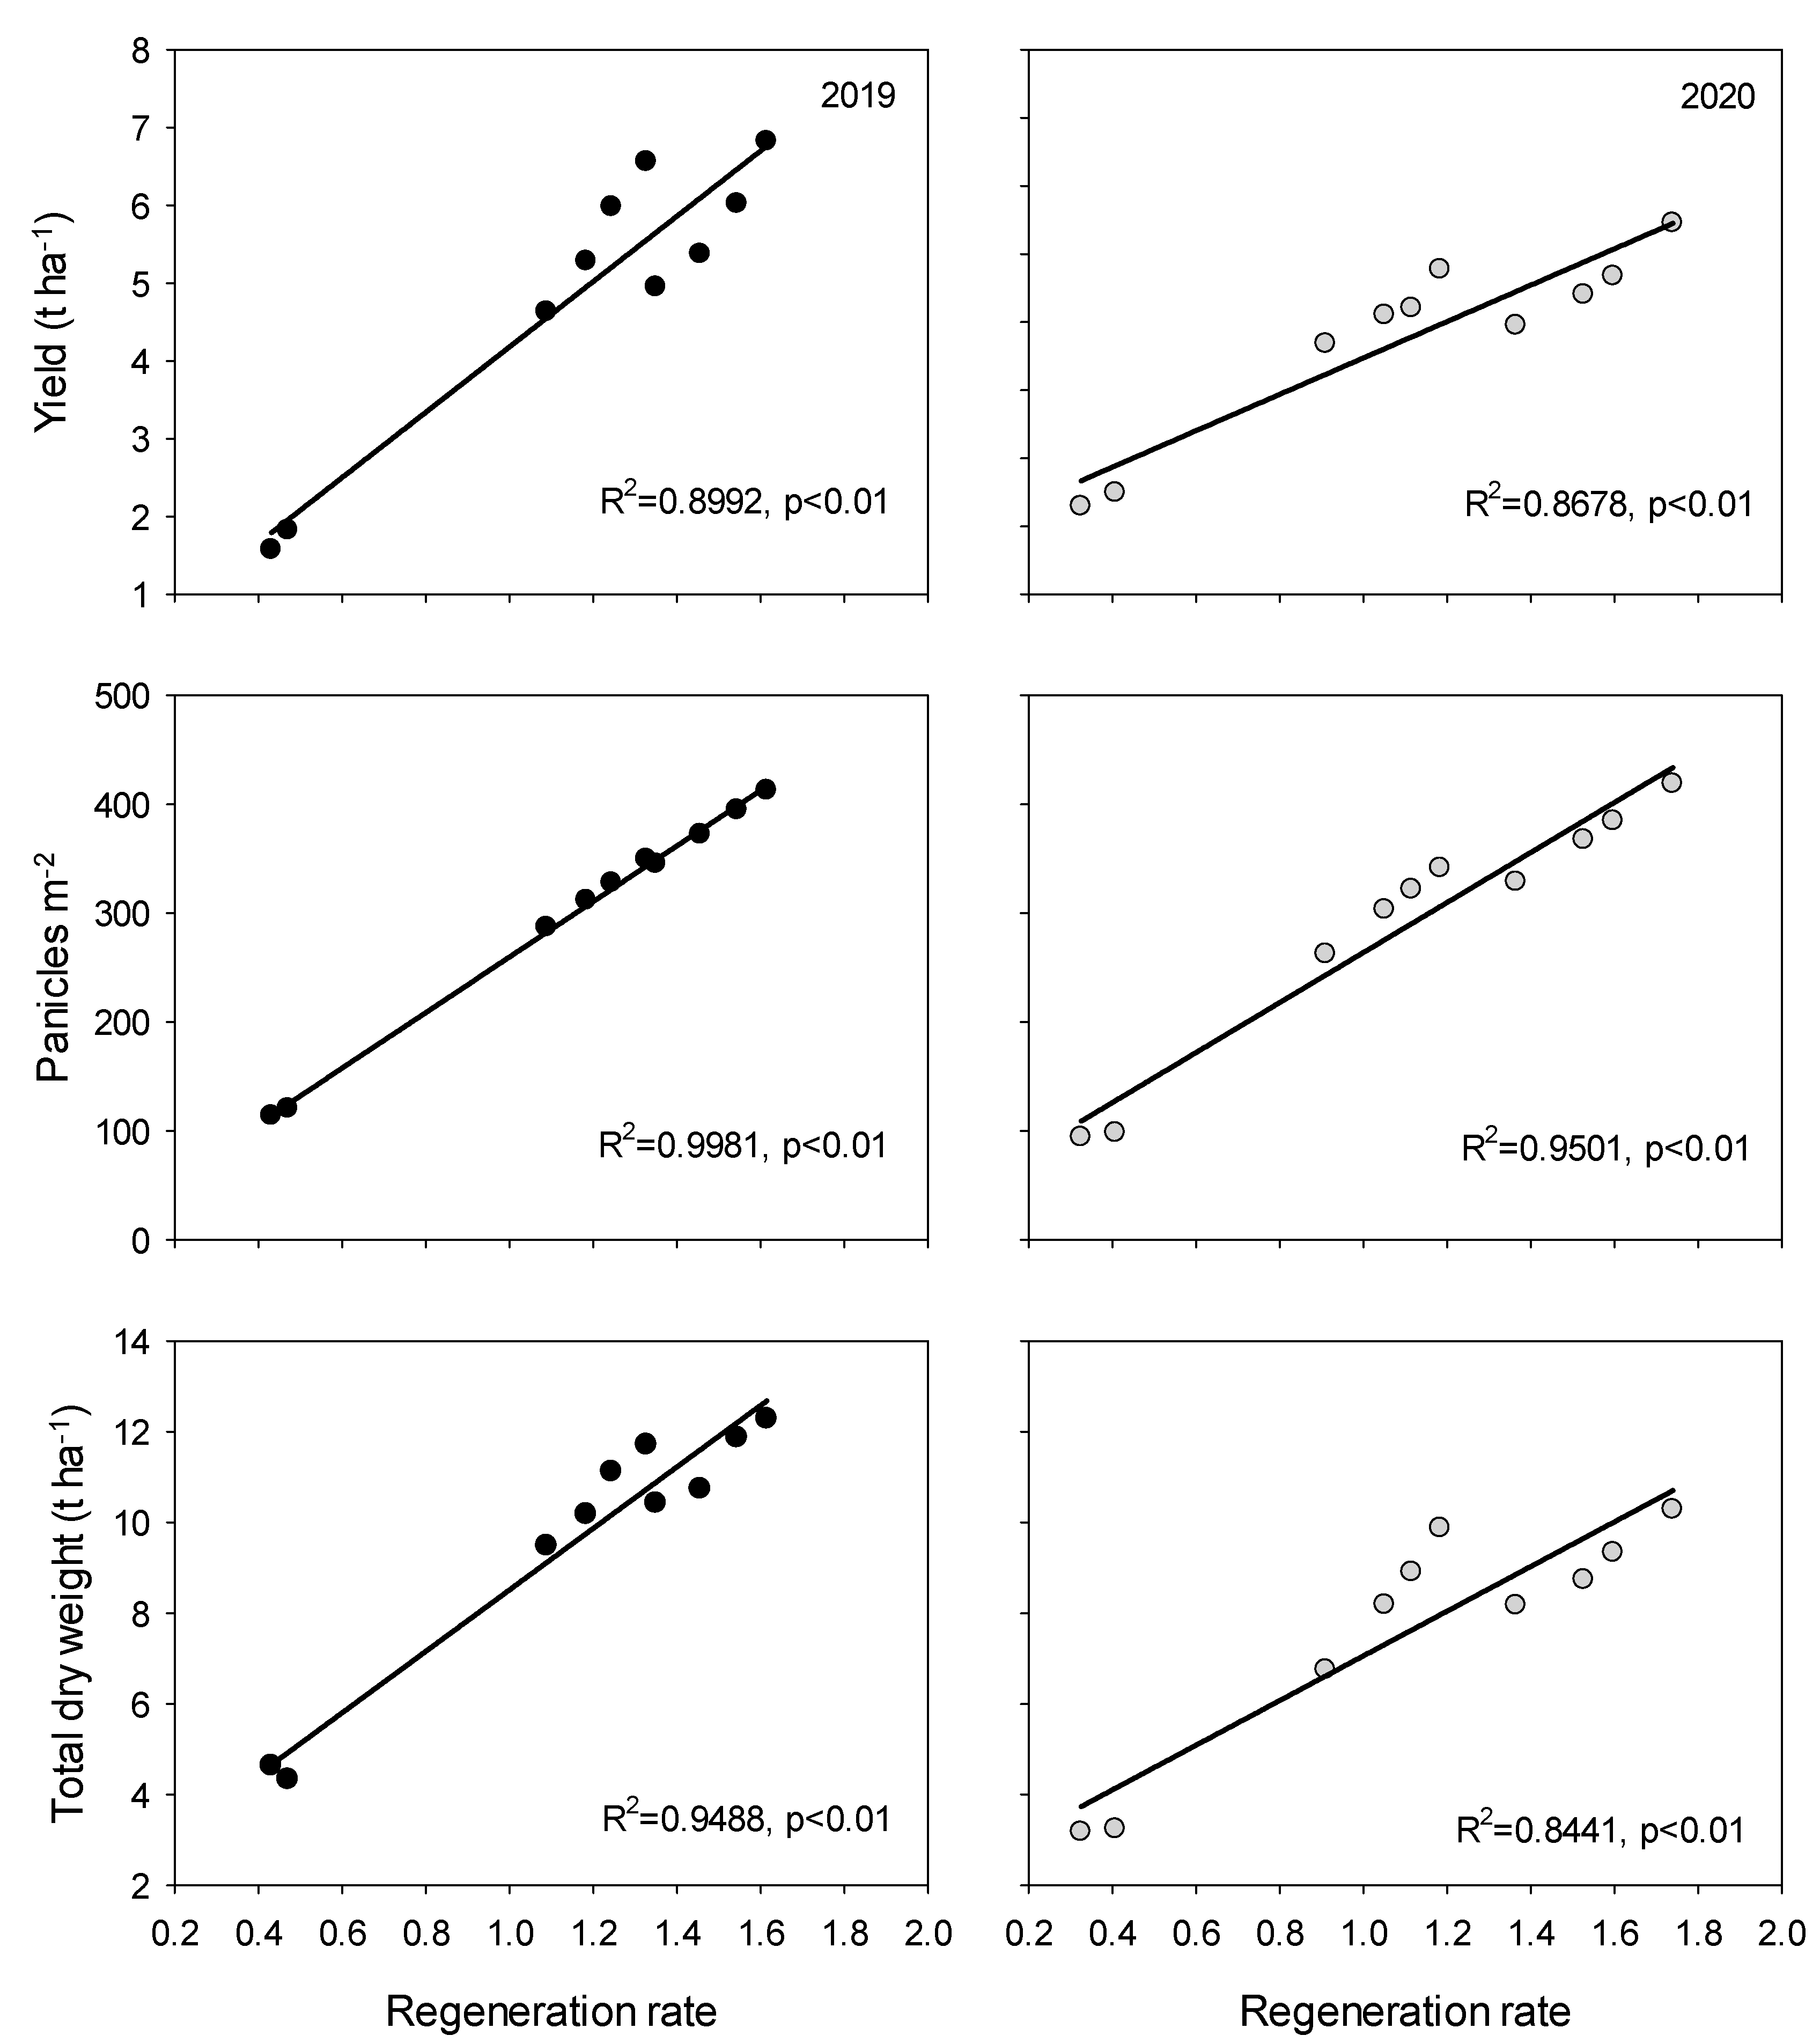
The lower yield in MEH than MAH was attributed to a lower panicle m−2, spikelets m−2, grain filling percentage, and total dry weight because the spikelets panicle−1 was higher in MEH than in MAH and the grain weight and harvest index were not affected by the harvest methods of the main crop (Table 2). All yield attributes except for spikelets panicle−1 were significantly lower in the RZ than in the MAH, which resulted in a lower grain yield in RZ than in MAH (Table 3). The yield differences among R1, R2, R3, and MAH were explained by the panicle m−2, spikelets m−2, and total dry weight (Table 4 and Table 5). Averaged across years and cultivars, compared with MAH, the panicle m−2, spikelets m−2, and total dry weight significantly increased by 14.4%, 16.3% and 16.6% in R1, respectively, significantly increased by 5.4%, 9.9% and 8.9% in R2, respectively, but significantly reduced by 9.7%, 7.5% and 8.0% in R3, respectively. No significant differences in spikelets panicle−1, grain filling percentage, or harvest index were observed among R1, R2, R3, and MAH. Among RZ, R1, R2, R3, and MAH, the grain yield, panicle m−2, and total dry weight positively correlated with the regeneration rate (Figure 5). Higher yield attributes except for the grain filling percentage contributed to a higher grain yield of QLY2118 compared with FLYX1. The higher yield in 2019 than in 2020 was attributed to simultaneous increases in all yield attributes except for panicle m−2.
4. Discussion
Great yield losses of ratoon crops caused by mechanical harvesting of the main crop have been reported in previous studies [13,17]. The yield loss in different studies ranged from 3.4% to 40.9% due to the differences in climate conditions, cultivars, and crop management [12,18]. In this study, the yield loss averaged across years and cultivars reached 17.6%, which was consistent with previous studies. Compared with the MAH, although mechanical harvesting of the main crop significantly reduced the grain yield of the RZ, it increased the grain yield of the NRZ by 7.8%. These results indicated that rolling during mechanical harvesting of the main crop had a border effect on the yield of the NRZ, which compensated for the yield loss of the ratoon crop to a certain degree.
At the early stage of ratoon crops, the sprouting and growth of regenerated buds depend on the supply of nutrients stored in rice stubbles, such as nitrogen and nonstructural carbohydrates [19]. Mechanical harvesting of the main crop damaged the nutrients transport capacity of the rolled plants [17], which thereby reduced the regeneration rate, dry weight accumulation, and panicle m−2 of the rolled plants (Figure 5 and Table 3). Thus, the NRZ plants were able to receive more solar energy and better ventilation, resulting in a border effect on the NRZ plants. Interestingly, significant yield differences were observed among the different rows in the NRZ. The border effects on the yields of R1, R2, and R3 were 22.9%, 8.5%, and −10.1%, respectively. These findings suggest that the yield gain of the NRZ was attributed to the increased yield of R1 and R2 rather than R3.
Rice yield is determined by the panicle number, spikelets per panicle, grain filling percentage, and grain weight [20,21]. Generally, the yield can be promoted by increasing the individual yield component or any combination among the four components [22]. In this study, the yield gains of R1 and R2 and the yield reduction of R3 compared with MAH were mainly explained by the panicle m−2 because the differences in the other three yield components were relatively small (Table 4). The greater panicle m−2 in R1 and R2 than in MAH contributed to the higher yields of R1 and R2. The lower yield of R3 compared with MAH was mainly due to the lower panicle m−2. These results indicated that increasing the panicle m−2 is an effective way to improve the grain yield for ratoon crops. Previous studies have also stated that a higher panicle number was the basis for a high ratoon crop yield [10,23,24]. From another perspective, the grain yield is the product of the total dry weight and harvest index [25]. In our study, differences in the grain yield among the MAH, RZ, R1, R2, and R3 were mainly due to the total dry weight rather than the harvest index (Table 5), indicating that improvements in biomass production are important for improving rice grain yield while sustaining a high harvest index in ratoon crops. This result is consistent with that reported by Jiang et al. [26]. For ratoon crops, the panicle m−2 and dry weight accumulation are closely related to the absorption and utilization of nitrogen and solar radiation [27,28]. The physiological mechanisms underlying the yield difference among the MAH, RZ, R1, R2, and R3 need to be further studied. The lower yield of the ratoon crop in 2020 than in 2019 was due to the lower temperature and solar radiation and higher precipitation in the ratoon season, which was supported by the lower spikelets m−2, grain filling percentage, total dry weight, and harvest index. In addition, the lower yield of the main crop in 2020 than in 2019 was also responsible for the lower yield of the ratoon crop in 2020 (data not shown).
Although the border effect on the yield of the NRZ can compensate for the yield loss of ratoon crops, some strategies should be adopted to reduce yield loss so as to further extend the mechanized ratoon rice system. A significant difference in the yield loss of ratoon crops among cultivars has been observed in many previous studies. Thus, breeding rice cultivars with a high regenerative ability and strong rolled-resistance is considered an effective method of alleviating the yield losses in mechanized ratoon rice systems [29]. In addition, the rolling damage can be reduced partially by the combination of the modification of agricultural machinery and the improvement of crop management. In recent years, several specialized harvest machines, such as the triangular crawler harvester designed by Huanan Agricultural University, Guangzhou, China, and the double-channel feeding wide header harvester designed by Huazhong Agricultural University, Wuhan, China, have been developed for a ratoon rice system and can reduce the rolled area of the ratoon crop by 16.2–21.5% compared with normal harvest machines [30,31]. Determining methods of accelerating the commercial application and promotion of these machines should be regarded as important work in the future. Furthermore, our previous study showed that moderate soil drying during the middle-late grain filling stage of the main crop decreased the rolling damage to the ratoon crop by 8.1% [12]. However, these strategies can only alleviate yield loss to some extent. Identifying methods of further reducing the rolling damage remains a great challenge for the extension of the mechanized ratoon rice system.
5. Conclusions
Mechanical harvesting of the main crop significantly reduced the grain yield of the ratoon crop. The lower yield in MEH than MAH was attributed to a decreased yield of RZ, which was explained by the lower panicle m−2, grain filling percentage, total dry weight, and harvest index in RZ. In contrast, rolling during mechanical harvesting of the main crop induced a border effect on the yield of NRZ, which reduced the yield loss of the ratoon crop. The yield gain of NRZ was attributed to the increased yield of R1 and R2 rather than R3. Compared with MAH, the increase of grain yield in R1 and R2 was mainly explained by the increased panicle m−2, spikelets m−2, and total dry weight.
Author Contributions
Y.Z. conducted the field experiments and wrote the manuscript. C.Z., G.C., R.H. and Y.J. participated data collection and data analysis. Y.X. provided advice on experimental implementation. W.W. conceived and supervised the field experiments and revised manuscript. All authors have read and agreed to the published version of the manuscript.
Funding
This research was funded by the Anhui Provincial Natural Science Foundation (2108085QC109) and the National Natural Science Foundation of China (32101822).
Institutional Review Board Statement
Not applicable.
Informed Consent Statement
Not applicable.
Data Availability Statement
Not applicable.
Acknowledgments
We thank Jinhua Chen, Xueyuan Sun, Min Xi, Debao Tu, and Ya Jiang for their technical support.
Conflicts of Interest
The authors declare no conflict of interest.
References
- Chen, J.N.; Zhang, R.C.; Cao, F.B.; Yin, X.H.; Liang, T.F.; Huang, M.; Zou, Y.B. Critical yield factors for achieving high grain yield in early-season rice grown under mechanical transplanting conditions. Phyton-Int. J. Exp. Bot. 2020, 89, 1043–1057. [Google Scholar] [CrossRef]
- Sun, W.; Huang, Y. Global warming over the period 1961–2008 did not increase high-temperature stress but did reduce low-temperature stress in irrigated rice across China. Agric. For. Meteorol. 2011, 151, 1193–1201. [Google Scholar] [CrossRef]
- Zhang, S.; Tao, F.L.; Zhang, Z. Changes in extreme temperatures and their impacts on rice yields in southern China from 1981 to 2009. Field Crops Res. 2016, 189, 43–50. [Google Scholar] [CrossRef] [Green Version]
- Zhu, D.F.; Chen, H.Z.; Xu, Y.C.; Zhang, Y.P. The limiting factors of mechanization in double cropping rice production in China and development countermeasures. China Rice 2013, 19, 1–4, (In Chinese with English Abstract). [Google Scholar] [CrossRef]
- Yuan, S.; Cassman, K.G.; Huang, J.L.; Peng, S.B.; Grassini, P. Can ratoon cropping improve resource use effciencies and profitability of rice in central China? Field Crops Res. 2019, 234, 66–72. [Google Scholar] [CrossRef]
- Jones, D.B. Rice ratoon response to main crop harvest cutting height. Agron. J. 1993, 85, 1139–1142. [Google Scholar] [CrossRef]
- Shen, X.; Zhang, L.; Zhang, J.B. Ratoon rice production in central China: Environmental sustainability and food production. Sci. Total Environ. 2020, 764, 142850. [Google Scholar] [CrossRef] [PubMed]
- Xu, F.X.; Xiong, H.; Zhang, L.; Zhu, Y.C.; Jiang, P.; Guo, X.Y.; Liu, M. Progress in research of yield formation of ratooning rice and its high-yielding key regulation technologies. Sci. Agric. Sin. 2015, 48, 1702–1717, (In Chinese with English Abstract). [Google Scholar] [CrossRef]
- Lin, Q.; Wang, Y.H.; Lin, Q.; Zhou, F.M.; Zhang, J.F. Yield formation and key screening indicators ratooning rice under simplified cultivation. J. Northwest Agric. For. Univ. 2020, 48, 38–47, (In Chinese with English Abstract). [Google Scholar] [CrossRef]
- Chen, Q.; He, A.B.; Wang, W.Q.; Peng, S.B.; Huang, J.L.; Cui, K.H.; Nie, L.X. Comparisons of regeneration rate and yields performance between inbred and hybrid rice cultivars in a direct seeding rice-ratoon rice system in central China. Field Crops Res. 2018, 223, 164–170. [Google Scholar] [CrossRef]
- Wang, W.Q.; He, A.B.; Jiang, G.L.; Sun, H.J.; Jiang, M.; Man, J.G.; Ling, X.X.; Cui, K.H.; Huang, J.L.; Peng, S.B.; et al. Ratoon rice technology: A green and resource-efficient way for rice production. Adv. Agron. 2020, 159, 135–167. [Google Scholar] [CrossRef]
- Zheng, C.; Wang, Y.C.; Yuan, S.; Xiao, S.; Peng, S.B. Heavy soil drying during mid-to-late grain filling stage of the main crop to reduce yield loss of the ratoon crop in a mechanized rice ratooning system. Crop J. 2021, in press. [Google Scholar] [CrossRef]
- Xiao, S. Effect of Mechanical Harvesting of Main Crop on the Grain Yield and Quality of Ratoon Crop in Ratooned Rice. Master’s Thesis, Huazhong Agricultural University, Wuhan, China, 2018. (In Chinese with English Abstract). [Google Scholar]
- Yi, Q.S. Discussion on the integration of agricultural machinery and agronomy in the production of regenerative rice. J. Hubei Agric. Mech. 2016, 5, 51–52, (In Chinese with English Abstract). [Google Scholar] [CrossRef]
- Wang, K.; Zhou, H.Y.; Wang, B.J.; Jian, Z.P.; Wang, F.; Huang, J.L.; Nie, L.Y.; Cui, K.H.; Peng, S.B. Quantification of border effect on grain yield measurement of hybrid rice. Field Crops Res. 2013, 141, 47–54. [Google Scholar] [CrossRef]
- Zhou, Y.J.; Li, X.X.; Cao, J.; Li, Y.; Huang, J.L.; Peng, S.B. High nitrogen input reduces yield loss from low temperature during the seedling stage in early-season rice. Field Crops Res. 2018, 228, 68–75. [Google Scholar] [CrossRef]
- Chen, X.F.; Li, H.L.; Liu, M.H.; Yu, J.J.; Zhang, X.Y.; Liu, Z.X.; Peng, Y.F. Stubble Righting Increases the Grain Yield of Ratooning Rice After the Mechanical Harvest of Primary Rice. J. Plant Growth Regul. 2021, 40, 1–11. [Google Scholar] [CrossRef]
- Wang, S.M.; Zhang, C.H.; Hu, L.; Hu, P.X.; Zhang, Q.X.; Wang, Y.; Zeng, K.; Yang, L. Effects of different harvesting methods in main crop on growth and yield of regenerated rice. Hubei Agric. Sci. 2018, 57, 31–34, (In Chinese with English Abstract). [Google Scholar] [CrossRef]
- He, A.B.; Wang, W.Q.; Jiang, G.L.; Sun, H.J.; Jiang, M.; Man, J.G.; Peng, S.B.; Nie, L.X. Source-sink regulation and its effects on the regeneration ability of ratoon rice. Field Crops Res. 2019, 236, 155–164. [Google Scholar] [CrossRef]
- Ying, J.F.; Peng, S.B.; He, Q.R.; Yang, H.; Yang, C.D.; Visperas, R.M.; Cassman, K.G. Comparison of high-yield rice in tropical and subtropical environments. I. Determinants of grain and dry matter yields. Field Crops Res. 1998, 57, 71–84. [Google Scholar] [CrossRef]
- Fei, C.; Xu, Q.; Xu, Z.J.; Chen, W.F. Effect of rice breeding process on improvement of yield and quality in China. Rice Sci. 2020, 27, 363–367. [Google Scholar] [CrossRef]
- Yuan, P.R.; Sun, C.Q.; Yang, C.D.; Zhou, N.; Ying, J.F.; Peng, S.B.; Wang, X.K. Analysis on grain yield and yield components of the 15 t hm–2 high yielding Indica rice (Oryza sativa L.) in Yunnan. Acta Agron. Sin. 2000, 26, 756–762, (In Chinese with English Abstract). [Google Scholar] [CrossRef]
- Shiraki, S.; Cho, T.M.; Htay, K.M.; Yamaoka, K. Effects of the Double-Cutting Method for Ratooning Rice in the SALIBU System under Different Soil Moisture Conditions on Grain Yield and Regeneration Rate. Agronomy 2020, 10, 1621. [Google Scholar] [CrossRef]
- Shiraki, S.; Cho, T.M.; Matsuno, Y.; Shinogi, Y. Evapotranspiration and crop coefficient of ratoon rice crop determined by water depth observation and bayesian inference. Agronomy 2021, 11, 1573. [Google Scholar] [CrossRef]
- Yoshida, S. Fundamentals of Rice Crop Science; IRRI: Los Baños, Philippines, 1981; p. 61. [Google Scholar]
- Jiang, P.; Xu, F.X.; Zhang, L.; Liu, M.; Xiong, H.; Guo, X.Y.; Zhu, Y.C.; Zhou, X.B. Impact of tillage and crop establishment methods on rice yields in a rice-ratoon rice cropping system in Southwest China. Sci. Rep. 2021, 11, 18421. [Google Scholar] [CrossRef] [PubMed]
- Wang, Y.C. Effect of Nitrogen Management on Yield Formation of Ratoon Rice and the Related Mechanism. Master’s Thesis, Huazhong Agricultural University, Wuhan, China, 2019. (In Chinese with English Abstract). [Google Scholar] [CrossRef]
- Wang, Y.C.; Zheng, C.; Xiao, S.; Sun, Y.T.; Huang, J.L.; Peng, S.B. Agronomic responses of ratoon rice to nitrogen management in central China. Field Crops Res. 2019, 241, 107569. [Google Scholar] [CrossRef]
- Xu, F.X.; Zhang, L.; Zhou, X.B.; Guo, X.Y.; Zhu, Y.C.; Liu, M.; Xiong, H.; Jiang, P. The ratoon rice system with high yield and high efficiency in China: Progress, trend of theory and technology. Field Crops Res. 2021, 272, 71–75. [Google Scholar] [CrossRef]
- Fu, J.W.; Zhang, G.Z.; Xie, G. Development of double-channel feeding harvester for ratoon rice. Trans. CSAE 2020, 36, 11–20, (In Chinese with English Abstract). [Google Scholar] [CrossRef]
- Zeng, S.; Huang, D.P.; Yang, W.W.; Liu, W.J.; Wen, Z.Q.; Zeng, L. Design and test of the chassis of triangular crawler reclaiming rice harvester. J. Jilin Univ. 2021, in press (In Chinese with English Abstract). [Google Scholar] [CrossRef]
Figure 1.
Schematic diagrams (a,c) and field pictures (b,d) of manual harvesting (a,b) and mechanical harvesting (c,d) of the main crop. S1, row space; S2, plant space. The red box represents a harvest unit when the main crop was harvested mechanically. RZ, rolled zone; R1, non-rolled single row; R2, non-rolled side row; R3, non-rolled middle row.

Figure 2.
Daily minimum (Tmin), mean (Tavg) and maximum (Tmax) temperature (a,b), solar radiation (c,d), and precipitation (e,f) from transplanting of the main crop to harvest of the ratoon crop in the Meicun Township, Chizhou County, Anhui Province, China in 2019 (a,c,e) and 2020 (b,d,f). HT, harvest of the main crop.

Figure 3.
Grain yield of the ratoon crop under manual and mechanical harvesting of the main crop in 2019 and 2020. MAH, manual harvesting; MEH, mechanical harvesting. FLYX1, Fengliangyouxiang1; QLY2118, Quanliangyou2118. Vertical bars represent the standard deviation of the mean (n = 4). For each cultivar of each year, data with different lowercase letters are significantly different at the 0.05 probability level.

Figure 4.
Grain yield of the ratoon crop under manual harvesting of the main crop and the rolled zone and non-rolled zone under mechanical harvesting of the main crop in 2019 and 2020. MAH, manual harvesting; RZ, rolled zone; NRZ, non-rolled zone. FLYX1, Fengliangyouxiang1; and QLY2118, Quanliangyou2118. Vertical bars represent the standard deviation of the mean (n = 4). For each cultivar of each year, data with different lowercase letters are significantly different at the 0.05 probability level.

Figure 5.
Correlations of the grain yield, panicle m−2, and total dry weight with the regeneration rate in the ratoon crop under two harvest methods of the main crop in 2019 and 2020 (n = 10).
Figure 5.
Correlations of the grain yield, panicle m−2, and total dry weight with the regeneration rate in the ratoon crop under two harvest methods of the main crop in 2019 and 2020 (n = 10).


Table 1.
Average daily mean temperature, average daily solar radiation, and total precipitation of the main and ratoon season in 2019 and 2020.
Table 1.
Average daily mean temperature, average daily solar radiation, and total precipitation of the main and ratoon season in 2019 and 2020.
| Year | Average Daily Mean Temperature (°C) | Average Daily Solar Radiation (MJ m−2 d−1) | Total Precipitation (mm) | |||
|---|---|---|---|---|---|---|
| Main Season | Ratoon Season | Main Season | Ratoon Season | Main Season | Ratoon Season | |
| 2019 | 24.9 | 20.8 | 16.2 | 14.0 | 664.4 | 14.9 |
| 2020 | 25.5 | 19.8 | 13.1 | 11.4 | 1059.8 | 459.5 |
Table 2.
Yield and yield attributes of the ratoon crop under manual and mechanical harvesting of the main crop in 2019 and 2020.
Table 2.
Yield and yield attributes of the ratoon crop under manual and mechanical harvesting of the main crop in 2019 and 2020.
| Year | Cultivar | HM | Yield (t ha−1) | Yield Loss (%) | Panicles m−2 | Spikelets Panicle−1 | Spikelets m−2 (×103) | Grain Filling (%) | Grain Weight (mg) | Total Dry Weight (t ha−1) | Harvest Index (%) |
|---|---|---|---|---|---|---|---|---|---|---|---|
| 2019 | FLYX1 | MEH | 4.38 b | 17.0 | 253.0 b | 81.7 a | 20.7 b | 79.2 b | 23.7 a | 8.59 b | 44.2 a |
| MAH | 5.28 a | - | 311.5 a | 74.3 b | 23.2 a | 83.9 a | 23.9 a | 10.18 a | 45.6 a | ||
| QLY2118 | MEH | 4.58 b | 14.7 | 297.9 b | 84.5 a | 25.2 a | 80.0 a | 21.1 a | 9.04 b | 45.9 a | |
| MAH | 5.37 a | 372.1 a | 78.5 b | 29.2 a | 84.3 a | 21.0 a | 10.73 a | 48.2 a | |||
| 2020 | FLYX1 | MEH | 3.24 b | 21.0 | 239.1 b | 75.3 a | 18.0 b | 66.0 b | 23.2 a | 6.61 b | 41.1 a |
| MAH | 4.10 a | - | 303.1 a | 65.0 b | 19.7 a | 76.2 a | 23.1 a | 8.18 a | 42.4 a | ||
| QLY2118 | MEH | 3.62 b | 17.5 | 285.3 b | 78.1 a | 22.4 b | 70.4 b | 20.4 a | 7.08 b | 43.7 a | |
| MAH | 4.39 a | - | 367.3 a | 68.5 b | 25.2 a | 75.8 a | 20.5 a | 8.73 a | 44.8 a | ||
| Analysis of variance | |||||||||||
| Year (Y) | ** | ns | * | * | ** | ** | ** | ** | |||
| Cultivar (C) | ** | ** | * | ** | ns | ** | * | * | |||
| HM (M) | ** | ** | ** | ** | ** | ns | ** | ns | |||
| Y × C | * | ns | ns | ns | ns | ns | ns | ns | |||
| Y × M | ns | ns | ns | ns | * | ns | ns | ns | |||
| C × M | ns | ns | ns | ns | ns | ns | ns | ns | |||
| Y × C × M | ns | ns | ns | ns | ns | ns | ns | ns | |||
Within a column for each cultivar for each year, means followed by different letters are significantly different according to LSD (0.05). FLYX1, Fengliangyouxiang1; QLY2118, Quanliangyou2118. HM, harvest methods; MEH, mechanical harvesting; MAH, manual harvesting. ns, not significant at 0.05 probability level; * and **, significant at the 0.05 and 0.01 probability levels, respectively.
Table 3.
Yield and yield attributes of the ratoon crop under manual harvesting of the main crop and the rolled zone under mechanical harvesting of the main crop in 2019 and 2020.
Table 3.
Yield and yield attributes of the ratoon crop under manual harvesting of the main crop and the rolled zone under mechanical harvesting of the main crop in 2019 and 2020.
| Year | Cultivar | Row | Yield (t ha−1) | Panicles m−2 | Spikelets Panicle−1 | Spikelets m−2 (×103) | Grain Filling (%) | Grain Weight (mg) | Total Dry Weight (t ha−1) | Harvest Index (%) |
|---|---|---|---|---|---|---|---|---|---|---|
| 2019 | FLYX1 | RZ | 1.57 b | 113.6 b | 93.5 a | 10.6 b | 68.2 b | 23.2 b | 4.08 b | 41.2 b |
| MAH | 5.28 a | 311.5 a | 74.3 b | 23.2 a | 83.9 a | 23.9 a | 10.18 a | 45.6 a | ||
| QLY2118 | RZ | 1.82 b | 120.3 b | 95.4 a | 11.6 b | 69.3 b | 20.5 b | 3.90 b | 41.8 b | |
| MAH | 5.37 a | 372.1 a | 78.5 b | 29.2 a | 84.3 a | 21.0 a | 10.73 a | 48.2 a | ||
| 2020 | FLYX1 | RZ | 1.29 b | 94.0 b | 86.8 a | 8.2 b | 53.4 b | 22.7 b | 2.63 b | 37.6 b |
| MAH | 4.10 a | 303.1 a | 65.0 b | 19.7 a | 76.2 a | 23.1 a | 8.18 a | 42.4 a | ||
| QLY2118 | RZ | 1.49 b | 98.2 b | 89.8 a | 8.9 b | 59.1 b | 20.1 a | 2.69 b | 39.0 b | |
| MAH | 4.39 a | 367.3 a | 68.5 b | 25.2 a | 75.8 a | 20.5 a | 8.73 a | 44.8 a | ||
| Analysis of variance | ||||||||||
| Year (Y) | * | ns | ns | ns | * | * | ** | ** | ||
| Cultivar (C) | ** | ** | * | ** | ns | ** | * | * | ||
| Row (R) | ** | ** | ** | ** | ** | ** | ** | ** | ||
| Y × C | ns | ns | ns | ns | ns | ns | ns | ns | ||
| Y × R | ** | ns | ns | ns | * | ns | ns | ns | ||
| C × R | ns | ** | ns | ** | ns | ns | ns | ns | ||
| Y × C × R | ns | ns | ns | ns | ns | ns | ns | ns | ||
Within a column for each cultivar for each year, means followed by different letters are significantly different according to LSD (0.05). FLYX1, Fengliangyouxiang1; QLY2118, Quanliangyou2118. RZ, rolled zone; MAH, manual harvesting. ns, not significant at 0.05 probability level; * and **, significant at the 0.05 and 0.01 probability levels, respectively.
Table 4.
Yield, yield components and border effect on the yield of the ratoon crop in different rows of the non-rolled zone under mechanical harvesting treatment in 2019 and 2020.
Table 4.
Yield, yield components and border effect on the yield of the ratoon crop in different rows of the non-rolled zone under mechanical harvesting treatment in 2019 and 2020.
| Year | Cultivar | Row | Yield (t ha−1) | Border Effect (%) | Panicles m−2 | Spikelets Panicle−1 | Spikelets m−2 (×103) | Grain Filling (%) | Grain Weight (mg) |
|---|---|---|---|---|---|---|---|---|---|
| 2019 | FLYX1 | R1 | 6.56 a | 24.2 | 349.3 a | 75.6 a | 26.4 a | 84.6 a | 24.1 a |
| R2 | 5.98 b | 13.3 | 327.4 ab | 76.6 a | 25.1 ab | 85.1 a | 23.9 a | ||
| R3 | 4.63 d | −12.3 | 286.7 c | 74.2 a | 21.3 c | 83.7 a | 24.0 a | ||
| MAH | 5.28 c | - | 311.5 b | 74.3 a | 23.1 bc | 83.9 a | 23.9 a | ||
| QLY2118 | R1 | 6.82 a | 27.0 | 412.7 a | 79.2 a | 32.7 a | 85.2 a | 21.2 ab | |
| R2 | 6.02 b | 12.1 | 394.6 ab | 78.6 a | 31.0 ab | 85.6 a | 21.4 a | ||
| R3 | 4.95 c | −7.8 | 345.1 c | 80.1 a | 27.6 c | 84.9 a | 21.3 ab | ||
| MAH | 5.37 c | - | 372.1 bc | 78.5 a | 29.2 bc | 84.3 a | 21.0 b | ||
| 2020 | FLYX1 | R1 | 4.77 a | 16.3 | 341.2 a | 69.5 ab | 23.7 a | 74.9 a | 23.6 a |
| R2 | 4.20 bc | 2.4 | 321.6 ab | 71.0 a | 22.8 a | 72.1 ab | 23.4 ab | ||
| R3 | 3.68 c | −10.2 | 262.3 c | 66.3 ab | 17.4 c | 70.2 b | 23.2 b | ||
| MAH | 4.10 bc | - | 303.1 b | 65.0 b | 19.7 b | 76.2 a | 23.1 b | ||
| QLY2118 | R1 | 5.45 a | 24.1 | 418.5 a | 72.1 a | 30.2 a | 76.5 a | 20.7 a | |
| R2 | 4.67 b | 6.4 | 384.3 ab | 72.6 a | 27.9 b | 75.5 a | 20.5 ab | ||
| R3 | 3.95 c | −10.0 | 328.5 c | 71.9 a | 23.6 c | 76.8 a | 20.4 b | ||
| MAH | 4.39 bc | - | 367.3 bc | 68.5 a | 25.2 c | 75.8 a | 20.5 ab | ||
| Analysis of variance | |||||||||
| Year (Y) | ** | ns | * | * | ** | ** | |||
| Cultivar (C) | ** | ** | ** | ** | ns | ** | |||
| Row (R) | ** | ** | ns | ** | ns | ** | |||
| Y × C | ns | ns | ns | ns | ns | ns | |||
| Y × R | ** | ns | ns | ns | ns | ns | |||
| C × R | ns | ns | ns | ns | ns | ns | |||
| Y × C × R | ns | ns | ns | ns | ns | ns | |||
Within a column for each cultivar for each year, means followed by different letters are significantly different according to LSD (0.05). FLYX1, Fengliangyouxiang1; QLY2118, Quanliangyou2118. R1, non-rolled single row; R2, non-rolled side row; R3, non-rolled middle row; MAH, manual harvesting. ns, not significant at 0.05 probability level; * and **, significant at the 0.05 and 0.01 probability levels, respectively.
Table 5.
Total dry weight and harvest index of the ratoon crop in different rows of the non-rolled zone under mechanical harvesting treatment in 2019 and 2020.
Table 5.
Total dry weight and harvest index of the ratoon crop in different rows of the non-rolled zone under mechanical harvesting treatment in 2019 and 2020.
| Year | Cultivar | Row | Total Dry Weight (t ha−1) | Harvest Index (%) |
|---|---|---|---|---|
| 2019 | FLYX1 | R1 | 11.70 a | 46.0 a |
| R2 | 11.11 a | 45.9 a | ||
| R3 | 9.48 c | 45.1 a | ||
| MAH | 10.18 b | 45.6 a | ||
| QLY2118 | R1 | 12.27 a | 48.1 a | |
| R2 | 11.86 a | 47.9 a | ||
| R3 | 10.41 b | 48.0 a | ||
| MAH | 10.73 b | 48.2 a | ||
| 2020 | FLYX1 | R1 | 9.86 a | 42.5 a |
| R2 | 8.90 b | 43.3 a | ||
| R3 | 6.74 c | 42.0 a | ||
| MAH | 8.18 b | 42.4 a | ||
| QLY2118 | R1 | 10.28 a | 46.5 a | |
| R2 | 9.33 b | 46.3 a | ||
| R3 | 8.17 c | 45.3 a | ||
| MAH | 8.73 bc | 44.8 a | ||
| Analysis of variance | ||||
| Year (Y) | ** | ** | ||
| Cultivar ® | ** | ** | ||
| R®(R) | ** | ns | ||
| Y × C | ns | ns | ||
| Y × R | ns | ns | ||
| C × R | ns | ns | ||
| Y × C × R | ns | ns | ||
Within a column for each cultivar for each year, means followed by different letters are significantly different according to LSD (0.05). FLYX1, Fengliangyouxiang1; QLY2118, Quanliangyou2118. R1, non-rolled single row; R2, non-rolled side row; R3, non-rolled middle row; MAH, manual harvesting. ns, not significant at 0.05 probability level; **, significant at the 0.01 probability levels.
Publisher’s Note: MDPI stays neutral with regard to jurisdictional claims in published maps and institutional affiliations. |
© 2022 by the authors. Licensee MDPI, Basel, Switzerland. This article is an open access article distributed under the terms and conditions of the Creative Commons Attribution (CC BY) license (https://creativecommons.org/licenses/by/4.0/).
Share and Cite
MDPI and ACS Style
Zhou, Y.; Zheng, C.; Chen, G.; Hu, R.; Ji, Y.; Xu, Y.; Wu, W. Border Effect on Ratoon Crop Yield in a Mechanized Rice Ratooning System. Agronomy 2022, 12, 262. https://0-doi-org.brum.beds.ac.uk/10.3390/agronomy12020262
AMA Style
Zhou Y, Zheng C, Chen G, Hu R, Ji Y, Xu Y, Wu W. Border Effect on Ratoon Crop Yield in a Mechanized Rice Ratooning System. Agronomy. 2022; 12(2):262. https://0-doi-org.brum.beds.ac.uk/10.3390/agronomy12020262
Chicago/Turabian StyleZhou, Yongjin, Chang Zheng, Gang Chen, Run Hu, Yalan Ji, Youzun Xu, and Wenge Wu. 2022. "Border Effect on Ratoon Crop Yield in a Mechanized Rice Ratooning System" Agronomy 12, no. 2: 262. https://0-doi-org.brum.beds.ac.uk/10.3390/agronomy12020262
Note that from the first issue of 2016, this journal uses article numbers instead of page numbers. See further details here.