
Study on the Nutrient Optimal Management Strategy of High and Stable Annual Yield in the Rice–Wheat System: A 10-Year Term Experiment

Abstract
:1. Introduction
2. Materials and Methods
2.1. Experimental Site and Design
2.2. Field Experiment
2.3. Measurements and Data Analysis
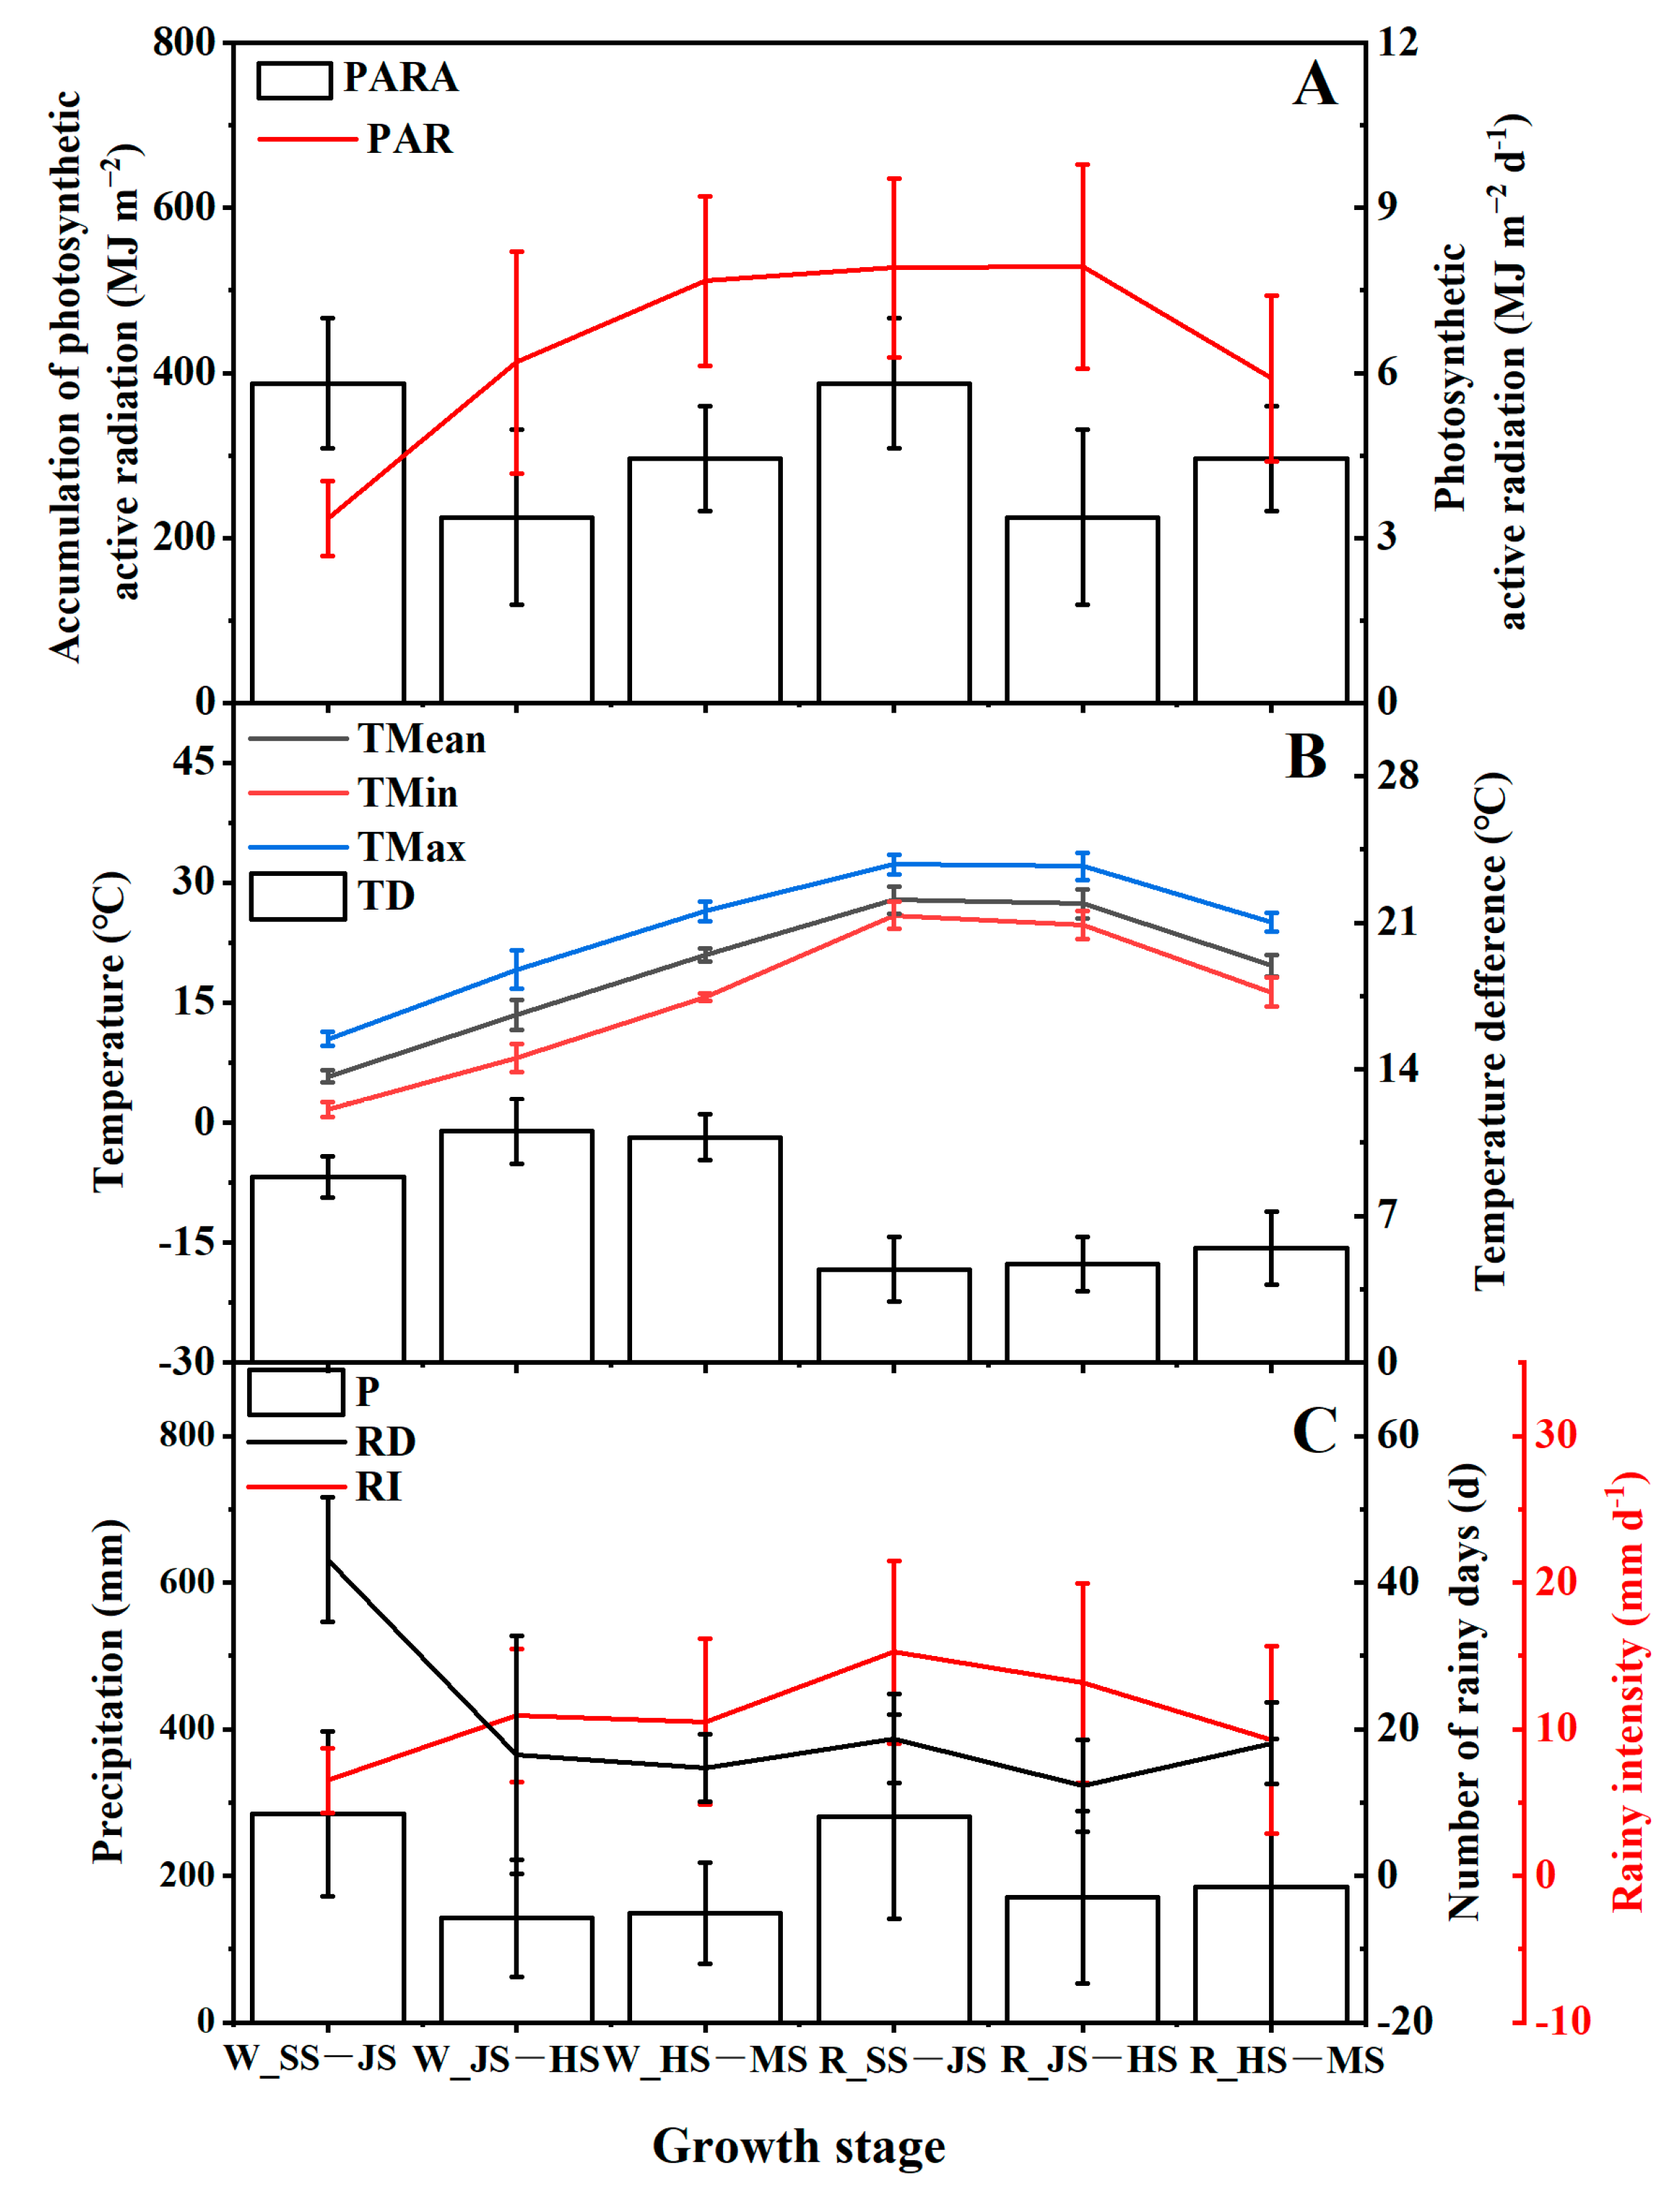
2.3.1. Meteorological Data
2.3.2. Yields and Their Components
2.3.3. Data Analysis
3. Results
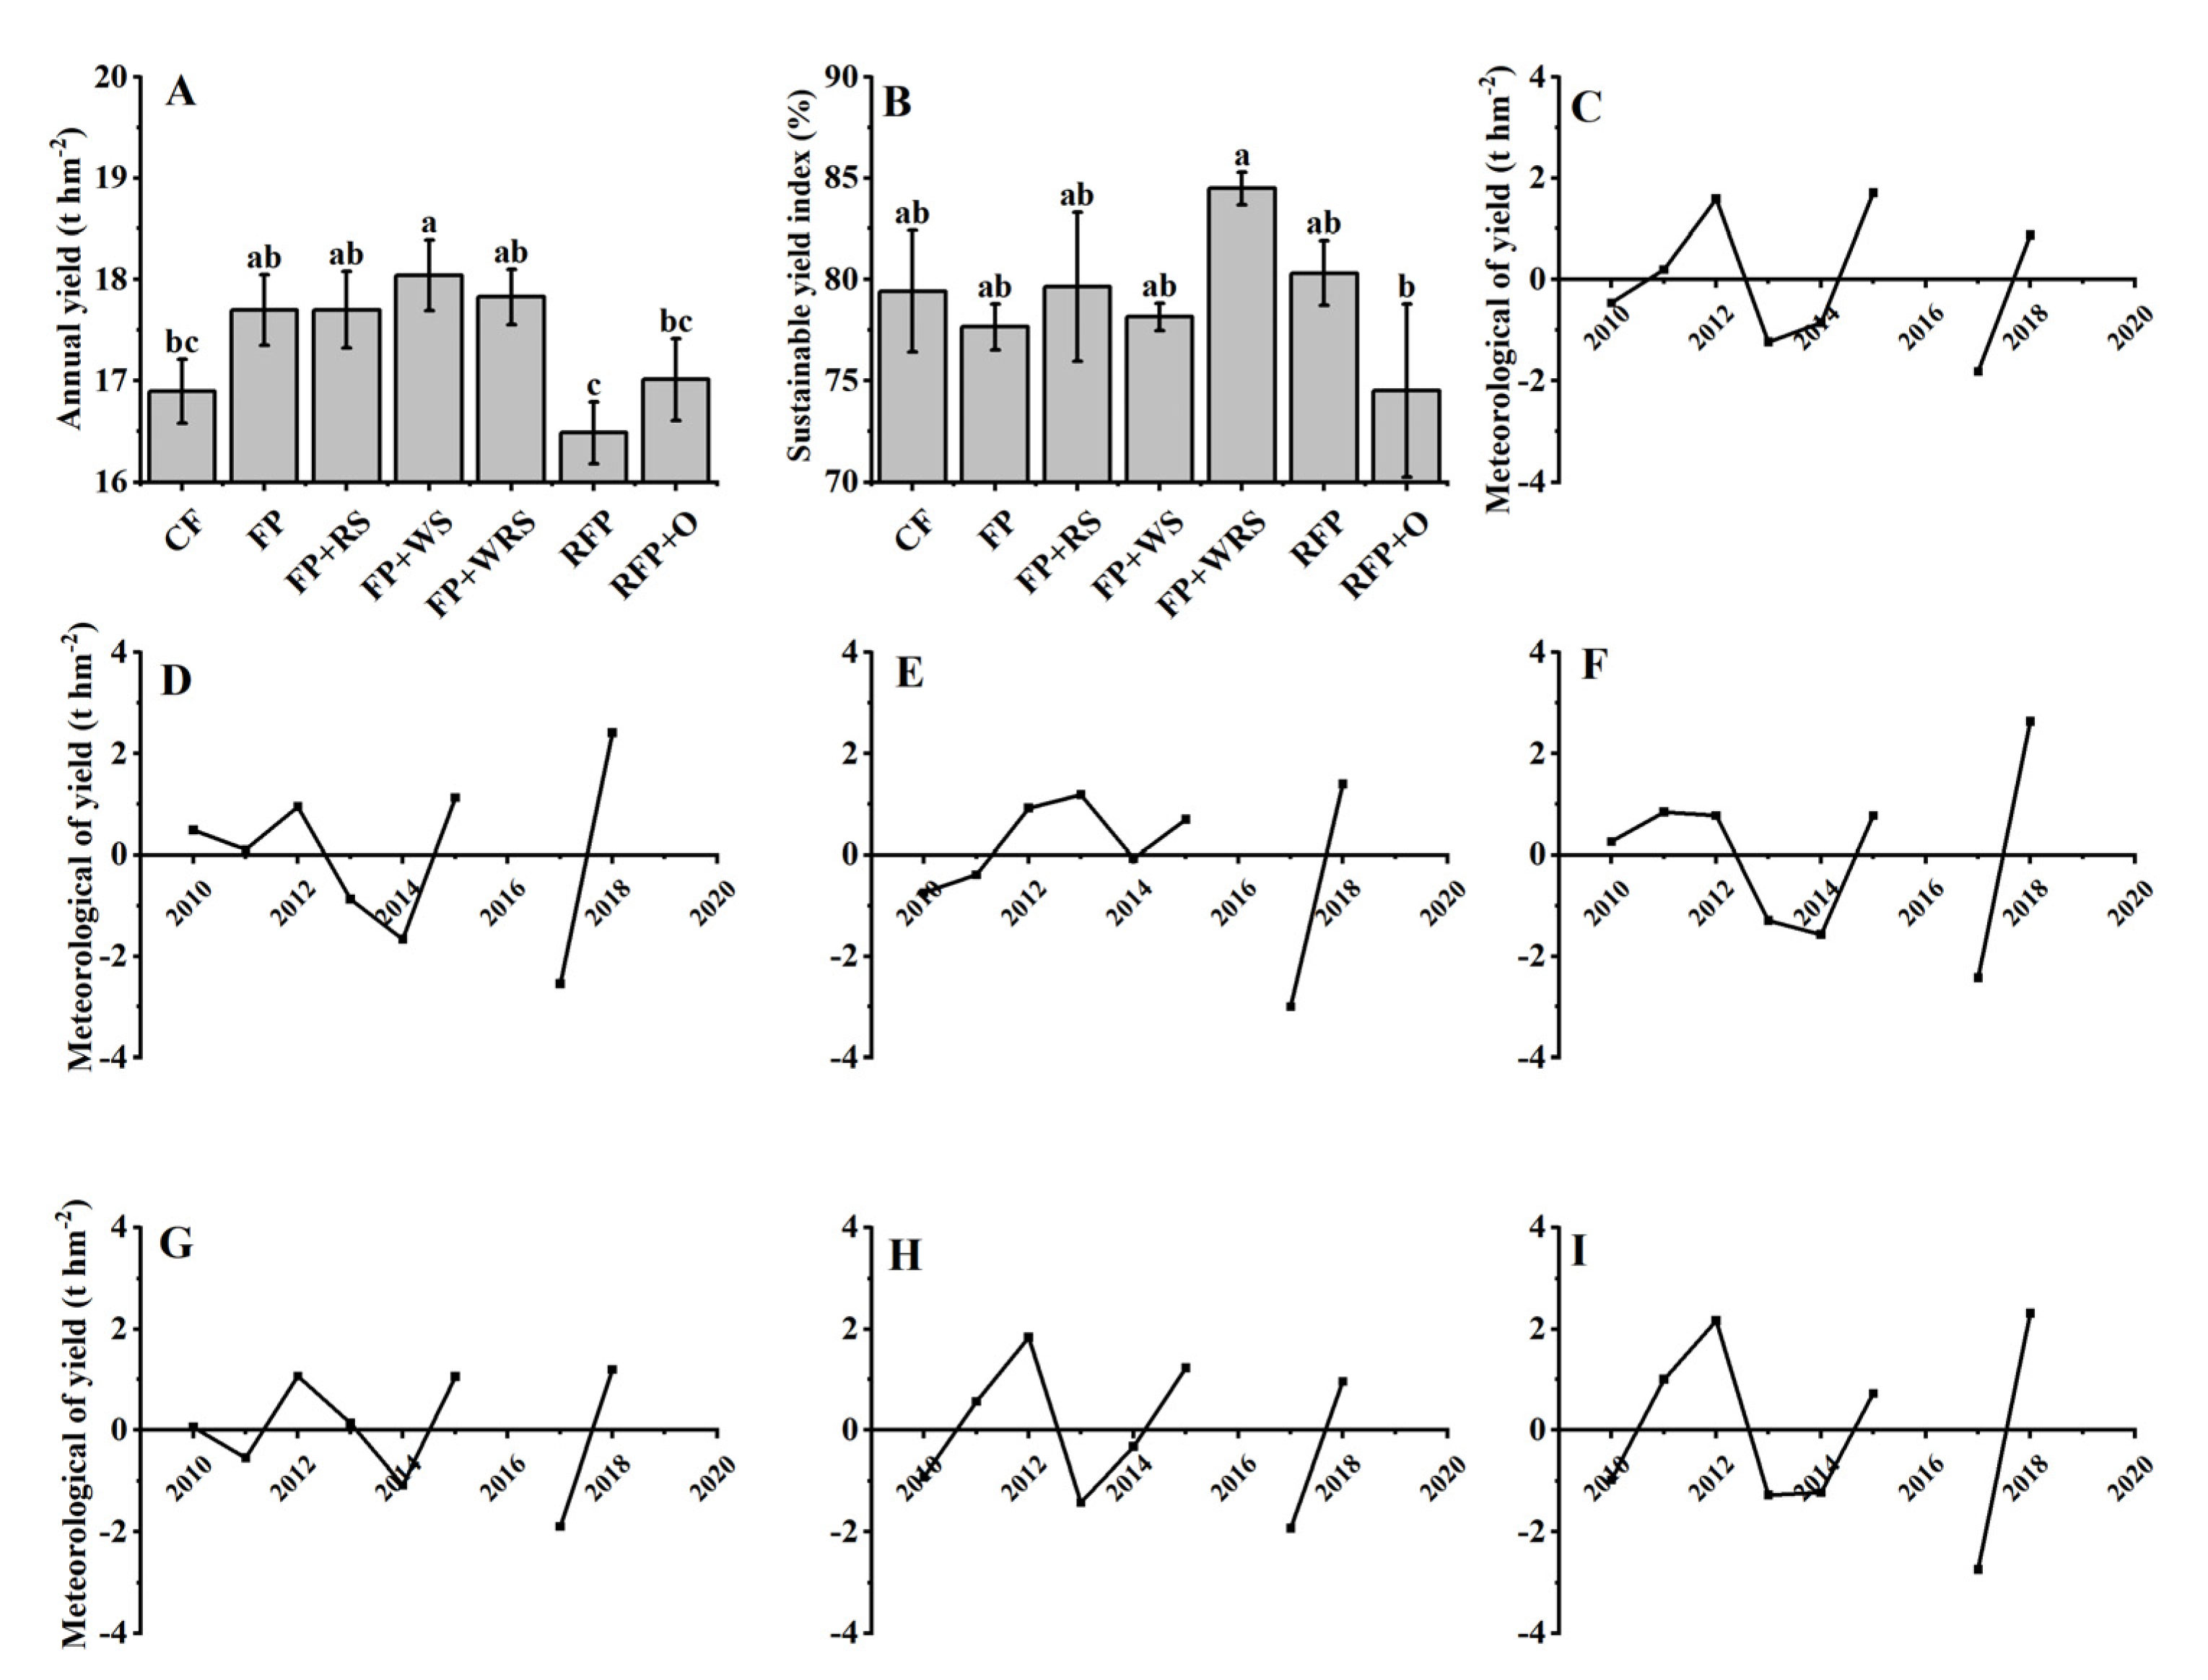
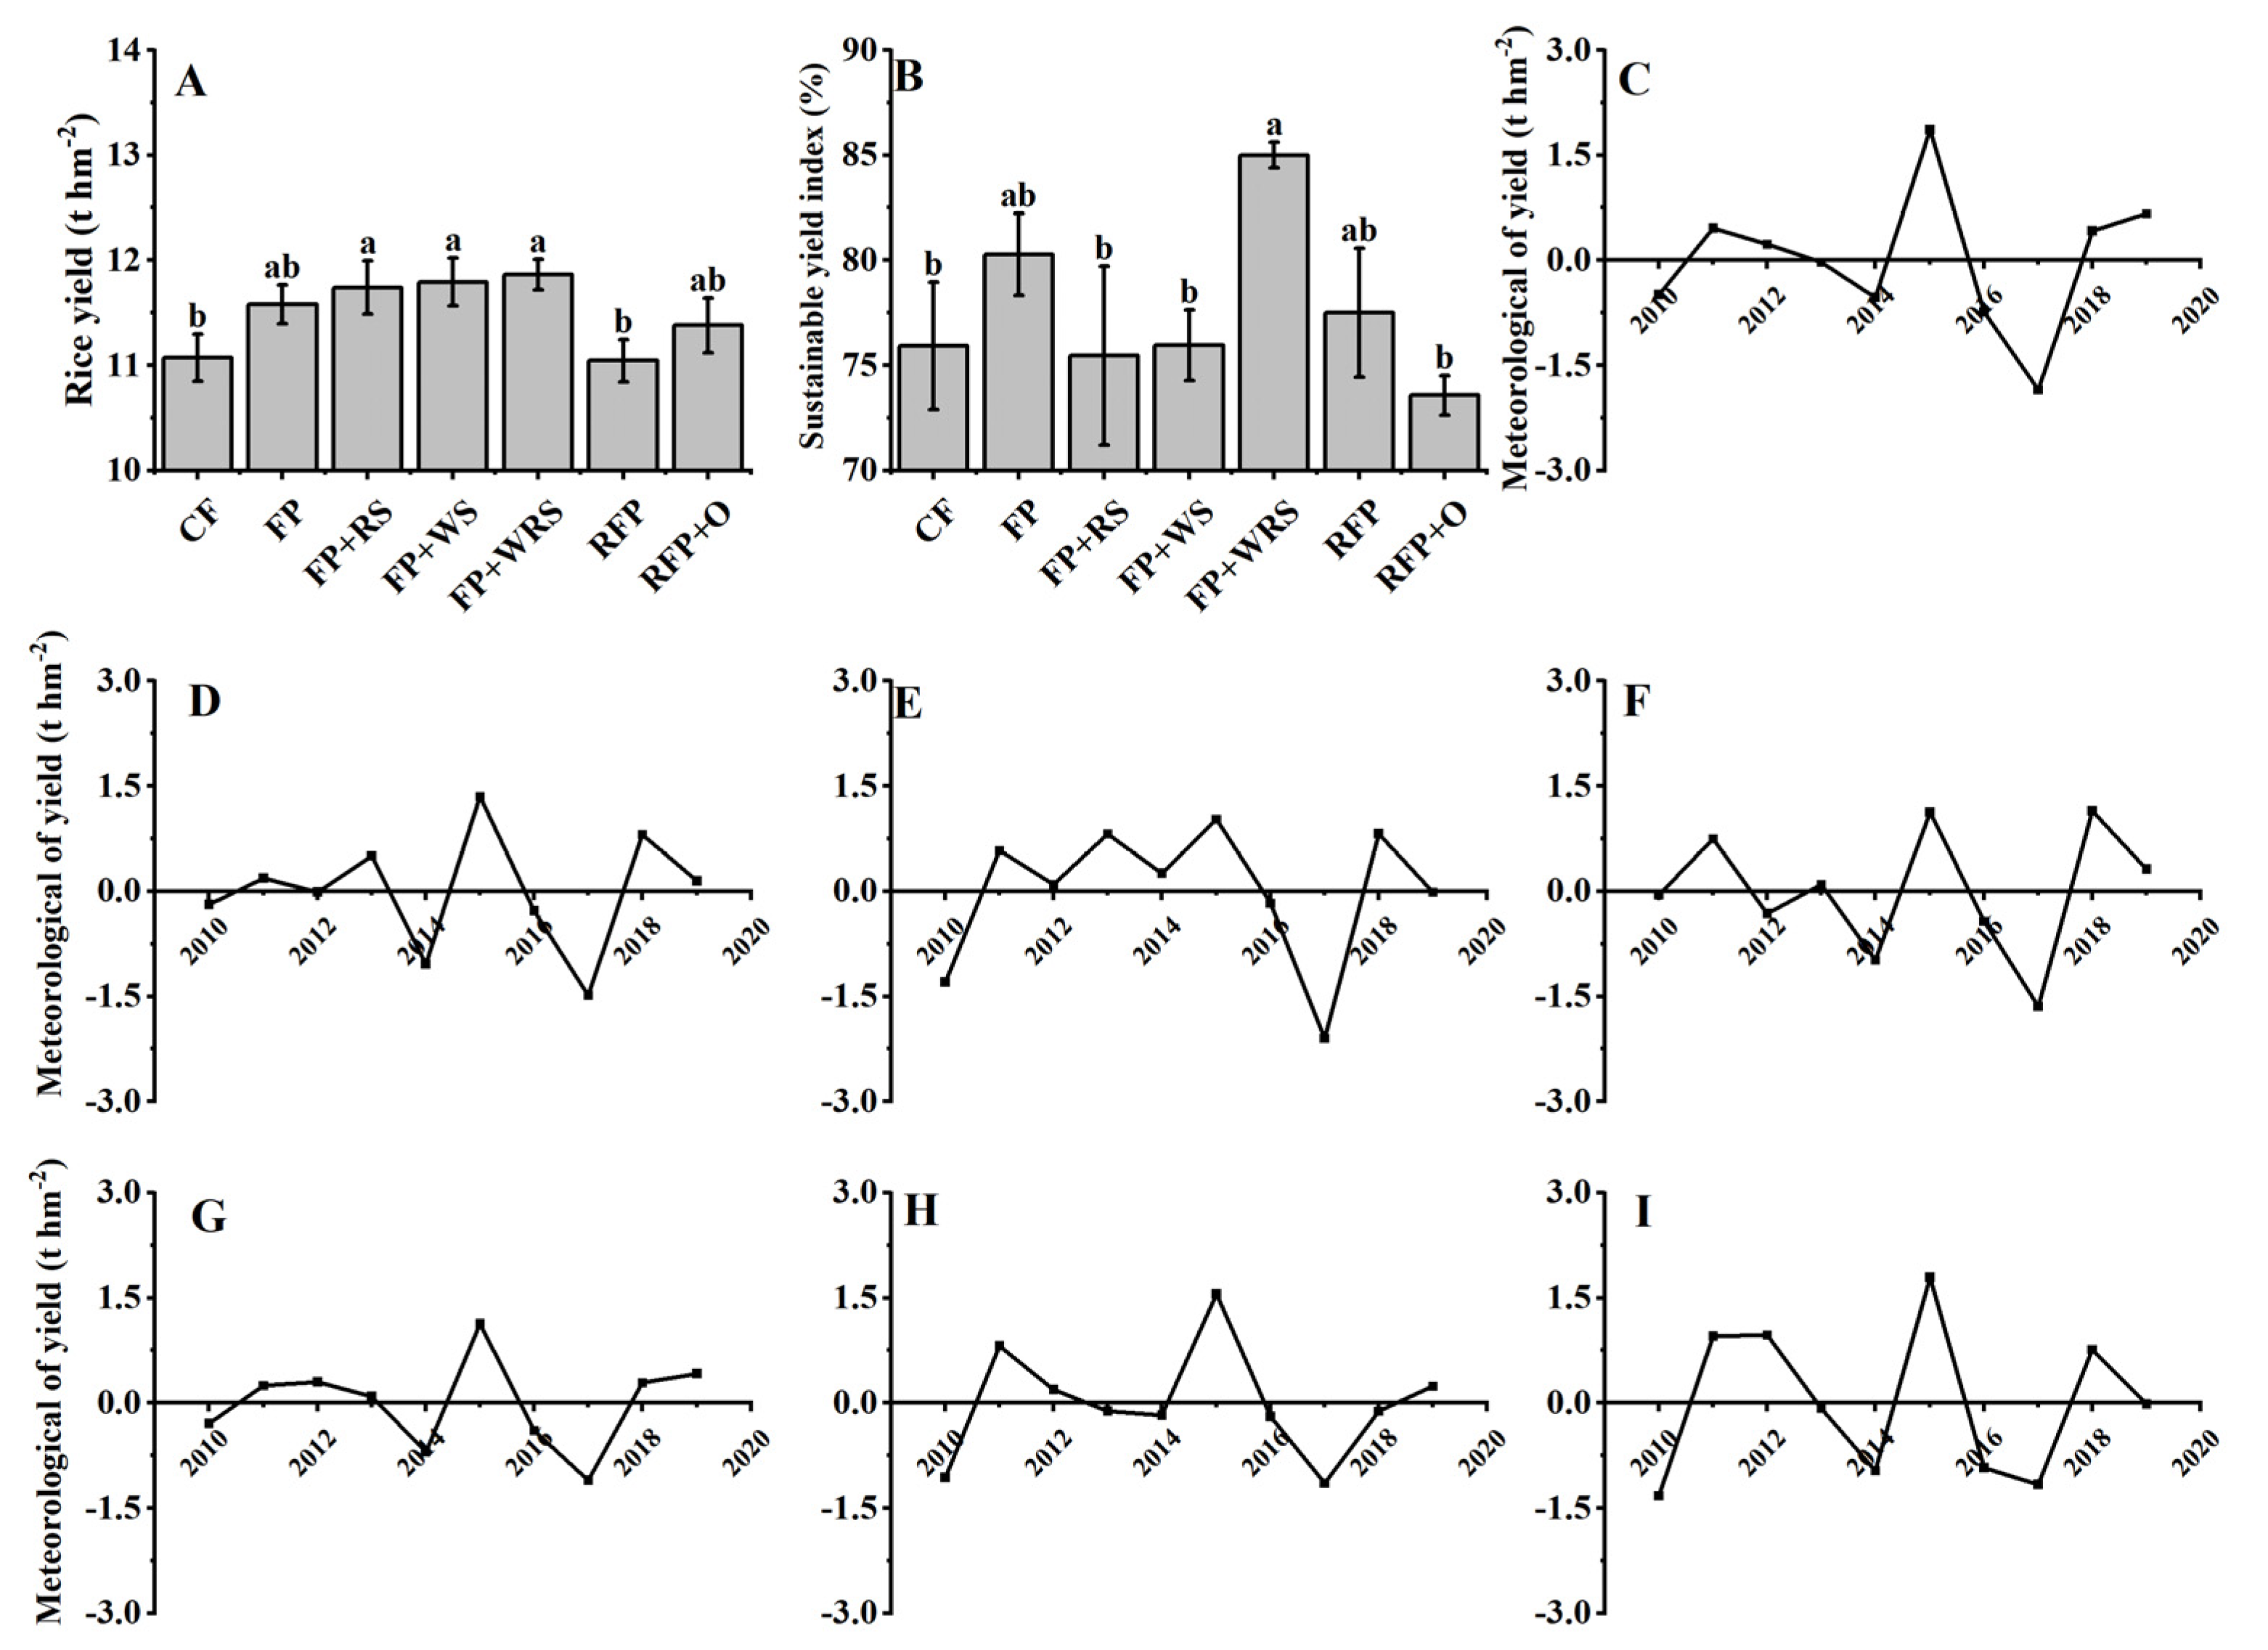
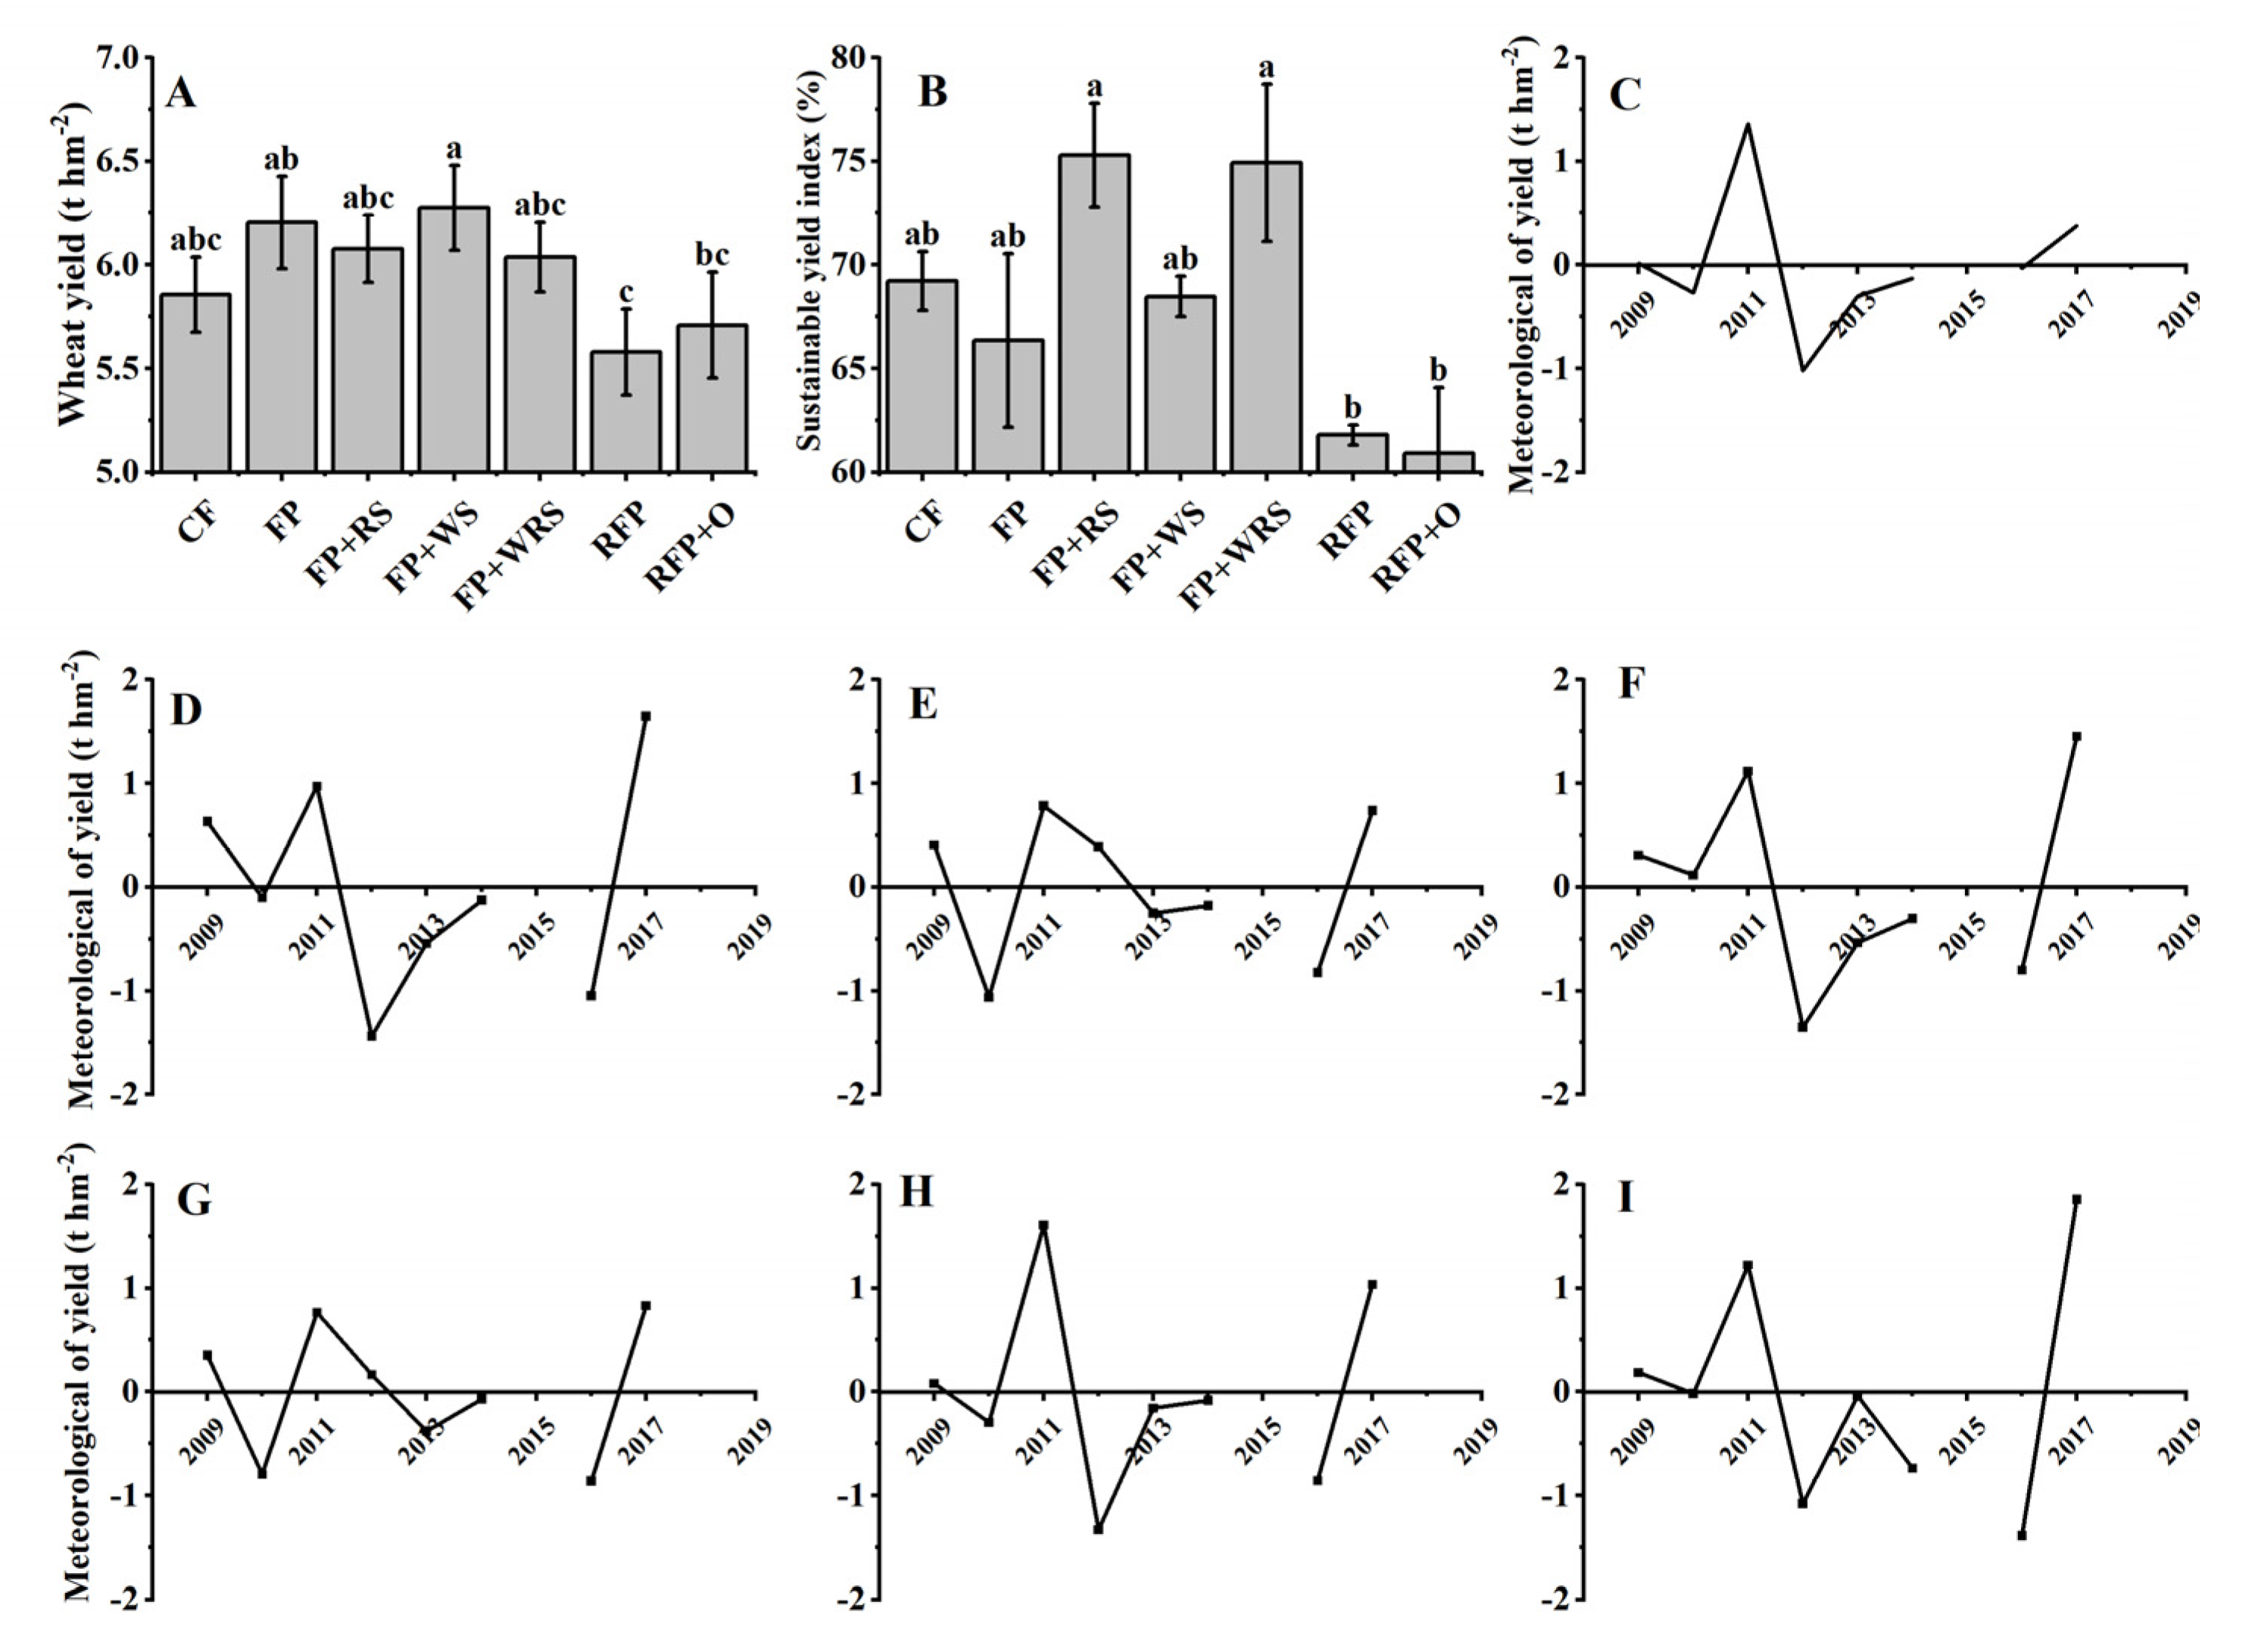
3.1. Yield and Yield Stability
3.1.1. Annual
3.1.2. Rice
3.1.3. Wheat
3.2. Yield Components
3.2.1. Rice
3.2.2. Wheat
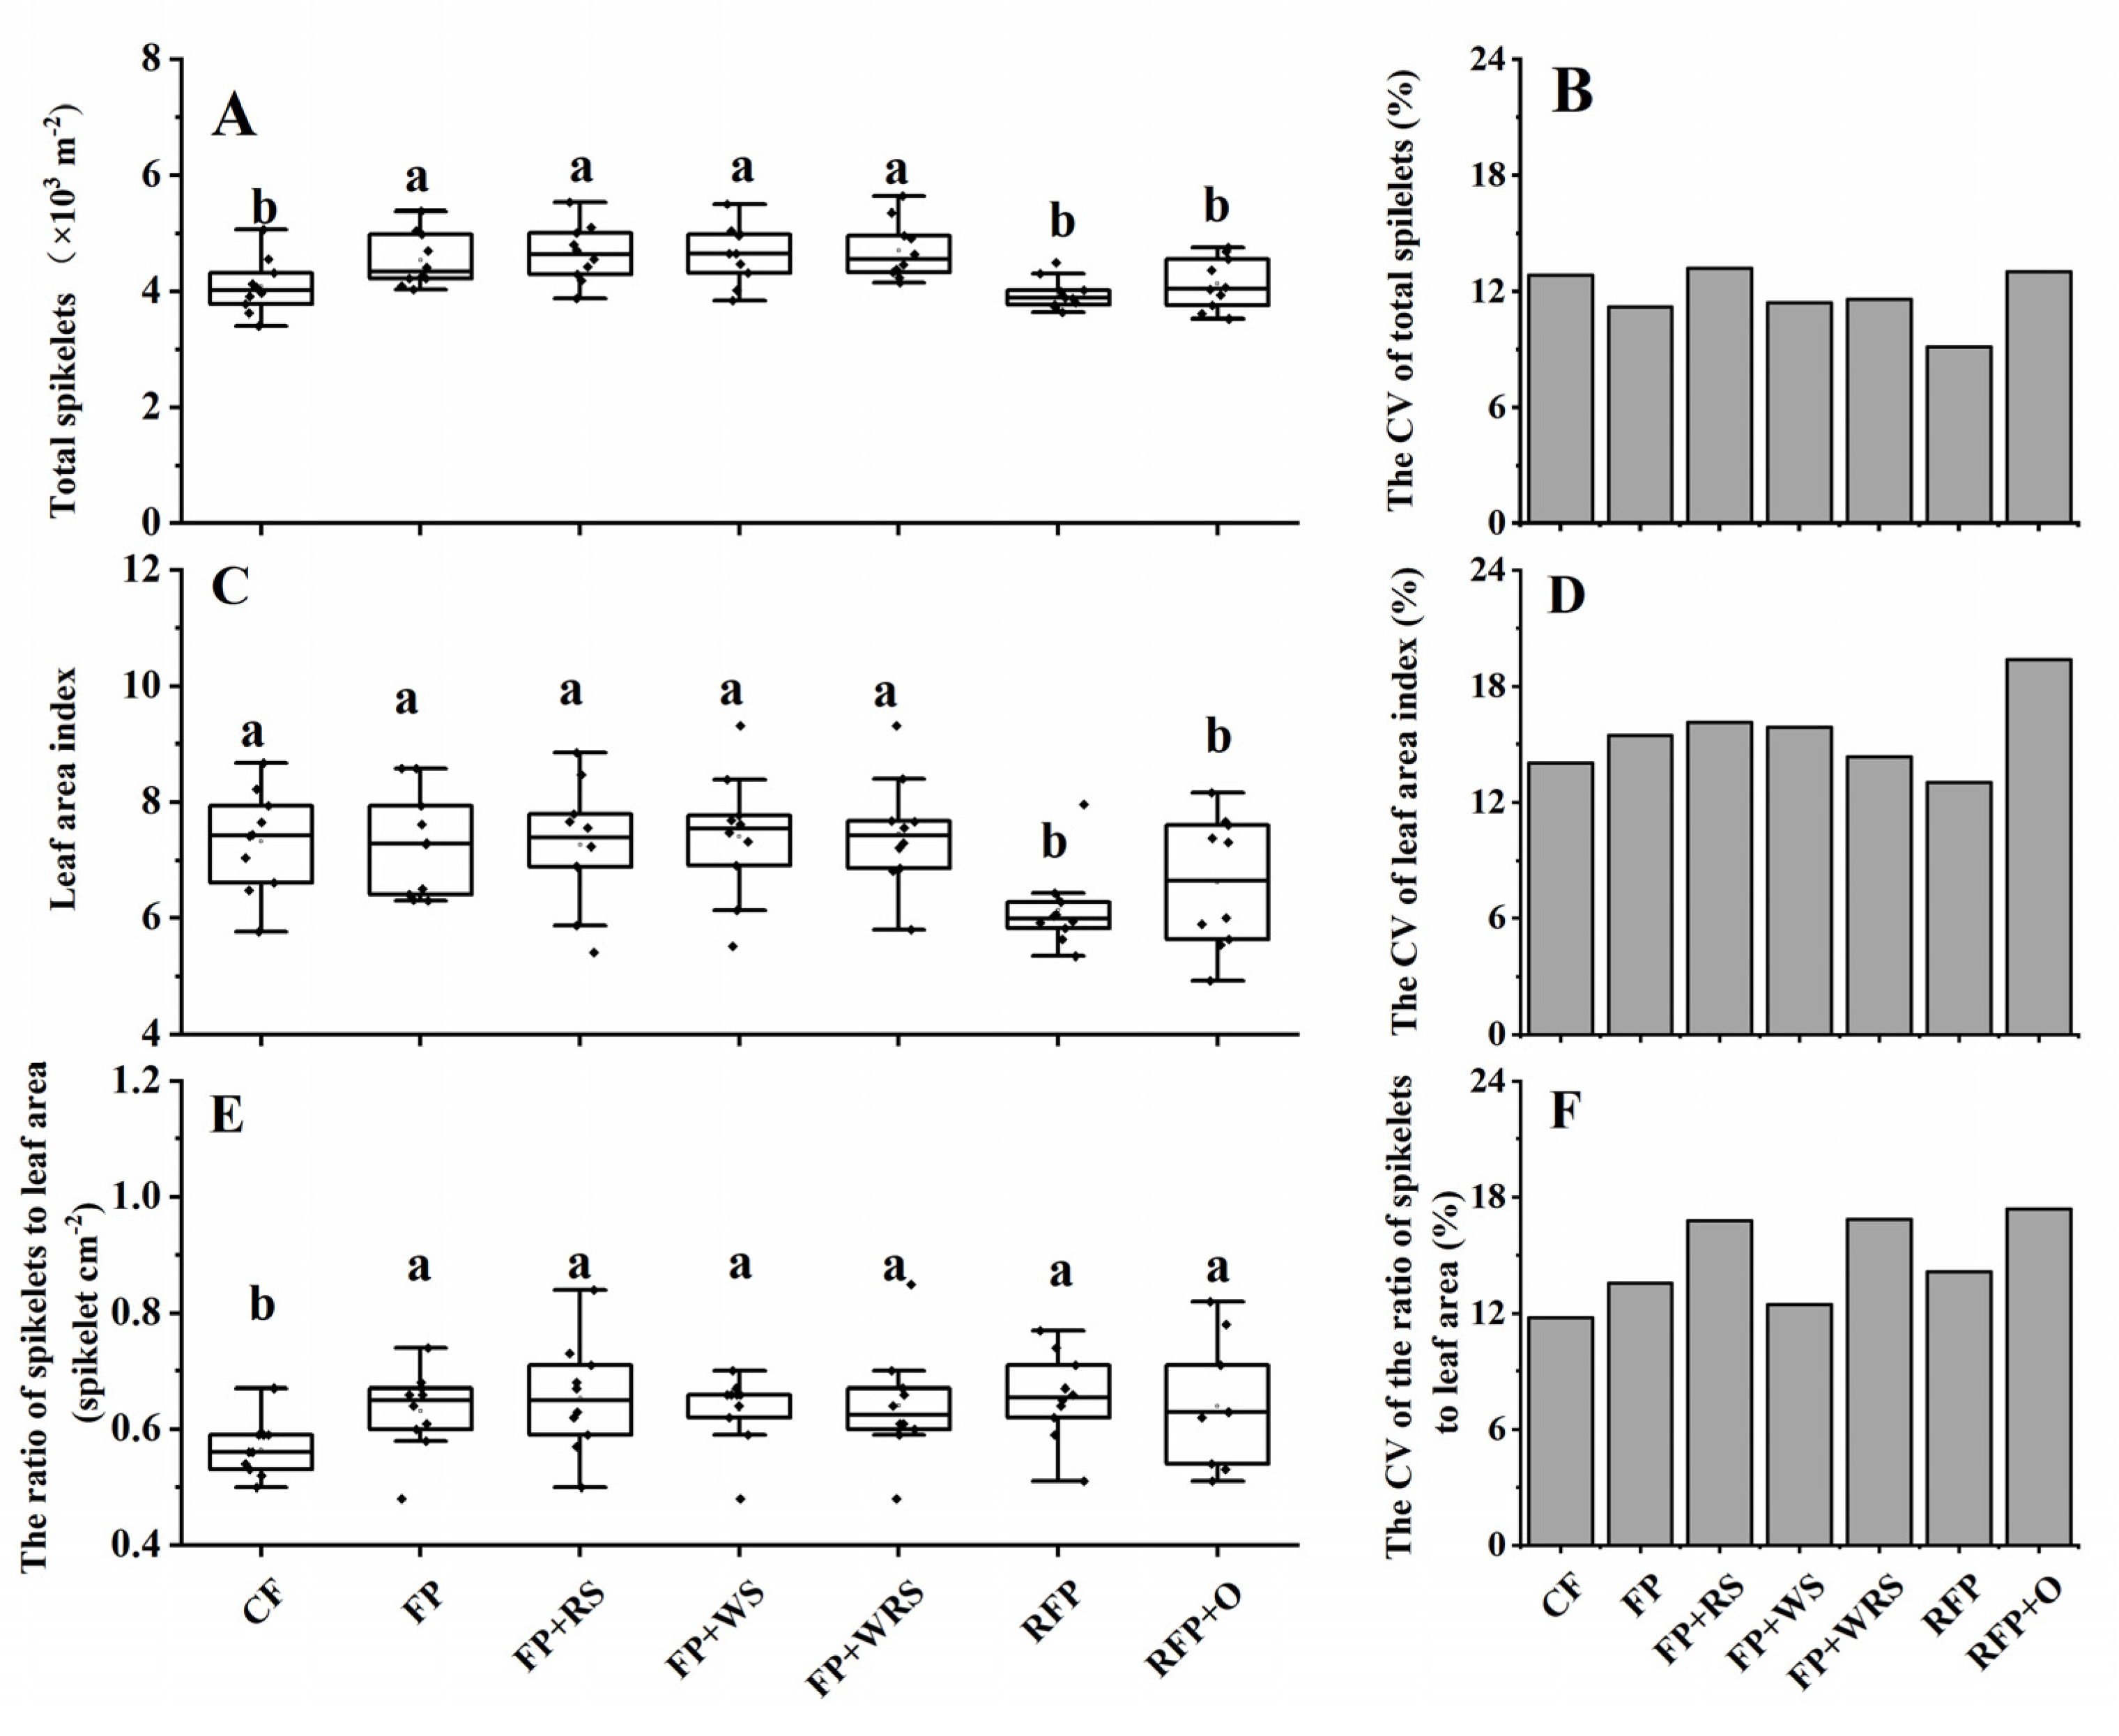
3.3. Source and Sink
3.3.1. Rice
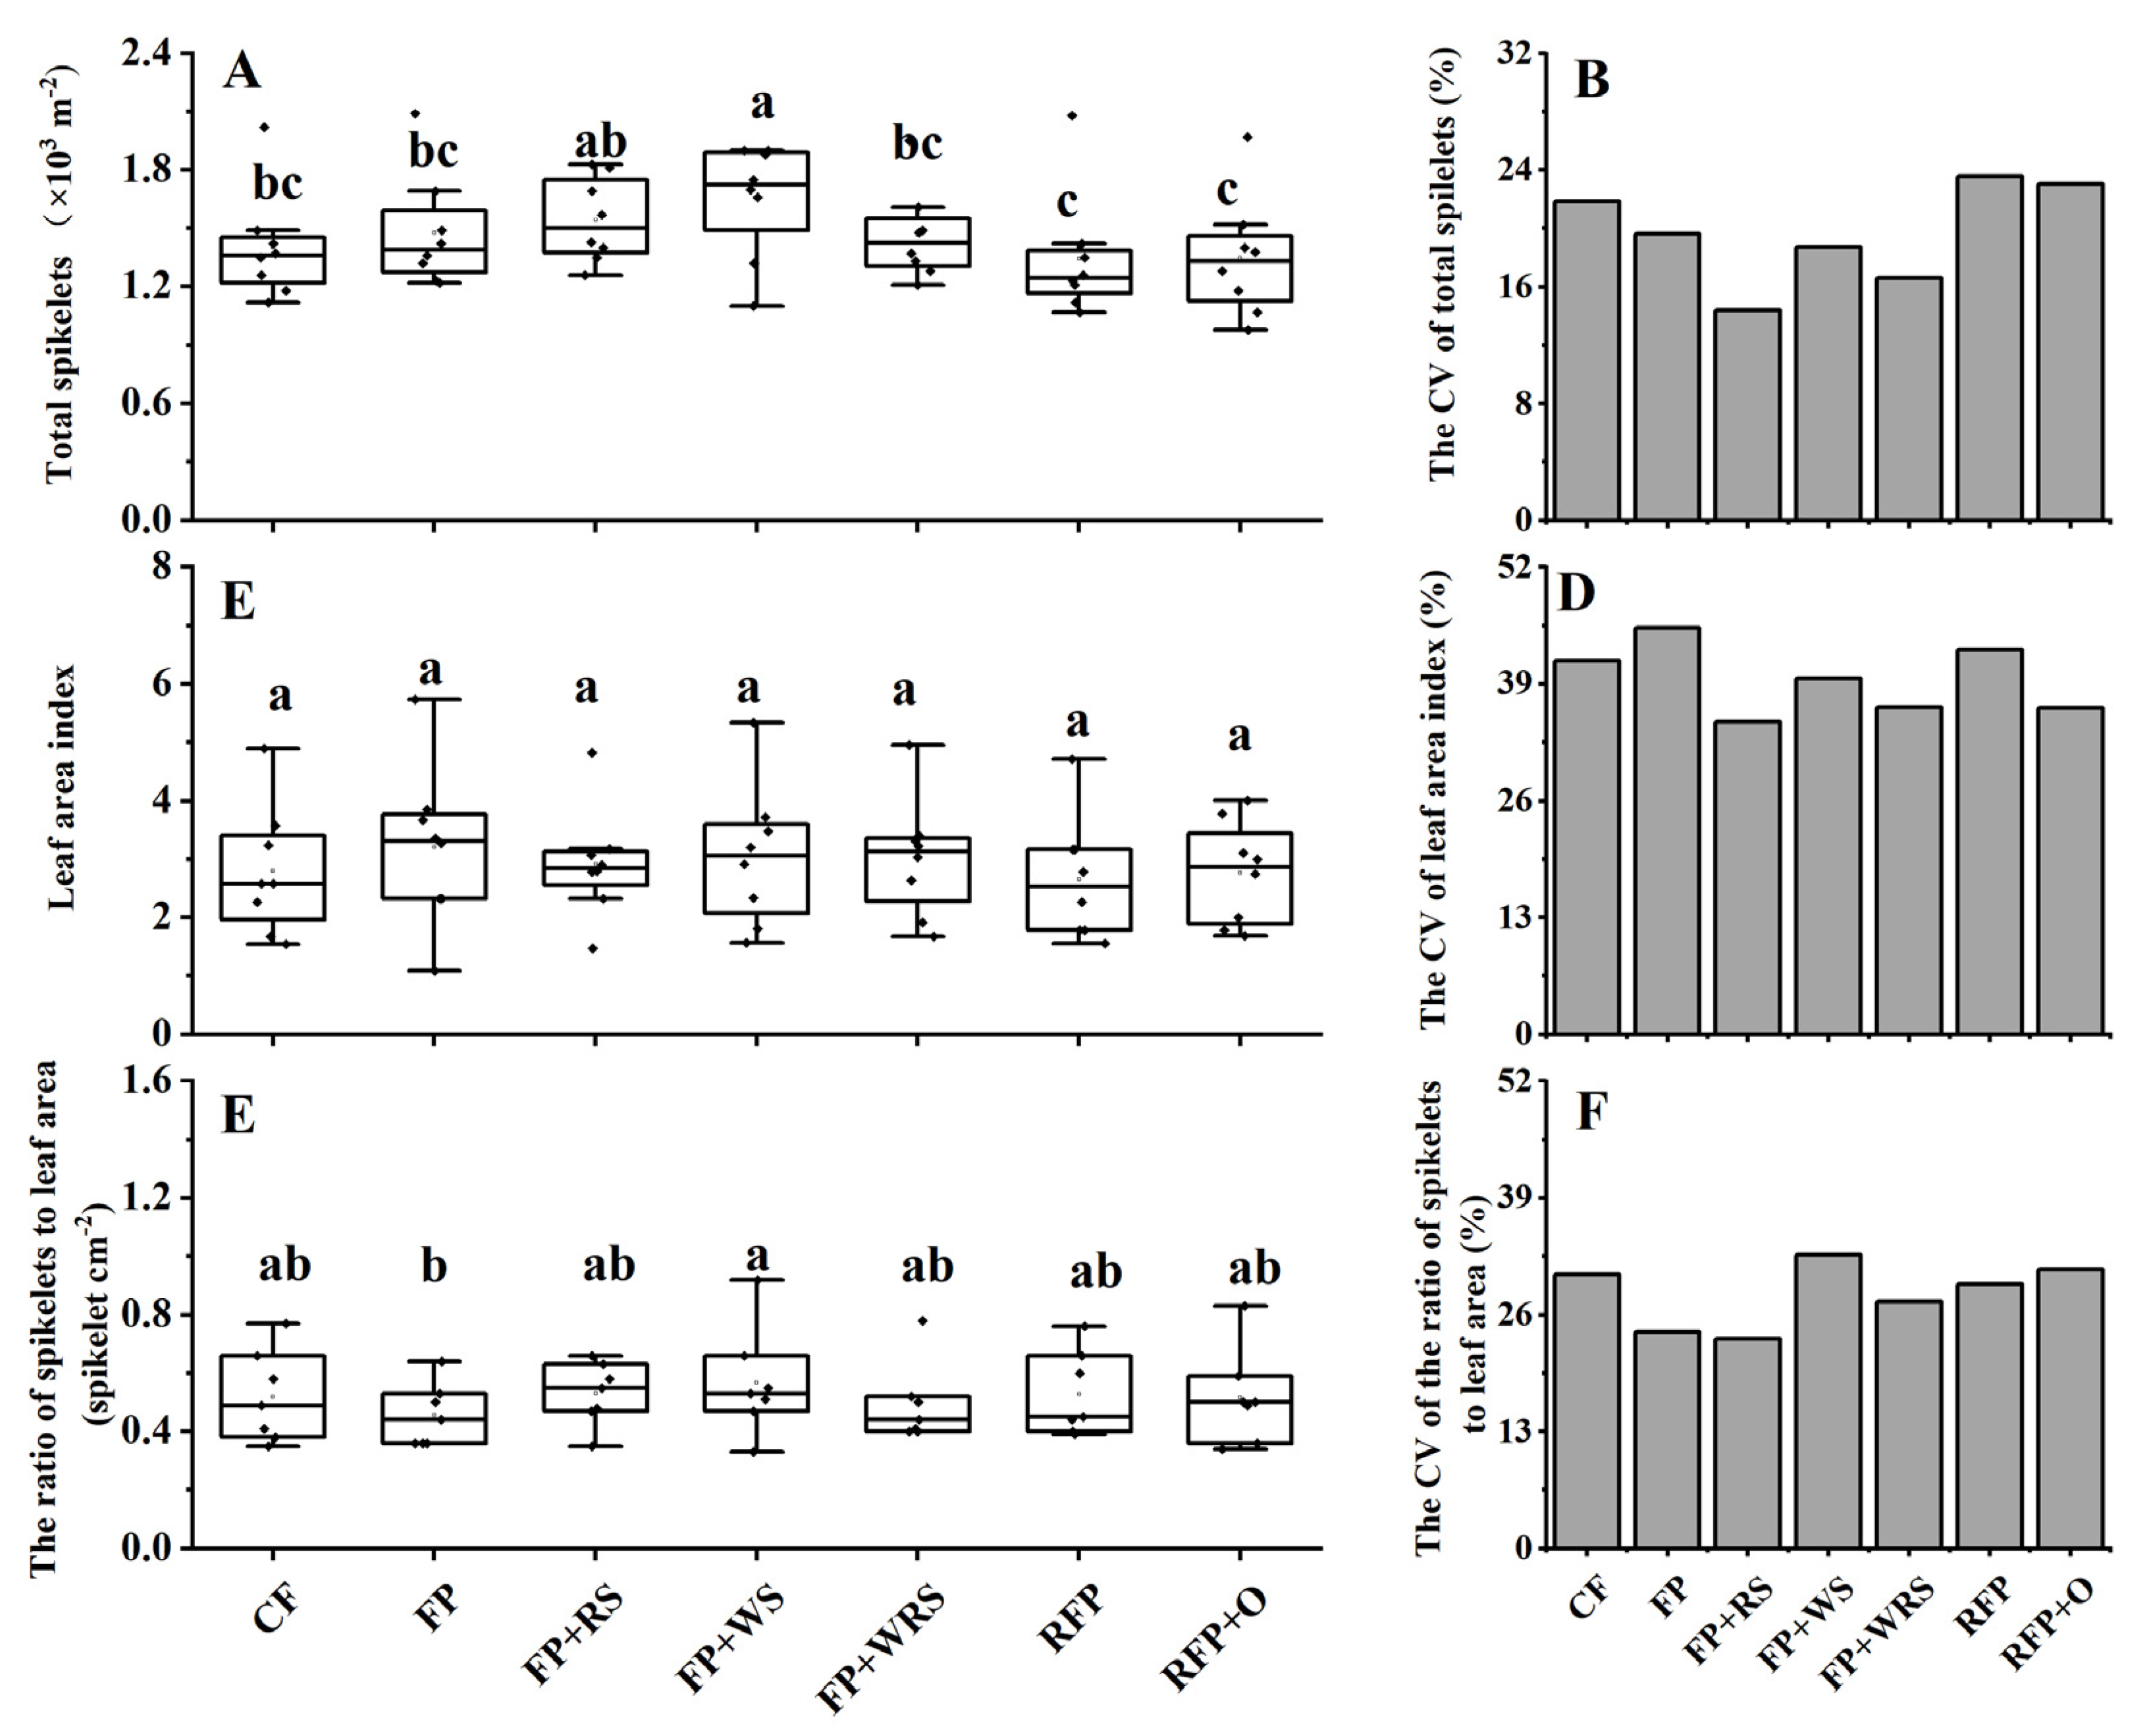
3.3.2. Wheat
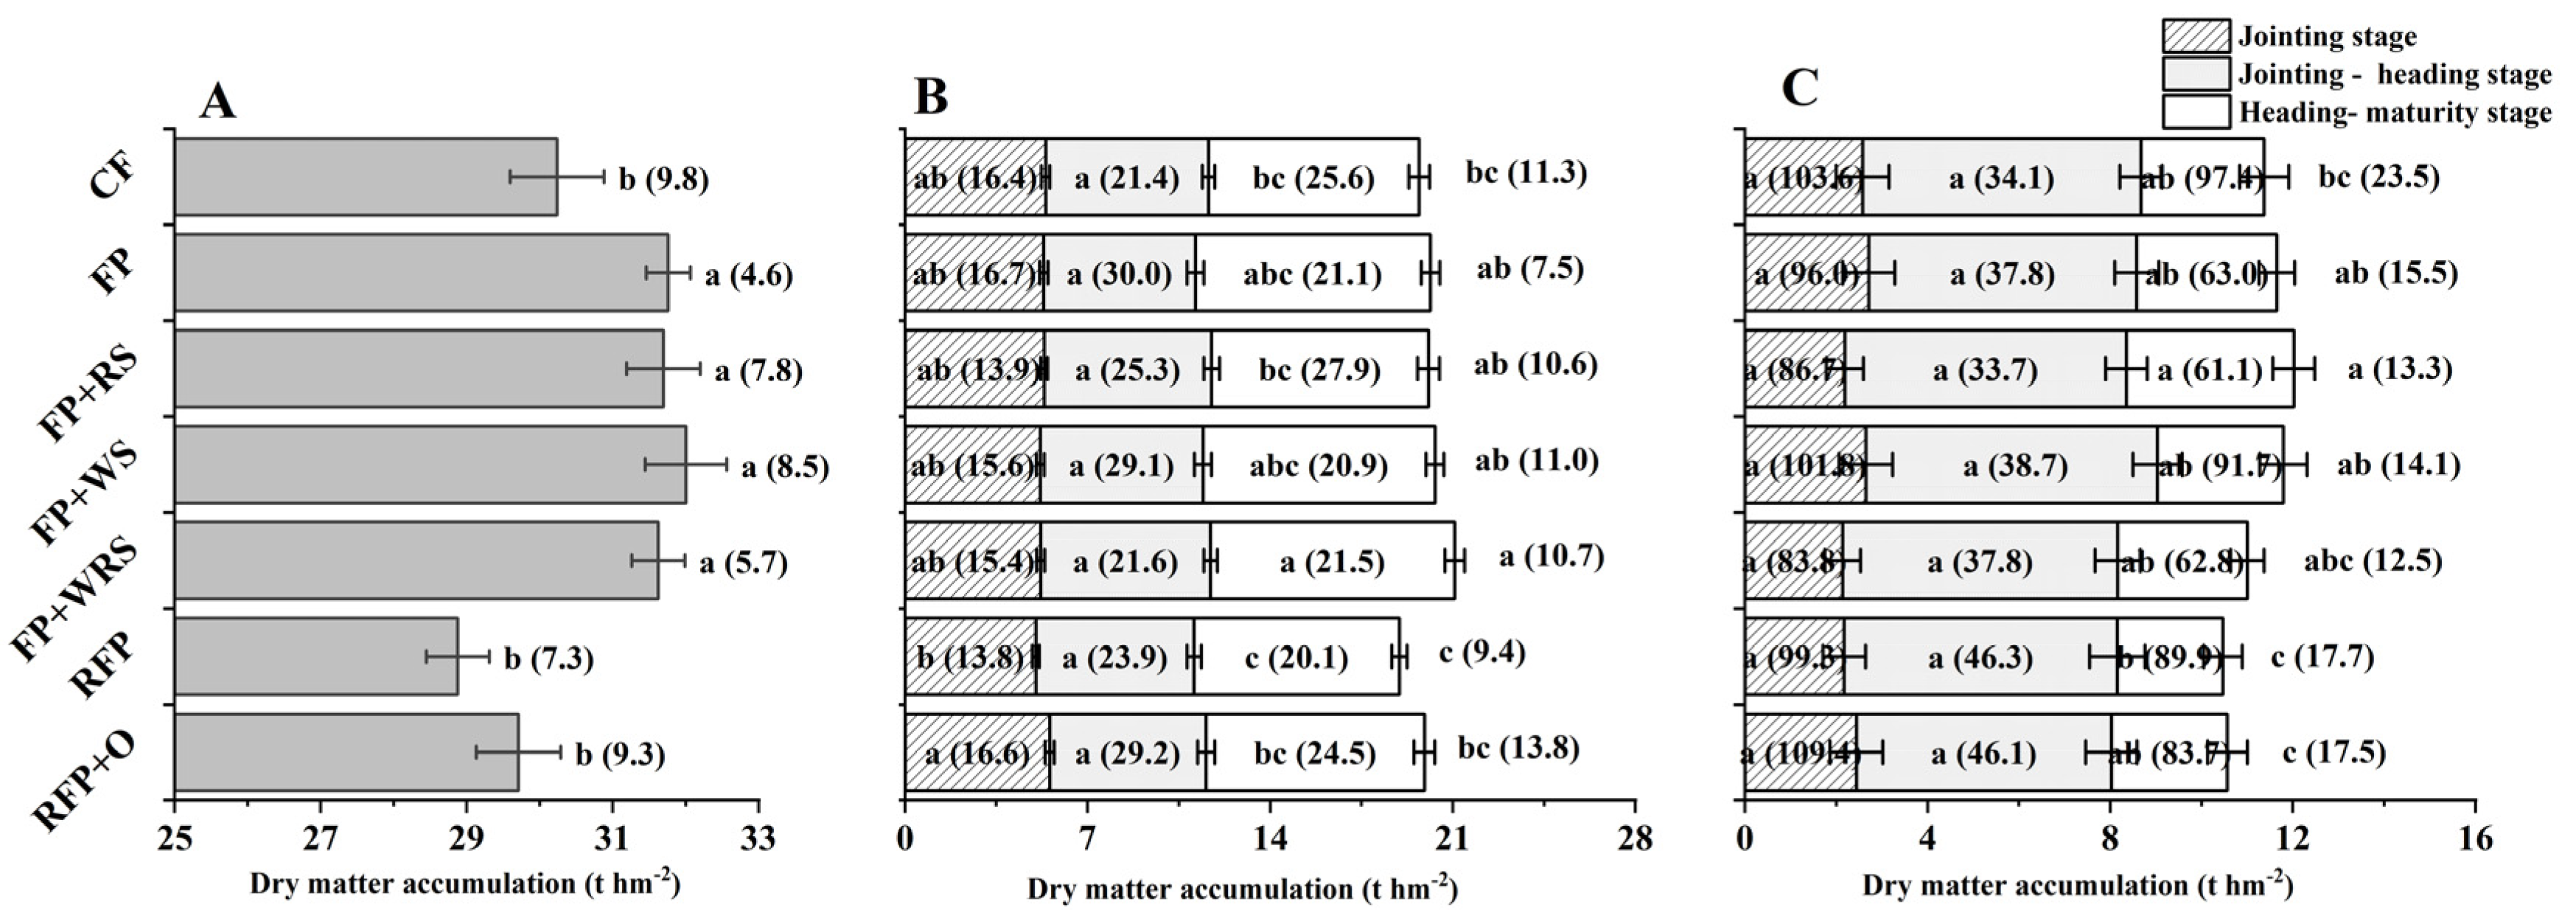
3.4. Dry Matter Accumulation
3.4.1. Annual
3.4.2. Rice
3.4.3. Wheat
3.5. The Relationship between Material Accumulation and Meteorological Factors
4. Discussion
4.1. Optimized Nutrient Strategy and High Annual Yield in Rice–Wheat System
4.2. Optimized Nutrient Strategy and Stability of Annual Yield in Rice–Wheat System
5. Conclusions
Supplementary Materials
Author Contributions
Funding
Acknowledge
Conflicts of Interest
References
- National Bureau of Statistics, PRC of the United Nations Data. Statistical Databases. 2021. Available online: http://www.stats.gov.cn/ (accessed on 20 December 2021).
- Bai, H.Z.; Tao, F.L. Sustainable intensification options to improve yield potential and eco-efficiency for rice-wheat rotation system in China. Field Crops Res. 2017, 211, 89–105. [Google Scholar] [CrossRef]
- Zhang, X.; Davidson, E.A.; Mauzerall, D.L.; Searchinger, T.D.; Dumas, P.; Shen, Y. Managing nitrogen for sustainable development. Nature 2015, 528, 51–59. [Google Scholar] [CrossRef] [PubMed] [Green Version]
- Chen, X.P.; Cui, Z.L.; Fan, M.S.; Vitousek, P.; Zhao, M.; Ma, W.Q.; Wang, Z.L.; Zhang, W.J.; Yan, X.Y.; Yang, J.C.; et al. Producing more grain with lower environmental costs. Nature 2014, 514, 486–489. [Google Scholar] [CrossRef]
- Peng, S.B.; Tang, Q.Y.; Zou, Y.B. Current Status and Challenges of Rice Production in China. Plant Prod. Sci. 2015, 12, 3–8. [Google Scholar] [CrossRef] [Green Version]
- Sui, B.; Feng, X.M.; Tian, G.L.; Hu, X.Y.; Shen, Q.R.; Guo, S.W. Optimizing nitrogen supply increases rice yield and nitrogen use efficiency by regulating yield formation factors. Field Crops Res. 2013, 150, 99–107. [Google Scholar] [CrossRef]
- IPCC. Climate Change 2021: The Physical Science Basis. Contribution of Working Group I to the Sixth Assessment Report of the Intergovernmental Panel on Climate Change; Masson-Delmotte, V., Zhai, P., Pirani, A., Connors, S.L., Péan, C., Berger, S., Caud, N., Chen, Y., Goldfarb, L., Gomis, M.I., Eds.; Cambridge University Press: Cambridge, UK, 2021. [Google Scholar]
- Ray, D.K.; Gerber, J.S.; MacDonald, G.K.; West, P.C. Climate variation explains a third of global crop yield variability. Nat. Commun. 2015, 6, 5989. [Google Scholar] [CrossRef] [Green Version]
- Gaupp, F.; Hall, J.; Hochrainer-Stigler, S.; Dadson, S. Changing risks of simultaneous global breadbasket failure. Nat. Clim. Chang. 2019, 10, 54–57. [Google Scholar] [CrossRef]
- Yin, H.J.; Zhao, W.Q.; Li, T.; Cheng, X.Y.; Liu, Q. Balancing straw returning and chemical fertilizers in China: Role of straw nutrient resources. Renew. Sustain. Energy Rev. 2018, 81, 2695–2702. [Google Scholar] [CrossRef]
- Zhang, H.C.; Wu, G.C.; Dai, Q.G.; Huo, Z.Y.; Xu, K.; Gao, H.; Wei, H.Y.; LÜ, X.T.; Wan, L.J.; Huang, Y.Z. Precise Postponing Nitrogen Application and Its Mechanism in Rice. Acta Agron. Sin. 2011, 37, 1837–1851. (In Chinese) [Google Scholar] [CrossRef]
- Ling, Q.H.; Zhang, H.C.; Dai, Q.G.; Ding, Y.F.; Ling, L.; Su, Z.F.; Xu, M.; Que, J.H.; Wang, S.H. Study on Precise and Quantitative N Application in Rice. Sci. Agric. Sin. 2005, 38, 2457–2467. (In Chinese) [Google Scholar]
- Xia, L.L.; Lam, S.K.; Wolf, B.; Kiese, R.; Chen, D.; Butterbach-Bahl, K. Trade-offs between soil carbon sequestration and reactive nitrogen losses under straw return in global agroecosystems. Glob. Chang. Biol. 2018, 24, 5919–5932. [Google Scholar] [CrossRef] [PubMed]
- Zhang, X.; Fang, Q.; Zhang, T.; Ma, W.; Velthof, G.L.; Hou, Y.; Oenema, O.; Zhang, F. Benefits and trade-offs of replacing synthetic fertilizers by animal manures in crop production in China: A meta-analysis. Glob. Chang. Biol. 2020, 26, 888–900. [Google Scholar] [CrossRef]
- Liu, C.; Lu, M.; Cui, J.; Li, B.; Fang, C.M. Effects of straw carbon input on carbon dynamics in agricultural soils: A meta-analysis. Glob. Chang. Biol. 2014, 20, 1366–1381. [Google Scholar] [CrossRef] [PubMed]
- Wang, J.; Fu, P.; Wang, F.; Fahad, S.; Mohapatra, P.K.; Chen, Y.; Zhang, C.; Peng, S.; Cui, K.; Nie, L.; et al. Optimizing nitrogen management to balance rice yield and environmental risk in the Yangtze River’s middle reaches. Environ. Sci. Pollut. Res. Int. 2019, 26, 4901–4912. [Google Scholar] [CrossRef] [PubMed]
- Zhang, Z.J.; Chu, G.; Liu, L.J.; Wang, Z.Q.; Wang, X.M.; Zhang, H.; Yang, J.C.; Zhang, J.H. Mid-season nitrogen application strategies for rice varieties differing in panicle size. Field Crops Res. 2013, 150, 9–18. [Google Scholar] [CrossRef]
- Zhu, X.K.; Zhu, M.; Ding, J.F.; Ding, Y.G.; Wang, Y.H.; Li, F.J.; Guo, W.S.; Tang, X.Q.; Du, T.Q.; Li, C.Y. Characteristics of yield components and population quality in high-nitrogen- utilization wheat cultivars. Acta Agron. Sin. 2020, 46, 544–556. (In Chinese) [Google Scholar] [CrossRef]
- Feng, D.J.; Mei, C.Y.; Jin, H.Z.; Yan, L.C.; Shan, G.W.; Kai, Z.X. Difference Analysis of Post-Anthesis Matter Production and Senescence Characteristics Among Different Nitrogen Efficiency Populations in Wheat Following Rice. Sci. Agric. Sin. 2015, 48, 1063–1073. (In Chinese) [Google Scholar]
- Zhang, J.W.; Li, W.W.; Zhou, Y.; Ding, Y.F.; Xu, L.; Jiang, Y.; Li, G.H. Long-term straw incorporation increases rice yield stability under high fertilization level conditions in the rice–wheat system. Crop J. 2021, 9, 1191–1197. [Google Scholar] [CrossRef]
- Wang, R.; Wang, Y.; Hu, Y.X.; Dang, T.H.; Guo, S.L. Divergent responses of tiller and grain yield to fertilization and fallow precipitation: Insights from a 28-year long-term experiment in a semiarid winter wheat system. J. Integr. Agric. 2021, 20, 3003–3011. [Google Scholar] [CrossRef]
- Guo, S.L.; Zhu, H.H.; Dang, T.H.; Wu, J.S.; Liu, W.Z.; Hao, M.D.; Li, Y.; Syers, J.K. Winter wheat grain yield associated with precipitation distribution under long-term nitrogen fertilization in the semiarid Loess Plateau in China. Geoderma 2012, 189–190, 442–450. [Google Scholar] [CrossRef]
- Muhammad, Q.; Huang, J.; Waqas, A.; Li, D.C.; Liu, S.J.; Lu, Z.; Cai, A.D.; Liu, L.S.; Xu, Y.M.; Gao, J.S.; et al. Yield sustainability, soil organic carbon sequestration and nutrients balance under long-term combined application of manure and inorganic fertilizers in acidic paddy soil. Soil Tillage Res. 2020, 198, 104569. [Google Scholar]
- Li, C.X.; Ma, S.C.; Shao, Y.; Ma, S.T.; Zhang, L.L. Effects of long-term organic fertilization on soil microbiologic characteristics, yield and sustainable production of winter wheat. J. Integr. Agric. 2018, 17, 210–219. [Google Scholar] [CrossRef] [Green Version]
- Peng, S.B.; Huang, J.L.; Sheehy, J.E.; Laza, R.C.; Visperas, R.M.; Zhong, X.H.; Centeno, G.S.; Khush, G.S.; Cassman, K.G. Rice yields decline with higher night temperature from global warming. Proc. Natl. Acad. Sci. USA 2004, 101, 9971–9975. [Google Scholar] [CrossRef] [PubMed] [Green Version]
- Kingra, P.K.; Setia, R.; Kaur, J.; Singh, S.; Singh, S.P.; Kukal, S.S.; Pateriya, B. Assessing the impact of climate variations on wheat yield in north-west India using GIS. Spat. Inf. Res. 2018, 26, 281–294. [Google Scholar] [CrossRef]
- Zheng, D.X.; Yang, X.G.; Mínguez, M.I.; Mu, C.Y.; He, Q.; Wu, X. Effect of freezing temperature and duration on winter survival and grain yield of winter wheat. Agric. For. Meteorol. 2018, 260–261, 1–8. [Google Scholar] [CrossRef]
- Sanchez, B.; Rasmussen, A.; Porter, J.R. Temperatures and the growth and development of maize and rice: A review. Glob. Chang. Biol. 2014, 20, 408–417. [Google Scholar] [CrossRef] [PubMed]
- Espe, M.B.; Hill, J.E.; Hijmans, R.J.; McKenzie, K.; Mutters, R.; Espino, L.A.; Leinfelder-Miles, M.; Kessel, C.V.; Linquist, B.A. Point stresses during reproductive stage rather than warming seasonal temperature determine yield in temperate rice. Glob. Chang. Biol. 2017, 23, 4386–4395. [Google Scholar] [CrossRef]
- Deng, N.; Grassini, P.; Yang, H.; Huang, J.; Cassman, K.G.; Peng, S.B. Closing yield gaps for rice self-sufficiency in China. Nat. Commun. 2019, 10, 1725. [Google Scholar] [CrossRef] [PubMed] [Green Version]
- Feng, D.J.; Feng, Y.J.; Cui, W.Y.; Fang, C.F.; Nian, F.C.; Kai, Z.X.; Yan, L.C.; Xin, P.Y.; Shan, G.W. Accumulation and Distribution Characteristics of Dry Matter of Super High Yield Wheat under Rice Stubble in Middle and Lower Reaches of the Yangtse River. J. Triticeae Crops 2012, 32, 1118–1123. (In Chinese) [Google Scholar]
- Jin, Z.Q.; Shah, T.; Zhang, L.; Liu, H.Y.; Peng, S.B.; Nie, L.X. Effect of straw returning on soil organic carbon in rice–wheat rotation system: A review. Food Energy Secur. 2020, 9, e200. [Google Scholar] [CrossRef] [Green Version]
- Zheng, J.C.; Zhang, G.; Wang, D.J.; Cao, Z.Q.; Wang, C.; Yan, D.Z. Effects of straw incorporation on nitrogen absorption of split fertilizer applications and on rice growth. Emir. J. Food Agric. 2019, 31, 59–68. [Google Scholar]
- Chen, X.B.; Xia, Y.H.; Rui, Y.C.; Ning, Z.; Hu, Y.J.; Tang, H.M.; He, H.B.; Li, H.X.; Kuzyakov, Y.; Ge, T.D.; et al. Microbial carbon use efficiency, biomass turnover, and necromass accumulation in paddy soil depending on fertilization. Agric. Ecosyst. Environ. 2020, 295, 106867. [Google Scholar] [CrossRef]
- Röll, G.; Batchelor, W.; Castro, A.; Simón, M.; Graeff-Hönninger, S. Development and Evaluation of a Leaf Disease Damage Extension in Cropsim-CERES Wheat. Agronomy 2019, 9, 120. [Google Scholar] [CrossRef] [Green Version]
- Liu, X.; Xu, S.S.; Zhang, J.W.; Ding, Y.F.; Li, G.H.; Wang, S.H.; Liu, Z.H.; Tang, S.; Ding, C.Q.; Chen, L. Effect of continuous reduction of nitrogen application to a rice-wheat rotation system in the middle-lower Yangtze River region (2013–2015). Field Crops Res. 2016, 196, 348–356. [Google Scholar] [CrossRef]
- Fu, H.R.; Li, T.Y.; Cao, H.B.; Zhang, W.F. Research on the driving factors of fertilizer reduction in China. J. Plant Nutr. Fertil. 2020, 26, 561–580. (In Chinese) [Google Scholar]
- Li, Y.B.; Li, P.; Wang, S.H.; Xu, L.Y.; Deng, J.J.; Jiao, J.G. Effects of organic fertilizer application on crop yield and soil properties in rice-wheat rotation system: A meta-analysis. Chin. J. AppL. Ecol. 2021, 32, 3231–3239. (In Chinese) [Google Scholar]
- Yang, J.; Gao, W.; Ren, S.R. Long-term effects of combined application of chemical nitrogen with organic materials on crop yields, soil organic carbon and total nitrogen in fluvo-aquic soil. Soil Tillage Res. 2015, 151, 67–74. [Google Scholar] [CrossRef]
- Pang, J.F.; Li, G.H.; Cui, K.H. Re-partitioning of Non-structural Carbohydrates in Rice Stems and Their Roles in Yield Stability and Stress Tolerance. Chin. J. Rice Sci. 2014, 28, 335–342. (In Chinese) [Google Scholar]
- Wang, X.L.; Mao, X.W. Analysis of interannual variations of rainfall runoff Jiangsu Taihu Lake basin. J. Water Resour. Water Eng. 2013, 24, 203–205. (In Chinese) [Google Scholar]
- Yan, L.; Xue, L.H.; Hou, P.F.; Fu, X.D.; Ying, H.S.; Liang, Y.Y.; Zhang, Y.L. Temporal characteristics of runoff-occurrence in rain-fed wheat fields in typical areas of the Tai-lake region, China. J. Agro-Environ. Sci. 2020, 39, 1043–1050. (In Chinese) [Google Scholar]
- Han, J.L.; Yang, Q.; Wang, W.P.; Li, Y.S.; Fu, Z.Y. Effect of sowing date on the caulis and tillers differentiation of young spike and yield in winter wheat. J. Triticeae Crops 2011, 31, 303–307. (In Chinese) [Google Scholar]
- Bao, Y.X.; Wang, Y.; Gao, P.; Sheng, S.H. Occurrence Pattern on Spring Frost Injury of Winter Wheat in Jiangsu Province and Its Climatic Risk Division. Chin. J. Agrometeorol. 2012, 1, 123–141. (In Chinese) [Google Scholar]
- Xu, Y.D.; Ding, X.L.; Lal, R.; Gao, X.D.; Li, S.Y.; Sun, L.J.; Wang, Y.; Li, M.; Bai, S.B.; Wang, J.K. Effect of soil fertility on the allocation of nitrogen derived from different maize residue parts in the soil-plant system. Geoderma 2020, 379, 114632. [Google Scholar] [CrossRef]
- Zhang, Y.H. China’s agriculture had entered the age of high cost how to enhance the competitiveness of translation. Rural. Prosec. Manag. 2017, 172, 18–21. (In Chinese) [Google Scholar]
- Ke, J.; Xing, X.M.; Li, G.H.; Ding, Y.F.; Dou, F.G.; Wang, S.H.; Liu, Z.H.; Tang, S.; Ding, C.Q.; Chen, L. Effects of different controlled-release nitrogen fertilisers on ammonia volatilisation, nitrogen use efficiency and yield of blanket-seedling machine-transplanted rice. Field Crops Res. 2017, 205, 147–156. [Google Scholar] [CrossRef]
- Song, D.L.; Hou, S.P.; Wang, X.G.; Liang, G.Q.; Zhou, W. Nutrient resource quantity of crop straw and its potential of substituting. J. Plant Nutr. Fertil. 2018, 24, 1–21. (In Chinese) [Google Scholar]
- Bai, H.Z.; Tao, F.L.; Xiao, D.P.; Liu, F.S.; Zhang, H. Attribution of yield change for rice-wheat rotation system in China to climate change, cultivars and agronomic management in the past three decades. Clim. Chang. 2015, 135, 539–553. [Google Scholar] [CrossRef]


| CF | FP | FP + RS | FP + WS | FP + RWS | RFP | RFP + O | |
|---|---|---|---|---|---|---|---|
| Total nitrogen | 300–225 * | 300–225 | 300–225 | 300–225 | 300–225 | 198–180 | 198–180 |
| Basal | 150–125 | 120–90 | 120–90 | 120–90 | 120–90 | 79.2–72 | 79.2–72 |
| Tilling | 75–0 | 60–45 | 60–45 | 60–45 | 60–45 | 39.6–36 | 39.6–36 |
| Spikelets-promoting | 75–100 | 60–45 | 60–45 | 60–45 | 60–45 | 39.6–36 | 39.6–36 |
| Spikelets-protecting | - | 60–45 | 60–45 | 60–45 | 60–45 | 39.6–36 | 39.6–36 |
| Total phosphorous (P2O5) | 150–105 | 150–105 | 150–105 | 150–105 | 150–105 | 120–90 | 120–90 |
| Basal | 150–105 | 75–60 | 75–60 | 75–60 | 75–60 | 60–45 | 60–45 |
| Jointing | - | 75–45 | 75–45 | 75–45 | 75–45 | 60–45 | 60–45 |
| Total potassium (K2O) | 240–105 | 240–105 | 240–105 | 240–105 | 240–105 | 180–90 | 180–90 |
| Basal | 240–105 | 120–60 | 120–60 | 120–60 | 120–60 | 90–45 | 90–45 |
| Jointing | - | 120–45 | 120–45 | 120–45 | 120–45 | 90–45 | 90–45 |
| Straw # | 0–9750 | 6000–0 | 6000–9750 | - | - | ||
| Organic fertilizer ## | - | - | - | - | - | - | 1800–3000 |
| Rice | Wheat | ||||||
|---|---|---|---|---|---|---|---|
| Panicles (m−2) | Spikelets per Panicle | Seeding Rate (%) | Grain Weight (mg) | Spikes (m−2) | Spikelets per Spike | Grain Weight (mg) | |
| Mean | |||||||
| CF | 327 ab | 125 c | 90.5 a | 30.6 b | 391 a | 36.9 ab | 41.9 a |
| FP | 343 a | 133 bc | 85.3 c | 30.5 b | 406 a | 37.1 ab | 42.4 a |
| FP + RS | 345 a | 135 b | 86.2 bc | 30.6 b | 400 a | 39.6 a | 41.2 a |
| FP + WS | 346 a | 134 b | 85.7 c | 30.5 b | 415 a | 40.5 a | 40.3 a |
| FP + WRS | 336 a | 140 a | 85.2 c | 30.5 b | 387 a | 38.4 ab | 42.0 a |
| RFP | 306 c | 129 c | 89.6 a | 31.5 a | 388 a | 35.4 b | 42.0 a |
| RFP + O | 318 bc | 130 bc | 89.3 ab | 31.2 ab | 386 a | 35.5 b | 42.6 a |
| CF | 11.6 | 9.9 | 5.7 | 4.1 | 27.0 | 18.4 | 10.6 |
| FP | 9.8 | 7.8 | 7.6 | 5.9 | 19.9 | 17.4 | 12.4 |
| FP + RS | 9.2 | 8.0 | 8.6 | 5.0 | 17.5 | 19.0 | 9.7 |
| FP + WS | 9.4 | 7.1 | 9.1 | 5.4 | 18.8 | 17.9 | 12.4 |
| FP + WRS | 11.0 | 5.3 | 9.2 | 5.7 | 17.0 | 16.1 | 10.9 |
| RFP | 9.2 | 6.2 | 6.6 | 6.2 | 24.0 | 18.6 | 9.7 |
| RFP + O | 9.7 | 8.2 | 6.7 | 5.8 | 18.8 | 20.9 | 10.6 |
| Rice | Wheat | ||||
|---|---|---|---|---|---|
| Meteorological Parameters | Partial Regression Coefficient | R2 | Meteorological Parameters | Partial Regression Coefficient | R2 |
| TS-JS | SS-JS | ||||
| PARA | 0.49 ** | 0.22 ** | PARA | 0.45 ** | 0.77 ** |
| RD | 0.49 ** | ||||
| TD | 0.56 ** | ||||
| JS-HS | JS-HS | ||||
| PAR | 0.52 ** | 0.260 ** | TMin | −0.65 ** | 0.40 * |
| HS-MS | HS-MS | ||||
| RD | −0.60 ** | 0.344 ** | TMin | −0.65 ** | 0.55 * |
| RD | −0.23 ** | ||||
Publisher’s Note: MDPI stays neutral with regard to jurisdictional claims in published maps and institutional affiliations. |
© 2022 by the authors. Licensee MDPI, Basel, Switzerland. This article is an open access article distributed under the terms and conditions of the Creative Commons Attribution (CC BY) license (https://creativecommons.org/licenses/by/4.0/).
Share and Cite
Zhang, G.; Zhang, J.; Xu, L.; Zhou, Y.; Hou, P.; Yang, F.; Li, W.; Liu, Z.; Ding, Y.; Li, G. Study on the Nutrient Optimal Management Strategy of High and Stable Annual Yield in the Rice–Wheat System: A 10-Year Term Experiment. Agronomy 2022, 12, 698. https://0-doi-org.brum.beds.ac.uk/10.3390/agronomy12030698
Zhang G, Zhang J, Xu L, Zhou Y, Hou P, Yang F, Li W, Liu Z, Ding Y, Li G. Study on the Nutrient Optimal Management Strategy of High and Stable Annual Yield in the Rice–Wheat System: A 10-Year Term Experiment. Agronomy. 2022; 12(3):698. https://0-doi-org.brum.beds.ac.uk/10.3390/agronomy12030698
Chicago/Turabian StyleZhang, Guofa, Jianwei Zhang, Lei Xu, Yan Zhou, Pengfu Hou, Fei Yang, Weiwei Li, Zhenghui Liu, Yanfeng Ding, and Ganghua Li. 2022. "Study on the Nutrient Optimal Management Strategy of High and Stable Annual Yield in the Rice–Wheat System: A 10-Year Term Experiment" Agronomy 12, no. 3: 698. https://0-doi-org.brum.beds.ac.uk/10.3390/agronomy12030698