Article

Critical Agronomic Practices for Establishing the Recently Domesticated Perennial Herbaceous Forage Legume Tedera in Mediterranean-like Climatic Regions in Western Australia

Department of Primary Industries and Regional Development (DPIRD), Perth, WA 6151, Australia
Submission received: 23 December 2021 / Revised: 4 January 2022 / Accepted: 20 January 2022 / Published: 21 January 2022

Abstract

:
Tedera is a Mediterranean perennial herbaceous forage legume that remains green during summer and autumn with minimal leaf drop when grown in the medium to low rainfall zones of Western Australia. This unique attribute allows out-of-growing-season grazing that can complement the traditional grazing system based on winter annual species. Tedera is a traditional rangeland forage in the Canary Islands, where it recruits naturally from seed. Now, following its domestication, an agronomy package needs to be developed to allow reliable establishment of commercial plantings. From 2017 to 2020, experiments were conducted at Cunderdin, Dandaragan, Three Springs, Manjimup, and Merredin in WA using the tedera cultivar Lanza®. The experiments evaluated four sowing times, two sowing depths in the field sites, six sowing depths in a glasshouse experiment, three sowing rates, and three row spacings. Plant counts, establishment percentages, and dry matter biomass productions were measured. Based on this experimental experience it is concluded that Lanza® tedera performs best if sown just before or early after the start of the rainy season, at 2 cm of depth, with a 15 kg/ha sowing rate, and at a row spacing of 22 cm.

1. Introduction

Tedera is the local name for Bituminaria bituminosa C.H. Stirton var. albomarginata in the Canary Islands, Spain, where it is a component of native rangeland pastures. Tedera is a traditional forage that is directly grazed by livestock or cut and carried as hay for dairy goats [1,2,3]. Tedera has now been developed as an herbaceous perennial forage legume for use in Mediterranean-like environments across southern Australia [4,5]. The main distinctive attribute of tedera is its drought tolerance that allows it to remain green during summer and autumn with minimal leaf drop when grown in the medium and medium to low rainfall zones of Western Australia [6]. Tedera has a range of mechanisms that confer the observed drought adaptation and high water use efficiency [7,8,9]. In its native environment, tedera is found in areas with as low as 150 mm of annual rainfall with 4 or 5 months in summer without significant rainfall [10,11].
A species that can provide reliable out-of-growing-season green forage is highly valuable for livestock systems in Mediterranean-like climates [12]. Four grazing experiments were conducted during summer and autumn in Western Australia from 2014 to 2017. These experiments demonstrated that tedera can be reliably grown as a monoculture and preserved as green pasture to be grazed directly by sheep or cattle to fill feed gaps and/or to reduce expensive supplementary feeding during summer and autumn [13].
For any novel forage species, an agronomy management package needs to be developed to ensure it is sown in the right place, at the right time, with the right planting technology to optimize the economic benefits to the environment and farming system.
In this article, key agronomic variables for a successful establishment were evaluated. Experimental results are presented for times of sowing, sowing depths, sowing density and row spacing. It is hypothesized that: (1) in Mediterranean-like environments with medium to low rainfall and mild winters, sowing as early as possible after the first autumn/winter rains is likely to allow tedera to develop a deep root system to survive the first dry season/s; (2) from a range of sowing depths from 2 cm to 12 cm, a sowing depth of 4 cm to 6 cm will be optimal; (3) the highest sowing rates will produce the most productive stands; and (4) the wider the row spacing of 66 cm will favor plant survival and result in more productivity at times of water deficit during summer and autumn.

2. Materials and Methods

2.1. Experimental Site Details

The tedera agronomy experiments were sown in 2017 and 2018 at six sites in Western Australia. Details of each site are presented in Table 1.

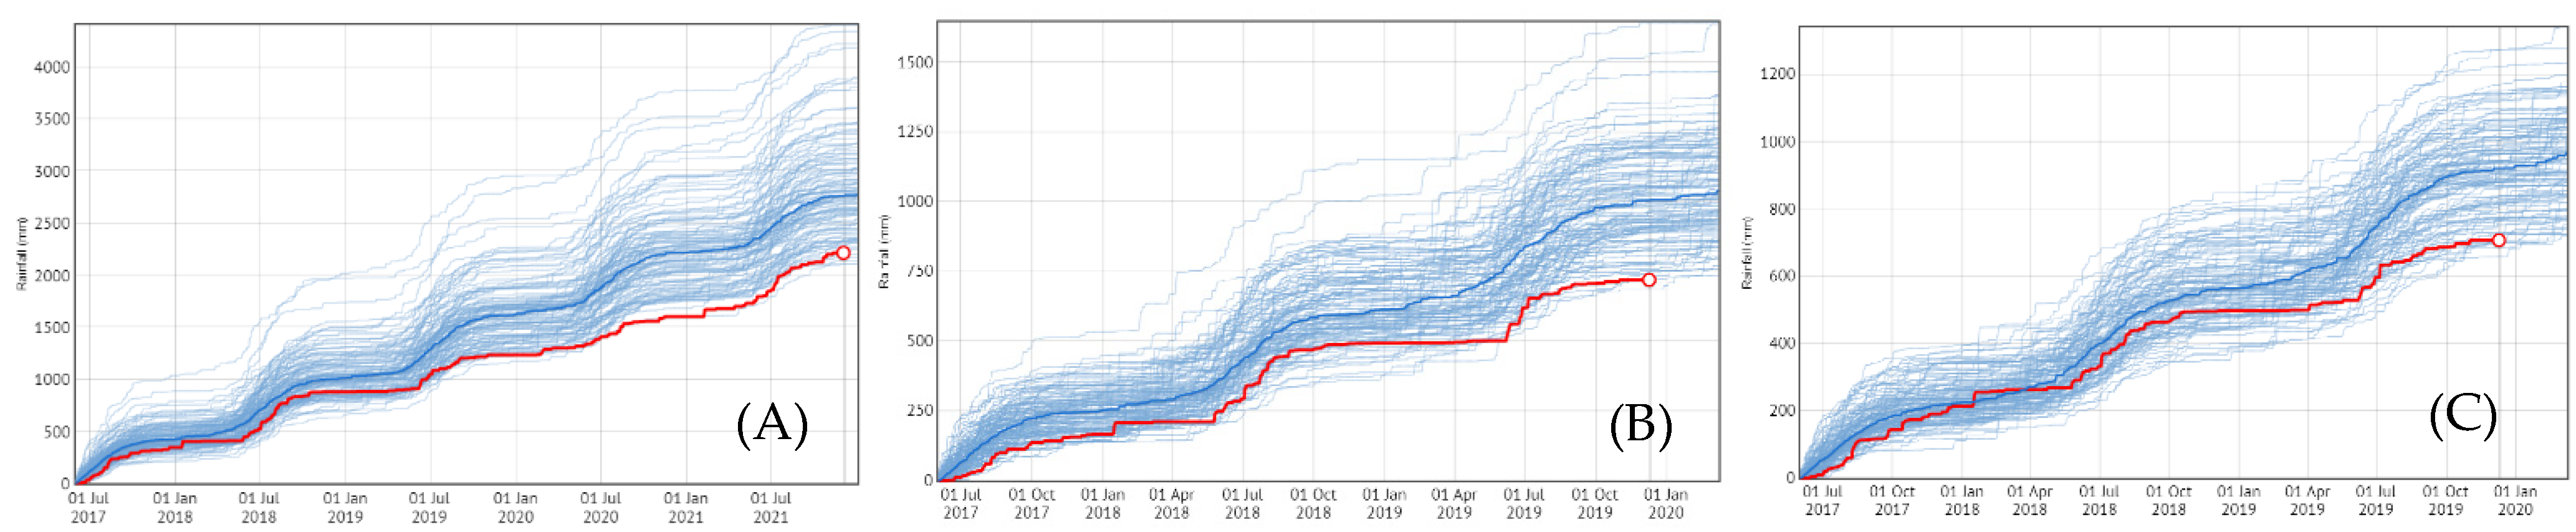
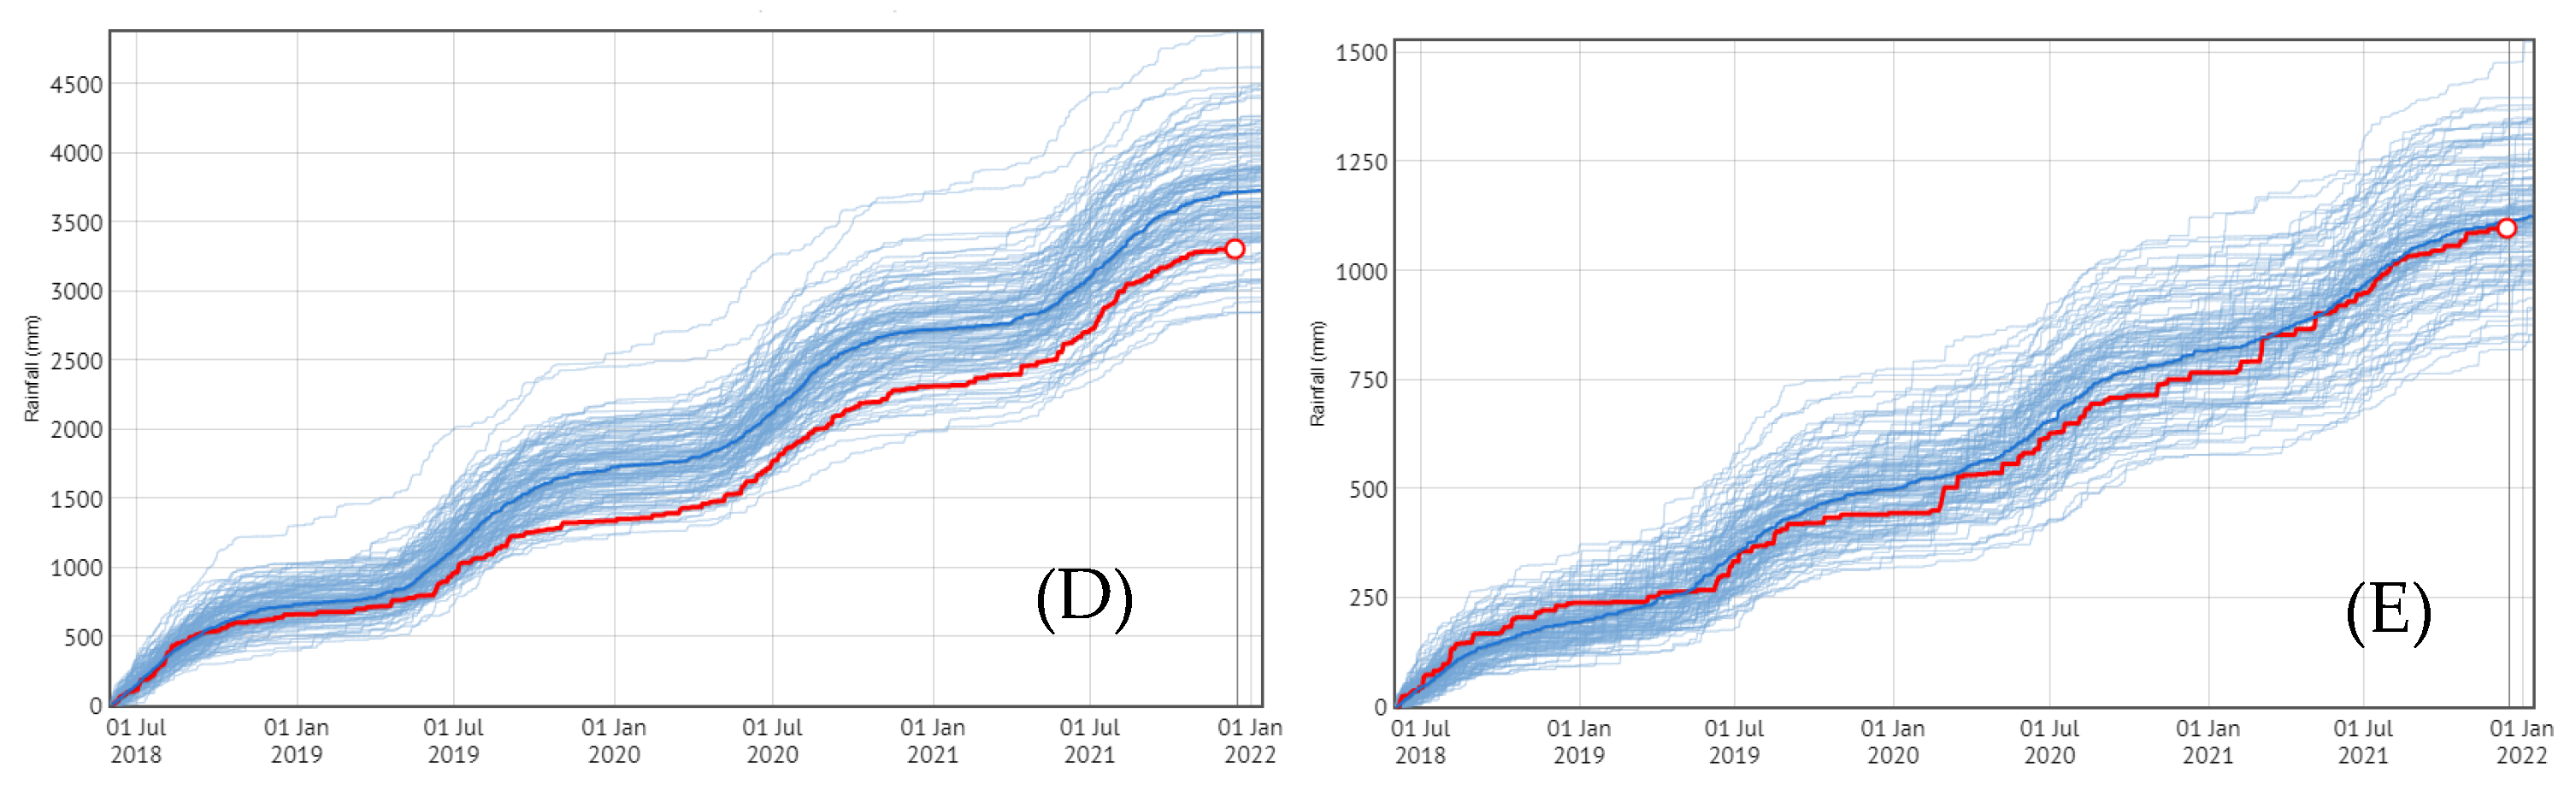
2.2. Experimental Sites Rainfall

Accumulated rainfall for the experimental period and a historical comparison for the period from 1900 to the present are shown for the five experimental sites (Figure 1) using CliMate software developed by the International Centre for applied Climate Sciences, University of Southern Queensland (https://climateapp.net.au/) accessed 10 December 2021.
Dandaragan, Three Springs, and Cunderdin were extremely dry during the experimental period in comparison to the long-term average and frequency percentiles of 2%, 1%, and 5% respectively. The Manjimup and the two Merredin sites also had below average rainfall, with frequency percentiles of 9% and 29%.

2.3. Plant Material

T15-1218 Agronomy 12 00274 i001 is a new tedera variety protected under the Plant Breeder’s Rights Act 1994 [14], and is commercialized under the registered trade mark Lanza®. Lanza® tedera was bred by the Department of Primary Industries and Regional Development (DPIRD) as part of an initiative by the Future Farm Industries Cooperative Research Centre. Lanza® seeds were inoculated with the specific rhizobium WSM 4083 [15,16].
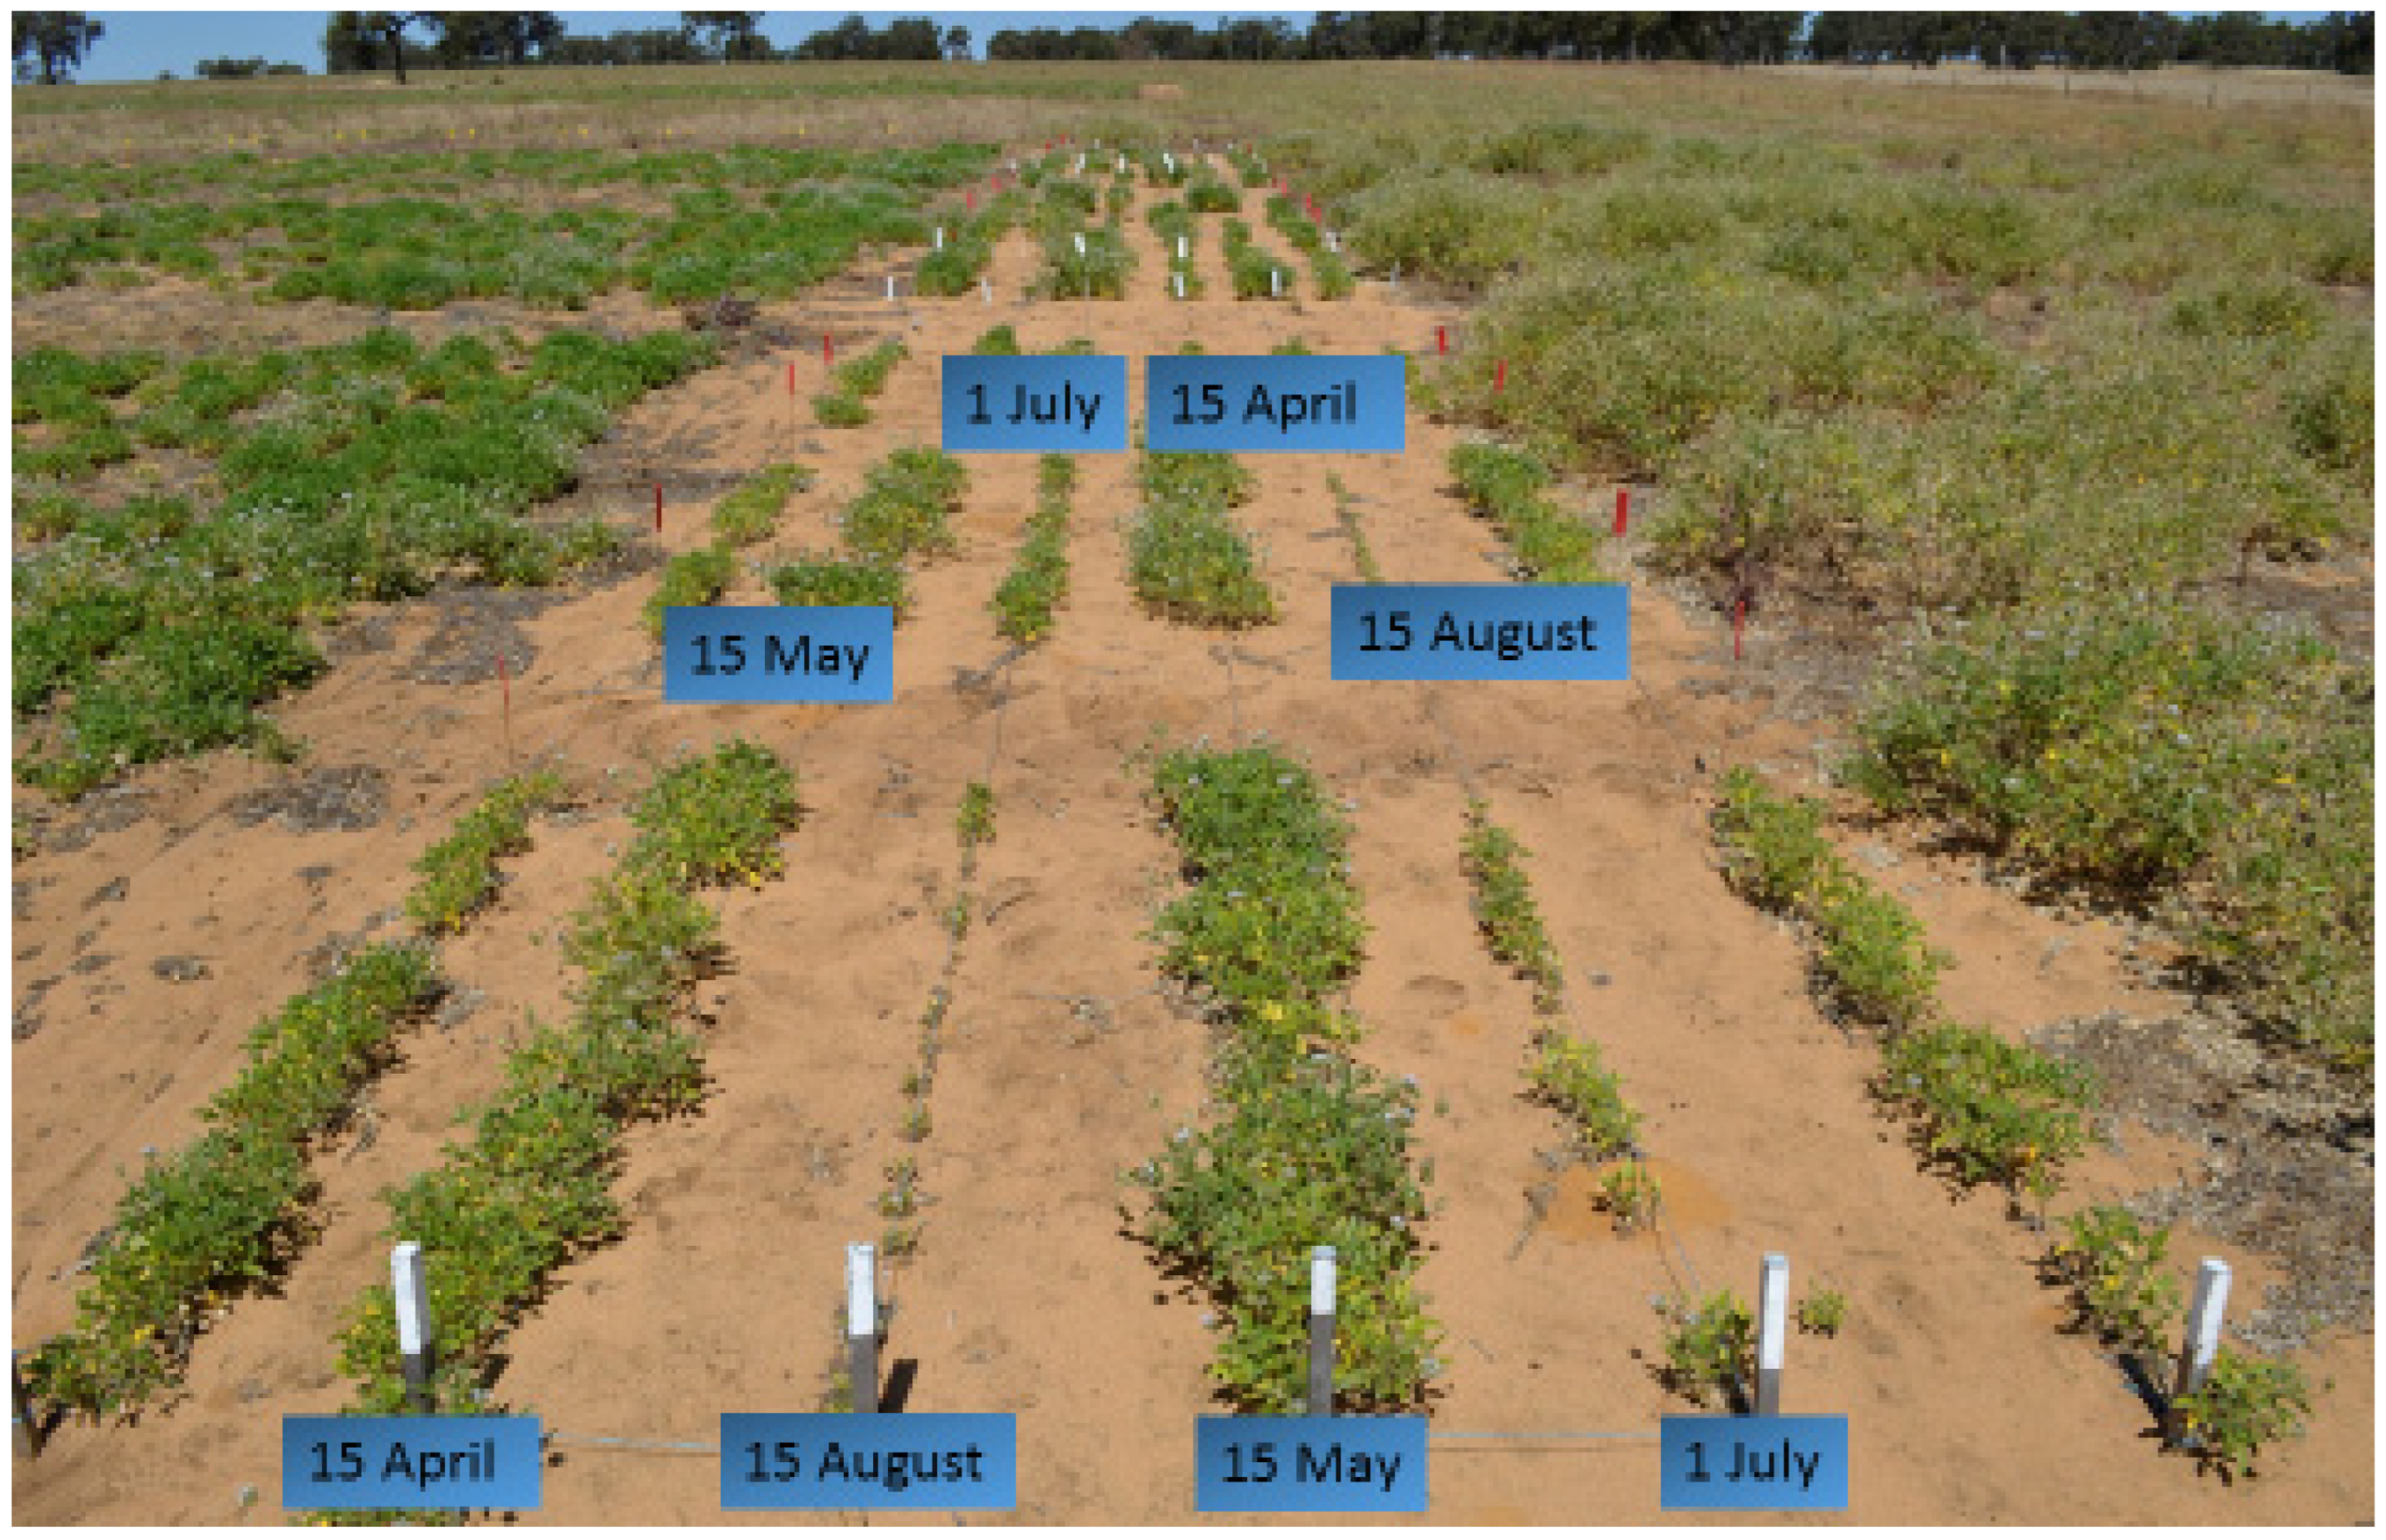
2.4. Time of Sowing

The time-of-sowing experiments were established in 2018 at Dandaragan, Three Springs, and Cunderdin (Table 1). The experimental design was a randomized complete block with four times of sowing (dry sowing before the break of season, early sowing just after the break of season, late sowing after cereal crop program was completed, and early spring sowing) with nine replicates. Tedera was sown in 2 m rows (0.5 m apart) by hand at 10 kg/ha into furrows of 2 cm of depth and then covered. At the three sites, the early April 2018 and May 2018 treatments were sown before the first winter rains and both germinated at the same time in late May following the first rains. Assessments at the three sites took the form of three seedling counts: early October 2018, mid-December 2018, and July 2019 after their first full dry season. The establishment percentage was calculated as ((Count in July 2019/Count in October 2018) × 100). The experiments were hand-weeded from sowing to July 2019 to remove any effect of weed competition during the establishment phase.

2.5. Sowing Depth, Row Spacing, and Sowing Rate at Cunderdin, Dandaragan and Three Springs Sown in 2017

The experimental design for Cunderdin, Dandaragan, and Three Springs was a split-plot with the main plot (6 treatments) comprising a combination of spatial configurations and depths (22 cm, 44 cm, or 66 cm of distance between rows and sowing depths of 2 cm or 6 cm) with subplots as sowing rates (5, 10, or 15 kg/ha) with 4 replications and plot size 1.54 × 10 m.

2.5.1. Plant Counts

Established seedlings were counted on 25 October, 26 October, and 8 November 2017 at Cunderdin, Dandaragan, and Three Springs, respectively. Counts were made in every row of every plot in a 1 m wide central strip across the plots. A total of 3, 4, or 7 rows were counted per plot depending on whether they had a 66, 44, or 22 cm row spacing. Plant counts/m2 and establishment percentage (seedlings counted/total seeds sown) were calculated.

2.5.2. Biomass Cuts

Dry matter (DM) production was evaluated by cutting with a 21-inch-wide self-propelled lawn mower at a height of 5 cm for the full length of the tedera plots. The weight of the mower bag with the cut sample were taken for each plot. The empty mower bag weight was also made for each cut. A subsample from the mower bag was taken for each plot, bagged in a calico bag, weighed in the field, and used, following drying, to calculate the sample dry weight. The sub samples were oven dried at DPIRD, South Perth, for 72 h at 60 °C and weighed again to estimate the dry weight percentage and calculate the DM kg/ha for each plot. After cutting, the remainder of the plot was also mowed to the sampling height. The three experimental sites were assessed for the first time at the end of the first summer in April 2018 and then 3-monthly in July 2018, October 2018, January 2019, July 2019, and October 2019. At Cunderdin, in June 2019, just prior to the scheduled evaluation cut, the whole site was heavily defoliated accidentally by livestock, therefore no measurements were taken in July 2019 but measurements resumed in October 2019. At Three Springs, due to the extremely dry conditions, the second driest two years since 1900 (percentile 1%), recovery after the January 19 cut was very poor,58 and the experiment was terminated due to low number of surviving plants.

2.6. Row Spacing and Sowing Rate at Manjimup and Merredin Sown in 2018

The establishment methods experiments were conducted at a high rainfall site at Manjimup and two low rainfall sites at Merredin (Table 1). The experimental design for Manjimup was a split-plot with the main plot of spatial configurations of 17 cm or 34 cm of distance between rows, sub-plots as sowing rates (5 or 10 kg/ha). Treatments were replicated four times and the plot size was 1.8 × 10 m. The experiment was sown 30 May 2018, and seedlings were counted 26 July 2018.
The experimental design for the two Merredin experiments was a split-plot with the main plot of spatial configurations of 22, 44, or 66 cm of distance between rows, subplots as sowing rates (5 or 10 kg/ha). Treatments were replicated 4 times, and plot size was 1.54 × 10 m. Experiments were sown 11 June 2018, and seedling counts were taken on the 20 July 2018.
The biomass evaluation cuts in Manjimup were conducted in April, July and October 2019 and in Merredin in July and October 2019. The same methodology as described for mowing Cunderdin, Dandaragan and Three Springs was followed.

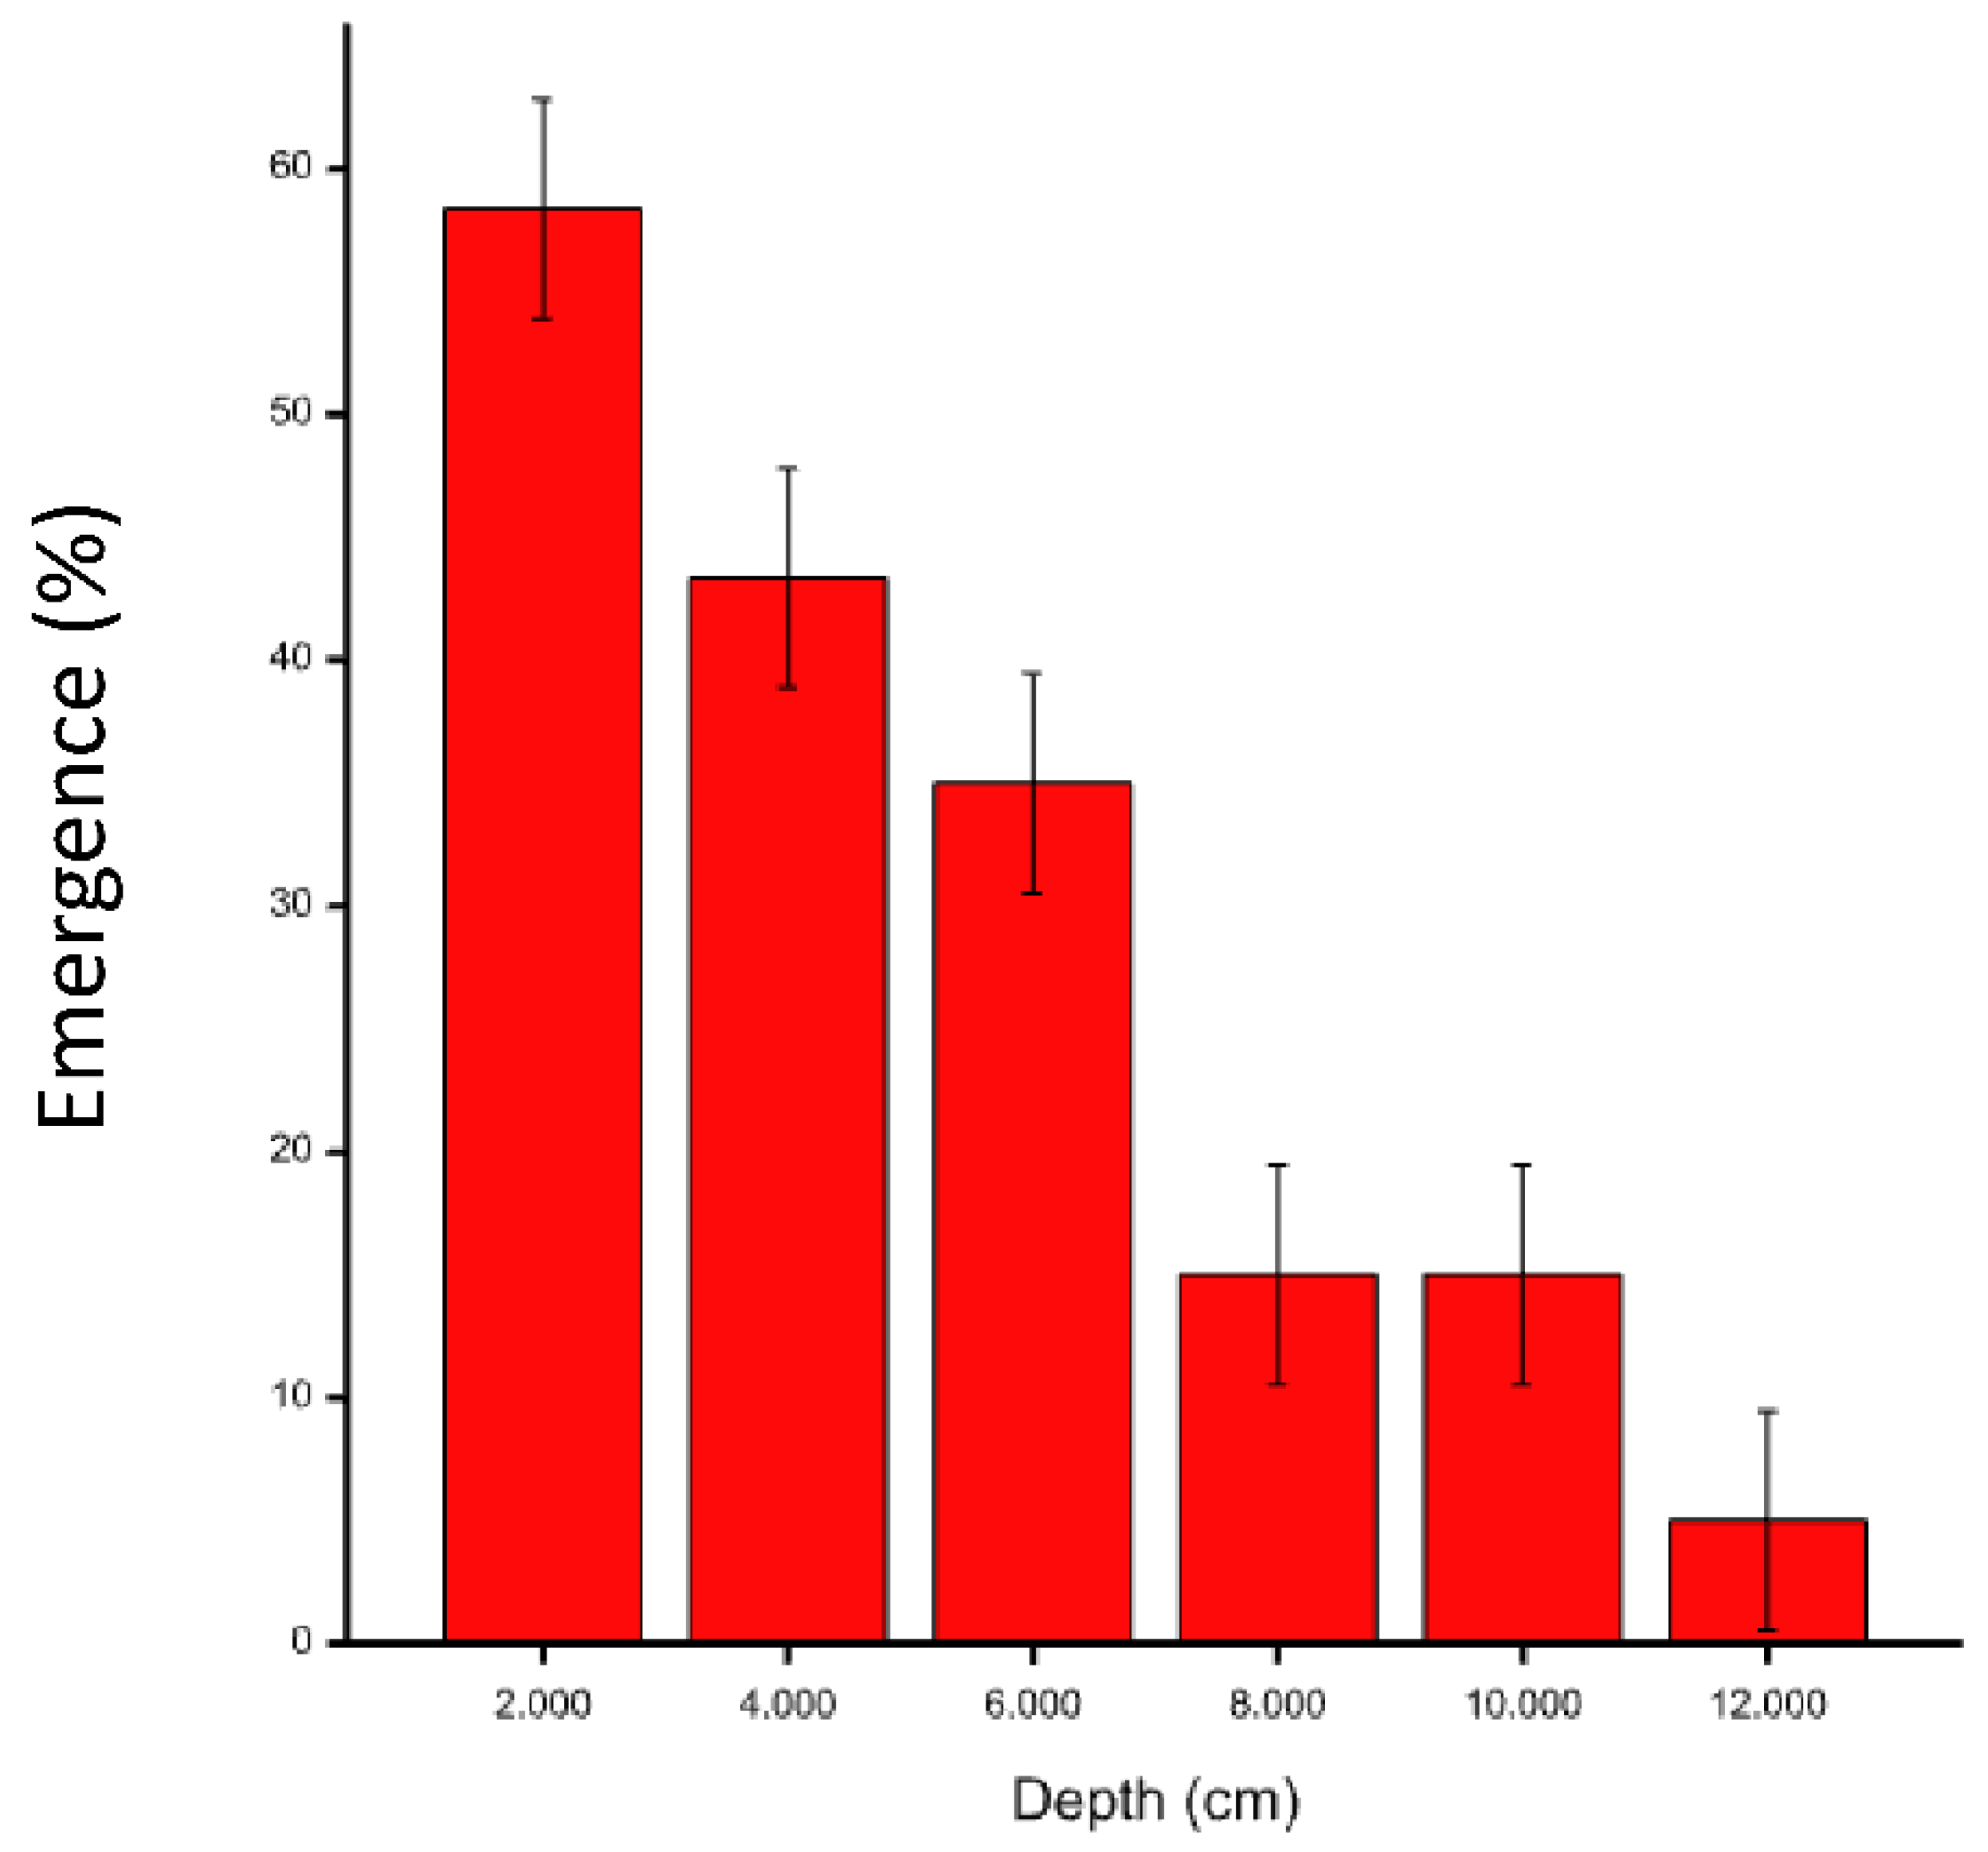
2.7. Sowing Depth in a Controlled Glasshouse Experiment

On 13 July 2018, a controlled experiment was set up to evaluate six sowing depths (2, 4, 6, 8, 10, and 12 cm) with 20 seeds per treatment and 3 replicates. The experiment was set up in a plastic box (with holes for drainage) filled with a commercial potting mix, inside a naturally lit screenhouse without temperature control. Plant counts were taken to assess the germination percentage of the six sowing depths.

3. Results

3.1. Time of Sowing

The experiments were sown at three sites and with four times of sowing. The main site effect was not significant for seedling counts in October 2018 (20.0 plants/m row) and December 2018 (10.6 plants/m row). However, for July 2019 counts, the site effect was highly significant (mean = 7.4 plants/m row). Dandaragan and Cunderdin were statistically the same (l.s.d. = 3.32) with 10.6 and 8.2 plants/m row; however, there was significantly less establishment at Three Springs with 3.3 plants/m row.
The time-of-sowing effect was highly significant (Table 2) with 1 July the best sowing time for the first two plant counts, and for the final count in July 2019, May and July sowing times were statistically the same.
For the establishment percentage, there was a significant site effect, with Dandaragan being the site that had the best establishment, followed by Cunderdin and then Three Springs (Table 3).
The rainfall at Cunderdin, Dandaragan, and Three Springs for the six typically dry months from December 2018 to the end of May 2019 was 33.6 mm, 30.0 mm, and 11.4 mm, respectively.
At Dandaragan, the establishment percentage for the first three sowing times was similar, while the August time of sowing had a shorter period to develop a deep root system before the extended dry period and had a significantly poorer establishment percentage of only 29.5% in comparison with 73.3% for the May sowing. A photo of the Dandaragan experiment on the 10 December 2018 at the start of the dry season is presented as Figure 2.
For Cunderdin and Three Springs, the first two sowing times were similar, while July and August had lower establishment percentages. At Three Springs, all four times of sowing had poor establishment with the best establishment being 27.2% for the May sowing treatment.

3.2. Sowing Depth, Row Spacing, and Sowing Rate at Cunderdin, Dandaragan, and Three Springs Sown in 2017

3.2.1. Plant Counts and Establishment Percentage

The analysis of plant counts/m2 and establishment percentage for Cunderdin, Dandaragan, and Three Springs resulted in significant differences (5%) for both characters for the “Site” effect (Table 4).
Dandaragan was the site with most plants and highest establishment percentage, followed by Cunderdin and Three Springs. Due to the significant differences between sites, results are presented separately.
The significance of the main effects and their interactions for plant counts/m2 and establishment percentage per site is presented in Table 5.
Sowing depth was moderately or highly significant for plant counts/m2 and establishment percentage for each of the three sites. Row spacing was not significant and sowing rate was significant for the three sites for plant counts/m2 but not for establishment percentage as expected, because establishment percentage removed the effect of number of seeds sown (sowing rate). The two-way interactions were not significant with the exceptions of row spacing × sowing depth at Three Springs and sowing depth × sowing rate at Cunderdin. These moderately significant two-way interactions included sowing depth, and difference in sowing depth was the main cause for the significant differences. The three-way interaction was not significant.
  • Sowing depth
Plant counts/m2 and establishment percentage for the sowing depths of 2 cm and 6 cm for Cunderdin, Dandaragan, and Three Springs are presented in Table 6.
The 2 cm sowing depth had significantly more plants and establishment percentage for all three sites. The Dandaragan site is a sandy loam soil type and as a result, seedlings were able to germinate from depth better than in the loamy sand soil type of Three Springs or the loam soil type at Cunderdin. However, even at the least stressful site (Dandaragan), sowing at 6 cm reduced the plant count. At Three Springs, the plant counts in the deep sown treatments were extremely low. In the combined analysis of the three experimental sites, the overall mean establishment percentage for the 2 cm and 6 cm of sowing depth were 24% and 11%, respectively. This is a reduction in establishment of 54% due to the increase in sowing depth.
  • Row spacing
There was no significant difference in plant counts and establishment percentage for the row spacing of 22 cm, 44 cm, or 66 cm.
  • Sowing rate
The plant counts/m2 for the three sowing rates of 5, 10, and 15 kg/ha at the three sites is presented in Table 7. The plant counts/m2 were significantly different for the three rates within site. The higher the sowing rate was, the higher the number of plants/m2. The establishment percentage was not significantly different for the three sowing rates within each site. The mean establishment percentages were 18%, 27%, and 8% for Cunderdin, Dandaragan, and Three Springs, respectively.

3.2.2. Biomass Cuts

Measurement of the 6 cm sowing depth treatment was terminated due to the poor plant establishment across all three sites. Biomass cuts were taken from the 2 cm sowing depth treatment for each site every three months from April 2018.
In April 2018, the analysis of variance results indicated that the DM production of the three sites (Dandaragan, Three Springs, and Cunderdin) and the three sowing rates (5, 10, or 15 kg/ha) were not significantly different. Row spacing was the only significant effect, and none of the interactions was significant. In July and October 2018, the three main effects were significant (site, sowing rate and row spacing) while in October 2018, the interactions of site by row spacing and site by sowing rate were also significant (Table 8).
In April 2018, dry matter production of the three sites was similar. By July 2018, Cunderdin and Three Springs were the same and better than Dandaragan, respectively, but by October 2018 Dandaragan exceeded Cunderdin and Three Springs, which were similar.
In April 2018, across the three sites, the 22 cm and 44 cm spacing were similar and both better than the 66 cm spacing. By July 2018, the 22 cm treatment was the best, and 44 cm and 66 cm were the same, but by October 2018, 22 cm was the highest yielding, followed by 44 cm with 66 cm showing a 30% reduction in yield in comparison to 22 cm spacing.
The sowing rate treatments were the same for April 2018. The 15 kg/ha treatment was better than 10 kg/ha, and the 10 kg/ha better than 5 kg/ha, by July and October 2018.
In January 2019, the overall analysis of variance for the three sites indicated that the DM production was highly significant (p < 0.007) for the site effect. The most productive sites were Dandaragan and Three Springs followed by Cunderdin (Table 9). The analysis of variance by site, showed no significant effect for row spacing, sowing rate, and their interactions.
In July 2019, only Dandaragan was evaluated. Due to a very late start of the season in June 2019, the plants were just conserving moisture during the long summer, autumn, and early winter following the January cut. The DM production grand mean was 325 kg/ha (Table 9). There were no significant effects of row spacing, sowing rate, or their interaction.
In October 2019, Dandaragan and Cunderdin were evaluated. The site effect was highly significant with production at Dandaragan being more than triple that of Cunderdin. Low production at Cunderdin was not only due to dry conditions but also due to the extreme grazing event in June 2019. At Dandaragan, the sowing rate was highly significant with 15 kg/ha being better than 10 kg/ha and 10 kg/ha better than 5 kg/ha (Table 9). Row spacing and the interaction were not significant. At Cunderdin, there was no significant effect for row spacing, sowing rate, or their interactions.
For total production in 2019 at Dandaragan, the DM grand mean was 2621 kg/ha and the sowing rate was the only significant variable, with the highest sowing rate being the best performer with 2921 kg DM/ha (Table 9).
At Dandaragan, on 9 January 2020 and 26 March 2020, neither the sowing rate, row spacing, nor their interaction were significant with a grand mean of 460 kg/ha and 250 kg/ha, respectively. On 6 July 2020, row spacing and its interaction with the sowing rate were not significant. Row spacing and sowing rate treatments results for 6 July 2020, 15 October 2020, and the total production of 2020 are presented in Table 10.
For 6 July 2020, the 10 and 15 kg/ha sowing rates produced more DM than the 5 kg/ha treatment.
For the October 2020 cut, the grand mean was 1906 kg/ha, equivalent to a daily growth of 19 kg/ha. The main effects of row spacing and sowing rates were significant, while the interaction of the main effects was not significant. The 22 and 44 cm row spacing were significantly better than 66 cm. The sowing rate of 15 kg/ha was significantly better than 5 kg/ha while the 10 kg/ha was not significantly different to either the 5 or 15 kg/ha treatments.
For the 2020 total annual production, the grand mean was 3220 kg/ha, equivalent to an average daily growth of 8.8 kg/ha. The significance for the main effects and their interactions were the same as for the October 2020 cut. The best treatment combination was a row spacing of 22 cm sown at a rate of 15 kg/ha that yielded 4068 kg/ha, 25% more than the average of the experiment.

3.3. Row Spacing and Sowing Rate at Manjimup and Merredin Sown in 2018

3.3.1. Manjimup

  • Plant counts and establishment percentage
For the seedlings counted on 26 July 2018, the only significant treatment effect was sowing rate, while row spacing and all the interactions were not significant. The treatment of 5 kg/ha had 19.7 seedlings/m2, and the 10 kg/ha had 32.2 seedlings/m2 (l.s.d. = 9.93). There was no significant main or interaction effect for establishment percentage. The grand mean was 38% establishment irrespective of the sowing rate.
  • Biomass cuts
The biomass evaluation cuts conducted in April 2019, July 2019, and October 2019 had a grand mean biomass of 397 kg/ha, 987 kg/ha, and 1030 kg/ha, respectively. There were no significant effects of the sowing rate, row spacing, or any interaction, except for the sowing rate in July 2019. The total biomass produced in 2019 was 2414 kg/ha with the sowing rate being the only significant effect (Table 11).
In January 2020 and April 2020, the experiment was evaluated, and 360 kg/ha and 1140 kg/ha of DM were harvested, respectively. Neither the main effects nor their interactions were significantly different on either date. Only row spacing was moderately significant (F pr. 0.069) in April 2020 with a mean of 1215 kg/ha and 1065 kg/ha for 17 cm and 34 cm of row spacing, respectively. On 16 June 2020, biomass cuts were taken with a grand mean of 1064 kg/ha, and there was no significance for any of the main effects or their interactions.

3.3.2. Merredin—Mallee Duplex and Sandy Salmon Gum

  • Plant counts and establishment percentage
For seedling counts taken on 20 July 2018, there was no significant site effect. The sowing rate was the only significant main effect. The treatment of 5 kg/ha had 17.8 seedlings/m2, and the 10 kg/ha had 37.3 seedlings/m2 (l.s.d. = 4.99). None of the interactions were significant with the exception of the interaction of site by row spacing in that the sandy salmon gum soil at 44 cm of row spacing was better than all the other five treatment interactions.
There was no significant main or interaction effect for establishment percentage with the exception of site by row spacing in that the Mallee duplex soil at 44 cm spacing was significantly better than the other five treatment interactions. The grand mean was 39% establishment irrespective of the amount of seed sown.
  • Biomass cuts
The experiments were mowed on 8 July 2019 and 14 October 2019. The sites were not significantly different for total biomass produced but were significantly different at each of the two mowing times (Table 12).
For the Mallee duplex on 8 July 2019, the grand mean was 361 kg/ha. The only significant effect was the interaction of sowing rate by row spacing (Table 13). All other main effects and interactions were not significant.
On 14 October 2019, the grand mean was 626 kg/ha, and neither the main effects nor the interactions were significant.
For the Sandy Salmon Gum, on 8 July 2019 and 14 October 2019, the grand mean was 205 kg/ha and 890 kg/ha, respectively. There was no significant effect of any main effect or their interactions.
In 2020, the first biomass cut was expected to be in January, but due to dry conditions and lack of plant growth, this cut was not undertaken. Despite the dry conditions, the tedera plants were green and healthy, but small. The first cut for 2020 was taken on 7 May, and the second cut was taken on 22 July.
The sites were significantly different for biomass produced on 7 May 2020 and 22 July 2020 in that the Sandy Salmon Gum was more productive on both dates than the Mallee Duplex Soil (Table 14).
For the Mallee Duplex Soil, on 7 May 2020, there was no significant treatment effect for either the main treatments or the interactions due to the low level of production of all treatments. On 22 July 2020, the only significant effect was the row spacing, with the 44 cm the most productive treatment.
For the Sandy Salmon Gum, on 7 May 2020, the only significant effect was caused by row spacing; again, the 44 cm was the most productive treatment. On 22 July 2020, the only significant effects were row spacing and sowing rate, with a biomass production of 560 kg/ha for a sowing rate of 10 kg/ha and 492 kg/ha for 5 kg/ha (l.s.d. = 52.9) (Table 15).

3.4. Sowing Depth in a Controlled Glasshouse Experiment

Amongst the six sowing depths from 2 to 12 cm evaluated, the first seedlings to emerge took place after 8 days from the 2 cm depth treatment. The first seedlings to emerge from the 4 cm and 6 cm depth took place 11 days after sowing, while the first seedlings to emerge from 8, 10, and 12 cm took 14 days, 18 days, and 25 days, respectively. After 75 days, the depth that achieved the best total emergence of 58% was 2 cm, followed by 4 cm (43%), and 6 cm (35%) with similar emergence, while 8 cm (15%), 10 cm (15%), and 12 cm (5%) had similarly poor emergence (Figure 3).

4. Discussion

The first hypothesis that in Mediterranean-like environments with medium to low rainfall and mild winters, sowing as early as possible after the first autumn/winter rains is recommended to allow tedera to develop a deep root system to survive the first dry season/s was supported. The time of sowing that achieved the largest number of plants in the sowing year was the early winter (1 July) sowing. At this time of the year, about 45 days after the start of the rainy season, seeds can generally be sown into a wet soil profile. Later sowings proved to be risky because of the reduced time for the seedlings to develop a strong/deep root system allowing them to survive and produce during the first dry summer season. The establishment percentage measured as plants counted in winter of the second year/plants counted in spring of the first year showed that the early sowing of April and May achieved the best survival during the dry season. In contrast, the mid-August time of sowing was significantly worse than any of the other three times of sowing showing that smaller and less developed plants were less capable of surviving the summer drought stress.
The second hypothesis that from a range of sowing depths from 2 cm to 12 cm, a sowing depth of 4 cm to 6 cm will be optimal was not supported. In 2017, the three experiments sown at Cunderdin, Dandaragan, and Three Springs had significantly better establishment when sown at 2 cm depth with 24% compared to 11% for the 6 cm depth. The soil type of the Dandaragan experiment was a sandy loam and had the best establishment of 23% from the 6 cm depth of sowing. The seedlings sown at 6 cm of depth in the loamy sand (Three Springs) and loam (Cunderdin) had establishments of only 2% and 8%, respectively. The controlled experiment using commercial potting mix that evaluated six sowing depths from 2 cm to 12 cm also produced the best emergence of 58% with the 2 cm depth. The next best sowing depth was 4 cm with 43% emergence. Even though tedera seedlings emerged from 12 cm of depth, the emergence rate was less than 10% and took 25 days to emerge in contrast with 8 days for the 2 cm of sowing depth. In a similar experiment with tedera in a controlled experiment with washed sand instead of potting mix, Beard [17,18] evaluated sowing depths of 0, 2, 4, 6, 8, and 10 cm. There were no significant differences in emergence percentage from 2 cm to 10 cm with an average of about 75%, while 0 cm was the only significantly poorer treatment with 20% emergence. There were significant differences in the time to emerge, and the 2 cm of depth was the fastest treatment. These results from Beard [18] and the Dandaragan experiment confirmed that sowing depth is less critical on sandy soils.
In general, tedera displayed the best emergence when sown at 2 cm despite displaying versatility with emergence from sowings as deep as 12 cm. This contrasts with other perennial legumes such as lucerne (Medicago sativa L.) where optimal sowing depth is 0.5 inches = 1.27 cm [19]. Tedera seed size is larger than lucerne, and larger seeds will be able to emerge from deeper sowings [20,21,22,23]. For tedera, 2 cm of depth was the best treatment across a range of soil types in three field experiments and two controlled glasshouse experiments.
The third hypothesis that the highest sowing rates will produce the most productive stands was demonstrated. The sowing rate effect was highly significant for the plant counts at each of the experimental sites, with the higher rates having more plants/m2 than the lower sowing rates. Experiments at Buntine, Newdegate, and Mount Barker in Western Australia, studied the production of tedera by transplanting seedlings at densities of 1, 2, 4, 8, and 16 plants/m2. Densities of both 8 and 16 plants/m2 provided the greatest forage yield [24,25]. All experimental sites and sowing rates achieved plant counts/m2 of more than 8 plants/m2 indicating that adequate plant densities can be generated in field sowing by seeding rates of 15 kg/ha or less. The only exceptions were the sowing rates of 5 and 10 kg/ha at Three Springs that did not reach the expected minimum of 8 plants/m2 (Table 7), largely due to abnormally dry conditions. The establishment percentage within each site (Cunderdin, Dandaragan, Three Springs, Manjimup, and the two sites at Merredin) was not significantly affected by sowing rate. The Manjimup and Merredin sites had the highest establishment percentage of 38% and 39%, while Three Springs was the site with the lowest establishment percentage of 8%. For all the experimental sites and years of evaluation, the summer and autumn cuts had no significant effect for sowing rate. Summer and autumn seasons in the Mediterranean-like climates are the driest seasons, and the biomass production was similar for the sowing rates of 5, 10, or 15 kg/ha. During the growing season in winter and spring when better growing conditions are experienced, the sowing rate of 15 kg/ha with more plants/m2 was able to produce more DM biomass than the sowing rate of 10 kg/ha, and the 10 kg/ha also produced more biomass than the sowing rate of 5 kg/ha. Total yearly production is mainly determined by growing season productivity and, therefore, the higher the sowing rates, the higher the DM biomass production. The decision to sow higher sowing rates will not only depend on maximizing the biomass production but also will be determined by the cost of sowing more seed.
The fourth hypothesis that wider row spacing of 66 cm will be more productive at times of water deficit during summer and autumn was not demonstrated. There were no significant differences in plant counts and establishment percentage for the main effect of row spacing at any of the experimental field sites. In April 2018, July 2018, and October 2018, at Cunderdin, Dandaragan, and Three Springs, the narrower row spacing of 22 cm was more productive than the wider spacing of 66 cm. In January 2019, July 2019, October 2019, January 2020, March 2020, and July 2020 there were no significant differences for row spacing, and at Dandaragan in October 2020, the 22 cm row spacing was more productive than the 66 cm row spacing. At Dandaragan total production for 2020 of the wider row spacing of 66 cm was 30% less productive than the 22 cm row spacing. At Manjimup there was no significance of row spacing at any of the evaluation times. At Merredin, the most productive row spacing was 44 cm.

5. Conclusions

Key elements of a tedera agronomic establishment package have emerged from this study which involve early planting (close to the start of the growing season) and shallow sowing (2 cm depth) at 15 kg/ha of sowing rate and narrow row spacing (22 cm apart). Very similar practices are in common use for cereal establishment when grown in the same regions negating the need for any specialized equipment for tedera establishment.

Funding

This research was funded by Meat & Livestock Australia, grant number B.CCH.6621 and the Department of Primary Industries and Regional Development, WA, Australia.

Institutional Review Board Statement

Not applicable.

Informed Consent Statement

Not applicable.

Data Availability Statement

Raw data are available upon request to Daniel Real. Data have not been archived in a repository.

Acknowledgments

DPIRD technical officers Mengistu Yadete and Daalacha Mulugeta Roba provided invaluable help to conduct the field work at the five field research sites. I would like to thank David and Richard Brown from Bidgerabee Farm at Dandaragan, Adam Thomas at Three Springs, the Western Australian College of Agriculture at Cunderdin, and DPIRD research staff from Manjimup (Ian Guthridge) and Merredin (Vince Lambert) research stations. I would also like to thank DPIRD’s biometrician Andrew Van Burgel for biometrics support and Michael Ewing for critically reviewing this article.

Conflicts of Interest

The author declares no conflict of interest.

References

  1. Ventura, M.R.; Méndez, P.; Flores, M.P.; Rodríguez, R.; Castanon, J.I.R. Energy and protein content of tedera (Bituminaria bituminosa). Cah. Options Mediterr. 2000, 45, 219–221. [Google Scholar]
  2. Méndez, P. Forage Potential of Canary Islands Legumes. In Management of Mediterranean Shrublands and Related Forage Resources; AGRIS: Crete, Greece, 1993; pp. 141–144. [Google Scholar]
  3. Correal, E.; Moñino, I.; Méndez, P.; Ríos, S. Valoración Agronómica de Siete Poblaciones de Bituminaria bituminosa: Efecto de la Sequía Estival y Siega Sobre su Persistencia y Producción de Hoja. In Pastos, Desarrollo y Conservación; Junta de Andalucia: Andalucia, Spain, 2003; pp. 34–40. [Google Scholar]
  4. Real, D.; Oldham, C.M.; Nelson, M.N.; Croser, J.; Castello, M.; Verbyla, A.; Pradhan, A.; Van Burgel, A.; Méndez, P.; Correal, E.; et al. Evaluation and breeding of tedera for Mediterranean climates in southern Australia. Crop Pasture Sci. 2014, 65, 1114–1131. [Google Scholar] [CrossRef]
  5. Real, D.; Li, G.D.; Clark, S.; Albertsen, T.O.; Hayes, R.C.; Denton, M.D.; D’Antuono, M.F.; Dear, B.S. Evaluation of perennial forage legumes and herbs in six Mediterranean environments. Chil. J. Agric. Res. 2011, 71, 357–369. [Google Scholar] [CrossRef] [Green Version]
  6. Real, D.; Oldham, C.M.; Nelson, M.N.; Croser, J.; Castello, M.; Gherardi, S.; Finlayson, J.; Revell, C.; Pradhan, A.; O'Hara, G.W.; et al. Tedera: From A Promising Novel Species to a Commercial Pasture Option for Mediterranean Southern Australia. In Proceedings of the Proceedings 22nd International Grassland Congress: Revitalising Grasslands to Sustain Our Communities, Sydney, Australia, 15–19 September 2013; pp. 301–303. [Google Scholar]
  7. Foster, K.; Lambers, H.; Real, D.; Ramankutty, P.; Cawthray, G.R.; Ryan, M.H. Drought resistance and recovery in mature Bituminaria bituminosa var. albomarginata. Ann. Appl. Biol. 2015, 166, 154–169. [Google Scholar] [CrossRef]
  8. Foster, K.; Ryan, M.H.; Real, D.; Ramankutty, P.; Lambers, H. Drought resistance at the seedling stage in the promising fodder plant tedera (Bituminaria bituminosa var. albomarginata). Crop Pasture Sci. 2012, 63, 1034–1042. [Google Scholar] [CrossRef]
  9. Foster, K.; Ryan, M.H.; Real, D.; Ramankutty, P.; Lambers, H. Seasonal and diurnal variation in the stomatal conductance and paraheliotropism of tedera (Bituminaria bituminosa var. albomarginata) in the field. Funct. Plant Biol. 2013, 40, 719–729. [Google Scholar] [CrossRef] [PubMed]
  10. Méndez, P.; Fernández, M.; Santos, A. Variedades de Bituminaria bituminosa (L.) Stirton (Leguminosae) en el archipélago canario. Pastos 1991, 20–21, 157–166. [Google Scholar]
  11. Méndez, P.; Fernández, M. Interés forrajero de las variedades de Bituminaria bituminosa (L.) Stirton (“tedera”) de Canarias. In Proceedings of the XXX Reunión científica de la sociedad Española para el estudio de los pastos, Donostia-San Sabastian, Spain, 4–8 June 1990; pp. 264–272. [Google Scholar]
  12. Finlayson, J.D.; Real, D.; Nordblom, T.; Revell, C.; Ewing, M.A.; Kingwell, R. Farm level assessments of a novel drought tolerant forage: Tedera (Bituminaria bituminosa C.H.Stirt var. albomarginata). Agric. Syst. 2012, 112, 38–47. [Google Scholar] [CrossRef]
  13. Real, D.; Oldham, C.M.; van Burgel, A.; Dobbe, E.; Hardy, J. Tedera proves its value as a summer and autumn feed for sheep in Mediterranean-like climates. Anim. Prod. Sci. 2018, 58, 2269–2279. [Google Scholar] [CrossRef]
  14. Real, D. Tedera (Bituminaria bituminosa). Plant Var. J. 2016, 29, 97. [Google Scholar]
  15. O’Hara, G.W.; Tian, R.; Meyer, J.; Real, D. Proposal for an Inoculant Strain of Mesorhizobia for Tedera (Bituminaria bituminosa var. albomarginata); Centre for Rhizobium Studies, Murdoch University: Perth, Australia, 2014; p. 17. [Google Scholar]
  16. Yates, R.J.; Real, D.; Revell, C.; Howieson, J.G. Developing inoculant quality root-nodule bacteria for Bituminaria bituminosa: A Perennial Pasture Legume with Potential for Dryland Agriculture. In Proceedings of the 16th International Congress on nitrogen fixation, Big Sky, MT, USA, 14–19 June 2009. [Google Scholar]
  17. Beard, C. Germination Ecology of Bituminaria Bituminosa Var. Albomarginata and Its Suitability to the Mediterranean-Type Climate of Western Australia; Curtin University: Northan, WA, USA, 2009. [Google Scholar]
  18. Beard, C.; Nichols, P.G.H.; Loo, C.; Michael, P. Establishment of Tedera (Bituminaria bituminosa var. albomarginata); Curtin University: Perth, Australia, 2014; p. 50. [Google Scholar]
  19. Beveridge, J.L.; Wilsie, C.P. Influence of depth of planting, seed size, and variety on emergence and seeding vigor in Alfalfa1. Agron. J. 1959, 51, 731–734. [Google Scholar] [CrossRef]
  20. Correal, E.; Hoyos, A.; Ríos, S.; Méndez, P.; Real, D.; Snowball, R.; Costa, J. Seed production of Bituminaria bituminosa: Size, Production, Retention and Germination Capacity of the Legumes. In Options Méditerranéennes; CIHEAM: Elvas, Portugal, 2008. [Google Scholar]
  21. Méndez, P.; Santos, A.; Correal, E.; Ríos, S. Agronomic traits as forage crops of nineteen populations of Bituminaria bituminosa. Grassl. Sci. Eur. 2006, 11, 300–302. [Google Scholar]
  22. Castello, M.; Croser, J.S.; Lulsdorf, M.M.; Ramankutty, P.; Pradhan, A.; Nelson, M.N.; Real, D. Breaking primary dormancy in seeds of the perennial pasture legume tedera (Bituminaria bituminosa C.H. Stirt. vars albomarginata and crassiuscula). Grass Forage Sci. 2015, 70, 365–373. [Google Scholar] [CrossRef]
  23. Pedersen, M.W.; Barnes, D.K. Alfalfa Seed Size as an Indicator of Hybridity1. Crop Sci. 1973, 13, 72–75. [Google Scholar] [CrossRef]
  24. Real, D.; Kidd, D. Forage Production of the Drought Tolerant Mediterranean Forage Legume tedera (Bituminaria bituminosa var. albomarginata) in the Medium-Rainfall Zone of Southern Western Australia as Affected by Plant Density and Cutting Frequency. In New Approaches for Grassland Research in a Context of Climate and Socio-Economic Changes; FAO: Rome, Italy, 2012; pp. 387–390. [Google Scholar]
  25. Suriyagoda, L.D.B.; Real, D.; Renton, M.; Lambers, H.; Ryan, M.H. Establishment, survival, and herbage production of novel, summer-active perennial pasture legumes in the low-rainfall cropping zone of Western Australia as affected by plant density and cutting frequency. Crop Pasture Sci. 2013, 64, 71–85. [Google Scholar] [CrossRef]
Figure 1. Accumulated rainfall at Dandaragan (A); Three Springs (B); Cunderdin (C); Manjimup (D), and Merredin (E). The red line shown observed cumulative rainfall for each experimental site, the lines dark blue line is long-term average rainfall since 1900 and light blue lines are for each individual year of record contributing to the mean.
Agronomy 12 00274 g001aAgronomy 12 00274 g001b
Figure 2. Time of sowing experiment at Dandaragan on the 10 December 2018.
Agronomy 12 00274 g002
Figure 3. Emergence percentage of tedera seeds sown at 2, 4, 6, 8, 10, and 12 cm of depth.
Agronomy 12 00274 g003
Table 1. Experimental site details of tedera agronomy experiments sown in 2017 and 2018.
SiteDandaraganThree SpringsCunderdinManjimupMerredin
(Malley Duplex)
Merredin (Sandy Salmon Gum)
Latitude30°50′14″ S29°36′98″ S31°37′34″ S34°18′45″ S31°29′36″ S31°29′16″ S
Longitude115°45′44″ E115°44′90″ E117°13′14″ E116°07′51″ E118°12′56″ E118°12′52″ E
Annual average rainfall (mm)480380310990310310
Soil TypeSandy LoamLoamy sandLoamGravelly LoamLoamy sandSandy Loam
Soil pH(Ca Cl2)6.85.47.65.35.14.5
Sowing dates 201730 May25 May4 July
Sowing date 20185 April
24 May
5 July
23 August
4 April
23 May
4 July
22 August
3 April
21 May
2 July
20 August
30 May11 June11 June
Table 2. Mean seedling counts/m from three time-of-seeding sites.
Time of SowingEarly October 18Mid-December 2018July 2019
1 April15.84c 17.94c6.98b
15 May18.94b8.49c9.65a
1 July24.08a13.85a8.78a
15 August20.87b12.22b3.93c
l.s.d. (5%)2.211.531.61
1 Figures in the columns that share a common letter are not significantly different (p < 0.05).
Table 3. Establishment percentage for four sowing times at Dandaragan, Cunderdin, and Three Springs.
Time of SowingDandaraganCunderdinThree SpringsMean
1 April70.4a 147.7a25.9a47.6a
15 May73.3a50.2a27.2a49.8a
1 July65.7a29.0b13.3b36.0b
15 August29.5b17.0c10.1b18.8c
l.s.d. (5%)13.8510.998.225.82
Mean59.7A 235.4B19.1C38.1
1 Figures in the columns that share a common letter are not significantly different (p < 0.05). 2 Figures in the row for the means that share a common letter are not significantly different (p < 0.05).
Table 4. Plant counts/m2 and establishment percentage for Cunderdin, Dandaragan, and Three Springs in 2017.
SitePlant Counts/m2Establishment Percentage
Cunderdin15.1b 118b
Dandaragan23.5a27a
Three Springs6.7c8c
l.s.d. (5%)4.043.8
1 Figures in the columns that share a common letter are not significantly different (p < 0.05).
Table 5. Significance of main effects and their interactions for plant counts/m2 and establishment percentage per site.
Plant Counts/m2Establishment Percentage
CunderdinDandaraganThree SpringsCunderdinDandaraganThree Springs
Row Spacingn.s. 1n.s.n.s.n.s.n.s.n.s.
Sowing depth*** 23**********
Sowing rate*********n.s.n.s.n.s.
Spacing × Depthn.s.n.s.*n.s.n.s.*
Spacing × S. raten.s.n.s.n.s.n.s.n.s.n.s.
Depth × S. rate* 3n.s.n.s.n.s.n.s.n.s.
Spacing × Depth × S. raten.s.n.s.n.s.n.s.n.s.n.s.
1 Not significant. 2 ***, Highly significant (Pr. < 0.001). 3 *, Moderately significant (Pr. < 0.05; >0.01).
Table 6. Plant counts/m2 and establishment percentage for the sowing depths of 2 cm and 6 cm at the three sites.
Plant Counts/m2Establishment Percentage
DepthCunderdinDandaraganThree SpringsCunderdinDandaraganThree Springs
2 cm23.0a 127.5a11.6a27a31a14a
6 cm7.2b19.6b1.7b8b23b2b
l.s.d. (5%)2.784.731.904.17.71.9
1 Figures in the columns that share a common letter are not significantly different (p < 0.05).
Table 7. Plant counts/m2 for the three sowing rates of 5, 10, and 15 kg/ha at the three sites.
Plant Counts/m2
Rates (kg/ha)CunderdinDandaraganThree Springs
59.0c 113.2c3.6b
1015.8b21.7b7.4a
1520.5a35.6a9.1a
l.s.d. (5%)3.895.251.74
1 Figures in the columns that share a common letter are not significantly different (p < 0.05).
Table 8. Dry matter production (kg/ha) in April, July, and October 2018 for significant treatments in the establishment methods experiments at Cunderdin, Three Springs, and Dandaragan.
April 2018
Row spacing 22 cm44 cm66 cml.s.d.
891a 1804a635b123.6
July 2018
Site CunderdinThree SpringsDandaragan
686a635a536b70.7
Sowing rate 15 kg/ha10 kg/ha5 kg/ha
647a634ab577b58.6
Row spacing 22 cm44 cm66 cm
698a583b577b74.2
October 2018
Site DandaraganCunderdinThree Springs
2268a1522b1348b253.3
Row spacing 22 cm44 cm66 cm
2021a1688b1429c196.0
Sowing rate 15 kg/ha10 kg/ha5 kg/ha
1958a1680b1500c160.3
Interactions
SiteRow Spacing22 cm44 cm66 cm
Dandaragan 2793a2274b1736c359.2
Cunderdin 1788c1558cd1221d
Three Springs 1481cd1233d1329d
SiteSowing rate15 kg/ha10 kg/ha5 kg/ha
Dandaragan 2831a2156b1816c321.4
Cunderdin 1569cd1584cd1414d
Three Springs 1474d1300d1270d
1 Figures in the rows that share a common letter are not significantly different (p < 0.05).
Table 9. Dry matter production (kg/ha) in January, July, and October 2019 for the establishment methods experiments at Cunderdin, Three Springs, and Dandaragan.
January 2019
SiteCunderdinThree SpringsDandaraganl.s.d. (5%)
260b 1388a472a112.9
July 2019
SiteCunderdinThree SpringsDandaragan
N.A.N.A.325
October 2019
SiteCunderdinThree SpringsDandaraganl.s.d. (5%)
551bN.A.1824a206.1
October 2019 Dandaragan
Sowing Rate15 kg/ha10 kg/ha5 kg/hal.s.d. (5%)
2052a1811b1609c.174.3
Total for 2019 (January + July + October) Dandaragan
Sowing Rate15 kg/ha10 kg/ha5 kg/hal.s.d. (5%)
2921a2614b2329c.269.0
1 Figures in the rows that share a common letter are not significantly different (p < 0.05).
Table 10. Establishment method treatment results for Dandaragan in 2020 including sowing rate, October 2020 DM production, and the total DM production of 2020.
6 July 2020
Sowing rate (kg/ha)15105l.s.d. (5%)
687a 1613a514b81.1
15 October 2020
Row spacing (cm)224466l.s.d. (5%)
2239a1995a1483b277.7
Sowing rate (kg/ha)15105
2102a1851ab1764b266.2
Total Production for 2020
Row spacing (cm)224466l.s.d. (5%)
3730a3303ab2628b830.0
Sowing rate (kg/ha)15105
3533a3195ab2933b366.0
1 Figures in the rows that share a common letter are not significantly different (p < 0.05).
Table 11. Manjimup DM cuts in April 2019, July 2019, and October 2019.
July 2019
Sowing rate (kg/ha)510l.s.d. (5%)
837b 11137a196.9
April 19 + July 19 + October 2019
Sowing rate (kg/ha)510l.s.d. (5%)
2136b2692a542.7
1 Figures in the rows that share a common letter are not significantly different (p < 0.05).
Table 12. Biomass production on 8 July 2019, 14 October 2019, and total production on a Mallee duplex and sandy salmon gum soils at Merredin.
Soil TypeMallee DuplexSandy Salmon Guml.s.d. (5%)
8 July 2019361a 1205b65.5
14 October 2019626b890a84.2
Total Production987n.s1095n.s.138.1
1 Figures in the rows that share a common letter are not significantly different (p < 0.05).
Table 13. Biomass production on 8 July 2019 on a Mallee duplex soil at Merredin.
8 July 2019
Sowing rate (kg/ha)510l.s.d. (5%)
Row spacing (cm) 78.6
22387ab 1317b
44326b431a
66346b360ab
1 Figures in the rows that share a common letter are not significantly different (p < 0.05).
Table 14. Biomass production on 7 May 2020 and 22 July 2020 on a Mallee duplex and Sandy Salmon Gum soils at Merredin.
Soil TypeMallee DuplexSandy Salmon Guml.s.d. (5%)
7 May 2020206b 1261a39.2
22 July 2020479b526a41.0
1 Figures in the rows that share a common letter are not significantly different (p < 0.05).
Table 15. Biomass production on 22 July 2020 on a Mallee duplex and on 7 May 2020 and 22 July 2020 on a Sandy Salmon Gum soil at Merredin.
22 July 20207 May 202022 July 2020
Soil typeMallee duplexSandy Salmon GumSandy Salmon Gum
Row spacing (cm)
22423b 1228b476b
44567a316a599a
66447b240b504b
l.s.d. (5%)95.663.967.9
1 Figures in the columns that share a common letter are not significantly different (p < 0.05).
Publisher’s Note: MDPI stays neutral with regard to jurisdictional claims in published maps and institutional affiliations.

