Article

13C Labelling of Litter Added to Tea (Camellia sinensis L.) Plantation Soil Reveals a Significant Positive Priming Effect That Leads to Less Soil Organic Carbon Accumulation

1
Key Laboratory of Tea Biology and Resource Utilization of Tea, Tea Research Institute, Chinese Academy of Agriculture Sciences, Ministry of Agriculture, Hangzhou 310008, China
2
Xihu National Agricultural Experimental Station for Soil Quality, Hangzhou 310008, China
3
Jiangsu Provincial Key Laboratory for Organic Solid Waste Utilization, Nanjing Agricultural University, Nanjing 210095, China
*
Author to whom correspondence should be addressed.
These authors contributed equally to this work.
Submission received: 20 December 2021 / Revised: 19 January 2022 / Accepted: 19 January 2022 / Published: 24 January 2022
(This article belongs to the Special Issue Agroecology and Organic Horticulture)

Abstract

:
Although annual return of litter occurs in tea (Camellia sinensis L.) plantations, the level of soil organic carbon (SOC) therein remains relatively low. The exact impacts of pruned litter on soil and its association with SOC accumulation in tea plantations remain unclear. In this study, we prepared 13C-labeled tea plant material and incubated it with soils collected at a tea plantation. Carbon dioxide (CO2) efflux and its sources were measured and distinguished based on the 13C isotopic method. Soil microbial community and the utilization of litter C were assessed by phospholipid fatty acid (PLFA) analysis combined with a stable isotope probing (SIP) technique. Litter incorporation initially significantly increased CO2 efflux. The majority of CO2 production (>90%) arose from native SOC mineralization, which was reflected by a strong positive priming effect (PE) that decreased over time. During the incubation period, β-glucosidase activity significantly decreased in both the control and litter-amended soil. A significant difference in the microbial community was observed between control and litter-amended soil, in which litter incorporation significantly increased the biomass of each microbial group relative to control soil. Based on PLFA-SIP, 78% of the C incorporated into individual microbes was derived from native SOC, while only 22% was derived from litter. Additionally, partial least squares regression path modeling (PLS-PM) revealed that the microbes associated with native SOC mineralization directly affected the changes in SOC (ΔCSOC+litter), whereas microbes related to litter degradation exhibited an indirect effect on ΔCSOC+litter by affecting β-glucosidase activity under litter incorporation. Taken together, SOC accumulated less in the tea plantation system despite the annual return of pruned litter to the field.

1. Introduction

Soil organic carbon (SOC) is a key indicator of soil quality, which plays an important role in the maintenance and improvement of soil fertility [1]. In addition, SOC is the largest C pool in terrestrial ecosystems, and small changes in the C pool of soil can have a substantial impact on carbon dioxide (CO2) emissions, potentially exacerbating global climate change [2]. It has previously been shown that SOC levels vary more in agricultural land subjected to intense anthropogenic perturbation [3]. Therefore, a deeper understanding of how agricultural management practices, including crop rotation, fertilization, tillage and periodic pruning, affect SOC dynamics is critical for improving soil fertility and predicting climate change.
Recent evidence has shown that exogenous organic material (EOM) input, either from farmyard manure or crop residues, can effectively improve soil organic matter (SOM) content [4], largely due to the proportion of organic C that is transformed into slow-cycling SOM by soil microorganisms [5,6]. Thus, substantial amounts of EOM are widely applied in field practices in order to directly improve SOM [7]. In addition to its direct effects, EOM input can also inhibit native SOC degradation, which is known as the negative priming effect (PE), which indirectly increases SOM content. The “preferential substrate utilization” theory suggests that soil microbes preferentially utilize exogenous C, rather than existing C, which leads to an indirect increase of SOC by negative PE [8]. However, numerous studies have shown that EOM input stimulates the degradation of native SOC, resulting in small net gains or even net losses in soil C storage through positive PE [9]. For example, Troy et al. (2013) [10] found that the application of spruce and rice straw biochar increased the respiration rate and activity of soil microorganisms, accelerating native SOC degradation and CO2 emission. Evidence suggests that positive PE can be explained by the “co-metabolism” theory, in which EOM input serves as an available energy source for microorganisms to promote extracellular enzyme secretion, which further stimulates native SOC degradation, causing SOM loss [8]. The theory of “Microbial-N mining” suggests that fresh matter with a C: N ratio greater than 25 can stimulate native SOC degradation [11], causing soil C loss. Therefore, soil C sequestration largely depends on the overall balance between accelerated SOC mineralization and the rate of newly formed SOC derived from added C [9].
In terrestrial ecosystems, soil plays an important role in SOM transformation [11,12]. The degradation and transformation of exogenous C in soil via mineralization and humification are primarily carried out by soil microorganisms [13]. Bacteria and fungi account for more than 90% of the total population of soil microorganisms and are the main driving forces for the degradation of EOM and native SOC in soils [14]. Bacteria, which are typically defined as r-strategists, preferentially use exogenous C, while fungi, which are typically defined as k-strategists, preferentially use existing soil C. Although these two groups co-exist in the soil, the dominant microbial group varies at different degradation stages due to various substrate characteristics, indicating that the structure and functional diversity of microbial communities is correlated with ecological succession during degradation [9,15,16]. The effects of litter incorporation on SOC dynamics have been extensively studied, but most exogenous materials utilized for litter were annual crops, such as rice, wheat or maize. The effects of perennial crop litter and residue on SOC dynamics in agricultural system especially in extremely acidic soil (pH < 4.5) has not been well studied.
The tea plantation system is typically characterized by heavy annual pruning, with the pruned litter returned back to the soil. Our previous investigation demonstrated that over 8000 kg ha−1 of pruned tea litter is returned to plots each year [17]. Theoretically, large amounts of pruned litter returning to soil can improve soil C content, due to its high amount of organic C. However, we found that the C content in tea plantation soil remained relatively low following pruned tea litter input (12.7–14.5 mg g−1) (Yang et al., 2019). Thus far, it is still not understood why pruned litter does not contribute more significantly to organic carbon accumulation in tea plantation soil.
In this study, we hypothesize that returning pruned litter to tea plantation soils accelerates native SOC decomposition through a positive PE, resulting in the loss of SOC. To confirm this hypothesis, 13C-labeled tea litter was prepared and incubated with soil that was fertilized at a rate of 119 kg N ha−1 yr−1 in a long-term experimental field. The changes in CO2 efflux, enzyme activity of β-glucosidase and microbial communities associated with litter and native SOC degradation were examined. Our overall objectives were to: (1) investigate the characteristics of litter and native SOC degradation over the incubation period, (2) distinguish the proportion of CO2 production utilized by microbial communities arising from added litter and native SOC degradation, and (3) explore how litter incorporation altered SOC (ΔCSOC + litter).

2. Materials and Methods

2.1. Experimental Soil

Soil was collected from the surface layer (0–20 cm) of the experimental tea plantation at the Tea Research Institute of the Chinese Academy of Agricultural Sciences (TRI-CAAS) in October 2018. The soil had previously received an N rate of 119 kg ha−1 yr−1 for 13 years. The collected wet soil was sieved (<2 mm) prior to laboratory analyses and divided into two parts. One portion was used to measure inorganic N (NH4+ and NO3), while the remaining soil was air-dried for the measurement of other properties. The soil had a pH of 4.0 and contained 43.85 mg g−1 total carbon, 4.30 mg g−1 total N, 41.9 mg kg−1 inorganic N, 97 mg kg−1 available phosphorus and 170 mg kg−1 available potassium. The δ13C (Pee Dee Belemnite, PDB) was −28.33‰.

2.2. 13C Labeling of Tea Plants

Tea plants (Camellia sinensis L.) were initially grown from seed on perlite in the greenhouse. When the seedlings grown in plastic hydroponic container filled with perlite had two expanding leaves, they were placed in a square transparent glass container (60 × 60 × 60 cm). Additional light was supplied by LED lights installed above the container, and the photoperiod was set at 14 h of light and 10 h of dark, and the light intensity was 220 μmol m−2 s−1. Before labeling, CO2-free air was injected into the container to remove the original gas (mainly 12CO2). Tea plants were then pulse-labelled with 13CO2 (99 atom% 13C) through an injection of 400 ppm 13CO2 d into the container every three hours during the day. Tea plants were harvested after 25 days of the pulse-labeling treatment. Leaves and stems were thoroughly rinsed with double-distilled H2O (ddH2O), oven-dried, crushed, ground, sieved (< 100 mesh) and prepared for use in the subsequent incubation experiments. The plant material contained 456.4 mg g−1 total carbon and 22.5 mg g−1 total N (TN), and had a C/N ratio of 20.32. The δ13C (PDB) of the tea plant material was 7911‰.

2.3. Experimental Design

The air-dried soil was pre-incubated in the dark at 60% water holding capacity (WHC) at 25°C for 7 days to restore microbial activity. After pre-incubation, 20.0 g of soil were thoroughly mixed with 0.2 g oven-dried, crushed 13C-labeled plant material and placed into glass serum bottles (125 mL). The moisture of the mixture was adjusted to 60% WHC with ddH2O. The bottle was sealed with Parafilm with some holes to ensure aerobic conditions over the course of the incubation period. A total of 12 bottles were prepared and placed in a 25°C incubator. The mixture was maintained at 60% WHC by adding ddH2O every 7 days. Twelve bottles filled with only soil (without 13C-labeled litter) were used as controls and incubated under identical conditions. The CO2 emission and atom (%) 13C values were measured from control and treatment groups, each of which contained four replicates.
CO2 samples were collected nondestructively at 1, 3, 5, 7, 10, 15, 20, 30, 45 and 90 days of incubation. Prior to each sampling, the glass serum bottles were tightly vacuumed, and then exposed to air for 10 minutes to eliminate residue contamination. The bottles were sealed with a rubber plug and an aluminum cap, and then incubated at 25ºC in the dark for 2 h. CO2 gas was collected from the bottles using a syringe, placed into 20 mL pre-evacuated vials, and immediately sealed until further analyses, which were carried out within three months. After gas sample collection, the serum bottles were resealed with Parafilm and placed back into the incubators until the next sampling [18]. On days 15, 45 and 90, the soil samples were destructively collected from each of the four replicates for soil microbial property assessment and SOC content measurements.

2.4. CO2 and δ13C Measurement

CO2 concentration was measured using gas chromatography (Agilent 7890b, Santa Clara, CA, USA). The δ13C values of CO2 were measured using an isotope ratio mass spectrometer (IRMS) (Thermo Fisher Scientific, Waltham, MA, USA).
The δ13C value of each sample was calculated as:
δ 13 C   ( ) = ( R sample / R PDB 1 ) × 1000
where Rsample and RPDB are the 13C/12C ratios of the sample and the PDB standard, respectively.
The CO2 efflux derived from 13C litter was calculated as:
Flitter = Ftotal × flitter
where Flitter is the total CO2 efflux from soil amended with 13C litter and flitter is the ratio of CO2 efflux from 13C litter to soil CO2 efflux.
flitter was calculated as:
f litter = [ ( δ δ s ) / ( δ litter   δ s ) ]
where δ is the δ13C value of CO2 emitted from soil amended with 13C litter (‰), δs is the δ13C value of CO2 emitted from control soil and δlitter is the δ13C value of the experimental litter (‰).
CO2 emission was calculated using a linear model of the change in CO2 concentration in the bottle over a 2-h period at an average chamber temperature of 25 °C.
The PE of the litter on native SOC was calculated as:
PE   ( % ) = [ ( ( CO 2 - C ) total ( CO 2 - C ) litter ( CO 2 - C ) control   soil ) / ( CO 2 - C ) control   soil ] ×   100
where (CO2-C)total is the CO2 emitted from soil amended with 13C litter, (CO2-C)litter is the CO2 emitted from added 13C litter, and (CO2-C)control soil is the CO2 emitted from control soil.

2.5. β-glucosidase Activity Analysis

The activity of β-glucosidase was measured according to the fluorimetric protocol of Saiya-Cork et al. (2002) [19], with slight modifications by DeForest (2009) [20]. Briefly, 1.0 g fresh soil was suspended in 125 mL of sodium acetate buffer with pH adjusted to the mean of the soil. Soil suspensions were pipetted into 96-well microplates, and enzyme activity was determined by adding 4-methylumbelliferyl (MUB) substrates for a final concentration of 40 μM. The suspensions were then incubated in the dark for 2 h, and the reactions were stopped with 10 μL of 0.5 M NaOH. The microplates were then scanned with a fluorescence spectrophotometer (Cary Eclipse, Agilent Technologies, Inc. Santa Clara, CA, USA) using excitation and emission filters at 365 and 450 nm, respectively. Potential enzyme activity was expressed as MUB released in nmol per gram of dry soil per hour (nmol g−1 h−1)

2.6. PLFA and δ13C Measurements

Microbial phospholipid fatty acids (PLFAs) were extracted, fractionated and purified with the methods described by Ge et al. (2010) [21]. In brief, approximately 3.0 g of freeze-dried soil was extracted twice using 22.8 mL of 1:2:0.8 chloroform: methanol: citrate buffer (0.15 M, pH 4.0). The extract was transferred to a silica gel column (Supelco, Bellefonte, PA, USA), and neutral lipids and glycolipids were removed using chloroform and acetone, respectively. Phospholipids were obtained by elution with methanol, saponified and methylated to fatty acid methyl esters (FAMEs) under N2 at 37 °C. The phospholipids were then dissolved in hexane that contained a 19:0 (methyl nonadecanoate fatty acid) FAME standard. The PLFA methyl esters were separated and identified on a gas chromatographer (N6890, Agilent, USA) fitted with an MIDI Sherlocks microbial identification system (Version 4.5, MIDI, Newark , DE , USA), with fatty acid 19:0 added as an internal standard. The concentrations of PLFAs were expressed as nmol g−1 soil on a dry weight basis. In this study, fungi were represented by a total of 16:1 ω 5c and 18:2 ω 6c; Gram positive bacteria (G+) by a total of i15:0, a15:0, i16:0, i17:0 and a17:0; Gram negative bacteria (G) by a total of 16:1 ω 7c, cy17:0 ω 7c, 18:1 ω 7c and cy19:0 ω 7c; general bacteria by a total of 16:0, 18:0 and 18:1 ω 9c; actinomycetes by a total of 10Me16:0, 10Me17:1 ω 7c, 10Me17:0 and 10Me18:1 ω 7c.
The δ13C values of individual PLFAs were measured using a GC Isolink Trace GC ultra-coupled to a Delta V Advantage IRMS (Thermo Scientific, Finnigan, Germany). Detailed information on the equipment and operation conditions has been published previously [22].
The amount of PLFA derived from litter (Pi, ng g−1) for an individual PLFA was calculated as:
Pi = Mi × f litter
where Mi is the molar concentration of the individual PLFA and flitter is the ratio of PLFA from 13C litter to control soil.
flitter was calculated as:
f = [ ( δ δ s ) / ( δ litter   δ s ) ]
where δ is the δ13C value of the individual PLFA in the sample amended with 13C litter, δs is the δ13C value of the individual PLFA in the control soil and δlitter is the δ13C value of the experimental litter (‰).

2.7. Statistical Analyses

One-way analysis of variance (ANOVA) combined with the Tukey test was used to identify significant differences (p < 0.05) in SOC, TN and SOC/TN at different time points. Nonlinear regression analysis was used to identify the best-fit relationship among CO2 efflux, δ13C, C proportion derived from litter and native SOC, primed C, priming effect and incubation time. Linear regression analysis was selected (based on a higher R2 and lower p value compared with other regression models) to identify the relationship among specific microbial groups, individual PLFA, β-glucosidase activity, microbial abundance derived from litter or native SOC, and incubation time, as well as the relationship between β-glucosidase activity and the abundance of microbial groups. Student’s t-tests were used to detect significant differences (p < 0.05) in total CO2 efflux, as well as microbial characteristics between control and litter-amended soils at specific sampling points.
Principal component analysis (PCA) was used to visualize differences in microbial community composition between the control and litter-amended soils, as well as differences in individual PLFA markers derived from native soil C and litter C. Permutation multivariate analysis of variance (PERMANOVA) was used to assess the statistical significance of the differences.
Partial least squares path modeling (PLS-PM) was used to investigate possible causal relationships among incubation time, microbial communities associated with litter degradation and native SOC mineralization, enzyme activity of β-glucosidase and changes in SOC (ΔCSOC+litter) under litter incorporation. We used 999 bootstraps to calculate coefficients of determination (R2) and path coefficients. Variance explained by the model was indicated by R2 values. Goodness of fit was used to train the model in order to ensure the best overall predictive performance. Path coefficients indicated the direction and strength of relationships between variables. Indirect effects were determined by multiplying the path coefficients between two variables (predictor and response) [23].
All statistical analyses were performed in R (version 3.5.1), using the ‘stats’ package for ANOVA and regression analysis, the ‘vegan’ package for PCA and PERMANOVA and the ‘plspm’ package for PLS-PM.

3. Results

3.1. Changes in SOC

SOC and TN significantly (p < 0.05) decreased with increasing incubation time in soils with and without litter incorporation (Table 1). On incubation day 90, SOC and TN decreased by 22.0% and 22.6% in the control soil and by 16.5% and 15.1% in the litter-amended soil, respectively. The SOC/TN ratio decreased significantly in the litter-amended soil, but only changed slightly in the control.

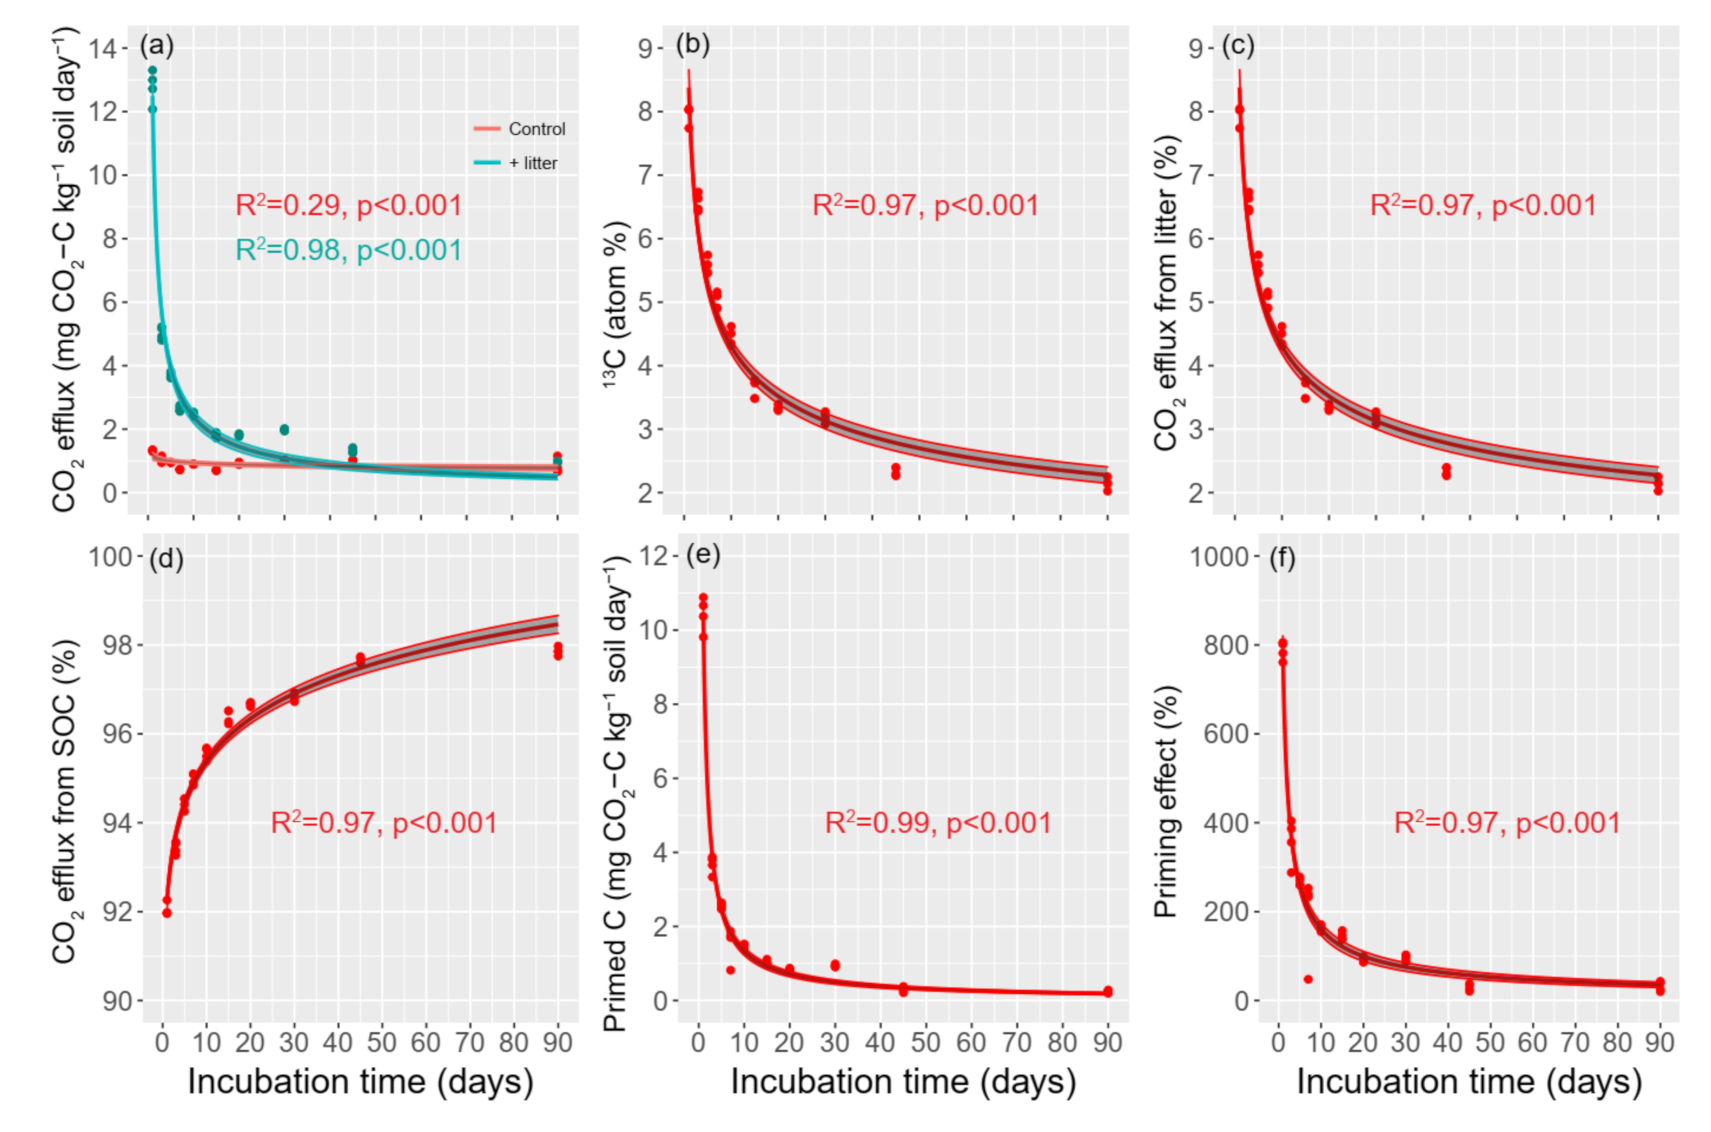
3.2. Changes in CO2 Efflux

Soil CO2 efflux in the control soil (indicated by basal respiration) decreased from the first day to day 15, increased slightly by day 45, and decreased again by day 90 (Figure 1a), and there is a significant difference between day 15 and day 45. Litter incorporation significantly (p < 0.01) increased CO2 efflux relative to control soils between day 1 and day 45 (Figure 1a; Table S1). In litter-amended soils, CO2 efflux declined sharply from day 1 to day 3 and declined more slowly thereafter until the end of the incubation period (Figure 1a), and there is a significant difference among day 15, day 45 and day 90. A power equation fit the relationship between CO2 efflux and incubation time well (control soil: R2 = 0.29, p < 0.001; litter-amended soil: R2=0.98, p < 0.001).
According to the correlation of atom (%) 13C value with incubation time (power function with R2=0.97, p < 0.001, Figure 1b), CO2 efflux in the litter-amended soils was derived from two sources: tea litter and native SOC (power function with R2=0.97, p < 0.001, Figure 1c,d). During the entire incubation period, the majority of the CO2 was derived from native SOC degradation (accounting for 92–98%), while a small fraction of CO2 was derived from litter degradation (2–8%). Over the incubation period, the proportion of native SOC increased, whereas that of litter decreased.
Litter incorporation can affect the degradation of native SOC, which is known as the PE. Positive PE increases native SOC mineralization, while negative PE inhibits native SOC mineralization. In our study, a strong positive PE was observed over the incubation period (power function with R2 = 0.97, p < 0.001, Figure 1f). PE increased dramatically in the first five days of incubation, and then sharply declined until the end of the incubation period. The CO2 efflux derived from native SOC was determined to be primed C based on the value of 13C (atom, %). At the beginning of the incubation period, the primed C increased sharply, and then declined slowly until the end of the incubation period (power function with R2 = 0.99, p < 0.001, Figure 1e).

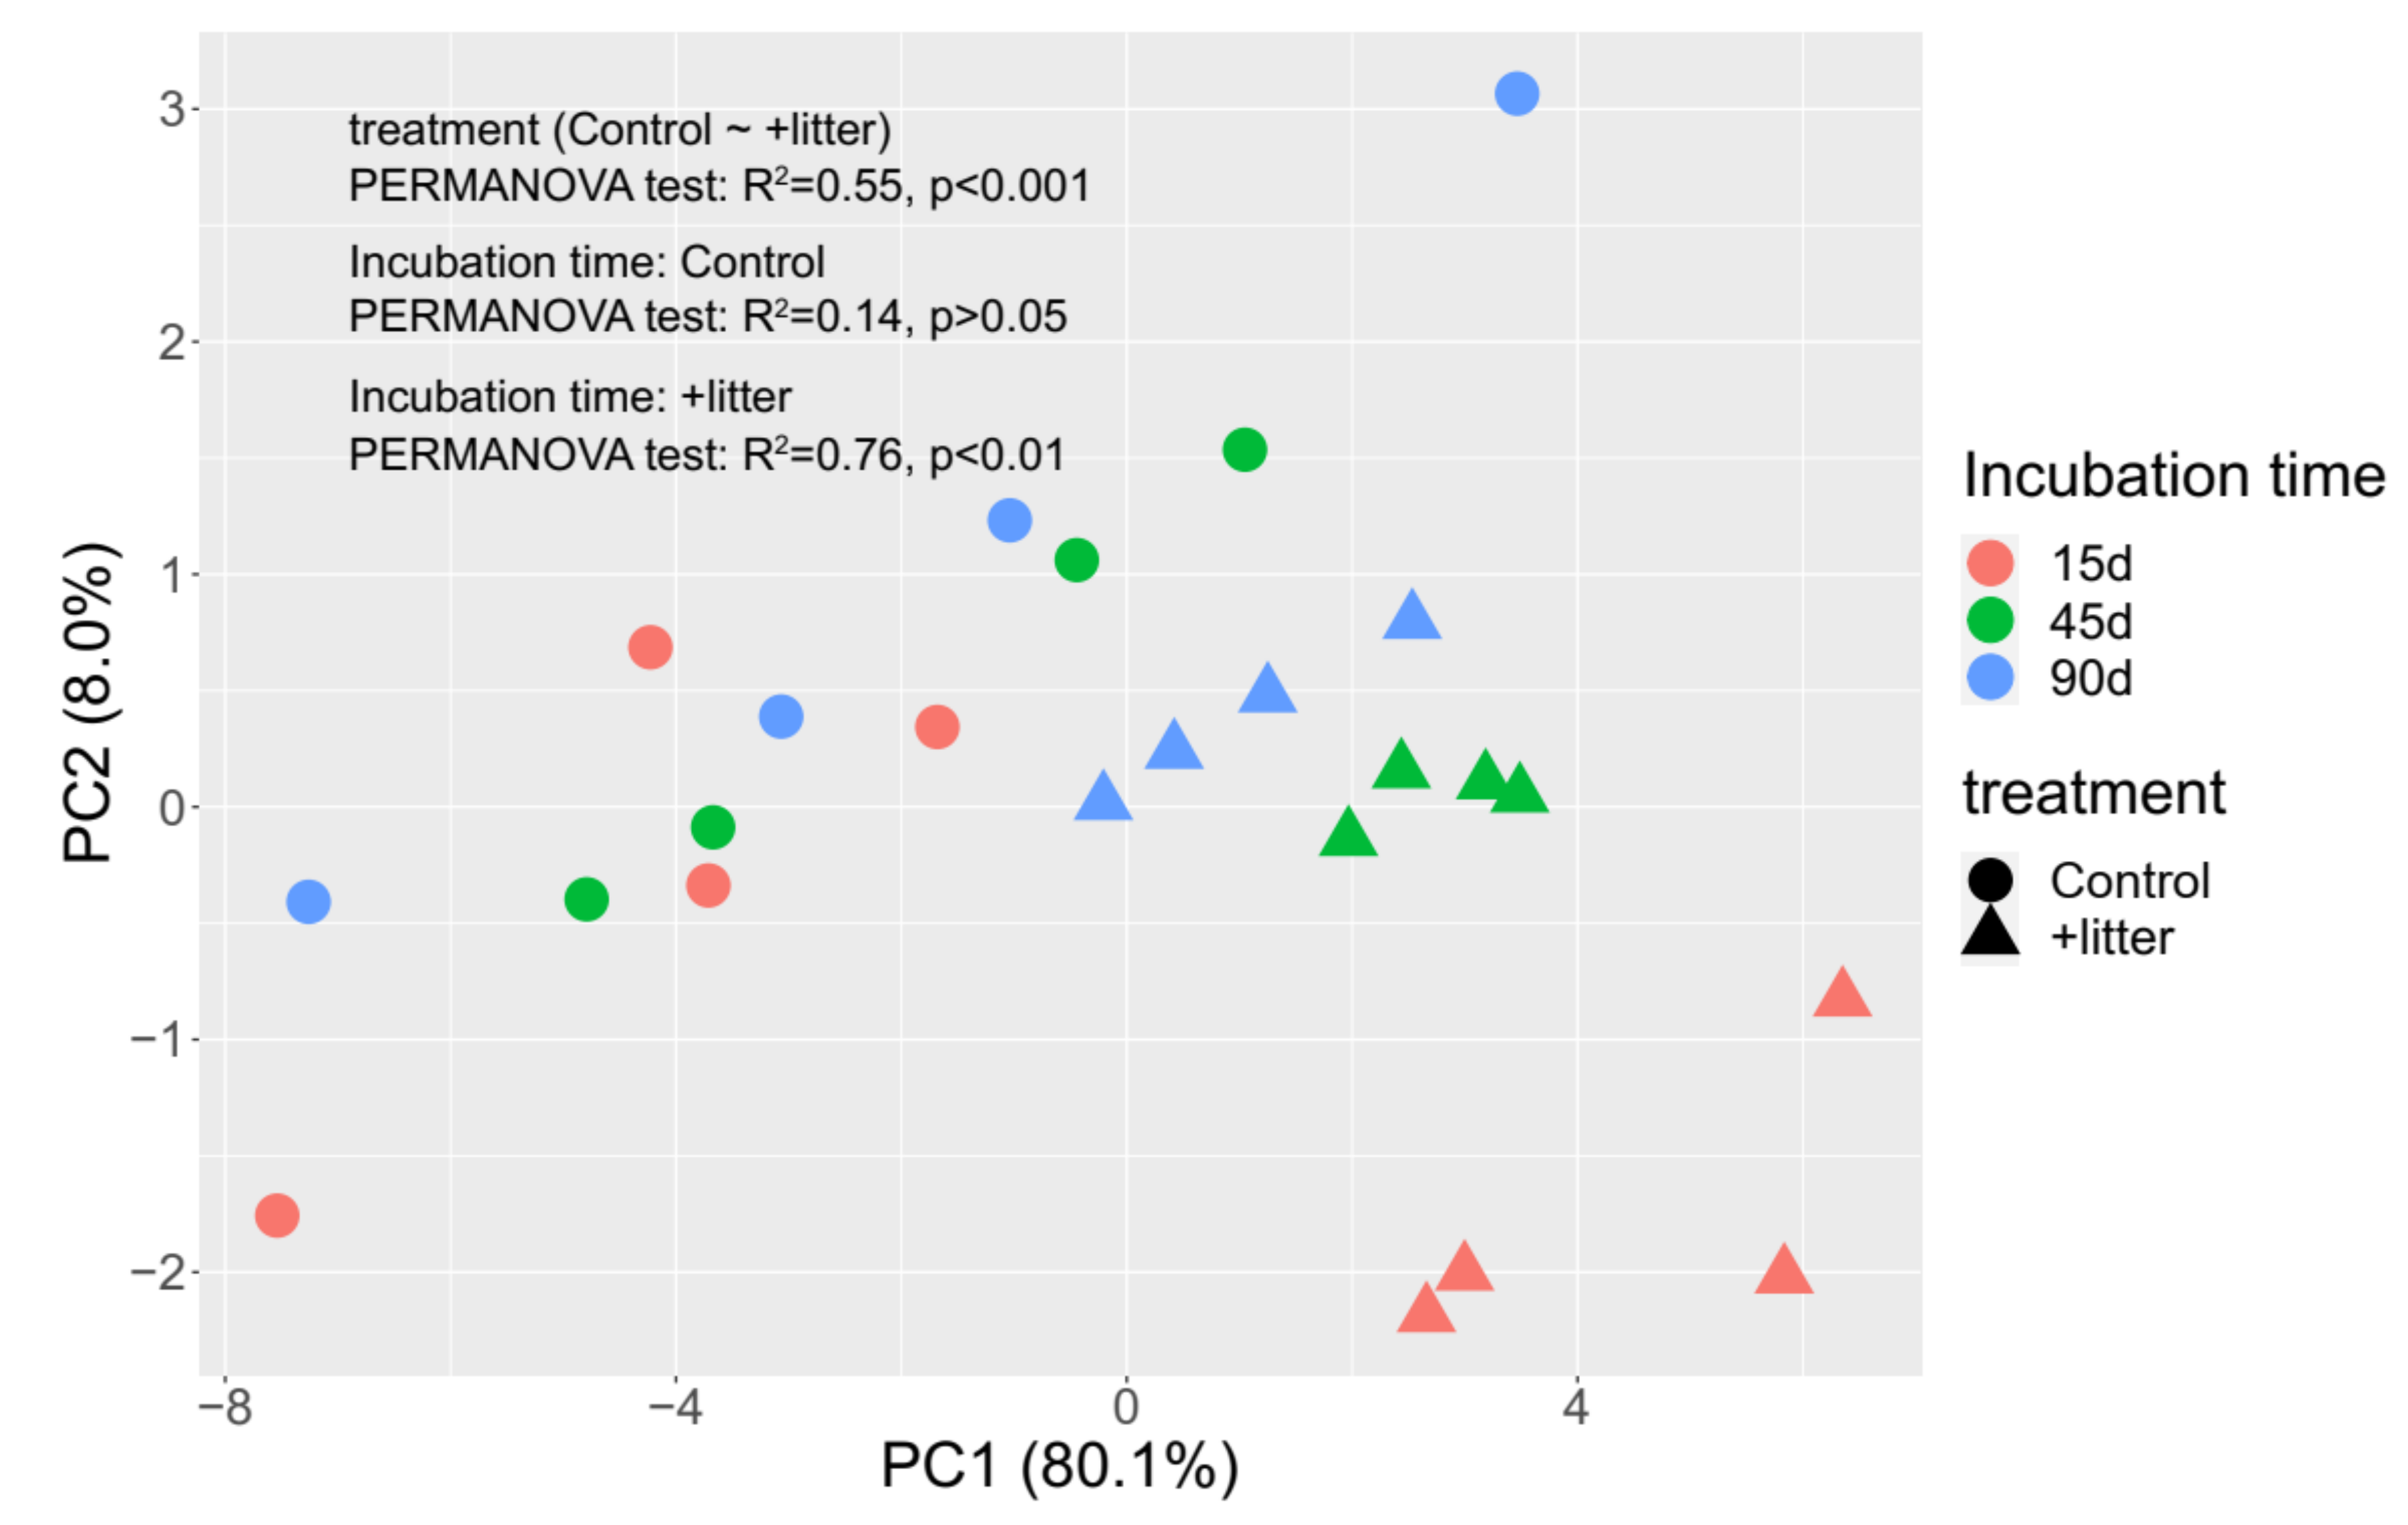
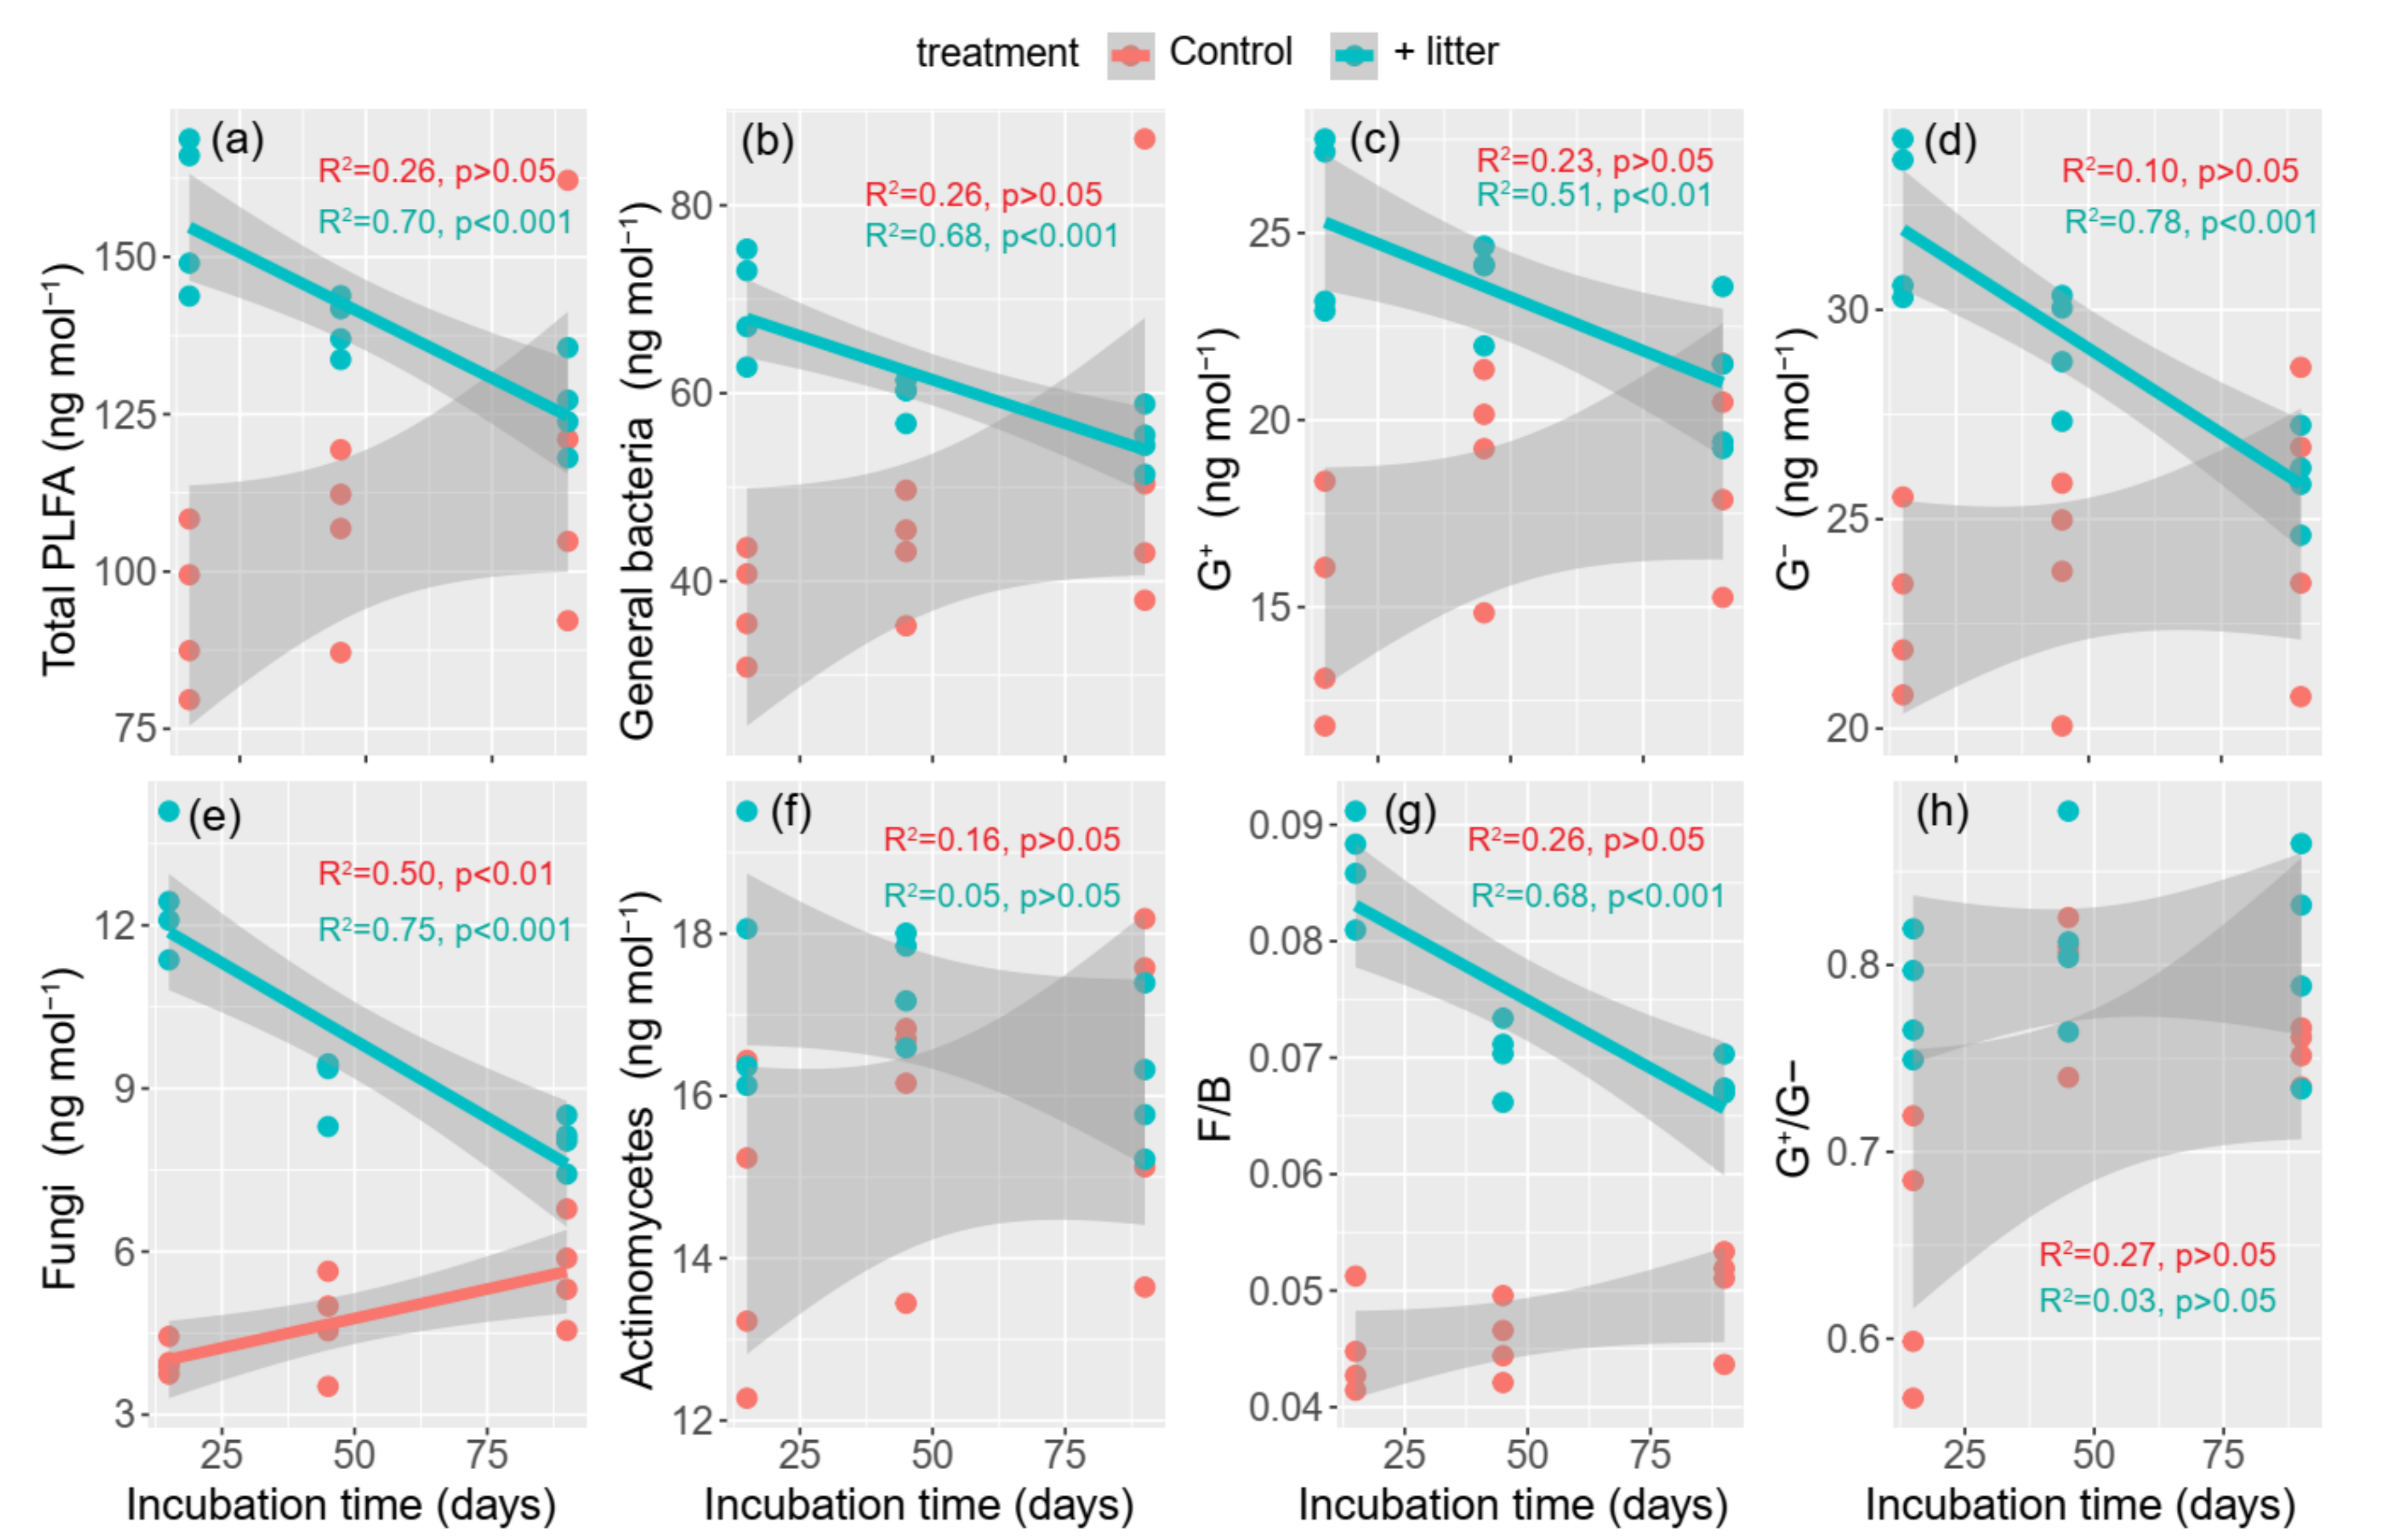
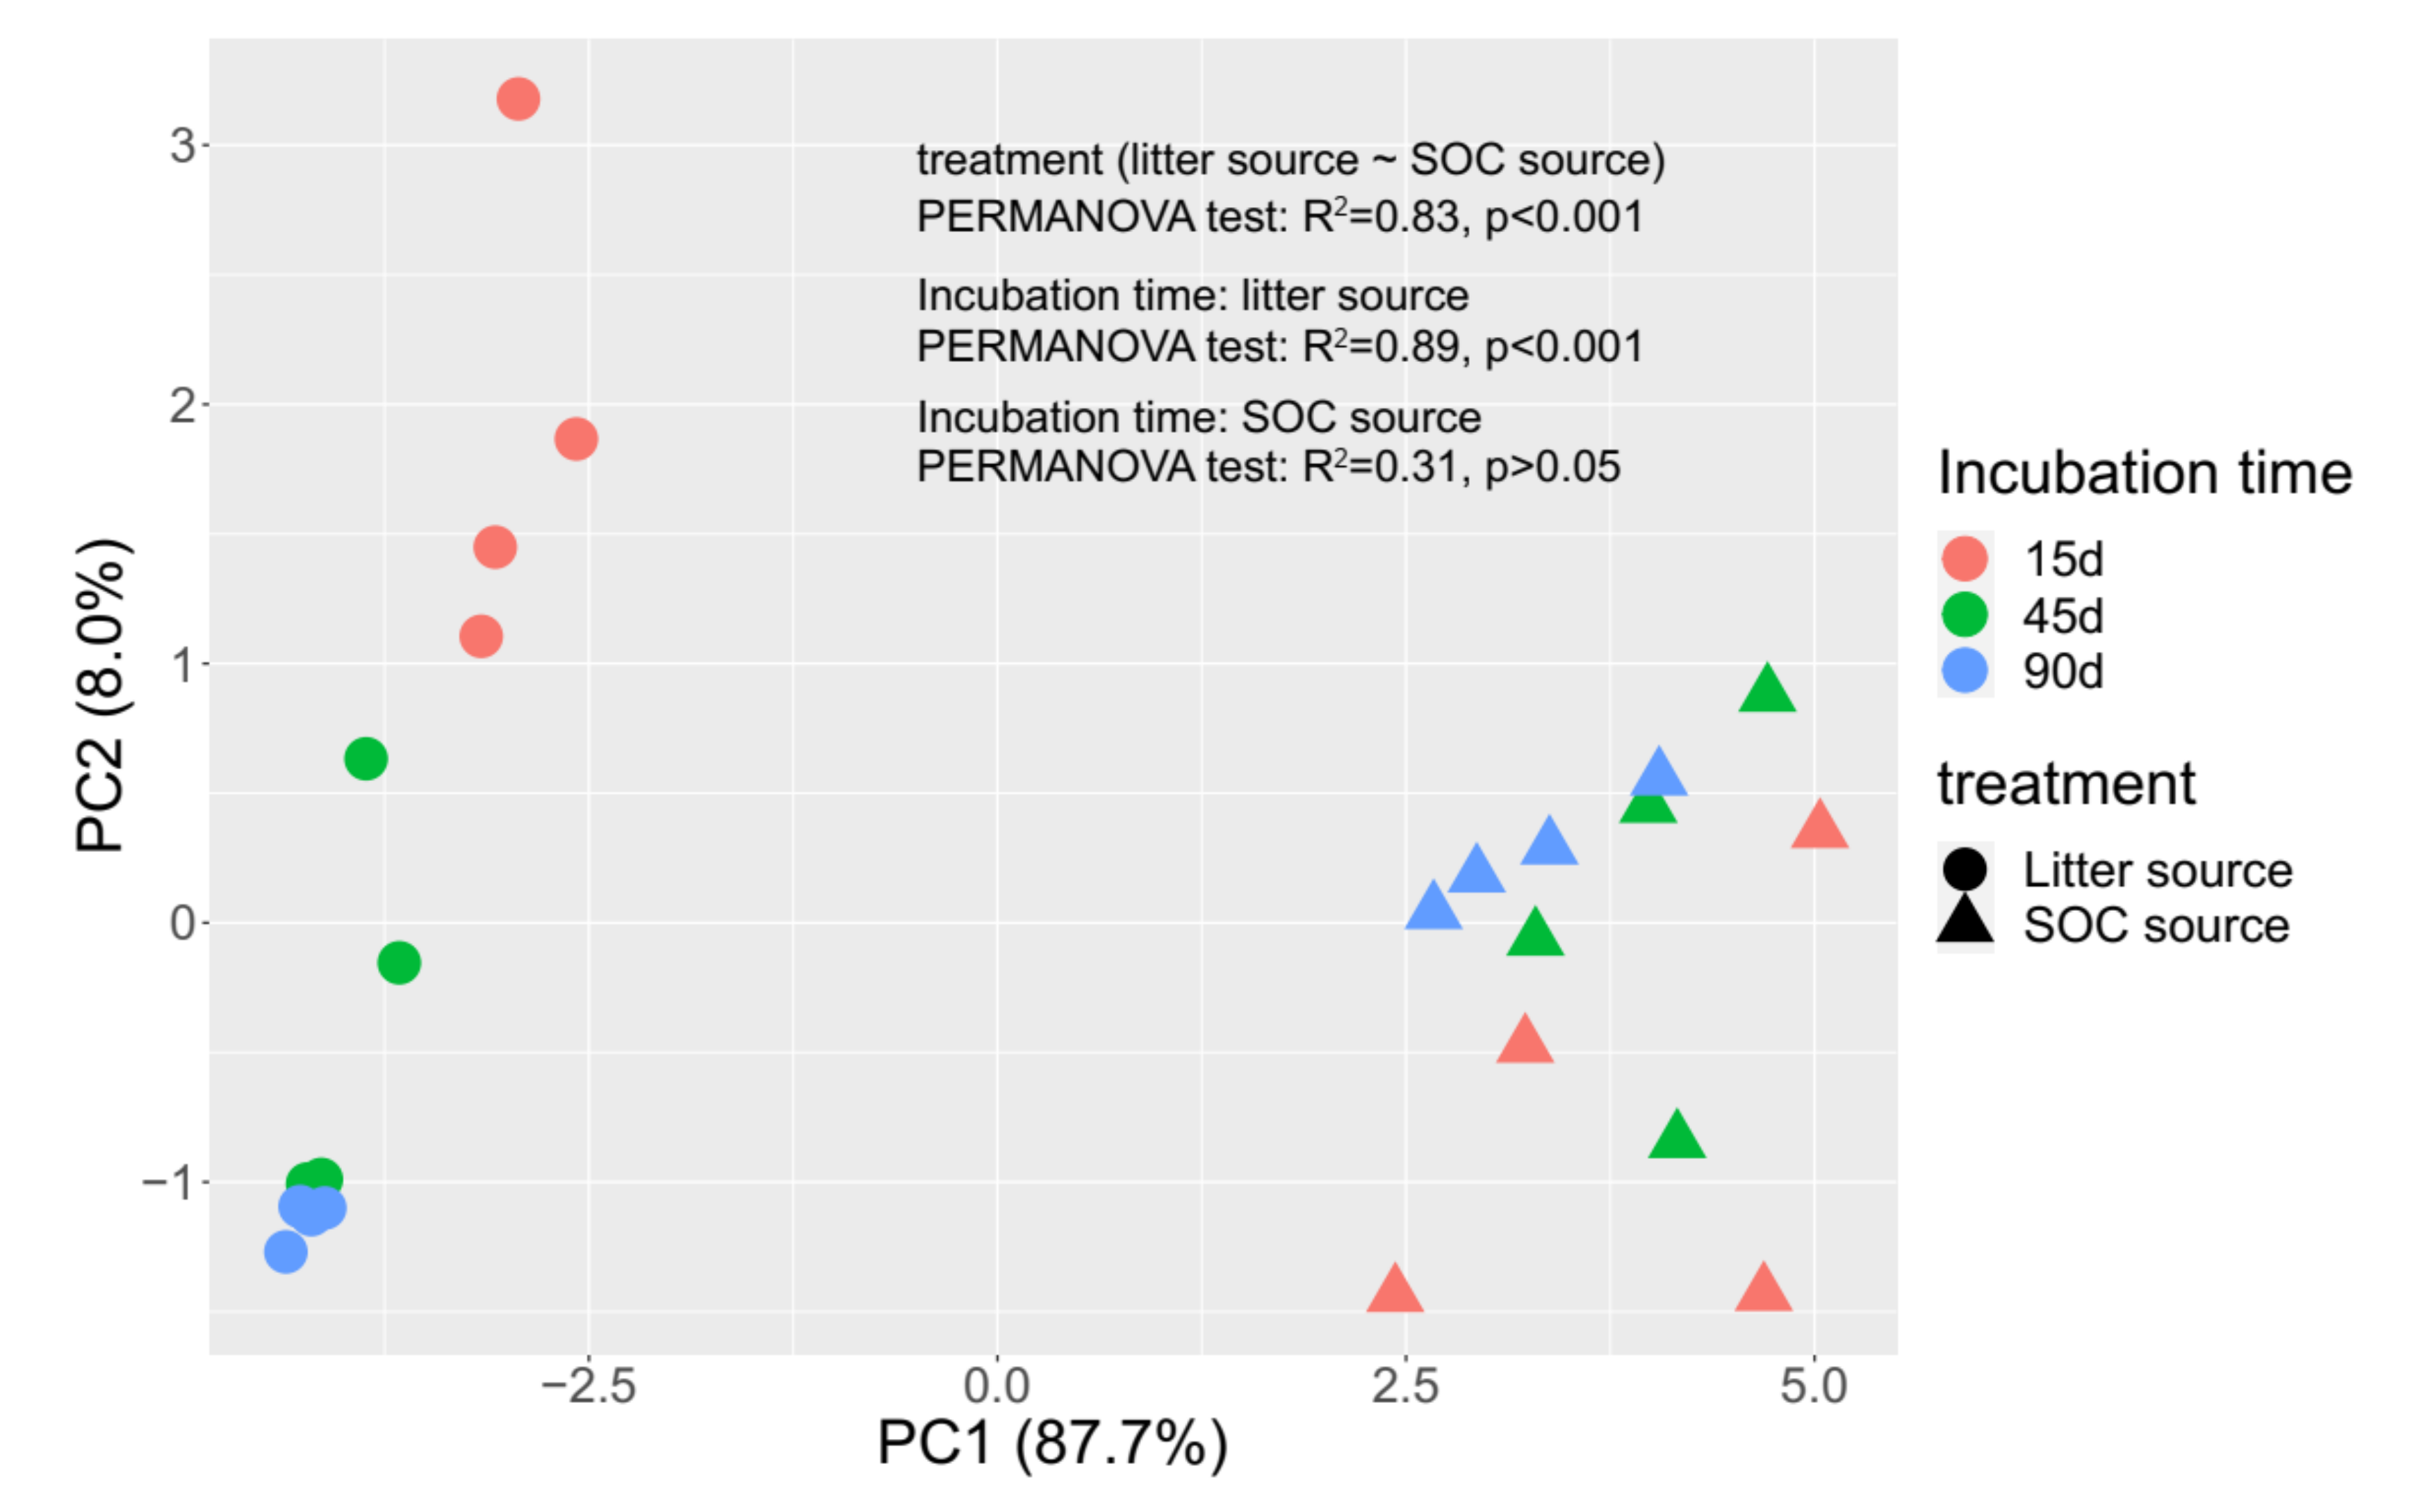
3.3. Microbial Community Composition

A significant difference was observed in the microbial communities between the control and litter-amended soils (R2 = 0.55, p < 0.001, confirmed by the PERMANOVA testing) (Figure 2). The first two coordinates explained 80.1% (PC1) and 8.0% (PC2) of the total variation in the microbial community. Compared with the control soil, the tight clustering of litter-amended samples indicated that they possessed highly similar microbial communities. Among litter-amended soils, an obvious succession occurred within the microbial community over the course of incubation (R2 = 0.76, p < 0.01), whereas in the control soil, microbial communities tended to be more stable and cluster in a dispersed manner (R2 = 0.14, p > 0.05).
In both the control and litter-amended soils, microbial communities were dominated by general bacteria (control soil: 40.2–45.5%; litter-amended soil: 43.0–43.7%), followed by G (20.8–24.4% and 20.0–20.9%), G+ (15.7–17.8% and 15.8–17.1%), actinomycetes (13.4–15.3% and 10.9–12.8%) and fungi (4.3–4.7% and 6.3–9.7%) (Figure S1). Compared with control soil, litter incorporation significantly increased the microbial biomass of all groups, with the largest biomass increase seen on days 15 and 45 (Figure 3; Table S2). The largest differences between the two treatments were observed in the fungal group, which had 1.42- to 3.13-fold higher biomass in the litter-amended soil compared to the control soil (Figure 3; Table S2). Additionally, control and litter-amended soils showed an opposite trend of microbial biomass accumulation. In the control soil, microbial biomass increased slightly over time, but only fungal biomass exhibited a statistically significant increase, which could be fit by a linear regression model (R2 = 0.50, p < 0.01). By contrast, the microbial biomass of all groups (general bacteria: R2 = 0.68, p < 0.001; G+: R2 = 0.51, p < 0.01; G+: R2 = 0.78, p < 0.001 and fungi: R2 = 0.75, p<0.001) significantly decreased in litter-amended soil over the incubation period, with the exception of actinomycetes biomass (R2 = 0.05, p > 0.05). A similar trend was observed regarding the individual microbial biomass and incubation time between control and litter-amended soils (Figure S2; Table S3).
In addition to microbial biomass increases, the total PLFA was significantly higher under litter-amended soil compared to control, which significantly decreased over the incubation period (R2 = 0.70, p < 0.001) (Figure 3). Compared with control soil, litter incorporation significantly (p < 0.05) increased the ratio of fungi to bacteria (F/B) over the course of the incubation period (R2 = 0.68, p < 0.001). No significant difference was observed between G+/G over the course of incubation (control soil: R2 = 0.27, p > 0.05; litter-amended soil: R2 = 0.03, p > 0.05).

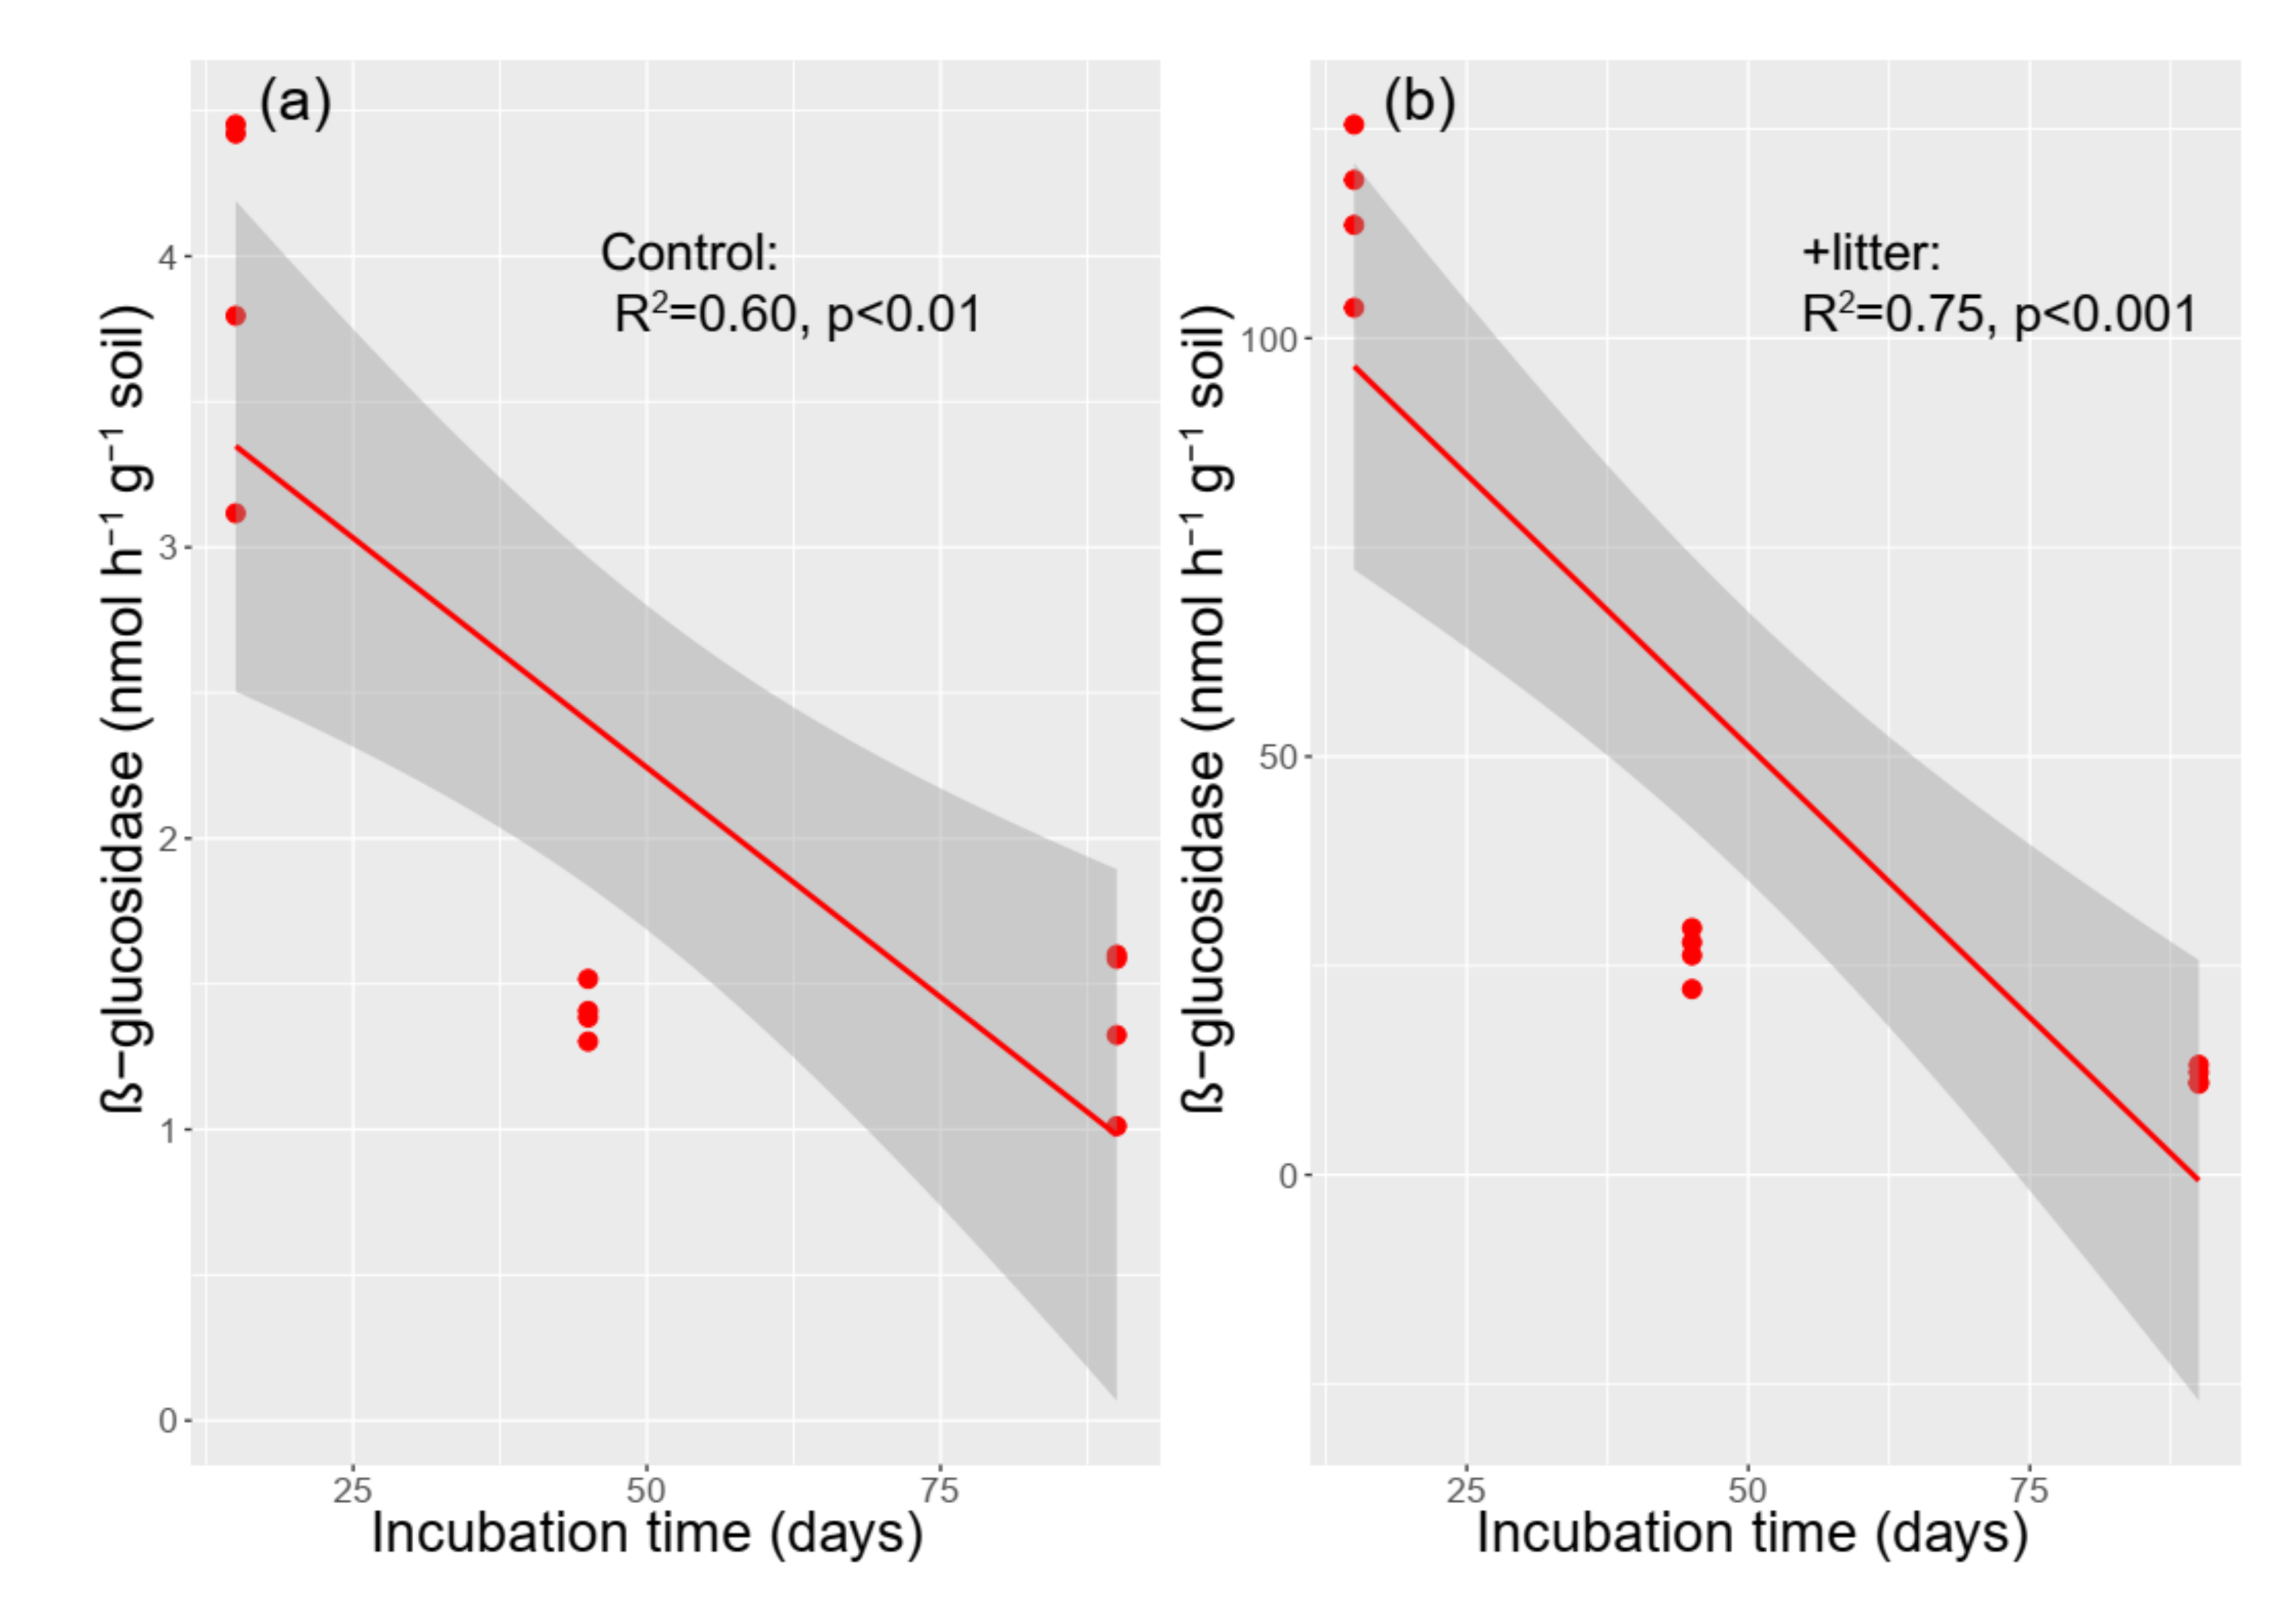
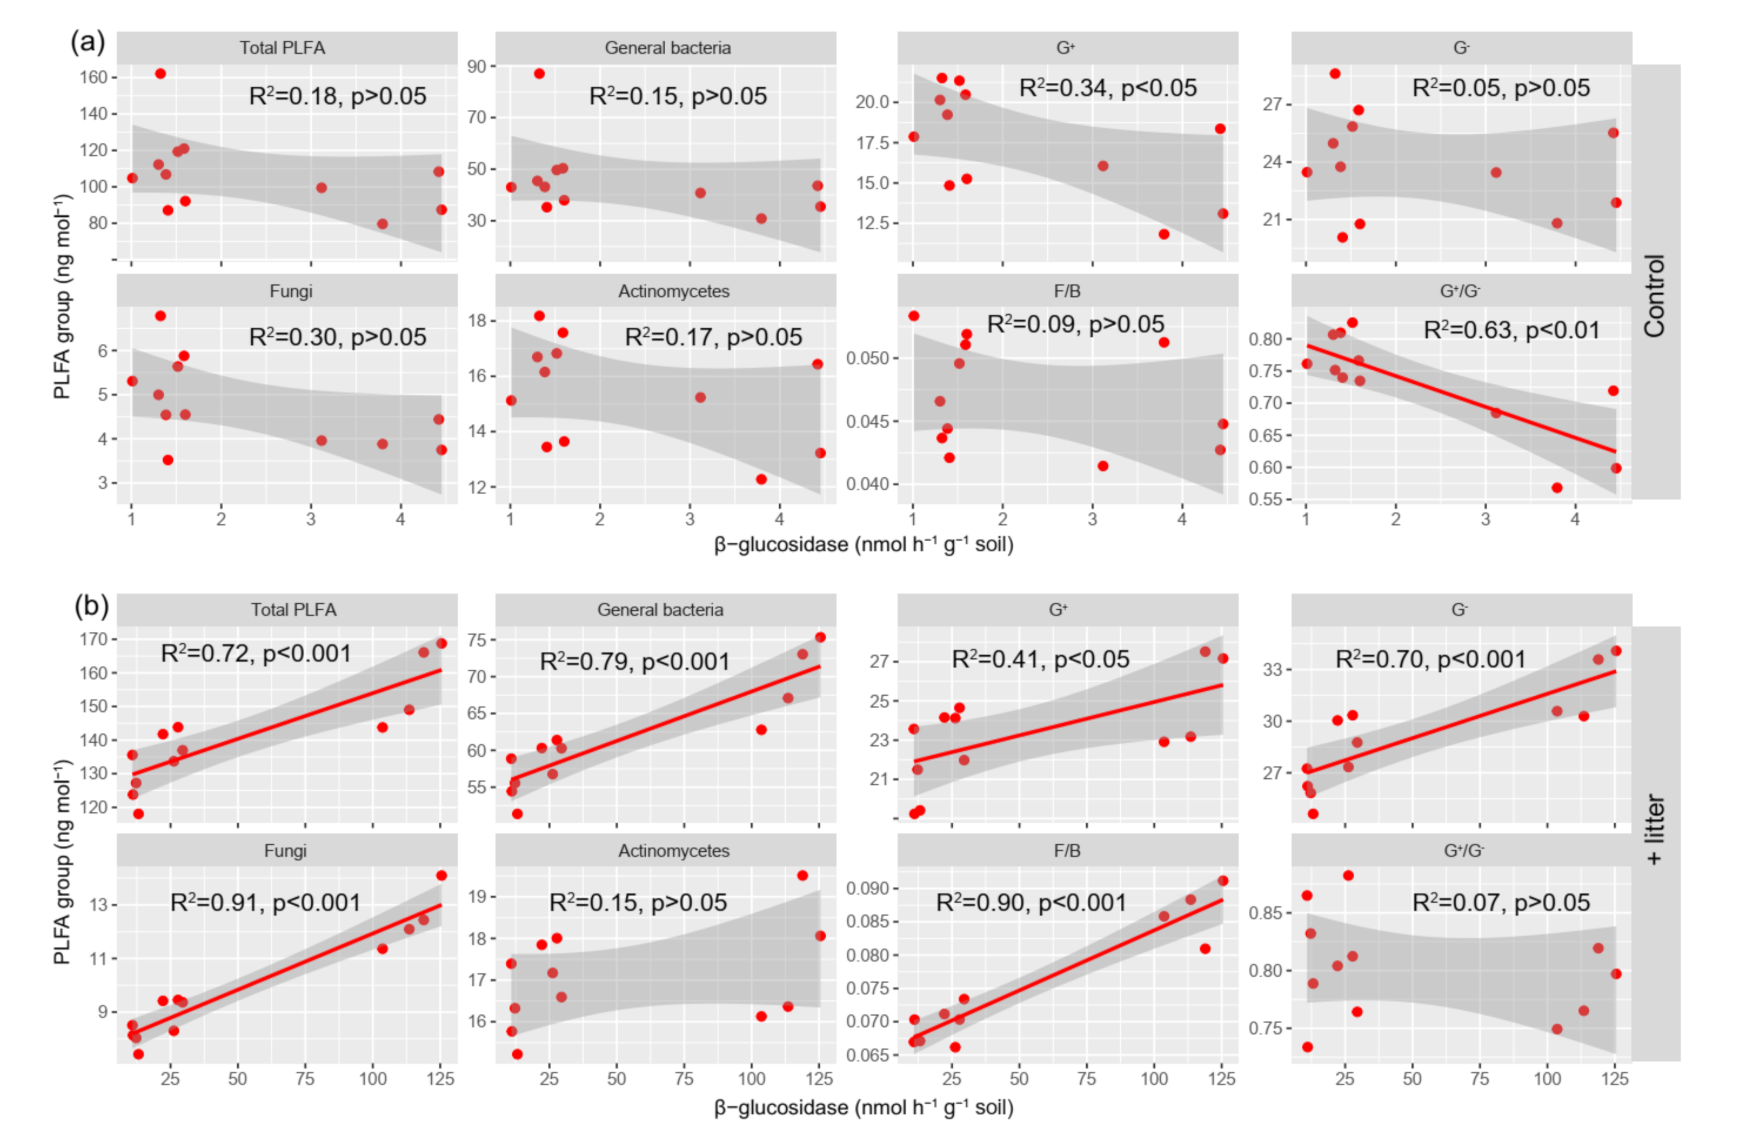
3.4. The Activity of β-glucosidase

In the control soil, the activity of β-glucosidase ranged from 1.0–4.5 nmol g−1 h−1, with significantly higher enzyme activities observed in the litter-amended soil (10.9–126 nmol g−1 h−1; Figure 4; Table S2). On day 15, the activity of β-glucosidase increased 29.7-fold compared with control soil. Additionally, in both the control and litter-amended soil, the activity of β-glucosidase decreased gradually over the incubation period. The relationship between enzyme activity and incubation time fit a linear regression model (control soil: R2 = 0.60, p < 0.01; litter-amended soil: R2 = 0.75, p < 0.011; Figure 4).
The correlations between β-glucosidase activity and each microbial group, as well as PLFA, were also examined (Figure 5 and Figure S4). In the control soil, there was a negative relationship between the five microbial groups, total PLFA, F/B, G+/G and β-glucosidase, but only G+/G was significantly correlated with β-glucosidase activity (R2 = 0.63, p < 0.01). By contrast, in the litter-amended soil, most of the microbial groups were positively correlated with β-glucosidase activity, including general bacteria (R2 = 0.79, p < 0.001), G+ (R2 = 0.41, p < 0.05), G (R2 = 0.70, p < 0.001) and fungi (R2 = 0.91, p < 0.001). Additionally, β-glucosidase activity was positively correlated with total PLFA (R2 = 0.72, p < 0.001) and F/B (R2 = 0.90, p < 0.001). The same trend was observed between β-glucosidase activity and individual PLFA in both control and litter-amended soils (Figure S4).

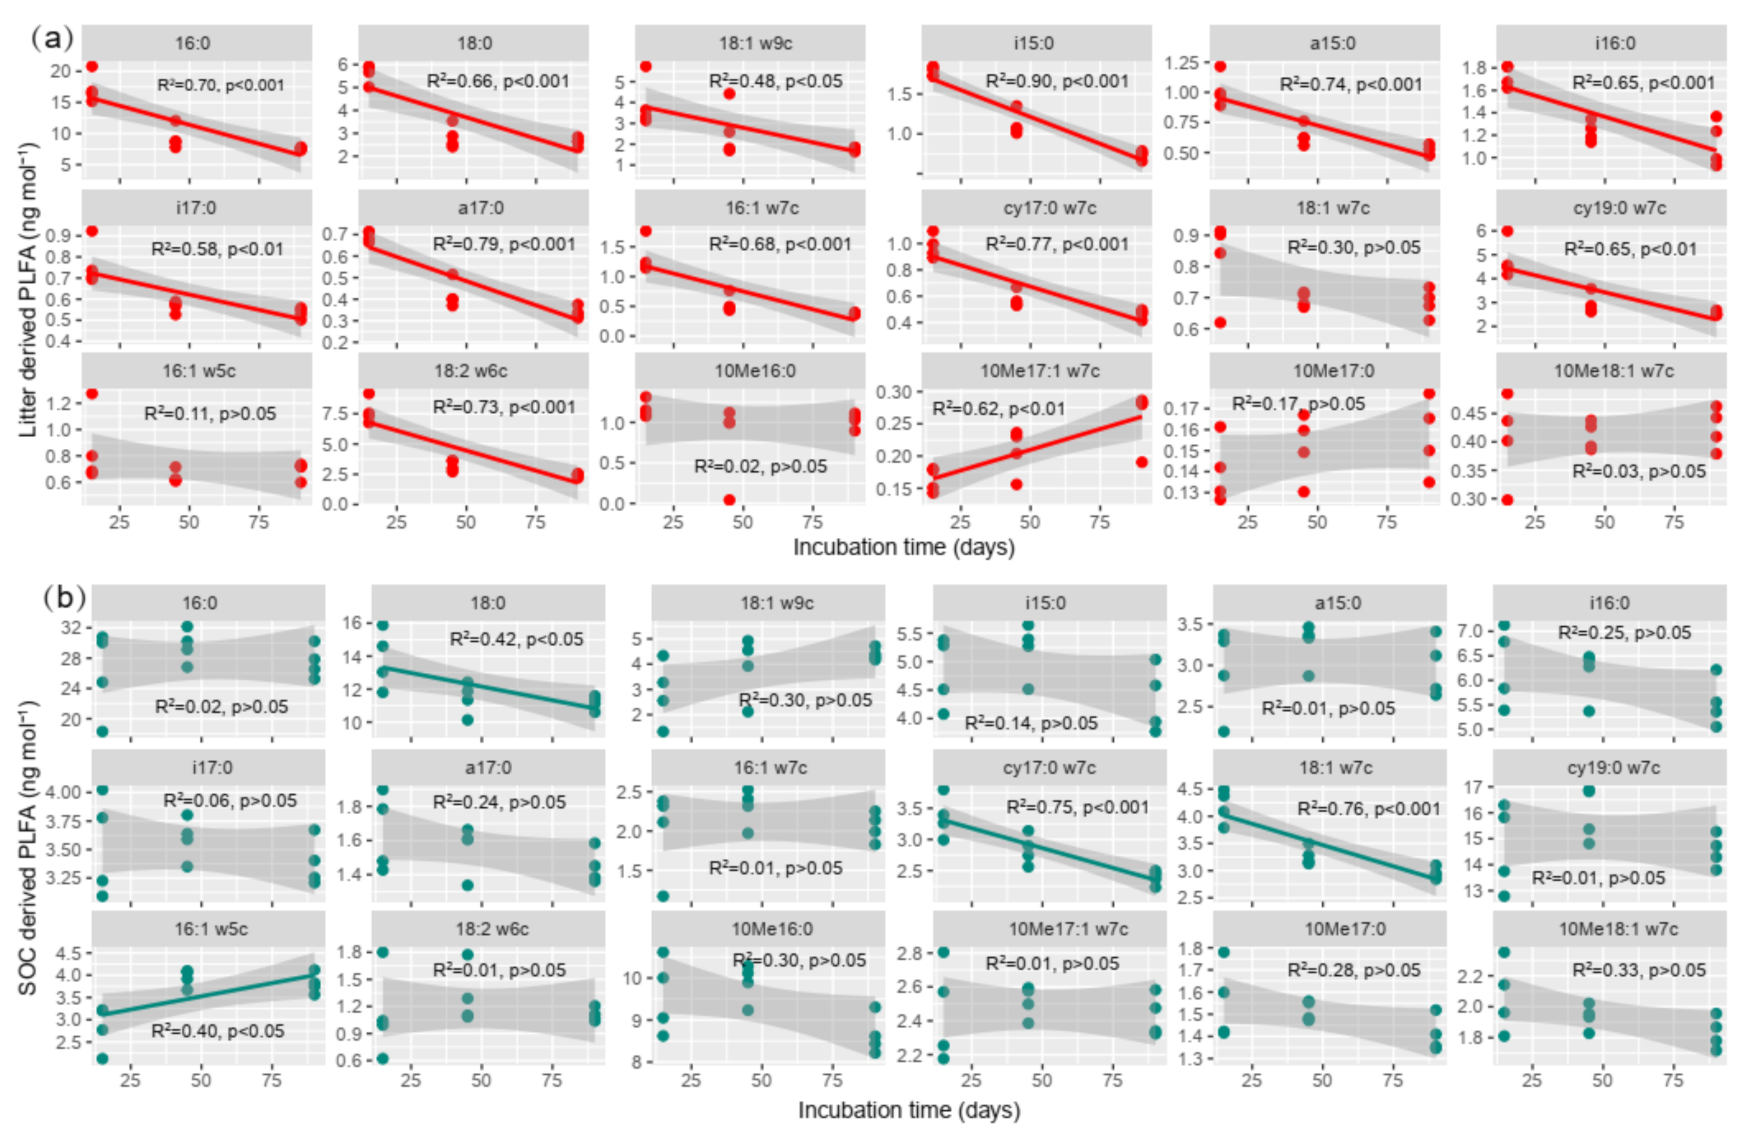
3.5. Microbial Communities Are Involved in Tea Litter Degradation

With the help of the 13C tracing method, C involved individual microbial composition under litter incorporation could be distinguished from litter C and native SOC sources. A significant difference was observed in the composition of microbial communities derived from litter sources compared to those derived from native SOC (PERMANOVA test, R2 = 0.83, p < 0.001) (Figure 6), while PC1 and PC2 explained 87.7% and 8.0% of the total variation, respectively (Figure 6). The compositions of microbial communities involved in litter degradation were significantly different among the three sampling points (R2 = 0.89, p < 0.001), whereas microbial communities involved in native SOC degradation were highly similar (R2 = 0.31, p > 0.05). These findings indicate that the changes in microbial communities under litter incorporation were mainly caused by the differences in communities involved in tea litter degradation. Conversely, the microbial communities involved in native SOC degradation tended to be more stable over the course of incubation.
As noted earlier, the C incorporated into individual microbial communities was derived from both litter and native SOC. The microbial communities involved in litter degradation were dominated by general bacteria (accounting for 33.2–42.6% of the total abundance), followed by fungi (23.4–30.0%), G+ (15.3–18.4%), actinomycetes (9.5–12.9%) and G groups (5.5–9.0%) (Figure S3). Among microbial groups, general bacteria contained 16:0, 18:0 and 18:1 ω 9c (R2 = 0.48–0.70, p < 0.05), the G+ group contained i15:0, a15:0, i16:0, i17:0 and a17:0 (R2 = 0.58–90, p < 0.01), both of which showed a significant decrease over incubation time (Figure 7a). Among the G group, 16:1 ω 7c, cy17:0 ω 7c and cy19:0 ω 7c (R2 = 0.65–77, p < 0.01) significantly decreased over the incubation time. In the fungal group, only arbuscular mycorrhizal (AM) fungi (16:2 ω 6c) significantly (R2 = 0.73, p < 0.001) decreased over the incubation period. Unlike the aforementioned groups, a positive relationship was observed between the actinomycete group and incubation time, but only 10Me17:1 ω 7c (R2 = 0.62, p < 0.01) showed a significant difference.
We also found that PLFA was preferentially derived from native SOC (Figure 7b; Table S4). However, an inverse relationship between SOC-derived PLFA and incubation time was observed (Figure 7b), in which general bacteria 18:0 (R2 = 0.42, p < 0.05), G group cy17:0 ω 7c (R2 = 0.75, p < 0.001) and 18:1 ω 7c (R2 = 0.76, p < 0.001) were negatively correlated with incubation time, and only the fungal group of 16:1 ω 5c was positively correlated with incubation time (R2 = 0.40, p < 0.05).

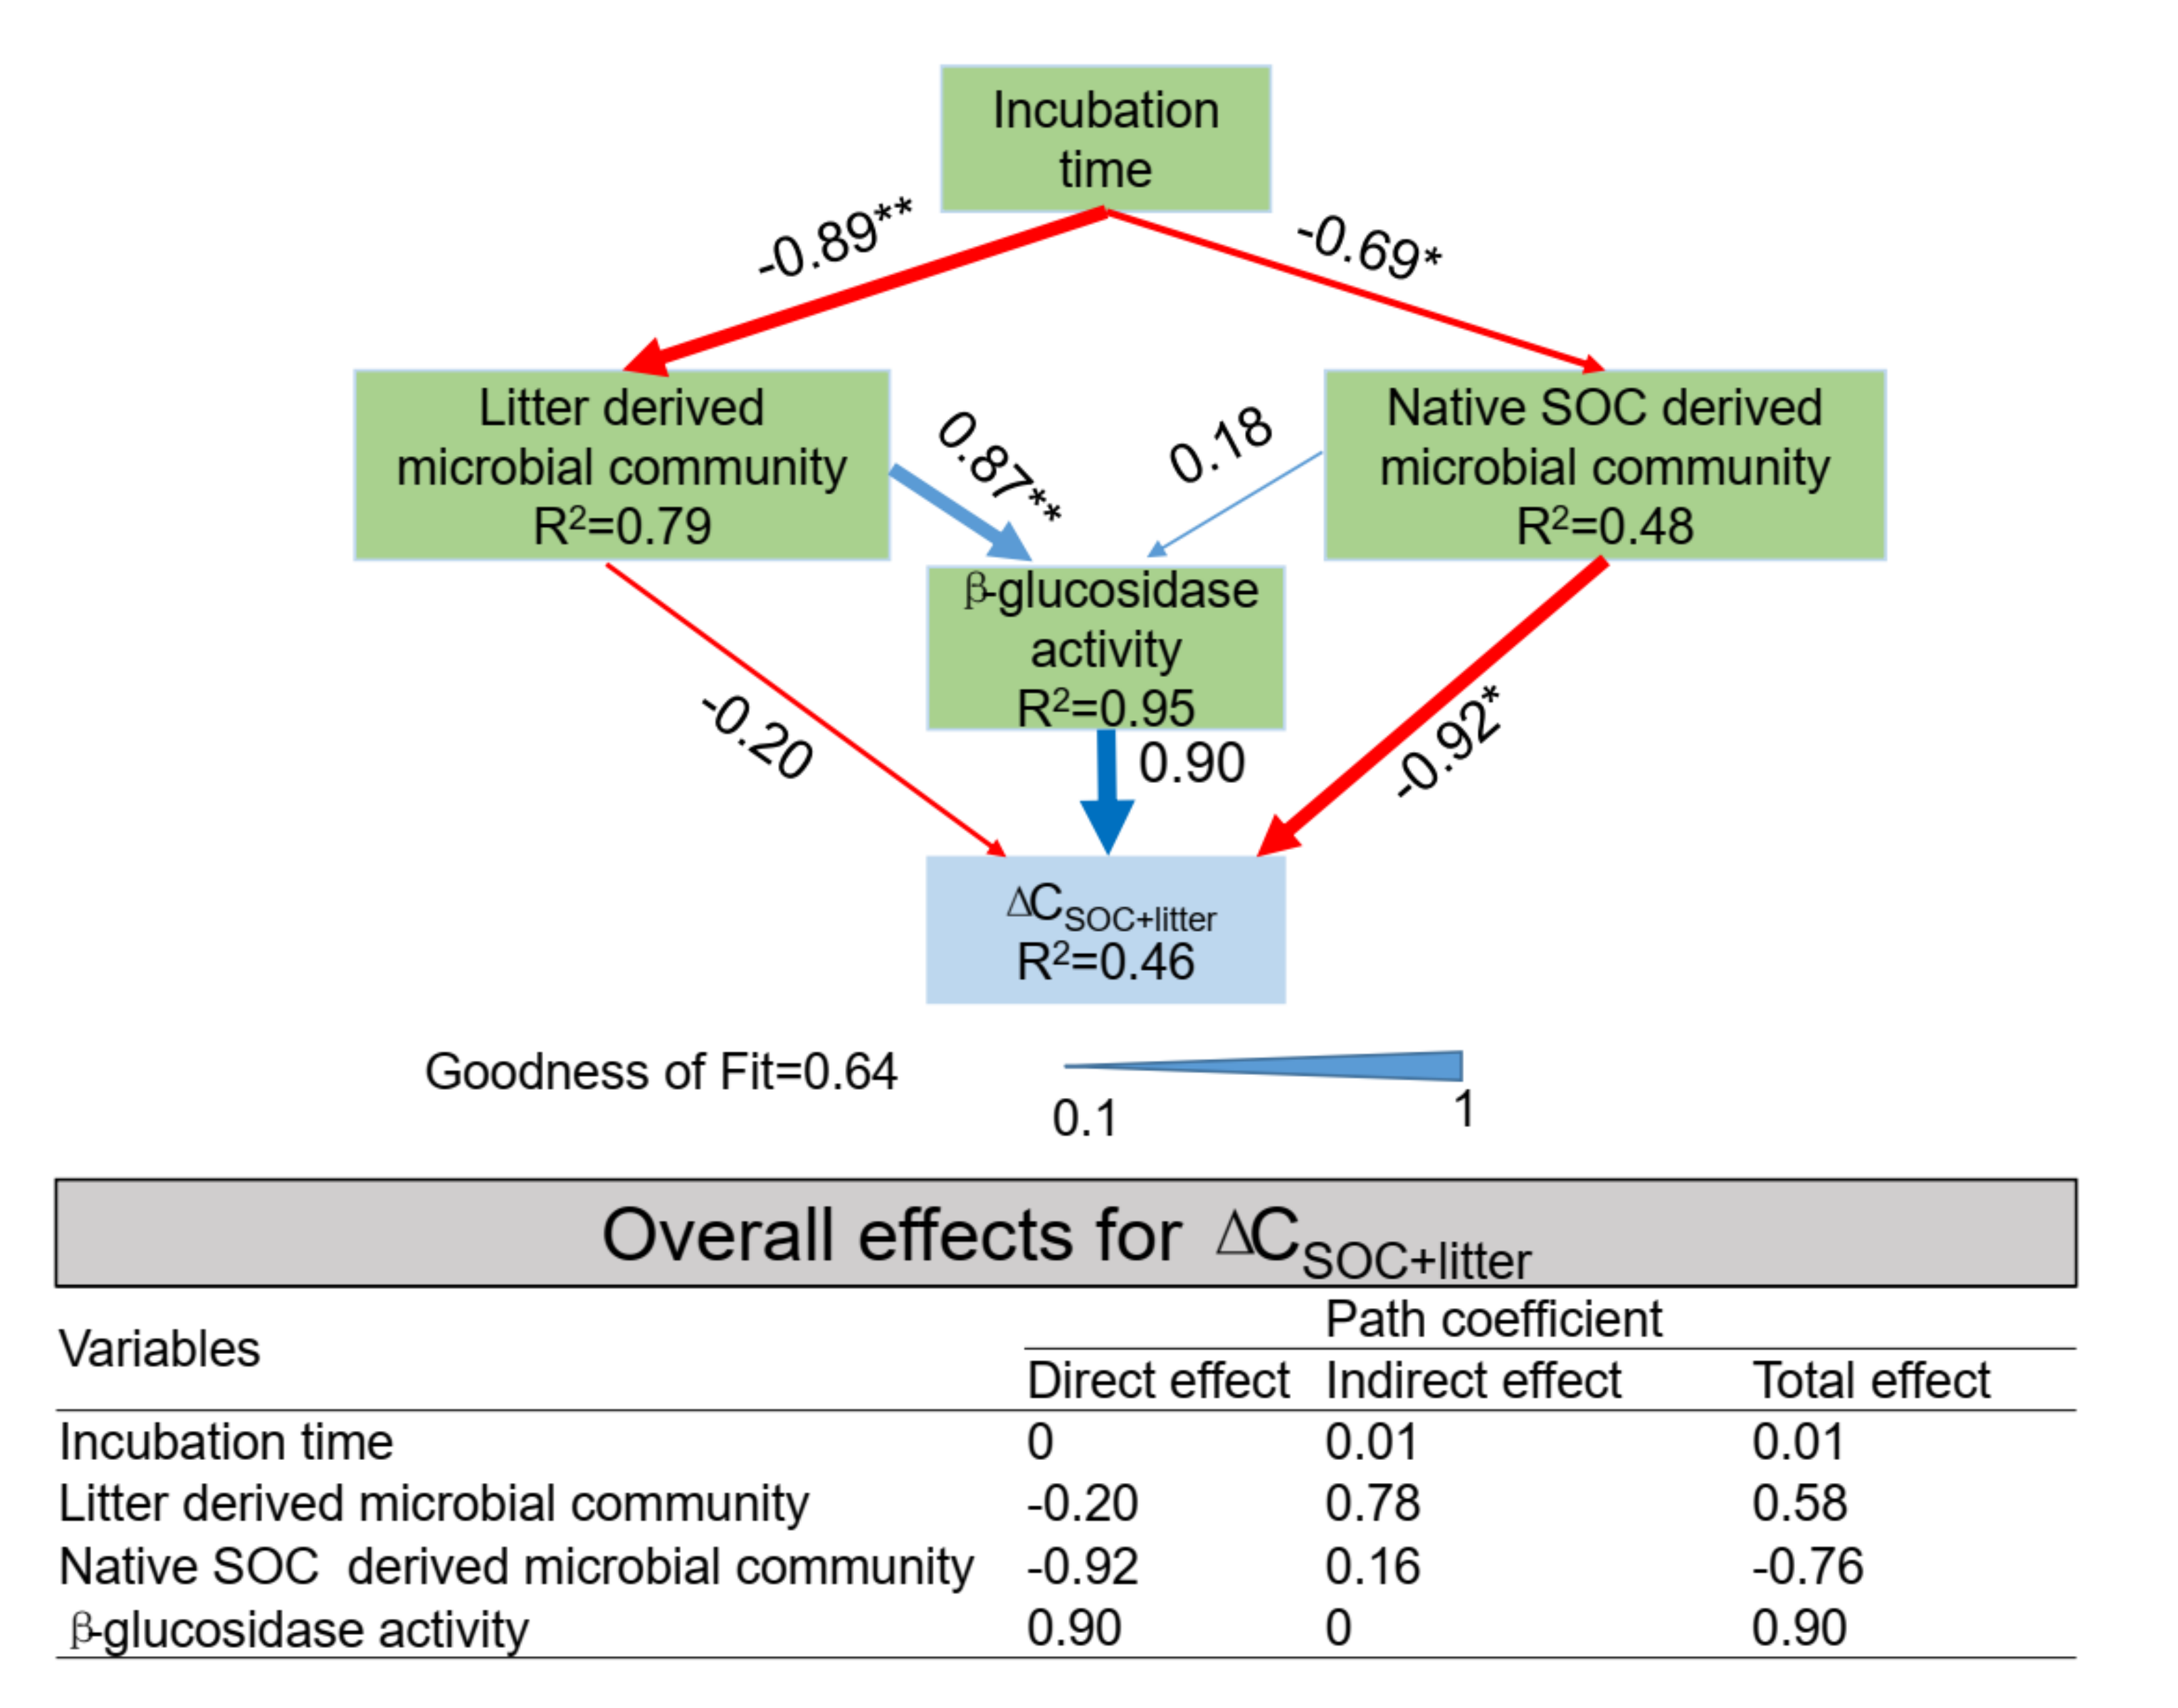
3.6. PLS-PM Analysis

We constructed a PLS-PM to assess how litter incorporation affected the changes in SOC (ΔCSOC+litter). For this model, five composites were included: incubation time; microbial communities associated with litter degradation; microbial communities associated with native SOC mineralization; β-glucosidase activity and changes in SOC under litter incorporation (ΔCSOC+litter) (Figure 8). The observed variables in the incubation time composite included three sampling points of 15, 45 and 90 days. The variables included in microbial communities associated with litter and native SOC degradation are shown in Figure 7, based on the 13C value of individual PLFAs.
Our model explained 79% of the variance in microbial communities associated with litter degradation, 48% in microbial communities associated with native SOC mineralization, 95% of the β-glucosidase activity and 46% of ΔCSOC+litter under litter incorporation, with a goodness-of-fit index of 0.64 (Figure 8). Incubation time had a direct and negative effect on microbial communities associated with litter and native SOC degradation (standardized path coefficient (pc) = −0.89 and −0.69). Microbial communities associated with litter degradation exhibited a significant positive effect on β-glucosidase activity (pc = 0.87), whereas microbial communities associated with native SOC mineralization had a weak positive effect on β-glucosidase activity (pc = 0.18). Additionally, incubation time had a weak indirect effect on ΔCSOC+litter (indirect pc = 0.01) (Figure 8). Microbial communities associated with native SOC mineralization exhibited a strong effect on ΔCSOC+litter, but microbial communities associated with litter degradation exhibited a weak effect on ΔCSOC+litter. Additionally, β-glucosidase activity contributed significantly to ΔCSOC+litter. Overall, microbial communities associated with native SOC mineralization directly affected SOC (ΔCSOC+litter), whereas microbial communities associated with litter degradation affected ΔCSOC+litter indirectly through changes in β-glucosidase activity under litter incorporation.

4. Discussion

4.1. Effect of Litter Incorporation on CO2 Emission

We found that litter-amended soil resulted in higher CO2 emission than the control soil, especially in the first 15 days (Figure 1a), which is consistent with previous field studies and meta-analyses that have reported increased soil respiration after plant litter incorporation [24,25,26]. This phenomenon likely arises because exogenous litter provides C and energy [24,26], which results in increased biomass and promotes metabolic activity of soil microbes. This effect can clearly be seen by the increased β-glucosidase activity and microbial biomass under litter incorporation (Figure 3 and Figure 4).
Under exogenous C input, the source of CO2 production could be clearly distinguished through the use of 13C isotopic monitoring (Figure 1b). In our study, all CO2 produced was categorized as having arisen from amended tea litter or native SOC. During the incubation period, a higher proportion of generated CO2 was derived from the mineralization of native SOC (92–98%) (Figure 1d), which increased significantly as a power function over the incubation period (R2 = 0.97, p < 0.001). This indicated that litter incorporation triggered a strong positive PE (Figure 1f), leading to a decrease in SOC (Table 1). Both positive and negative PEs of exogenous C supply have frequently been observed in previous studies [11,27,28,29,30]. For example, Bell et al. (2003) [31] reported that incorporation of plant straw increased the degradation of SOM by 3–5 fold. On the other hand, Lu et al. (2014) [32] found that the application of biochar alone or in combination with N inhibited SOC mineralization (a negative PE).
The observed positive or negative PEs can be mostly explained by the “co-metabolism” and “preferential substrate utilization” theories. A positive PE is expected if microorganisms prefer to utilize native soil C rather than supplemented exogenous C, which consequently leads to greater native soil C mineralization. In contrast, a negative PE occurs if microorganisms prefer to utilize exogenous C rather than native soil C, which leads to a decrease in native soil C mineralization [11,27]. In our study, native soil C was preferentially utilized by soil microorganisms, which promoted microbial growth and enhanced metabolism activity (Figure 3) and generated more CO2 (Figure 1). During the incubation period, the observed PE nonlinearly decreased as a power function, with a particularly high PE observed in the first five days of incubation (>200%) (Figure 1f). This result is in line with previous studies that have shown that positive PE is strongest immediately following exogenous C supply [33,34,35]. This pattern may be attributed to the release of labile C from plant litter at the early incubation stage, which strongly stimulates soil microbial activity [36,37]. Our experimental data demonstrated that the biomass and enzyme activity of each microbial group was linearly and negatively correlated with increasing incubation time (Figure 3 and Figure 4), indicating that strong microbial activity took place early in the incubation stage. CO2 that was generated from litter degradation was also at its highest level in the early stages (Figure 1), which provided sufficient energy for soil microbial growth. An increased level of soil microbes is thought to contribute to the mineralization of native SOC, according to co-metabolism theory [8].
Additionally, the magnitude and direction of PE have been shown to depend on the qualities and chemical structures of the added substrate [8]. It has also been established that labile C has a greater impact on the magnitude of the PE than recalcitrant C [38]. In the present study, although impact of chemical structure of litter on PE was not analyzed directly, previous results have indicated that pruned tea litter contains a large amount of labile C [17], which initiates a strong chemical reaction in soils at the early stages of incubation (Figure 1c and Figure 3). It is important to note that there is a small difference between experimentally labeled litter and normal pruned tea litter, with normal pruned litter containing more recalcitrant C in the twigs. Therefore, the effects of pruned litter on CO2 generation in tea plantation systems require further investigation.

4.2. Effect of Litter Incorporation on Soil Microbial Characteristics

In agreement with most previous experimental observations, litter incorporation enhanced soil microbial activities significantly [39,40], which was evidenced by high levels of β-glucosidase activity as well as increased biomass following litter incorporation (Figure 3 and Figure 4). This phenomenon largely depended on exogenous C input, since this promotes microbial increases by providing sufficient food and energy for soil microbes directly [41]. This effect can clearly be seen when comparing the significant differences between the microbial communities of control and litter-amended soils (Figure 3 and Figure S4; Table S2). After litter incorporation, the general bacterial group had the highest absolute amount of PLFAs among the five microbial groups (Figures S1 and S3), which may reflect the wide distribution of these microorganisms in the soil, especially those associated with the 16:0 FAME marker [42].
Increasing evidence has shown that microbial succession is affected by exogenous C input [43]. In our study, community succession was clearly observed under litter incorporation (R2 = 0.76, p < 0.001, Figure 2), which was confirmed by initial increases in biomass that gradually reduced over the course of the incubation (Figure 3). This finding indicates that microbes initially reproduced rapidly after litter addition but eventually the conditions changed to be less favorable for growth. In the control soil, on the other hand, microbial biomass generally increased over time (R2 = 0.14, p > 0.05), indicating that the microbial community was relatively stable without C input during the incubation time (Figure 3 and Figure 4). This finding is in line with previous reports indicating that soil respiration can be maintained for several years without any external C supply [44]. The long-term maintenance of soil C mineralization may also be explained by noncellular soil metabolism that slowly transforms organic C in CO2 via stable catalyzers [45,46].
There is a significant difference in the microbial community associated with litter degradation and native SOC mineralization (Figure 6), in which the majority of C in soil microbes is derived from native SOC rather than litter C, as reflected by the observed positive PE. It has been well-established that positive PE could be explained by a co-metabolism performed by a specific microbial group, termed K-strategists [8,9]. This group utilizes EOM as a primary food source to generate enzymes that degrade the energy-poor SOM compounds [9,15]. K-strategists are known to mine the nutrients they need from nutrient-rich SOM [9,15]. In addition to K-strategists, r-strategists also co-exist in the soil ecosystem and specialize in the degradation of EOM. Therefore, the competition between K- and r-strategists for EOM causes changes in the microbial communities associated with litter degradation and native SOC mineralization [9,15,16]. As a common strategy, microbial utilization of litter promotes native SOC mineralization until litter exhaustion (Figure 1). The rate of native SOC mineralization generally tapers to that in the control soils after litter exhaustion, which typically takes approximately 45 days. Native SOC mineralization largely depends on the availability of fresh C, since it is the primary driving force for soil microorganism growth.

4.3. The Relationship between Microbial Communities and SOC Accumulation

A structural equation model revealed that microbial communities associated with native SOC mineralization directly affected SOC (indicated as ΔCSOC+litter), whereas microbial communities associated with litter degradation indirectly affected ΔCSOC+litter by changing β-glucosidase activity under litter incorporation (Figure 8). A previous study found that the magnitude of the microbial community composition mirrored the magnitude of increases in CO2 derived from native SOC, indicating that a specific subset of microbes was likely responsible for the observed changes in native SOC mineralization [47].
It is generally recognized that soil C stocks are determined by the balance between C sources provided by exogenous C inputs and C losses mediated by microbial degradation [48]. In our study, CO2 emission increased after litter addition, and a higher proportion was derived from SOC mineralization (Figure 1). The increase of SOC mineralization in response to exogenous C input has been termed positive PE, and soil microbes play a significant role in this process [8]. This was confirmed by our experimental results in which multiple microbes participated in the degradation of native SOC (Figure 7and Figure S3), as evidenced by the larger portion of microbe biomass that was associated with SOC mineralization (Figure 7). Additionally, the abundance of these microbes was relatively stable during the three sampling points (R2 = 0.31, p > 0.05), with little correlation between specific microbe classes and incubation time (Figure 6).
Soil C loss has been shown to be associated with microbial respiration. A previous study showed that once exogenous C is supplemented as plant litter in the soil system, a large fraction of litter C is often used to maintain microbial metabolism, eventually resulting in a release of CO2 to the atmosphere through microbial respiration [49]. This was confirmed by our finding that a higher proportion of CO2 emission derived from litter degradation at the early incubation stages (Figure 1c), which indicated that litter incorporation provided enough C and energy for the growth of K-strategist soil microbes. According to “co-metabolism” theory, increased soil microbes preferentially utilize native SOC for maintaining normal metabolism during incubation stages [8], resulting in C loss through a positive PE (Figure 1f). In addition, microbial respiration or metabolism is affected by the composition of soil microbes, which influences the generation and maintenance of microbial biomass [50]. For example, Liu et al. (2018) [51] observed that fungal biomass and F/B ratio significantly influenced PE, promoting a higher CO2 production rate, which indicates that soil fungi play a more important role in PE than bacteria. This was also confirmed by our finding that fungal biomass (16:1 ω 5c) associated with native SOC was positively correlated with incubation time (R2 = 0.40, p < 0.05) (Figure 7).

5. Conclusions

Relative to the control soil, CO2 efflux significantly increased under litter incorporation and decreased as a power function with increasing incubation time. The majority of the CO2 was derived from native SOC mineralization rather than tea litter degradation, which indicated a strong positive PE. Litter incorporation initially greatly increased the activity of β-glucosidase, but this impact decreased over the course of incubation. The biomass of each microbial group significantly increased following litter incorporation, in which native SOC mineralization accounted for approximately 78% of the PLFA increase. Additionally, soil microbes associated with native SOC mineralization directly affected the changes in SOC (ΔCSOC+litter), whereas soil microbes associated with litter degradation exhibited an indirect effect on ΔCSOC+litter by affecting β-glucosidase activity under litter incorporation. Taken together, these findings indicate that pruned tea litter incorporation results in less SOC accumulation due to its high decomposition rate and positive priming effect in tea plantation system.

Supplementary Materials

The following are available online at https://0-www-mdpi-com.brum.beds.ac.uk/article/10.3390/agronomy12020293/s1, Figure S1: The relative abundance of each microbial group (general bacteria, G+, G-, fungi and actinomycetes) in soil amended with (+litter) and without (Control) litter, Figure S2: The relationship between individual PLFA and incubation time (15, 45, and 90 days) in in soil amended with (+litter) and without (Control) litter, Figure S3: The relative abundance of each microbial group (general bacteria, G+, G-, fungi and actinomycetes) associated with litter degradation at three sampling points (15, 45 and 90 days), Figure S4: The relationship between the activities of β-glucosidase and individual PLFA characteristics in the control soil (a) and litter-amended soil (b), Table S1: The t-test results (p values) of the significant differences (p < 0.05) in total CO2 efflux between control and litter-amended soils at specific sampling points, Table S2: The t-test results (p values) of the significant differences (p < 0.05) in soil microbial characteristics (total PLFA, general bacteria, G+, G-, fungi, actinomycetes, F/B, G+/G-and β-glucosidase) between control and litter-amended soils at specific sampling points, Table S3: The t-test results (p values) of the significant differences (p < 0.05) in individual PLFA characteristics between control and litter-amended soils at specific sampling points, Table S4: The t-test results (p values) of the significant differences (p < 0.05) in individual PLFA characteristics between litter-derived and native SOC-derived source under litter incorporation at specific sampling points.

Author Contributions

X.Y. (Xiangde Yang): experimental design, investigation, data curation, writing-original draft; J.R.: supervision, funding acquisition, writing-review & editing; X.Y. (Xiaoyun Yi): investigation, data curation; L.M.: discussion; K.N.: data analysis; L.J.: data analysis; Y.S.: discussion. All authors have read and agreed to the published version of the manuscript.

Funding

This research was supported by Yunnan provincial special fund for construction of science and technology innovation base (grant number 202102AE090038), the project of Agricultural Technology Experiment Demonstration and Service Support in 2019, China Agriculture Research System of MOF and MARA (grant number CARS-19), and the National Natural Science Foundation of China [grant numbers 32172634]. We would like to thank TopEdit (www.topeditsci.com, accessed on 19 August 2021) for its linguistic assistance during the preparation of this manuscript.

Institutional Review Board Statement

Not applicable.

Informed Consent Statement

Not applicable.

Data Availability Statement

Not applicable.

Conflicts of Interest

The authors declare no conflict of interest.

References

  1. Shehzadi, S.; Shah, Z.; Mohammad, W. Impact of organic amendments on soil carbon sequestration, water use efficiency and yield of irrigated wheat. Base 2017, 21, 36–49. [Google Scholar]
  2. Schlesinger, W.H.; Lichter, J. Limited carbon storage in soil and litter of experimental forest plots under increased atmospheric CO2. Nature 2001, 411, 466–469. [Google Scholar] [CrossRef] [PubMed]
  3. Yang, J.J.; Li, A.Y.; Yang, Y.F.; Li, G.H.; Zhang, F. Soil organic carbon stability under natural and anthropogenic-induced perturbations. Earth Sci. Rev. 2020, 205, 103199. [Google Scholar] [CrossRef]
  4. Liu, X.J.A.; Finley, B.K.; Mau, R.L.; Schwartz, E.; Dijkstra, P.; Bowker, M.A.; Hungate, B.A. The soil priming effect: Consistent across ecosystems, elusive mechanisms. Soil Biol. Biochem. 2020, 140, 107617. [Google Scholar] [CrossRef]
  5. Hollis, J.M.; Hannam, J.; Bellamy, P.H. Empirically-derived pedotransfer functions for predicting bulk density in European soils. Eur. J. Soil Sci. 2012, 63, 96–109. [Google Scholar] [CrossRef]
  6. Lehmann, J.; Kleber, M. The contentious nature of soil organic matter. Nature 2015, 528, 60–68. [Google Scholar] [CrossRef]
  7. Liu, E.K.; Yan, C.R.; Mei, X.R.; He, W.Q.; Bing, S.H.; Ding, L.P.; Liu, Q.; Liu, S.; Fan, T.L. Long-term effect of chemical fertilizer, straw, and manure on soil chemical and biological properties in northwest China. Geoderma 2010, 158, 173–180. [Google Scholar] [CrossRef]
  8. Kuzyakov, Y.; Friedel, J.K.; Stahr, K. Review of mechanisms and quantification of priming effects. Soil Biol. Biochem. 2000, 32, 1485–1498. [Google Scholar] [CrossRef]
  9. Fontaine, S.; Mariotti, A.; Abbadie, L. The priming effect of organic matter: A question of microbial competition? Soil Biol. Biochem. 2003, 35, 837–843. [Google Scholar] [CrossRef]
  10. Troy, S.M.; Lawlor, P.G.; O’Flynn, C.J.; Healy, M.G. Impact of biochar addition to soil on greenhouse gas emissions following pig manure application. Soil Biol. Biochem. 2013, 60, 173–181. [Google Scholar] [CrossRef] [Green Version]
  11. Kuzyakov, Y. Priming effects: Interactions between living and dead organic matter. Soil Biol. Biochem. 2010, 42, 1363–1371. [Google Scholar] [CrossRef]
  12. Nottingham, A.T.; Griffiths, H.; Chamberlain, P.M.; Stott, A.W.; Tanner, E.V.J. Soil priming by sugar and leaf-litter substrates: A link to microbial groups. Appl. Soil Ecol. 2009, 42, 183–190. [Google Scholar] [CrossRef]
  13. Yan, J.F.; Wang, L.; Hu, Y.; Tsang, Y.F.; Zhang, Y.N.; Wu, J.H.; Fu, X.H.; Sun, Y. Plant litter composition selects different soil microbial structures and in turn drives different litter decomposition pattern and soil carbon sequestration capability. Geoderma 2018, 319, 194–203. [Google Scholar] [CrossRef]
  14. Malik, A.A.; Chowdhury, S.; Schlager, V.; Oliver, A.; Puissant, J.; Vazquez, P.G.M.; Jehmlich, N.; Bergen, M.V.; Griffiths, R.I.; Gleixner, G. Soil fungal: Bacterial ratios are linked to altered carbon cycling. Front. Microbiol. 2016, 7, 1247. [Google Scholar] [CrossRef] [Green Version]
  15. Chen, R.; Senbayram, M.; Blagodatsky, S.; Myachina, O.; Ditter, T.K.; Lin, X.; Blagodatskaya, E.; Kuzyakov, Y. Soil C and N availability determine the priming effect: Microbial N mining and stoichiometric decomposition theories. Global Change Biol. 2014, 20, 2356–2367. [Google Scholar] [CrossRef]
  16. Pascault, N.; Ranjard, L.; Kaisermann, A.; Bachar, D.; Christen Richard Terrat, S.; Mathieu, O.; Lévêque, J.; Mougel, C.; Henault, C.; Lemanceau, P.; et al. Stimulation of different functional groups of bacteria by various plant residues as a driver of soil priming effect. Ecosystems 2013, 5, 810–822. [Google Scholar] [CrossRef]
  17. Yang, X.D.; Ma, L.F.; Ji, L.F.; Shi, Y.Z.; Yi, X.Y.; Yang, Q.L.; Ni, K.; Ruan, J.Y. Long-term nitrogen fertilization indirectly affects soil fungi community structure by changing soil and pruned litter in a subtropical tea (Camellia sinensis L.) plantation in China. Plant Soil 2019, 444, 409–426. [Google Scholar] [CrossRef]
  18. Li, L.J.; Zhu-Barker, X.; Ye, R.; Doane, T.A.; Horwath, W.R. Soil microbial biomass size and soil carbon influence the priming effect from carbon inputs depending on nitrogen availability. Soil Biol. Biochem. 2018, 119, 41–49. [Google Scholar] [CrossRef]
  19. Saiya-Cork, K.R.; Sinsabaugh, R.L.; Zak, D.R. The effects of long term nitrogen deposition on extracellular enzyme activity in an Acer saccharum forest soil. Soil Biol. Biochem. 2002, 34, 1309–1315. [Google Scholar] [CrossRef]
  20. DeForest, J.L. The influence of time, storage temperature, and substrate age on potential soil enzyme activity in acidic forest soils using MUB-linked substrates and L-DOPA. Soil Biol. Biochem. 2009, 41, 1180–1186. [Google Scholar] [CrossRef]
  21. Ge, G.F.; Li, Z.J.; Fan, F.L.; Chu, G.X.; Hou, Z.N.; Liang, Y.C. Soil biological activity and their seasonal variations in response to long-term application of organic and inorganic fertilizers. Plant Soil 2010, 326, 31–44. [Google Scholar] [CrossRef]
  22. Thornton, B.; Zhang, Z.L.; Mayes, R.W.; Högberg, M.N.; Midwood, A.J. Can gas chromatography combustion isotope ratio mass spectrometry be used to quantify organic compound abundance? Rapid Commun. Mass Spectrom. 2011, 25, 2433–2438. [Google Scholar] [CrossRef] [PubMed]
  23. Sanchez, G. PLS Path Modeling with R; Trowchez Editions: Berkeley, CA, USA, 2013. [Google Scholar]
  24. Fang, X.; Zhao, L.; Zhou, G.Y.; Huang, W.J.; Liu, J.X. Increased litter input increases litter decomposition and soil respiration but has minor effects on soil organic carbon in subtropical forests. Plant Soil 2015, 392, 139–153. [Google Scholar] [CrossRef]
  25. Prévost-Bouré, N.C.; Soudani, K.; Damesin, C.; Berveiller, D.; Lata, J.C.; Dufrêne, E. Increase in aboveground fresh litter quantity over-stimulates soil respiration in a temperate deciduous forest. Appl. Soil Ecol. 2010, 46, 26–34. [Google Scholar] [CrossRef]
  26. Xu, S.; Liu, L.L.; Sayer, E. Variability of above-ground litter inputs alters soil physicochemical and biological processes: A meta-analysis of litterfall-manipulation experiments. Biogeosciences 2013, 10, 7423–7433. [Google Scholar] [CrossRef] [Green Version]
  27. Blagodatskaya, E.; Khomyakov, N.; Myachina, O.; Bogomolova, I.; Blagodatsky, S.; Kuzyakov, Y. Microbial interactions affect sources of priming induced by cellulose. Soil Biol. Biochem. 2014, 74, 39–49. [Google Scholar] [CrossRef]
  28. Fontaine, S.; Bardoux, G.; Abbadie, L.; Mariotti, A. Carbon input to soil may decrease soil carbon content. Ecol. Lett. 2004, 7, 314–320. [Google Scholar] [CrossRef]
  29. Shahzad, T.; Chenu, C.; Repinçay, C.; Mougin, C.; Ollier, J.L.; Fontaine, S. Plant clipping decelerates the mineralization of recalcitrant soil organic matter under multiple grassland species. Soil Biol. Biochem. 2012, 51, 73–80. [Google Scholar] [CrossRef]
  30. Tian, J.; Pausch, J.; Yu, G.R.; Blagodatskaya, E.; Kuzyakov, Y. Aggregate size and glucose level affect priming sources: A three source-partitioning study. Soil Biol. Biochem. 2016, 97, 199–210. [Google Scholar] [CrossRef]
  31. Bell, J.M.; Smith, J.L.; Bailey, V.L.; Bolton, H. Priming effect and C storage in semi-arid no-till spring crop rotations. Biol. Fertil. Soils 2003, 37, 237–244. [Google Scholar] [CrossRef]
  32. Lu, W.W.; Ding, W.X.; Zhang, J.H.; Li, Y.; Luo, J.F.; Bolan, N.; Xie, Z.B. Biochar suppressed the decomposition of organic carbon in a cultivated sandy loam soil: A negative priming effect. Soil Biol. Biochem. 2014, 76, 12–21. [Google Scholar] [CrossRef]
  33. Maestrini, B.; Herrmann, A.M.; Nannipieri, P.; Schmidt, M.W.; Abiven, S. Ryegrass-derived pyrogenic organic matter changes organic carbon and nitrogen mineralization in a temperate forest soil. Soil Biol. Biochem. 2014, 69, 291–301. [Google Scholar] [CrossRef]
  34. Luo, Z.K.; Wang, E.L.; Sun, O.J. A meta-analysis of the temporal dynamics of priming soil carbon decomposition by fresh carbon inputs across ecosystems. Soil Biol. Biochem. 2016, 101, 96–103. [Google Scholar] [CrossRef]
  35. Zimmerman, A.R.; Gao, B.; Ahn, M.Y. Positive and negative carbon mineralization priming effects among a variety of biochar-amended soils. Soil Biol. Biochem. 2011, 43, 1169–1179. [Google Scholar] [CrossRef]
  36. Maestrini, B.; Nannipieri, P.; Abiven, S. A meta-analysis on pyrogenic organic matter induced priming effect. GCB Bioenergy 2015, 7, 577–590. [Google Scholar] [CrossRef]
  37. Smith, J.L.; Collins, H.P.; Bailey, V.L. The effect of young biochar on soil respiration. Soil Biol. Biochem. 2010, 42, 2345–2347. [Google Scholar] [CrossRef]
  38. Hamer, U.; Marschner, B. Priming effects in soils after combined and repeated substrate additions. Geoderma 2005, 128, 38–51. [Google Scholar] [CrossRef]
  39. Adamczyk, M.; Perez-Mon, C.; Gunz, S.; Frey, B. Strong shifts in microbial community structure are associated with increased litter input rather than temperature in high Arctic soils. Soil Biol. Biochem. 2020, 151, 108054. [Google Scholar] [CrossRef]
  40. Che, R.; Liu, D.; Qin, J.; Wang, F.; Wang, W.; Xu, Z.; Cui, X. Increased litter input significantly changed the total and active microbial communities in degraded grassland soils. J. Soils Sediments 2020, 20, 2804–2816. [Google Scholar] [CrossRef]
  41. Bradford, M.A.; Keiser, A.D.; Davies, C.A.; Mersmann, C.A.; Strickland, M.S. Empirical evidence that soil carbon formation from plant inputs is positively related to microbial growth. Biogeochemistry 2013, 113, 271–281. [Google Scholar] [CrossRef]
  42. Wang, J.; Chapman, S.J.; Yao, H.Y. Incorporation of 13C-labelled rice rhizodeposition into soil microbial communities under different fertilizer applications. Appl. Soil Ecol. 2016, 101, 11–19. [Google Scholar] [CrossRef]
  43. Colin, Y.; Goberna, M.; Verdú, M.; Navarro-Cano, J.A. Successional trajectories of soil bacterial communities in mine tailings: The role of plant functional traits. J. Environ. Manage. 2019, 241, 284–292. [Google Scholar] [CrossRef] [PubMed]
  44. Wadman, W.P.; De Haan, S. Decomposition of organic matter from 36 soils in a long-term pot experiment. Plant Soil 1997, 189, 289–301. [Google Scholar] [CrossRef]
  45. Kéraval, B.; Lehours, A.C.; Colombet, J.; Amblard, C.; Alvarez, G.; Fontaine, S. Soil carbon dioxide emissions controlled by an extracellular oxidative metabolism identifiable by its isotope signature. Biogeosciences 2016, 13, 6353–6362. [Google Scholar] [CrossRef] [Green Version]
  46. Maire, V.; Alvarez, G.; Colombet, J.; Comby, A.; Despinasse, R.; Dubreucq, E.; Fontaine, S. An unknown oxidative metabolism substantially contributes to soil CO2 emissions. Biogeosciences 2013, 10, 1155–1167. [Google Scholar] [CrossRef] [Green Version]
  47. Whitman, T.; DeCiucies, S.; Hanley, K.; Enders, A.; Woolet, J.; Lehmann, J. Microbial community shifts reflect losses of native soil carbon with pyrogenic and fresh organic matter additions and are greatest in low-carbon soils. Appl. Environ. Microbiol. 2021, 87, e02555-20. [Google Scholar] [CrossRef]
  48. Riggs, C.E.; Hobbie, S.E.; Bach, E.M.; Hofmockel, K.S.; Kazanski, C.E. Nitrogen addition changes grassland soil organic matter decomposition. Biogeochemistry 2015, 125, 203–219. [Google Scholar] [CrossRef]
  49. Cotrufo, M.F.; Wallenstein, M.D.; Boot, C.M.; Denef, K.; Paul, E. The Microbial Efficiency-Matrix Stabilization (MEMS) framework integrates plant litter decomposition with soil organic matter stabilization: Do labile plant inputs form stable soil organic matter? Global Change Biol. 2013, 19, 988–995. [Google Scholar] [CrossRef] [Green Version]
  50. Schimel, J.P.; Weintraub, M.N. The implications of exoenzyme activity on microbial carbon and nitrogen limitation in soil: A theoretical model. Soil Biol. Biochem. 2003, 35, 549–563. [Google Scholar] [CrossRef]
  51. Liu, W.X.; Qiao, C.L.; Yang, S.; Bai, W.M.; Liu, L.L. Microbial carbon use efficiency and priming effect regulate soil carbon storage under nitrogen deposition by slowing soil organic matter decomposition. Geoderma 2018, 332, 37–44. [Google Scholar] [CrossRef]
Figure 1. (a) Total CO2 efflux in soil amended with (+litter) and without (Control) litter. (b) The change in 13C value (atom, %) in the litter-amended soil. (c) The proportion of CO2 generated from litter. (d) The proportion of CO2 generated from native SOC. (e) Primed CO2 efflux under litter incorporation. (f) The priming effect throughout 90 days of incubation.
Agronomy 12 00293 g001
Figure 2. Principal component analysis (PCA) based on Bray–Curtis distances reveals differences in microbial composition between control soil and litter-amended soil. The significance of the effects of treatment and incubation time on microbial community structure was tested by PERMANOVA.
Agronomy 12 00293 g002
Figure 3. The relationship between total phospholipid fatty acid (PLFA) (a), general bacteria (b), gram positive bacteria (G+) (c), gram negative bacteria (G) (d), fungi (e), actinomycetes (f), their ratios of F/B (g), G+/G) (h) and incubation time (15, 45 and 90 days) in soil amended with (+litter) and without (Control) litter.
Agronomy 12 00293 g003
Figure 4. The relationship between the activities of β-glucosidase and incubation time (15, 45 and 90 days) in the control soil (a) and litter-amended soil (b).
Agronomy 12 00293 g004
Figure 5. The relationship between the activities of β-glucosidase and microbial characteristics, including total PLFA, general bacteria, G+, G, fungi, actinomycetes, F/B and G+/G, in the control soil (a) and litter-amended soil (b).
Agronomy 12 00293 g005
Figure 6. Principal component analysis (PCA) based on Bray–Curtis distances reveals differences in microbial communities associated with litter degradation and native SOC mineralization. The significance of the effect of treatment and incubation time on microbial community structure was tested by PERMANOVA.
Agronomy 12 00293 g006
Figure 7. The relationship between specific PLFAs associated with litter degradation (a), native SOC mineralization (b) and incubation time.
Agronomy 12 00293 g007
Figure 8. The relationships between incubation time, litter-derived microbial communities, native SOC derived microbial communities, β-glucosidase activity and changes in SOC (ΔCSOC+litter). The numbers on the arrows are standardized path coefficients, and the value of the path coefficients is indicated by the width of the arrows; blue arrows indicate a positive effect, and red arrows indicate a negative effect. Path coefficients and coefficients of determination (R2) were calculated after 999 bootstraps and significance levels are indicated by * (p < 0.05) and ** (p < 0.01). The R2 value indicates the variance explained by the model. The model was evaluated using goodness-of-fit tests, which measure the overall prediction performance.
Agronomy 12 00293 g008
Table 1. Soil organic carbon (SOC), total N (TN) and the ratio of SOC/TN in soils amended with (+litter) and without (Control) litter on different days of incubation. Standard errors of four replications are presented in parentheses. Different lowercase letters or ‘ns’ following data in the same row indicate significant (p < 0.05) or nonsignificant differences among different incubation times.
ParametersTreatmentDay 0Day 15Day 45Day 90
SOC (mg g−1)Control43.85 (0.38) a36.57 (0.62) b32.19 (1.29) c34.19 (0.80) bc
+litter44.97 (0.13) a36.48 (2.89) b37.06 (2.23) b37.57 (2.03) b
TN (mg g−1)Control4.30 (0.04) a3.54 (0.06) b3.16 (0.10) b3.33 (0.09) bc
+litter4.05 (0.03) a3.53 (0.23) ab3.48 (0.17) ab3.44 (0.16) b
SOC/TNControl10.21 (0.05) ns10.32 (0.01)10.19 (0.09)10.27 (0.05)
+litter11.11 (0.07) a10.31 (0.18) c10.65 (0.12) bc10.90 (0.13) ab
Publisher’s Note: MDPI stays neutral with regard to jurisdictional claims in published maps and institutional affiliations.

