
The Effects of Leguminous Living Mulch Intercropping and Its Growth Management on Organic Cabbage Yield and Biological Nitrogen Fixation


Abstract
:1. Introduction
2. Materials and Methods
3. Results
3.1. Soil Mineral Nitrogen (Nmin)

| Source of Variation | p Values * | |||||||||||||
|---|---|---|---|---|---|---|---|---|---|---|---|---|---|---|
| Soil Nmin content (Table 4) | ||||||||||||||
| Date | D1 | D2 | D3 | D4 | D5 | D6 | ||||||||
| Depth (cm) | 0–90 | 0–30 | 30–60 | 60–90 | 0–30 | 30–60 | 60–90 | 0–30 | 30–60 | 0–30 | 30–60 | 0–30 | 30–60 | 60–90 |
| Living mulches (LM) | - | 0.3055 | 0.0790 | 0.0735 | <0.0001 | <0.0001 | 0.6648 | 0.0724 | <0.0001 | 0.3102 | 0.8323 | 0.8134 | 0.5367 | 0.2007 |
| Growth management (GM) | - | - | - | - | - | - | - | 0.556 | 0.0017 | 0.8508 | 0.5622 | 0.2087 | 0.4097 | 0.6474 |
| Location | <0.0001 | 0.0105 | 0.7903 | 0.2246 | 0.5576 | 0.0075 | 0.1478 | 0.9864 | <0.0001 | 0.0165 | 0.0619 | 0.9796 | 0.6647 | <0.0001 |
| GM × LM | - | - | - | - | - | - | - | 0.7037 | 0.2181 | 0.6654 | 0.8425 | 0.9809 | 0.0683 | 0.1239 |
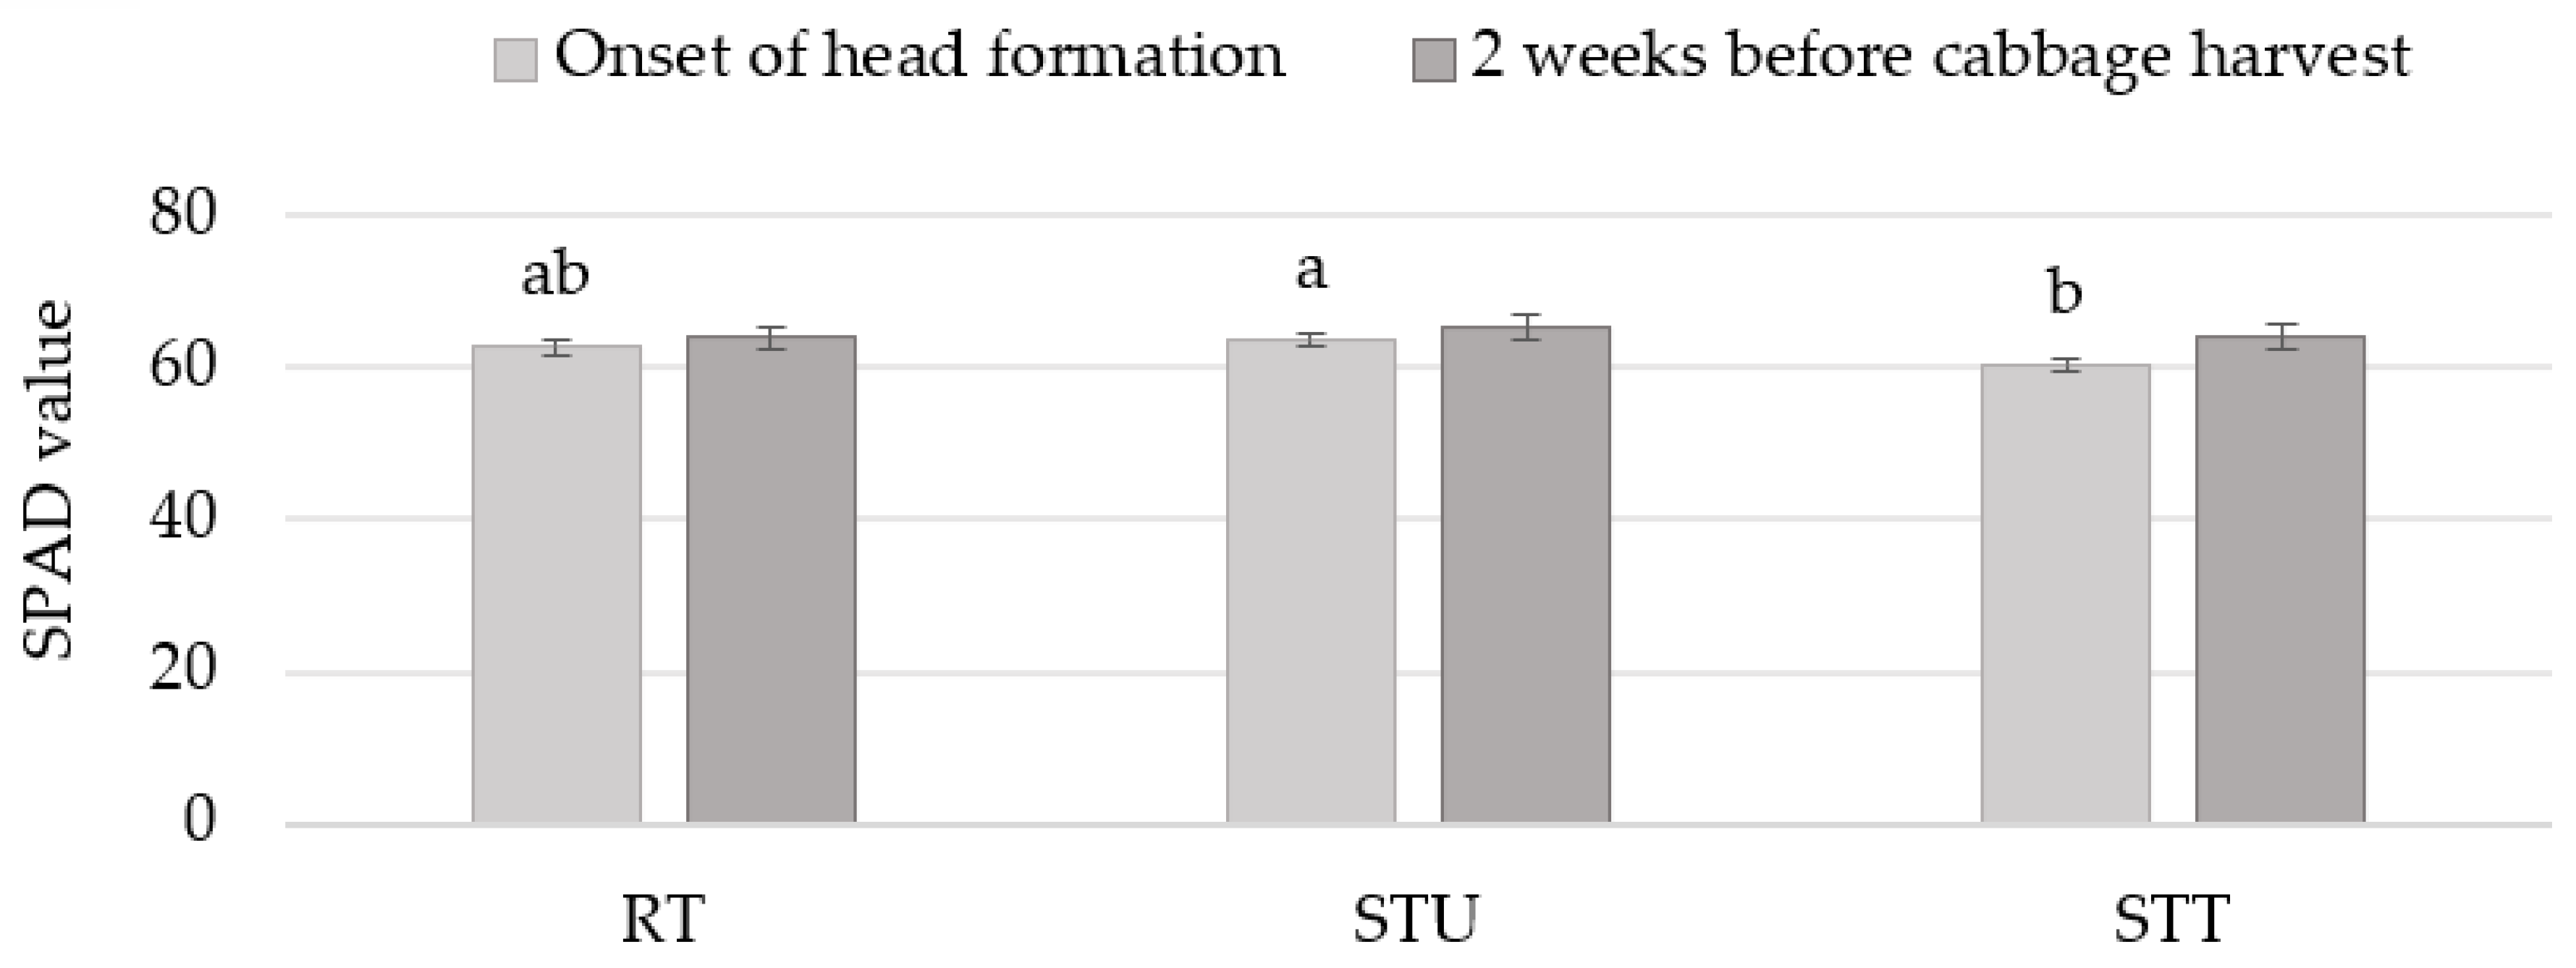
| LM biomass | Biological N2 fixation (Table 5) | SPAD measurements (Figure 3) | ||||||||||||
| Before cabbage planting (Table 6) | Before cabbage harvest (Table 7) | Before cabbage planting | Before cabbage harvest | Head formation onset | Before cabbage harvest | |||||||||
| Dry mass | N concen-tration | C/N ratio | N content | Dry mass | N concen-tration | C/N ratio | ||||||||
| Living mulches (LM) | 0.2385 | 0.0068 | <0.0001 | 0.1381 | 0.004 | <0.0001 | <0.0001 | 0.1123 | 0.5782 | 0.2158 | 0.3916 | |||
| Growth management (GM) | - | - | - | - | 0.036 | 0.097 | 0.032 | - | 0.039 | 0.0436 | 0.4747 | |||
| Location | 0.6823 | 0.9997 | 0.5249 | 0.9246 | - | - | - | - | - | 0.0001 | 0.2793 | |||
| GM × LM | - | - | - | - | 0.459 | 0.013 | 0.008 | - | 0.6246 | 0.4252 | 0.555 | |||
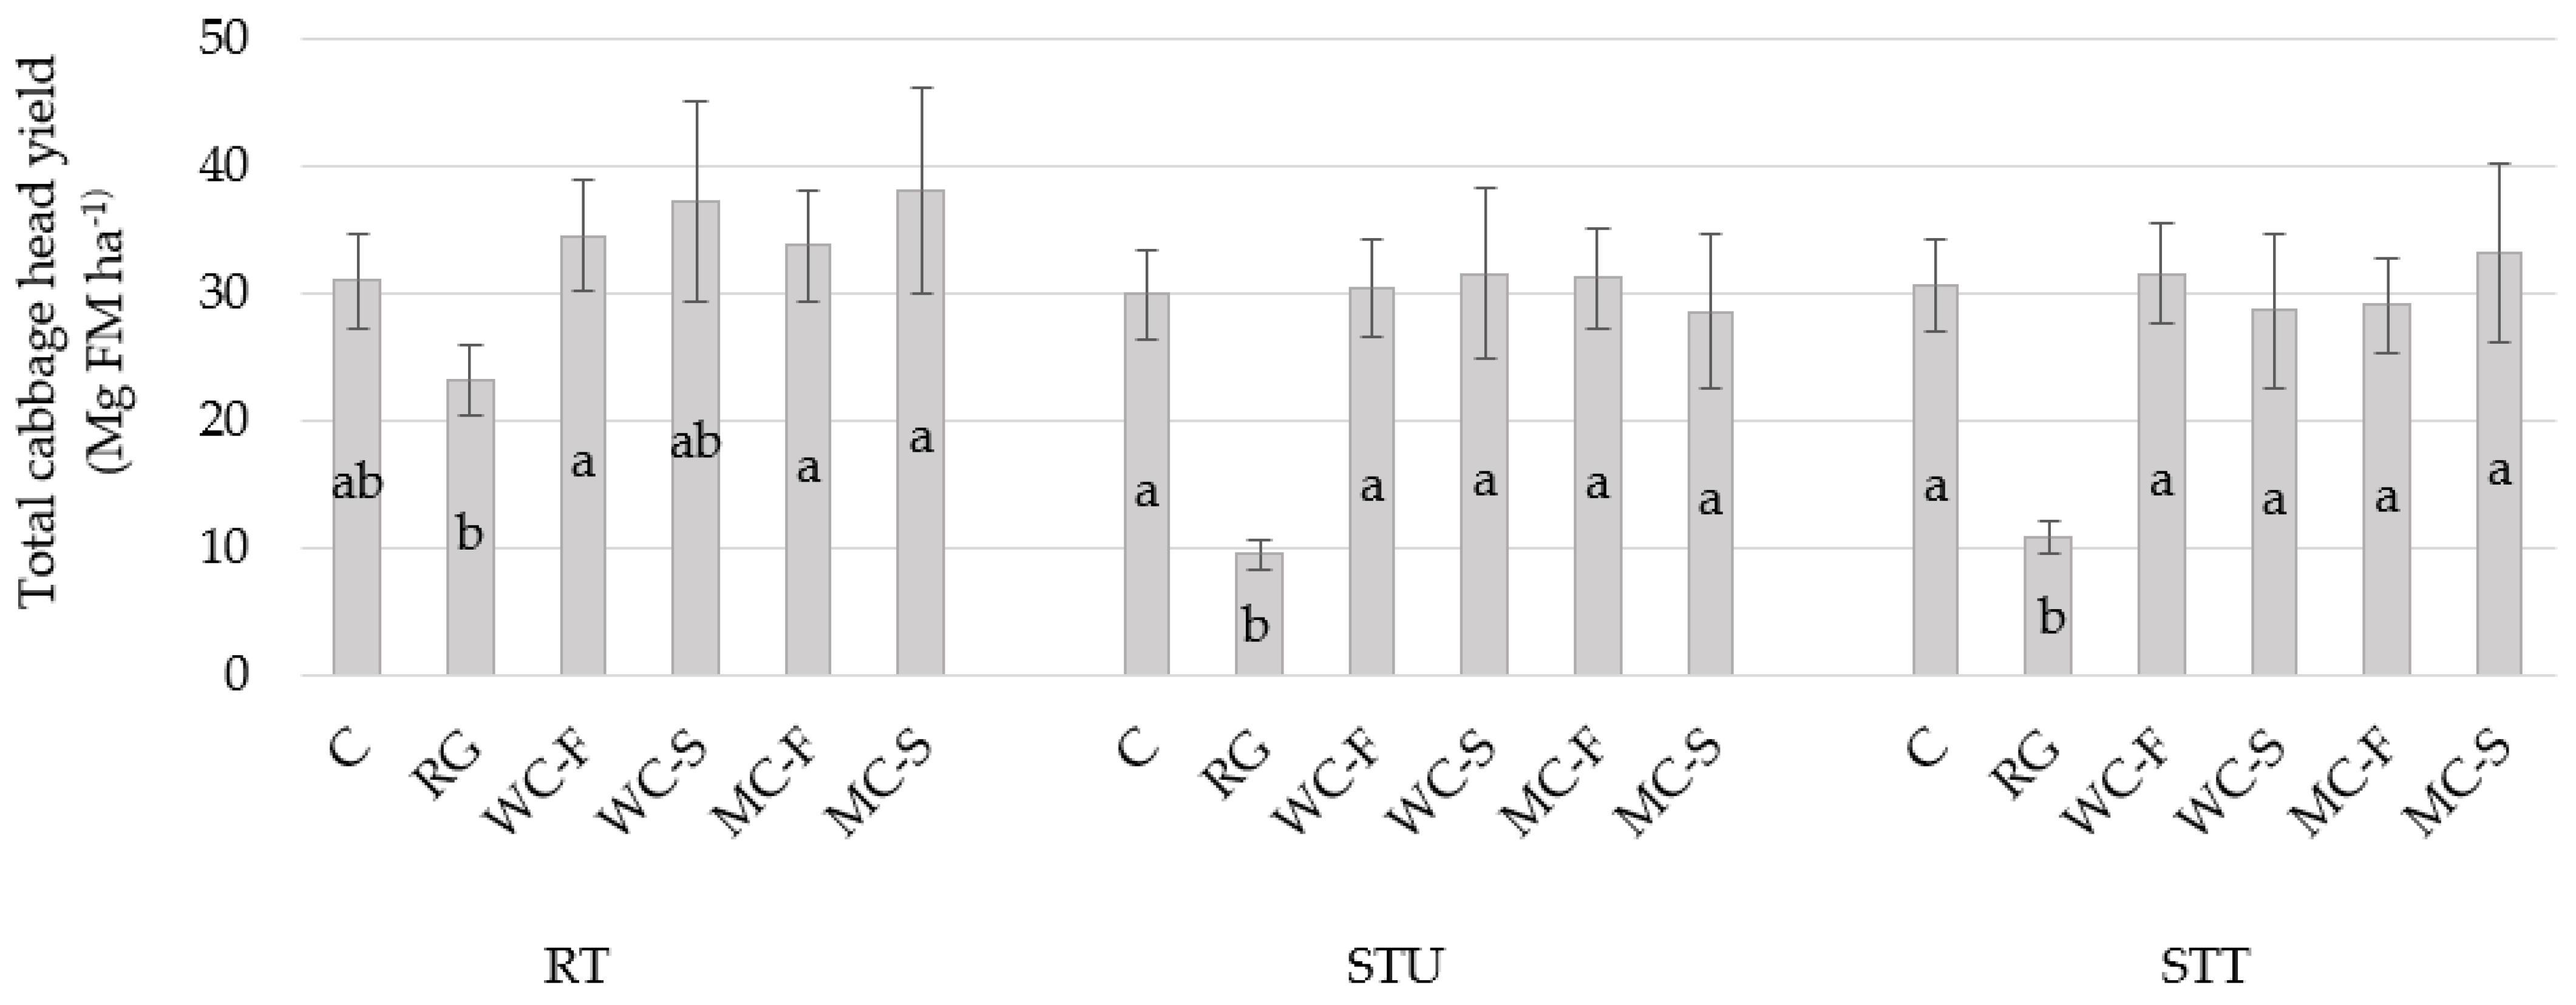
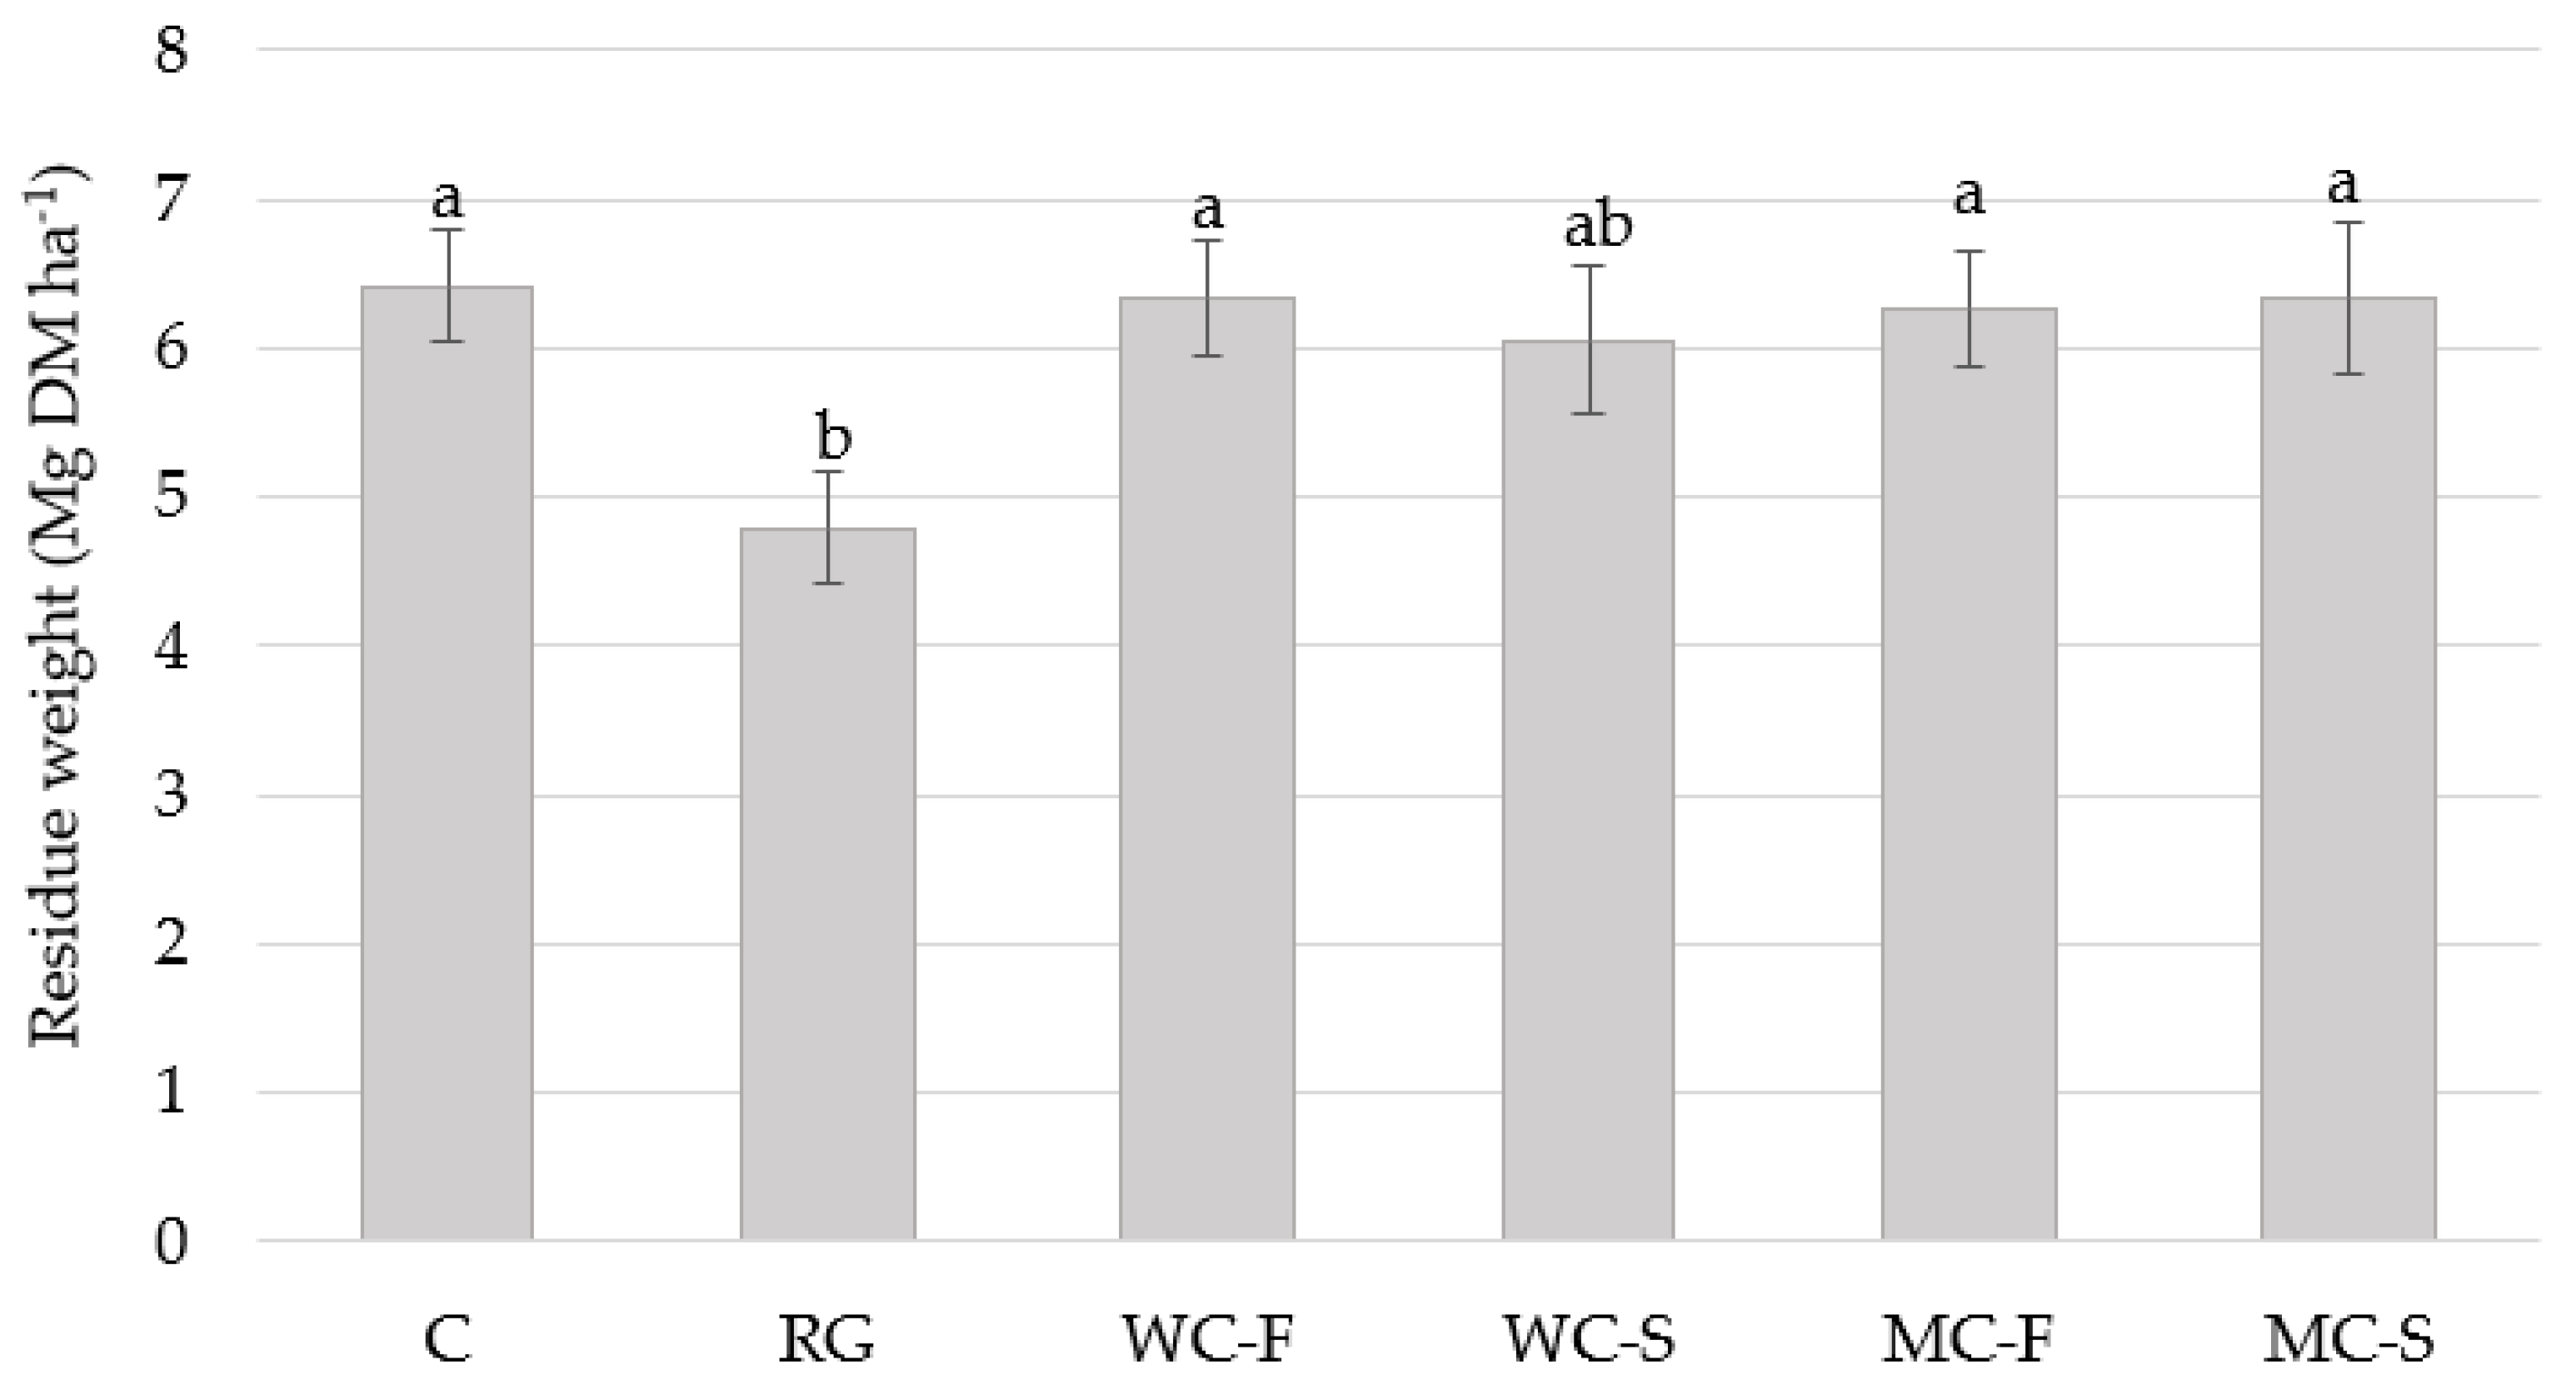
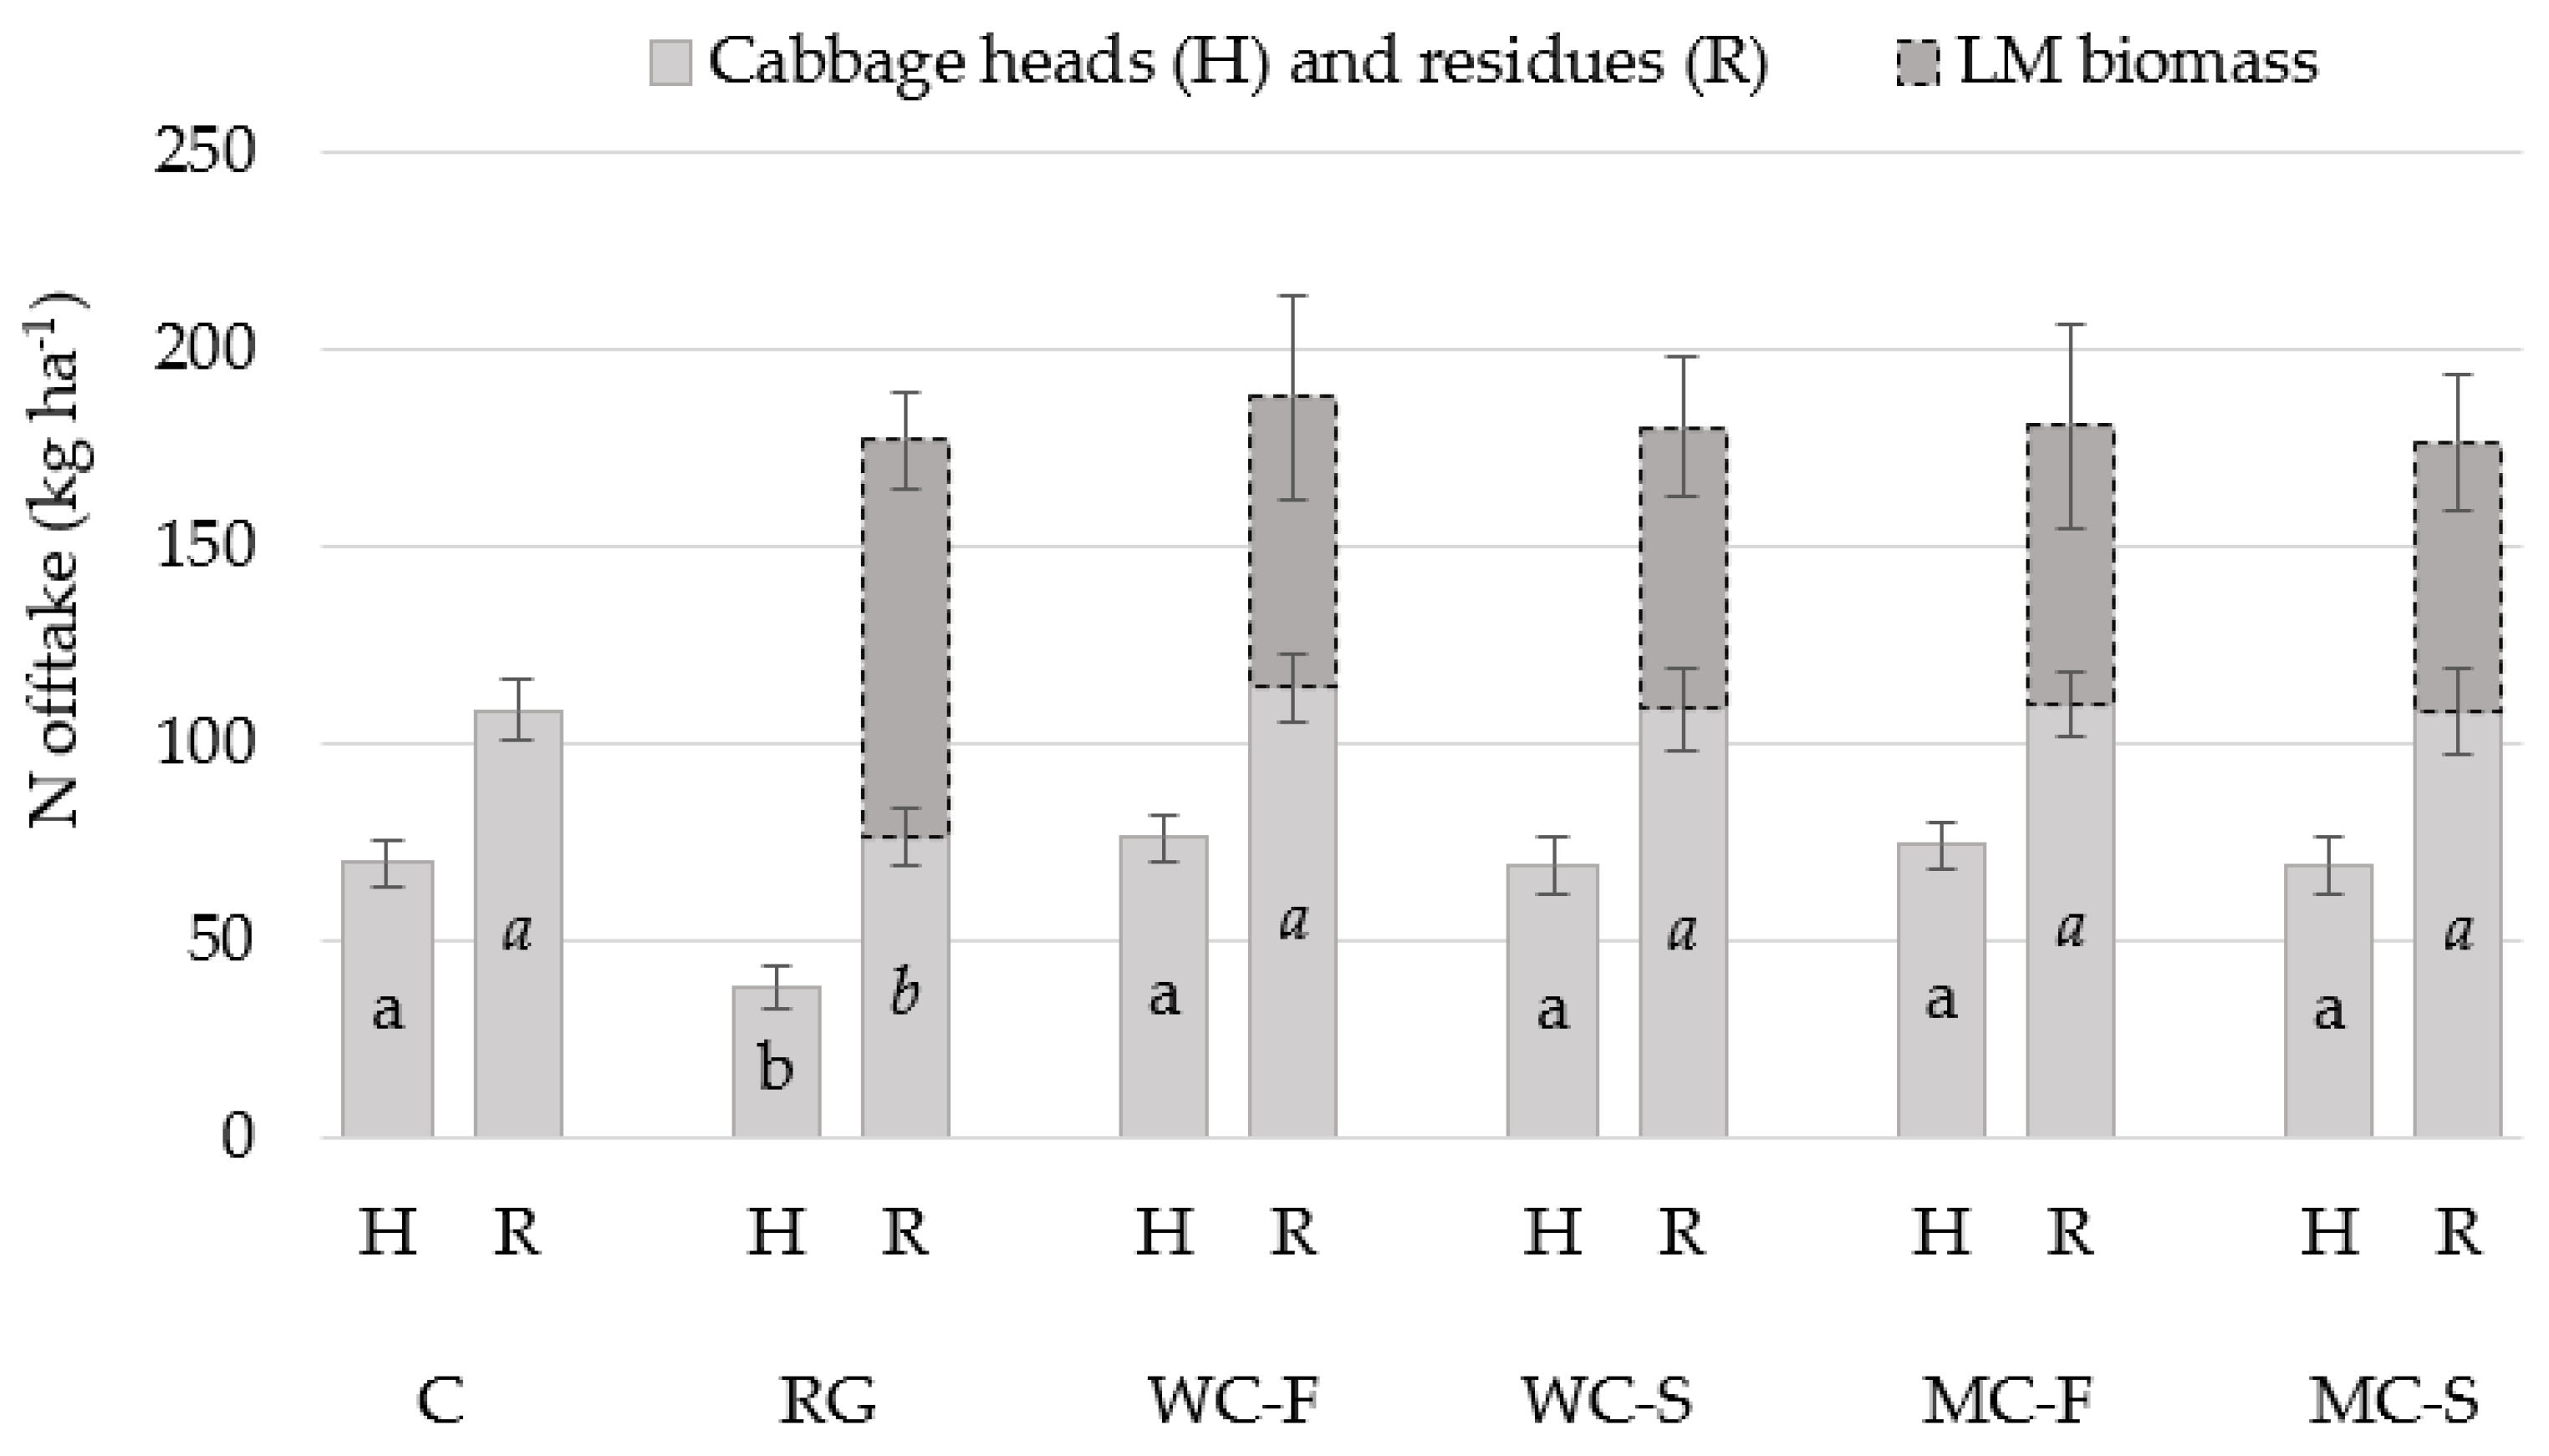
| Cabbage yield (Figure 4 and Figure 5) | N offtake (Figure 6) | |||||||||||||
| Head yield | Residues (DM) | Cabbage heads | Cabbage residues | LM biomass (before cabbage harvest) | ||||||||||
| Living mulches (LM) | 0.0003 | 0.0467 | 0.0012 | 0.0402 | 0.565 | |||||||||
| Growth management (GM) | 0.0800 | 0.2592 | 0.1385 | 0.2546 | 0.081 | |||||||||
| Location | 0.0079 | 0.0011 | 0.0639 | 0.0061 | - | |||||||||
| GM × LM | 0.0135 | 0.8095 | 0.0662 | 0.4368 | 0.736 | |||||||||
| Soil Nmin kg ha−1 | Start of Vegetation | Cabbage Planting | Head Formation Onset | Cabbage Harvest | End of Vegetation | ||
|---|---|---|---|---|---|---|---|
| LM treatments | D2 | D3 | D4 | D5 | D6 | ||
| 0–30 cm | |||||||
| C | 9.82 | 16.6 | a | 13.5 | 11.9 | 15.8 | |
| RG | 7.63 | 8.46 | c | 12.3 | 12.1 | 19.2 | |
| WC-F | 10.1 | 11.9 | b | 13.6 | 14.6 | 16.7 | |
| WC-S | - | 18.2 | a | 15.6 | 12.1 | 15.8 | |
| MC-F | 10.1 | 11.3 | b | 14.3 | 14.9 | 19.0 | |
| MC-S | - | 18.7 | a | 14.6 | 12.5 | 15.6 | |
| 30–60 cm | |||||||
| C | 9.22 | 14.5 | a | 9.47 | a | 5.93 | 12.7 |
| RG | 6.03 | 7.52 | c | 5.83 | c | 5.34 | 12.5 |
| WC-F | 8.33 | 10.5 | b | 8.24 | ab | 5.82 | 12.3 |
| WC-S | - | 15.1 | a | 9.24 | ab | 5.87 | 14.0 |
| MC-F | 7.81 | 10.6 | b | 7.45 | b | 5.77 | 13.9 |
| MC-S | - | 14.9 | a | 8.38 | ab | 5.74 | 12.2 |
| 60–90 cm | |||||||
| C | 8.83 | 9.75 | 5.82 | ||||
| RG | 5.04 | 5.07 | 5.39 | ||||
| WC-F | 8.88 | 7.17 | 5.76 | ||||
| WC-S | - | 10.9 | 5.53 | ||||
| MC-F | 8.26 | 7.31 | 5.88 | ||||
| MC-S | - | 10.4 | 5.80 | ||||
| Cabbage Planting | Cabbage Harvest | |||
|---|---|---|---|---|
| Living mulch 1 | BNF (kg N ha−1) | Growth management 2 | BNF (kg N ha−1) | |
| WC-F | 51.2 | STU | −26.2 | A |
| WC-S | 17.1 | |||
| MC-F | 30.7 | STT | −28.1 | B |
| MC-S | 26.4 | |||
| LM Treatments 1 | Biomass DM Yield (Mg ha−1) | N Concentration (% DM) | C/N Ratio | N Content in Biomass (kg N ha−1) | ||
|---|---|---|---|---|---|---|
| C | 1.87 | 1.86 | bc | 19.5 | b | 31.8 |
| RG | 3.46 | 1.52 | c | 28.6 | a | 44.1 |
| WC-F | 3.07 | 2.78 | a | 14.7 | c | 78.8 |
| WC-S | 0.90 | 2.76 | ac | 12.6 | c | 20.8 |
| MC-F | 2.70 | 2.56 | a | 15.1 | c | 62.6 |
| MC-S | 0.77 | 3.11 | ab | 11.7 | c | 19.8 |
| Biomass DM Yield | N Concentration | C/N Ratio | ||||||||
|---|---|---|---|---|---|---|---|---|---|---|
| (Mg ha−1) | (% DM) | |||||||||
| Growth Management 2 | STU | STT | STU | STT | ||||||
| LM species 1 | ||||||||||
| RG | 5.28 | a | 1.90 | b | 1.84 | c | 21.3 | a | 21.6 | a |
| WC-F | 2.16 | b | 3.47 | a | 3.27 | ab | 10.9 | b | 11.4 | bc |
| WC-S | 3.08 | b | 2.25 | b | 2.74 | b | 19.3 | a | 14.8 | b |
| MC-F | 2.03 | b | 3.49 | a | 3.41 | a | 10.6 | b | 11.1 | c |
| MC-S | 2.94 | b | 2.10 | b | 2.86 | ab | 20.3 | a | 14.1 | bc |


3.2. LM Biomass Growth
3.3. BNF
3.4. SPAD
3.5. Cabbage Yield
4. Discussion
4.1. N Supply of Cabbage
4.1.1. Green Manure Fertilization via Rototilling
4.1.2. Biological N2 Fixation
4.2. Competition between LM and Cabbage
4.3. Sowing Date and Nitrate Leaching
5. Conclusions
Author Contributions
Funding
Institutional Review Board Statement
Informed Consent Statement
Data Availability Statement
Acknowledgments
Conflicts of Interest
References
- Cooper, J.; Reed, E.Y.; Hörtenhuber, S.; Lindenthal, T.; Løes, A.-K.; Mäder, P.; Magid, J.; Oberson, A.; Kolbe, H.; Möller, K. Phosphorus Availability on Many Organically Managed Farms in Europe. Nutr. Cycl. Agroecosyst. 2018, 110, 227–239. [Google Scholar] [CrossRef] [Green Version]
- Cuijpers, W.; van der Burgt, G.; Voogt, W. Nitrogen Balances in Dutch Organic Greenhouse Production. In Proceedings of the 2nd ISOFAR Conference in the Frame of the 16th IFOAM Organic World Congress, Modena, Italy, 16–20 June 2008. [Google Scholar]
- Möller, K. Soil Fertility Status and Nutrient Input–Output Flows of Specialised Organic Cropping Systems: A Review. Nutr. Cycl. Agroecosyst. 2018, 112, 147–164. [Google Scholar] [CrossRef]
- IFOAM. The IFOAM Norms for Organic Production and Processing. Version of October 2019. Available online: https://www.ifoam.bio/sites/default/files/2020-04/ifoam_norms_version_july_2014.pdf (accessed on 1 December 2021).
- BioAustria. Produktionsrichtlinien. 2021. Available online: https://www.bio-austria.at/app/uploads/2021/06/Richtlinien_2021_Juni_AKTUELL_neueSchrift_klein.pdf (accessed on 1 December 2021).
- European Commission Council Regulation (EC) No 834/2007 of 28 June 2007 on Organic Production and Labelling of Organic Products and Repealing Regulation (EEC) No 2092/91; 2007. Available online: https://eur-lex.europa.eu/legal-content/EN/TXT/PDF/?uri=CELEX:02007R0834-20130701&from=FR (accessed on 4 February 2022).
- Demeter, E.V. Demeter Richtlinien 2021 Erzeugung und Verarbeitung Richtlinien für die Zertifizierung »Demeter« und »Biodynamisch«, 2021. Available online: https://www.demeter.de/sites/default/files/richtlinien/richtlinien_gesamt.pdf (accessed on 25 January 2022).
- European Commission Organic Farming in the EU- A Fast Growing Sector. EU Agricultural Markets Briefs; European Union: 2019; p. 12. Available online: https://ec.europa.eu/info/sites/default/files/food-farming-fisheries/farming/documents/market-brief-organic-farming-in-the-eu_mar2019_en.pdf (accessed on 25 January 2022).
- Bundesanstalt für Landwirtschaft und Ernährung (BLE), Geschäftsstelle Bundesprogramm Ökologischer Landbau und andere Formen Nachhaltiger Landwirtschaft (BÖLN). Ökobarometer 2019—Umfrage zum Konsum von Biolebensmitteln; 2020; p. 24. Available online: https://www.bmel.de/SharedDocs/Downloads/DE/Broschueren/oekobarometer-2019.pdf?__blob=publicationFile&v=5 (accessed on 4 February 2022).
- Willer, E.H.; Lernoud, J. The World of Organic Agriculture Statistics and Emerging Trends 2019. 2019, Research Institute of Organic Agriculture FiBL and IFOAM Organics International, Frick and Bonn. Available online: https://orgprints.org/id/eprint/34570/10/WILLER-LERNOUD-2018-final-PDF-low.pdf (accessed on 4 February 2022).
- Kainz, M.; Siebrecht, N.; Reents, H. Wirkungen Des Ökologischen Landbaus Auf Bodenerosion. In Proceedings of the Werte—Wege—Wirkungen: Biolandbau im Spannungsfeld zwischen Ernährungssicherung, Markt und Klimawandel, Vol. 1: Boden, Pflanzenbau, Agrartechnik, Umwelt-und Naturschutz, Biolandbau international, Wissensmanagement. Beiträge zur 10. Wissenschaftstagung Ökologischer Landbau, Zürich, Switzerland, 11–13 February 2009; Mayer, J., Alföldi, T., Leiber, F., Dubois, D., Fried, P., Heckendorn, F., Hiillmann, E., Klocke, P., Lüscher, A., Riedel, S., et al., Eds.; [Google Scholar]
- Askegaard, M.; Olesen, J.E.; Rasmussen, I.A.; Kristensen, K. Nitrate Leaching from Organic Arable Crop Rotations Is Mostly Determined by Autumn Field Management. Agric. Ecosyst. Environ. 2011, 142, 149–160. [Google Scholar] [CrossRef]
- Brainard, D.C.; Bellinder, R.R.; Miller, A.J. Cultivation and Interseeding for Weed Control in Transplanted Cabbage. Weed Technol. 2004, 18, 704–710. [Google Scholar] [CrossRef]
- Brainard, D.C.; Bellinder, R.R. Weed Suppression in a Broccoli–Winter Rye Intercropping System. Weed Sci. 2004, 52, 281–290. [Google Scholar] [CrossRef]
- Hartwig, N.L.; Ammon, H.U. Cover Crops and Living Mulches. Weed Sci. 2002, 50, 688–699. [Google Scholar] [CrossRef]
- Adamczewska-Sowińska, K.; Kołota, E.; Winiarska, S. Living Mulches in Field Cultivation of Vegetables. Veg. Crops Res. Bull. 2009, 70, 19–29. [Google Scholar] [CrossRef]
- Boyd, N.S.; Gordon, R.; Asiedu, S.K.; Martin, R.C. The Effects of Living Mulches on Tuber Yield of Potato (Solanum Tuberosum L.). Biol. Agric. Hortic. 2001, 18, 203–220. [Google Scholar] [CrossRef]
- Kołota, E.; Adamczewska-Sowińska, K. Living Mulches in Vegetable Crops Production: Perspectives and Limitations (a Reviev). Acta Sci. Pol. Hortorum Cultus 2013, 12, 127–142. [Google Scholar]
- Brandsæter, L.O.; Netland, J.; Meadow, R. Yields, Weeds, Pests and Soil Nitrogen in a White Cabbage-Living Mulch System. Biol. Agric. Hortic. 1998, 16, 291–309. [Google Scholar] [CrossRef]
- Jędrszczyk, E.; Poniedziałek, M.; Sękara, A. Effect of Living Mulches on White Head Cabbage (Brassica Oleracea Var. Capitata Subvar. Alba L.) Yielding. Folia Hortic. 2005, 17, 29–36. [Google Scholar]
- Borowy, A. Growth and Yield of Stake Tomato under No-Tillage Cultivation Using Hary Vetch as a Living Mulch. Acta Sci. Pol. Hortorum Cultus 2012, 11, 229–252. [Google Scholar]
- Ilnicki, R.D.; Enache, A.J. Subterranean Clover Living Mulch: An Alternative Method of Weed Control. Agric. Ecosyst. Environ. 1992, 40, 249–264. [Google Scholar] [CrossRef]
- Hooks, C.; Pandey, R.; Johnson, M. Using Clovers as Living Mulches to Boost Yields, Suppress Pests, and Augment Spiders in a Broccoli Agroecosystem. 2007. Available online: https://www.ctahr.hawaii.edu/oc/freepubs/pdf/ip-27.pdf (accessed on 2 December 2021).
- Infante, M.L.; Morse, R.D. Integration of No Tillage and Overseeded Legume Living Mulches for Transplanted Broccoli Production. HortScience 1996, 31, 376–380. [Google Scholar] [CrossRef] [Green Version]
- Tempesta, M.; Gianquinto, G.; Hauser, M.; Tagliavini, M. Optimization of Nitrogen Nutrition of Cauliflower Intercropped with Clover and in Rotation with Lettuce. Sci. Hortic. 2019, 246, 734–740. [Google Scholar] [CrossRef]
- Thériault, F.; Stewart, K.A.; Seguin, P. Use of Perennial Legumes Living Mulches and Green Manures for the Fertilization of Organic Broccoli. Int. J. Veg. Sci. 2009, 15, 142–157. [Google Scholar] [CrossRef]
- Xie, Y.; Kristensen, H.L. Overwintering Grass-Clover as Intercrop and Moderately Reduced Nitrogen Fertilization Maintain Yield and Reduce the Risk of Nitrate Leaching in an Organic Cauliflower (Brassica Oleracea L. Var. Botrytis) Agroecosystem. Sci. Hortic. 2016, 206, 71–79. [Google Scholar] [CrossRef]
- Montemurro, F.; Diacono, M.; Ciaccia, C.; Campanelli, G.; Tittarelli, F.; Leteo, F.; Canali, S. Effectiveness of Living Mulch Strategies for Winter Organic Cauliflower (Brassica Oleracea L. Var. Botrytis) Production in Central and Southern Italy. Renew. Agric. Food Syst. 2017, 32, 263–272. [Google Scholar] [CrossRef]
- Gibson, K.D.; Mcmillan, J.; Hallett, S.G.; Jordan, T.; Weller, S.C. Effect of a Living Mulch on Weed Seed Banks in Tomato. Weed Technol. 2011, 25, 245–251. [Google Scholar] [CrossRef]
- Canali, S.; Diacono, M.; Montemurro, F.; Delate, K. Enhancing Multifunctional Benefits of Living Mulch in Organic Vegetable Cropping Systems. Renew. Agric. Food Syst. 2017, 32, 197–199. [Google Scholar] [CrossRef] [Green Version]
- Gruszecki, R.; Borowy, A.; Sałata, A.; Zawiślak, G. Effect of Living Mulch and Linuron on Weeds and Yield of Carrot under Ridge Cultivation. Acta scientiarum Polonorum. Hortorum Cultus = Ogrod. 2015, 14, 67–82. [Google Scholar]
- Fracchiolla, M.; Renna, M.; D’Imperio, M.; Lasorella, C.; Santamaria, P.; Cazzato, E. Living Mulch and Organic Fertilization to Improve Weed Management, Yield and Quality of Broccoli Raab in Organic Farming. Plants 2020, 9, 177. [Google Scholar] [CrossRef] [PubMed] [Green Version]
- Verband Deutscher Landwirtschaftlicher Untersuchungs- und Forschungsanstalten; Bassler, R.; Schmitt, L.; Siegel, O. (Eds.) Methodenbuch/Verband Deutscher Landwirtschaftlicher Untersuchungs- und Forschungsanstalten; Teillieferung 3; VDLUFA-Verl.: Darmstadt, Germany, 2003; ISBN 978-3-922712-71-8. [Google Scholar]
- Cohen, M.A.; Ryan, P.B. Observations Less than the Analytical Limit of Detection: A New Approach. JAPCA 1989, 39, 328–329. [Google Scholar] [CrossRef]
- Stuelpnagel, R. Schätzung der von Ackerbohnen symbiontisch fixierten Stickstoffmenge im Feldversuch mit der erweiterten Differenzmethode. Z. ACKER-PFLANZENB. Z. Für Acker-Und Pflanzenbau 1982, 151, 446–458. [Google Scholar]
- Wolfinger, R. Covariance Structure Selection in General Mixed Models. Commun. Stat.—Simul. Comput. 1993, 22, 1079–1106. [Google Scholar] [CrossRef]
- Piepho, H.-P. An Algorithm for a Letter-Based Representation of All-Pairwise Comparisons. J. Comput. Graph. Stat. 2004, 13, 456–466. [Google Scholar] [CrossRef]
- Bergmann, W. Ernährungsstörungen bei Kulturpflanzen: Entstehung, Visuelle und Analytische Diagnose; 128 Tab; Spektrum Akademischer Verlag: Heidelberg, Germany, 1993; ISBN 978-3-334-60414-4. [Google Scholar]
- Clark, M.S.; Horwath, W.R.; Shennan, C.; Scow, K.M.; Lantni, W.T.; Ferris, H. Nitrogen, Weeds and Water as Yield-Limiting Factors in Conventional, Low-Input, and Organic Tomato Systems. Agric. Ecosyst. Environ. 1999, 73, 257–270. [Google Scholar] [CrossRef]
- Delwiche, C.C.; Wijler, J. Non-Symbiotic Nitrogen Fixation in Soil. Plant Soil 1956, 7, 113–129. [Google Scholar] [CrossRef]
- Unkovich, M.; Herridge, D.; Peoples, M.; Cadisch, G.; Boddey, R.; Giller, K.; Alves, B.; Chalk, P. Measuring plant-associated nitrogen fixation in agricultural systems. ACIAR Monograph No. 136, 2008, 258 pp.Müller-Schärer, H. Interplanting Ryegrass in Winter Leek: Effect on Weed Control, Crop Yield and Allocation of N-Fertiliser. Crop Prot. 1996, 15, 641–648. [Google Scholar] [CrossRef]


| Factor: Growth Management of LM | Abbr. | Factor: LM Species | Abbr. | ||
|---|---|---|---|---|---|
| (i) | Complete rototillage and incorporation of LM before planting cabbage | RT | (i) | White clover—fall seeded | WC-F |
| (ii) | Strip-till cabbage planting into LM without further treatment of LM | STU | (ii) | Micro clover—fall seeded | MC-F |
| (iii) | Strip-till cabbage planting into LM with mulching LM during cabbage growing | STT | (iii) | Perennial ryegrass | RG |
| (iv) | Bare soil (=control) | C | |||
| (v) | White clover—spring seeded | WC-S | |||
| (vi) | Micro clover—spring seeded | MC-S | |||
| Site Differences | 2019 | 2020 | 2021 | ||
|---|---|---|---|---|---|
| Location 1 | UH 1 | GR 1 | UH | GR | UH |
| Clover establishment | spring | fall | spring | fall | fall |
| Initial Nmin content (kg ha−1 at 0–90 cm) | 91 | 106 | 38 | 119 | 45 |
| Cabbage planting | |||||
| Plot size (m2) | 11 × 4.5 | 11 × 3 | 11 × 3 | 11 × 3 | 11 × 3 |
| Rows per plot | 6 | 4 | 4 | 4 | 4 |
| Inter-row spacing (m) | 0.75 | 0.5 | 0.75 | 0.65 | 0.75 |
| Intra-row spacing (m) | 0.32 | 0.5 | 0.32 | 0.5 | 0.32 |
| Plants ha−1 | 42,000 | 40,000 | 42,000 | 31,000 | 42,000 |
Publisher’s Note: MDPI stays neutral with regard to jurisdictional claims in published maps and institutional affiliations. |
© 2022 by the authors. Licensee MDPI, Basel, Switzerland. This article is an open access article distributed under the terms and conditions of the Creative Commons Attribution (CC BY) license (https://creativecommons.org/licenses/by/4.0/).
Share and Cite
Stein, S.; Hartung, J.; Möller, K.; Zikeli, S. The Effects of Leguminous Living Mulch Intercropping and Its Growth Management on Organic Cabbage Yield and Biological Nitrogen Fixation. Agronomy 2022, 12, 1009. https://0-doi-org.brum.beds.ac.uk/10.3390/agronomy12051009
Stein S, Hartung J, Möller K, Zikeli S. The Effects of Leguminous Living Mulch Intercropping and Its Growth Management on Organic Cabbage Yield and Biological Nitrogen Fixation. Agronomy. 2022; 12(5):1009. https://0-doi-org.brum.beds.ac.uk/10.3390/agronomy12051009
Chicago/Turabian StyleStein, Sophie, Jens Hartung, Kurt Möller, and Sabine Zikeli. 2022. "The Effects of Leguminous Living Mulch Intercropping and Its Growth Management on Organic Cabbage Yield and Biological Nitrogen Fixation" Agronomy 12, no. 5: 1009. https://0-doi-org.brum.beds.ac.uk/10.3390/agronomy12051009