Article

Three-Dimensional Wheat Modelling Based on Leaf Morphological Features and Mesh Deformation

1
College of Information Engineering, Northwest A&F University, Xianyang 712100, China
2
Beijing Key Lab of Digital Plant, National Engineering Research Center for Information Technology in Agriculture, Beijing 100097, China
3
Information Technology Research Center, Beijing Academy of Agriculture and Forestry Sciences, Beijing 100097, China
4
College of Agronomy, Inner Mongolia Agricultural University, Hohhot 010019, China
*
Author to whom correspondence should be addressed.
Submission received: 5 January 2022 / Revised: 24 January 2022 / Accepted: 3 February 2022 / Published: 7 February 2022
(This article belongs to the Special Issue 3D Phenotyping for Plant Breeding and Management)

Abstract

:
The three-dimensional (3D) morphological structure of wheat directly reflects the interrelationship among genetics, environments, and cropping systems. However, the morphological complexity of wheat limits its rapid and accurate 3D modelling. We have developed a 3D wheat modelling method that is based on the progression from skeletons to mesh models. Firstly, we identified five morphological parameters that describe the 3D leaf features of wheat from amounts of 3D leaf digitizing data at the grain filling stage. The template samples were selected based on the similarity between the input leaf skeleton and leaf templates in the constructed wheat leaf database. The leaf modelling was then performed using the as-rigid-as-possible (ARAP) mesh deformation method. We found that 3D wheat modelling at the individual leaf level, leaf group, and individual plant scales can be achieved. Compared with directly acquiring 3D digitizing data for 3D modelling, it saves 79.9% of the time. The minimum correlation R2 of the extracted morphological leaf parameters between using the measured data and 3D model by this method was 0.91 and the maximum RMSE was 0.03, implying that this method preserves the morphological leaf features. The proposed method provides a strong foundation for further morphological phenotype extraction, functional–structural analysis, and virtual reality applications in wheat plants. Overall, we provide a new 3D modelling method for complex plants.

1. Introduction

Plant growth and development are predominantly reflected by the plants’ morphological structures and are significantly affected by several factors such as the type of cultivar, the growth period, and environmental parameters, as well as the cultivation and management measures. The rapid and accurate quantification of plant morphological structures is of great significance in plant science [1]. The one-dimensional (1D) parameters such as plant height, plant coverage, leaf area index, leaf length, and leaf angle that are used to characterize the morphological and structural characteristics of plants present unique limitations. These parameters mostly describe the morphological structure of the plants, which does not reflect the three-dimensional (3D) morphological details of plant organs. The 3D modelling of plants integrates the morphological and structural characteristics of the plants using computer graphics, achieving the high-resolution reconstruction of the morphological structure of plants in the 3D space [2]. The 3D modelling of plants analyzes the phenotypic and morphological structure of plants with high precision and is critical for plant research and application [3,4]. However, the 3D modelling of plants has always been a challenging problem due to the complex morphological structure of plants and the stringent requirements of different applications for reconstruction accuracy and photorealism [5,6].
Wheat is a food crop that is farmed globally. Given the complex plant morphology, multiple tillers, and serious cross-occlusion between organs, the 3D modelling of wheat faces many challenges. The current 3D simulation and reconstruction of wheat plant morphology can be divided into three categories: the mathematical modelling method, the skeleton-driven method, and reconstruction using point cloud and 3D digitization data. The mathematical modelling method mainly utilizes manually measured data to construct mathematical equations for wheat organs that realize the 3D simulation of wheat. For example, 3D models that are based on OpenAlea or ADEL-Wheat [7,8] of individual plants and populations of wheat at different periods have been developed [9,10]. This model can be used to simulate the canopy structure-related phenotypic parameters, calculate the light distribution, and simulate the growth dynamics of wheat. However, the model can only be used to distinguish the overall morphology of wheat plants in different periods but cannot reflect the detailed morphology of wheat leaves and morphological differences among cultivars. The skeleton-driven method can realize the 3D modelling of the wheat leaves and plants by constructing vein equations or using vein information that was extracted from the 3D point cloud [11] combined with leaf simulation modelling methods such as the non-uniform rational b-splines (NURBS) surface [12,13], thus it can incorporate the crimp and twist characteristics of wheat leaves [14,15,16]. Though preserving the main topological structure of the wheat plants, the existing methods require many control points in order to simulate the 3D morphological characteristics of the leaves, especially the twisting property of the leaves [14]. The reconstruction methods mainly use 3D point cloud data of the plants in order to reconstruct the 3D model of the plants through point cloud denoising, segmentation, and reconstruction [17,18,19,20]. Compared with the previous two kinds of methods, 3D reconstruction is highly automated and the reconstructed 3D models are more accurate and realistic [21,22]. In particular, point cloud data combined with discrete smoothing, D2-spline, and other surface fitting methods achieve the 3D reconstruction of wheat leaves with twisting characteristics [23]. However, they can only distinguish the overall morphology of the wheat plants in different periods but they cannot reflect the detailed morphology of the wheat leaves and the morphological differences among cultivars. Meanwhile, they rely on high-quality 3D point cloud data of each leaf and it is still difficult to achieve the high-throughput acquisition and segmentation of a 3D point cloud in wheat plants [24]. In general, the above methods do not achieve accurate 3D modelling of wheat leaves of different shapes due to the large tillers and serious cross occlusion that are present in wheat plants. The 3D digitization method is still the most accurate means of the 3D simulation of multi-tiller crops [25]. However, the efficiency of 3D digitizing is low. Therefore, it is urgent to improve the efficiency of the 3D modelling of multi-tiller crops by integrating existing knowledge of 3D digitization.
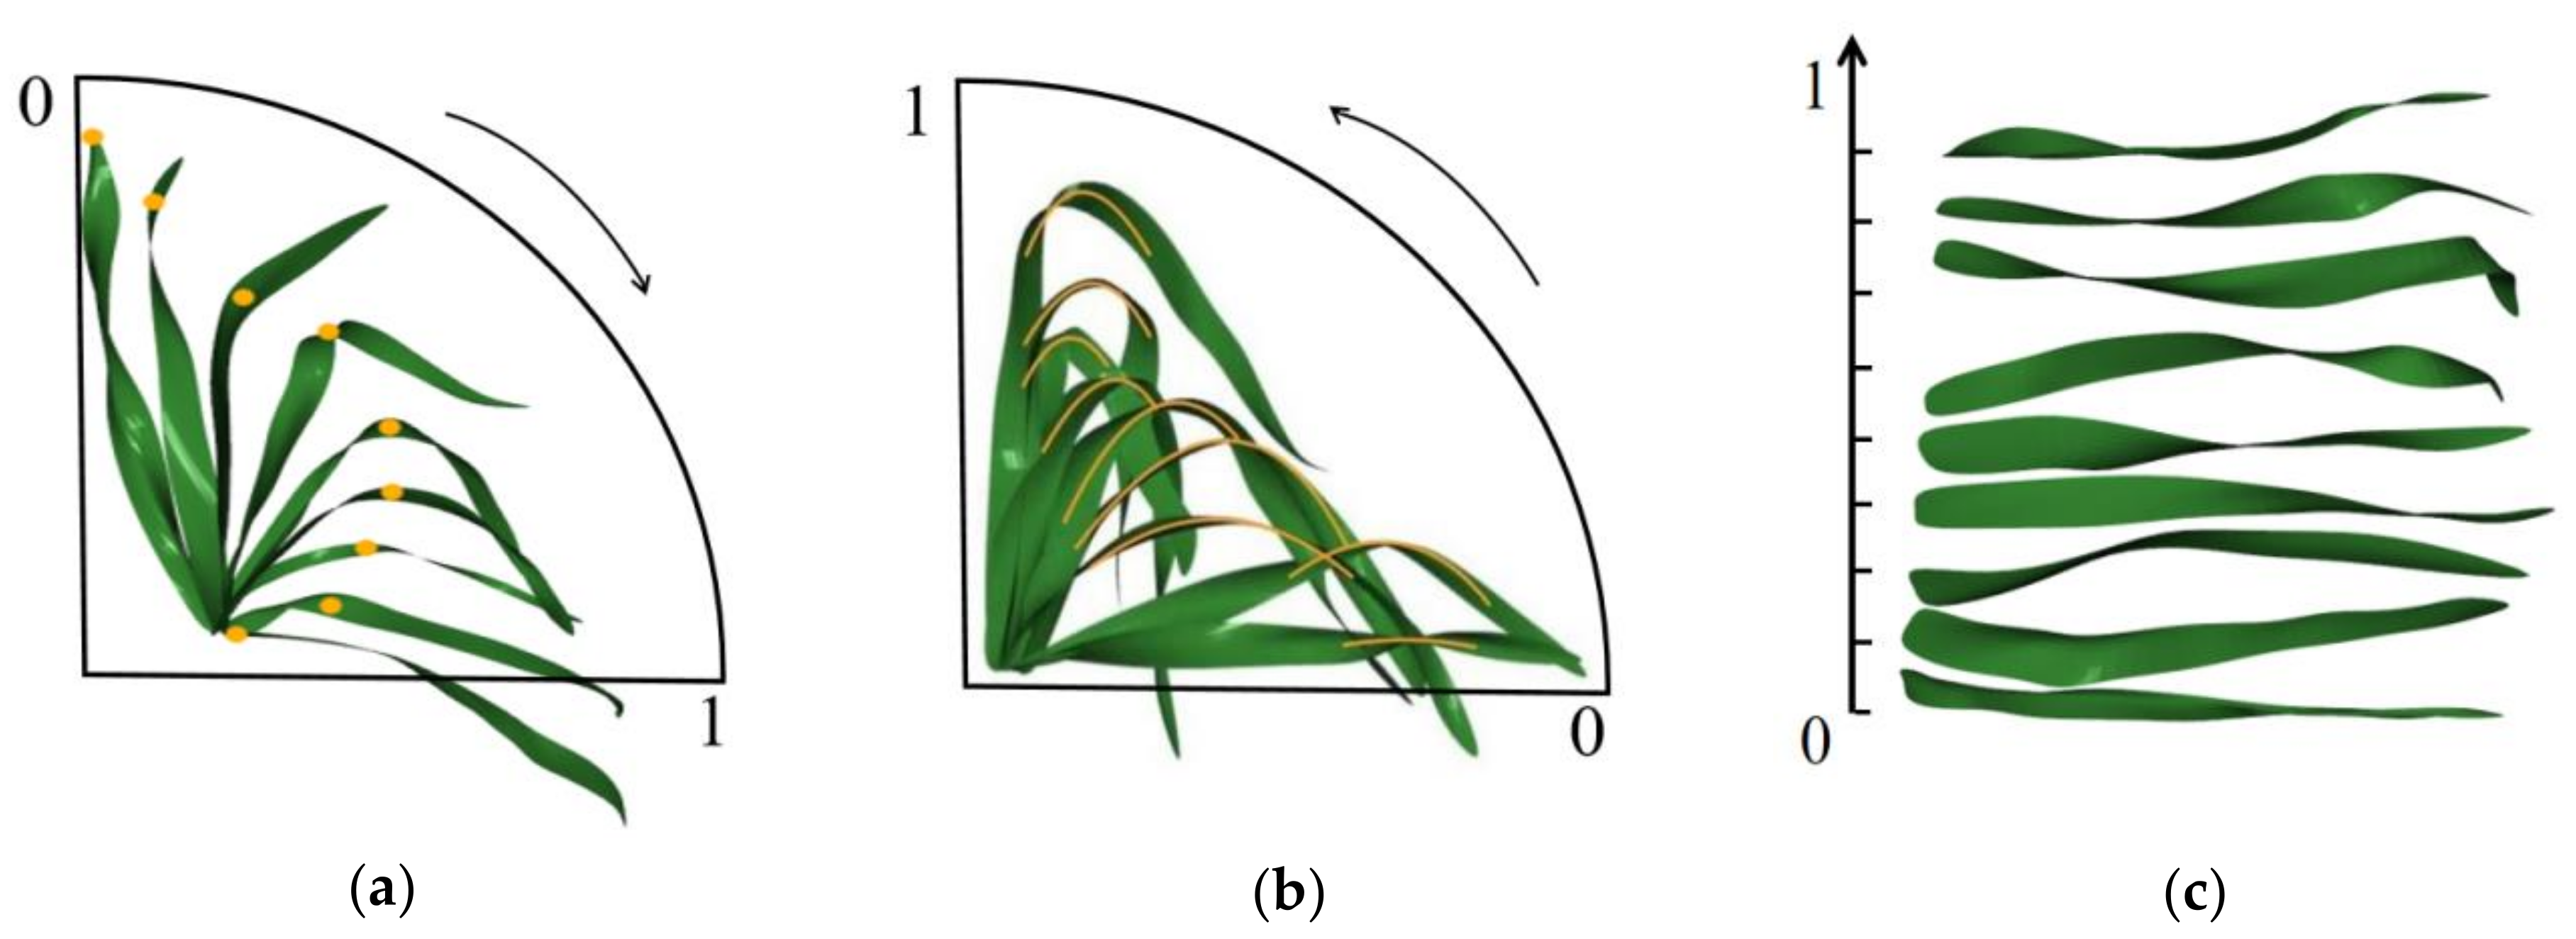
The leaf is an important structural and functional organ for plants. Leaf morphology varies between cultivars, the leaves’ positions on the plant, and the growth period, among other variables. Thus, it is important to describe these differences quantitatively. The traditional measurement methods that use parameters such as the leaf length, leaf width, leaf area, leaf angle, and azimuth angle to distinguish the differences between leaves are relatively unsatisfactory. Zhang et al. [26] proposed the use of parameters such as leaf angle and leaf curvature in order to describe the two-dimensional (2D) morphological characteristics of maize veins. Jin et al. [27] proposed parameters such as leaf height, projected leaf area, and leaf volume in order to describe the morphological leaf features of maize, which were used to estimate the biomass of maize plants in different periods. Fournier et al. [
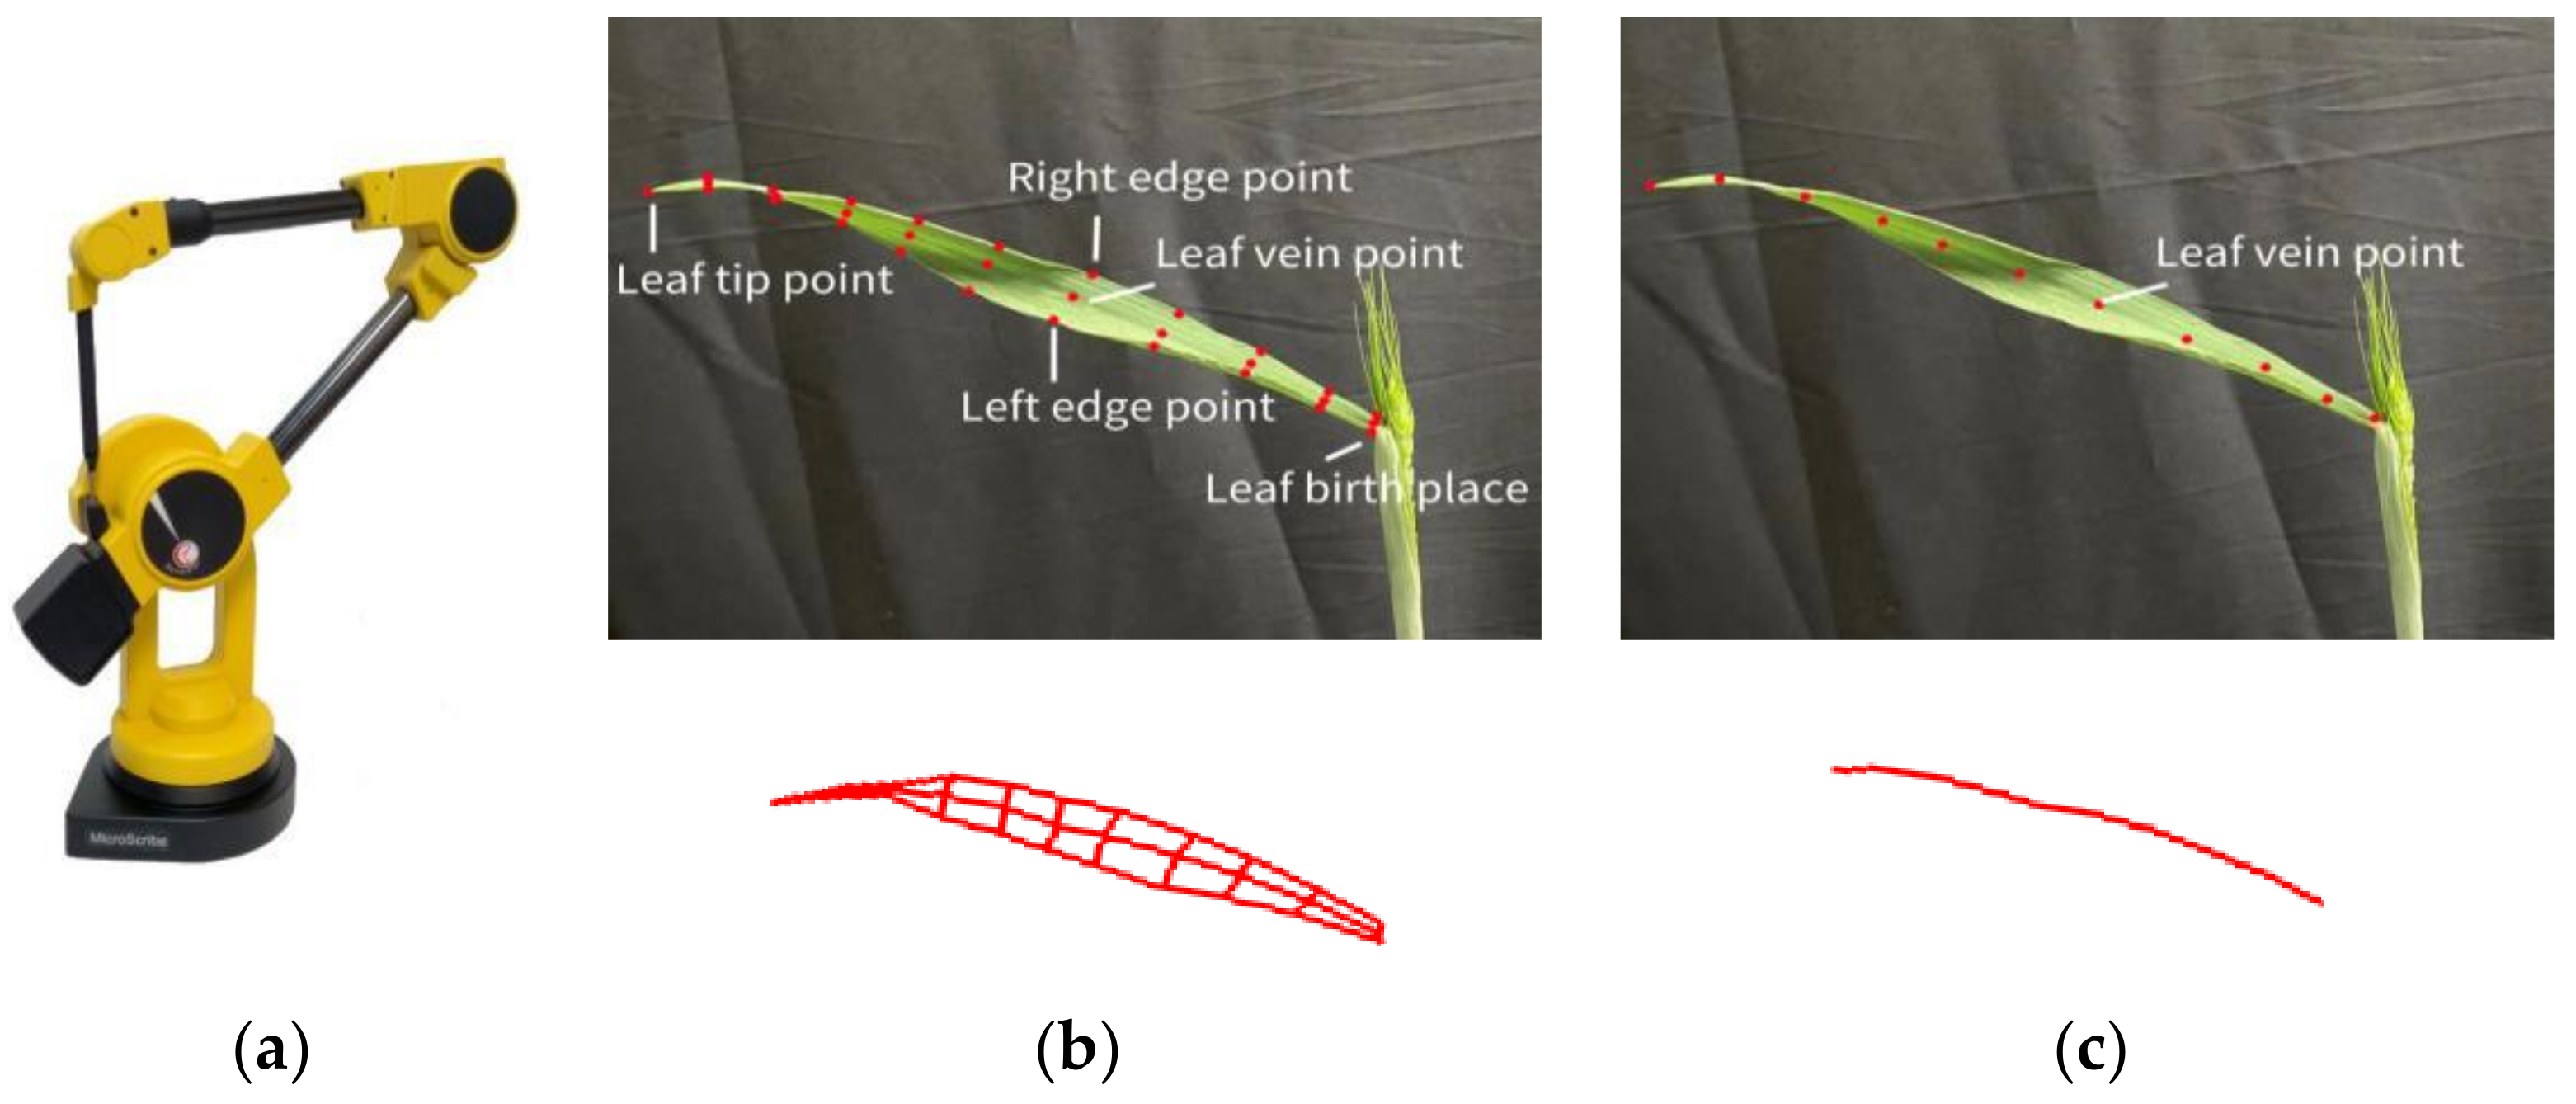
8] accurately described the birth direction and the vein spatial curve of wheat leaves and the precise position of the leaves in 3D space by using the 3D digitizer. Yang et al. [28] predicted different leaf shapes using leaf and elevation angles as well as curvature. These studies show that the 3D leaf morphology can be represented by both the size and the 3D space posture indices of the leaf. However, a systematic index system that can simulate the morphological variations of different wheat cultivars is currently lacking.
A 3D model that can reflect the morphological differences among cultivars in the same species can effectively establish the relationship between plant 3D modelling technology and plant breeding, cultivation, and application. In recent years, researchers have developed a rapid 3D modelling method that can realize cultivar differences in corn [29] and other crops. However, to the best of our knowledge, no research has distinguished wheat plant type among cultivars, especially leaf shape differences.
To address the 3D wheat modelling challenges of improving the efficiency under the condition of ensuring accuracy, a wheat modelling method that is based on morphological leaf features and deformation was proposed. The specific objectives of this study involve: (1) identifying the 3D morphological features and quantitative estimation methods of wheat leaves among cultivars, and (2) realizing the 3D modelling or simulation of wheat leaves and individual plants for varied cultivars using 3D morphological leaf parameters.

2. Materials

2.1. Experiment Design

This experiment was performed at the Beijing Academy of Agriculture and Forestry Sciences, Beijing (N39°56′, E116°16′). The winter wheat was planted from 2020 to 2021. A total of 60 wheat cultivars with marked morphological leaf differences were used. Each wheat cultivar was planted on a separate plot measuring 2.25 m × 1.5 m. The planting was performed on 4 October 2020. The spacing between the rows and plants was 0.2 m and 0.05 m, respectively. The features of the morphological parameters were collected in early May 2021, when the wheat plants were at the grain filling stage in which the morphological development of the wheat cultivars had stabilized.

2.2. Data Acquisition

The morphological and structural data of the wheat at the grain filling stage were collected between 12 and 20 May 2021. The whole wheat plants were transplanted to pots and moved indoors. The 3D digitizing data of the aboveground parts of the wheat cultivars were collected using MicroScribe i (Figure 1a). Three replicas were collected for each cultivar. The complete 3D digital data of all of the leaves of a given plant were obtained for the cultivars with large morphological differences. For the remaining cultivars, we only collected the data of leaves on the main stem and one tiller, and only the leaf skeleton of the remaining tillers.
The data acquisition specifications [30] were as follows:
(1)
Stem: the stem thickness around the root area, at several coordinate points from top to bottom, and at the point between the last leaf and the stem were recorded.
(2)
Leaf: three coordinate points at the left edge, leaf vein, and right edge of the wheat in each row along the growth direction, in the same direction, were obtained. The data were captured for the areas between the leaf nodes to the leaf tip (Figure 1b). The distances between the measurement rows were with similar intervals and included features that can reflect the morphological parameters and changes of the leaves.
The extracted leaf skeleton data is shown in Figure 1c. Figure 1 shows the instruments that were used for capturing the relevant data and the specific data that were collected.
In this experiment, complete leaf data was captured from 15 cultivars (45 plants), whereas complete data of a leaf on the main stem and one tiller and leaf skeletons on other tillers were captured from the remaining 45 cultivars (135 plants). In the end, 3D digital data were collected for 2775 leaves in total (Table 1).

3. The 3D Modelling of Wheat

3.1. Overview

The 3D modelling method was based on the leaf or plant skeleton and leaf mesh template data through three steps (Figure 2). First, the morphological leaf parameters were calculated. The leaf template selection comprised the clustering of the leaf data, weight determination of the 3D parameters, and generating a typical leaf template database; template selection then followed. The vein-driven mesh deformation method involved the template calling, rotation, scaling, and translation of the leaf templates, leaf vein curve resampling, and mesh deformation using ARAP.

3.2. The Special 3D Morphological Leaf Features of Wheat

The quantitative characterization of the 3D spatial morphological characteristics of wheat leaves was determined to systematically and comprehensively characterize the differences between the various wheat cultivars, including the leaf size ratio, maximum leaf width position, leaf sag, leaf bending, and leaf twisting. Among them, the leaf size ratio and maximum leaf width position describe the relationship between the change in leaf width and leaf length, whereas leaf sagging and leaf bending describe the change in the morphological leaf features along the leaf vein direction. Leaf twisting describes the change in the leaf surface that is perpendicular to the leaf vein direction. Table 2 highlights how the important parameters of the five 3D morphological leaf features were calculated.

3.3. Leaf Template Selection Method Based on Parameters of Morphological Leaf Feature

3.3.1. Leaf Template Standardization

A total of 2775 points of leaf data were standardized in order to generate a leaf template database. The leaf template standardization was performed in three steps:
(1)
Data normalization: the leaf was first translated to the position where the birth point of the vein coincides with the origin. The (angle) vector that is formed by the third vein point and the origin is considered to be the leaf growth direction vector g . The angle α between the projection vector g z   of g on the XOY plane and the positive direction of the X-axis was then calculated. All of the data points of the leaf α angles were then rotated around the Z-axis so that the birth and growth directions of all of the leaves were consistent with the positive direction of the X-axis.
(2)
Triangulation: a triangular mesh model was then generated according to the corresponding rules from the normalized 3D digitizing data of the leaves [29].
(3)
Mesh subdivision: for the leaves with a triangular mesh, the Loop mesh subdivision method [31] was used in order to refine the mesh of each leaf, which was ideal for selecting the best control points during the templates’ deformation. For the wheat plants, the best effect was achieved after subdividing the iterative leaf two times.

3.3.2. Leaf template Selection Method

For the 3D modelling of wheat leaves, selecting a leaf template with close resemblance to the target cultivar needs to be performed [32]. Thus, the number of iterations can be reduced as much as possible, whilst retaining the leaf’s morphological features, including the cultivar differences. Due to the difference in the leaf size ratios and the twisting of leaves at different positions, it was necessary to classify the leaves in the selection of templates according to this parameter. Five morphological leaf parameters, including leaf size ratio, maximum leaf width position, leaf sag, leaf bending, and leaf twisting were the main factors determining the leaf shape. The principal component analysis (PCA) and dimension reduction were carried out for the five leaf parameters of all of the leaves, then the K-means algorithm was used for the clustering analysis. Accordingly, the flag leaf, middle leaves, and first leaf were clustered into two categories, nine categories, and three categories, respectively (Figure 3). The leaves with typical shape characteristics were selected from the 14 categories in order to build a leaf template database that was useful for selection in the subsequent leaf deformation process. Table 3 shows the key values of the five morphological leaf features and the total number of leaves of each cluster at the different leaf positions.
The clustering results show that the leaf size ratio and maximum leaf width position are not key clustering parameters and that the significance of the remaining three parameters on the leaf shape varies. To a certain extent, leaf sag affects leaf bending and leaf twisting is mainly related to the cultivar’s characteristics but not strongly related to leaf sag and leaf bending. Thus, the similarity function that was used to search for the most similar leaf template in the database with a pre-modeled leaf vein curve was defined based on the morphological leaf features and numerical experiments (Equation (1)):
u i = 0.75 ( 0.9 | F i s a g F j s a g | + 0.1 | F i b e n d F j b e n d | ) + 0.25 | F i t w i s t F j t w i s t |
where i represents the serial number of the pre-modeled veins and j is the serial number of the leaf templates in the leaf template database. For the pre-modeled leaf vein curve, leaf sagging and leaf bending could be calculated according to the leaf vein curve data. Combined with the leaf twisting, all of the leaf templates in the template database were traversed and the similarity u corresponding to the leaf and each template in the template database was calculated. The template with the smallest u (the most similar leaf template) was selected for this vein call for subsequent vein-driven mesh deformation. If the newly added cultivar leaves did not match the existing template then a new leaf template was added to the template database.

3.4. Leaf Mesh Deformation Method Based on ARAP

3.4.1. ARAP Method

The mesh deformation method refers to a modelling method that gradually changes the mesh shape by switching the position of the control points in the mesh to resemble the target shape. The ARAP (as-rigid as-possible) deformation method [33] is a commonly used mesh deformation approach that achieves mesh deformation based on the iterative process of “deformation, local rotation, re-deformation”. During deformation, the method only uses translation and rotation data to transform each local element and ensure a minimum change of the local features during the whole deformation process so that the morphological details of the object are maintained to the maximum. The primary role of the ARAP algorithm is to form a rigid deformation element by combining the edges of the vertices of the mesh with the edges of the neighboring vertices. All of the deformation elements update the mesh by overlapping and covering the mesh during the deformation process. The rigid transformation process of a deformation element C to C (Figure 4) is expressed as shown in Equation (2) below:
p i p j = R i p i p j ,   j N i
where p i is a model vertex and p j   is a neighboring vertex of p i . The variables p i and p j are the deformed vertices of p i and p j , respectively. R i is the rotation matrix in the rigid transformation process, whereas N i represents the index of neighboring points of p i .
During deformation, the minimization energy function is used to increase the rigidity of the model as much as possible and to retain the local characteristics. Equation (3) is a quadratic energy function, whose process is a weighted example of a shape matching problem:
E C i , C i = j N i w i j p i p j R i p i p j 2
where C i and C i are the deformation elements corresponding to the model vertices p i and p i before and after deformation, respectively, and w i j represents the weight of the edge e i j = p i , p j . Given the rotation matrix, we let the derivative of the energy function be equal to 0, then the value of p when the function obtains the minimum value can be calculated. In the next iteration, the optimal rotation matrix R i can be obtained by taking p as a known quantity. This is repeated until the energy error is less than the expected threshold value. At this point, the deformation process is completed.

3.4.2. Vein-Driven Leaf Mesh Deformation Method

The 3D modelling of the wheat leaves was based on the input of pre-modeled leaf veins and data on the leaf’s morphological features, including the leaf width and leaf twisting, according to the leaf position. The leaf template with the highest similarity was called from the template database in the near leaf position and deformed to fit the target vein using the ARAP method through the vein-driven leaf mesh deformation method. The method can be divided into four parts (Figure 5): (1) Template calling; (2) Scaling of the leaf template according to the leaf length and leaf width of the target leaf before moving it to the birth point of the leaf; (3) Resampling the vein curve and establishing the corresponding relationship of the control points; and (4) Mesh deformation of the leaf based on ARAP.
(1)
Template calling (Figure 5a). This involved calculating the similarity u between the veins of the target leaf and each template in the leaf template database, based on the input vein information of the pre-modeled cultivar, after which the most similar leaf template was selected for subsequent deformation.
(2)
Scaling and translation (Figure 5b). This involved normalizing the template leaves through data processing. Ideally, the base points of all of the leaves were located at the origin and the growth direction along the X-axis is positive. By directly scaling the x, y, and z coordinates of all of the points of the leaf template data, the lengths and widths of the template and the target leaf became equal. Where the scaling ratio of x and z coordinates β = l 1 / l 0 , and the scaling ratio of y coordinate γ = w 1 / w 0 , l1, l0, w1 and w0 are the length and width of the target and template leaf. After scaling, the template leaf was moved to the position where the birth point coincides with that of the target leaf.
(3)
Leaf vein curve resampling (Figure 5c). In order to establish the one-to-one correspondence between the target leaf’s vein and control points of the template leaf’s vein, the input vein curve was resampled. The input vein curve was resampled according to the accumulated chord length of the selected template leaf while ensuring that the length of each section was consistent with the length of the template leaf.
(4)
Mesh deformation based on ARAP (Figure 5d). The vertices of the template leaf’s veins were taken as control points, while the corresponding control points of the target veins were taken as target positions. The leaf mesh was then iteratively deformed. In each deformation process, a control point was selected as the moving control point through the transverse leaf section and the leaf base point and the control point that generated the displacement were used as the fixed control point. The control point was moved to the target position but the fixed point remained unchanged. Finally, the ARAP method was used for the mesh deformation after all of the vertices of the mesh were updated. The deformation of the whole leaf was considered to be completed when all of the vein control points were traversed. Figure 6 shows the pseudocode of the leaf mesh deformation that was driven by the leaf veins.
Figure 6. Pseudocode of vein-driven leaf mesh deformation. The keywords and function names are in bold in pseudocode.
Agronomy 12 00414 g006
Where the mesh is the template leaf’s mesh, V and W are arrays of vein control points for establishing corresponding relationships between the template leaf and target leaf, respectively, P, Q, and O are the arrays of moving control points, fixed control points, and all vertices of the mesh, respectively, n is the number of control points, and iter is the maximum number of iterations in a single ARAP deformation process.

3.5. 3D Modelling of the Wheat Leaf Group

The 3D modelling of the wheat leaf group mainly used the leaf mesh deformation method based on ARAP. The cylinder, which simulated the stem by corresponding to its thickness and height, was generated according to the 3D digital data of coordinate points. Finally, the mesh was painted with different colors to reflect the different wheat organs. Using the 3D model, the phenotypic parameters such as leaf length, leaf width, leaf area, leaf size ratio, maximum leaf width position, leaf sag, leaf bending, and leaf twisting of wheat could be calculated.

3.6. Accuracy of the 3D Model

The accuracy of the 3D model in predicting the leaf-related parameters was evaluated using the root mean square error (RMSE) and R-squared (R2).
(1)
RMSE is the square root of the average error between the actual and predicted values (Equation (4)).
R M S E = i = 1 n ( a c t u a l i p r e d i c t e d i ) 2 n
(2)
R2 is the model fitting degree between the actual and the predicted values (Equation (5)) and ranges between 0–1.
R 2 = i = 1 n ( p r e d i c t e d i M e a n ) 2 i = 1 n ( a c t u a l i M e a n ) 2
where Mean is the mean value of the actual value (Equation (6)).
M e a n = i = 1 n a c t u a l i n

4. Results

4.1. Statistical Analysis of Morphological Leaf Features

The numerical distribution of the morphological leaf parameters, including leaf size ratio, maximum leaf width position, leaf sag, leaf bending, and leaf twisting, were statistically analyzed at different leaf positions based on the obtained data from the 2775 wheat leaves (Figure 7). The leaf sag, bending, and twisting within 0–0.9 with each increase of 0.1 step size are shown in Figure 8 (from left to right). The ordering results showed that the leaf sag increased in the clockwise direction, the leaf bending decreased in the clockwise direction, and the leaf twisting increased in the ordinate direction.
The association analysis was conducted based on the distribution of the morphological leaf features at the different leaf positions and the leaf clustering results of the five parameters (Table 3). The following results were found:
(1)
The morphological leaf parameters had different effects on the wheat leaf’s shape. The leaf size ratio and maximum leaf width position had an insignificant effect on the clustering results of each leaf location, consistent with the clustering results of leaf sag, leaf bending, and leaf twisting.
(2)
The morphological leaf parameters were related. (1) For instance, leaf bending was highest when leaf sag was between 0.4 and 0.6 and decreased to both ends. (2) Leaf twisting increased with increasing leaf bending. (3) The clustering results of the middle leaves showed similar leaf sag categories, except for the fifth category. Leaf bending was similar in each of the two similar categories. However, leaf twisting was smaller in one category and larger in another category. These results indicate that leaf twisting is not directly correlated with leaf sag. In contrast, leaf twisting was related to the features of cultivars.
(3)
The morphological leaf features were significantly different at the various leaf positions. (1) The leaf size ratio of the flag and middle leaves was about 0.18 and 0.08, respectively, indicating that the middle and first leaves were more slender than the flag leaf. (2) The maximum leaf width position was similar at the various leaf positions. The maximum leaf width appeared from 3/7 to 1/2 of the leaf length from the leaf birth point. The maximum leaf width position of the flag leaf and some cultivars with larger leaf widths moved towards the direction of the leaf birth point. (3) The leaf sag of the flag leaf was mainly distributed in two into maximum and minimum based on the characteristics of either the upright or drooping habit of the different cultivars. The middle leaves had different degrees of distribution in each interval. The first leaf was drooping and mainly distributed at about 0.8. Only a few cultivars with upright leaves had lower leaf sag. (4) The flag and first leaves were mostly upright or drooping, indicating minimal leaf bending mainly below 0.1. The morphology of the middle leaves was diversified and distributed in each interval above 0.1. (5) The leaf twisting was similar in each interval based on the features of the cultivars. Specifically, the leaf twisting of the flag leaf was mainly below 0.5 and the leaf twisting of the middle leaves and first leaf were above 0.5.

4.2. Individual Leaf Mesh Deformation Results

The deformation process of six typical leaves, which were selected based on the leaves’ morphological features in order to evaluate the effect of vein-driven leaf mesh deformation, is shown in Figure 9. The deformation process included the input target vein and its matched template leaf (Figure 9a), and the comparison result of the deformation with only one leaf tip point as the control point (Figure 9b), as well as the results of 5 iterations (Figure 9c), 10 iterations (Figure 9d), and the final results of the deformation with all of the control points of the leaf veins (Figure 9e). The results showed that the mesh deformation that used all of the control points was closer to the shape of the target leaf than that which used only one control point of the leaf tip. Moreover, the local characteristics of the leaves could be maintained by deforming one control point on the veins at a time.

4.3. 3D Modelling Results of Wheat Leaf Group

4.3.1. Visualization Results

The 3D modelling method was evaluated using six wheat cultivars, including Zhengmai 618 (ZM618), Jimai 106 (JM106), Xinong 979 (XN979), Jimai 44 (JM44), Zhongxinmai 09 (ZXM09), and Huacheng 3366 (HC3366), with typical plant and leaf shape differences. The wheat modelling was conducted using the information regarding stems and veins that was extracted from the obtained 3D digitizing data of the whole plant as the input and leaf template database. The 3D modelling results of the wheat plants at the filling stage (excluding the wheat ears; mainly the plant leaves) and the comparison with the corresponding 3D digital original data of the plant are shown in Figure 10. The visualization results showed that the 3D model of the wheat plant that was obtained by using this method was similar to the original 3D digitizing data in terms of the plant type and leaf shape. Meanwhile, the modelled leaves were smoother and could reflect the leaf drooping and bending characteristics of various cultivars. The 3D modelling of wheat can intuitively solve the severe occlusion of wheat leaves and reflect the characteristics of the plant types, leaf shapes, and cultivar differences of wheat.

4.3.2. Precision Analysis of 3D Modelling Results

The leaf length, width, and area of all of the leaves of the six wheat cultivars were extracted based on the measured 3D digitizing data and modelling leaves in order to evaluate the modelling accuracy of this method (Figure 11). The length, width, and area of the modelled leaves were similar to the parameters from the measured data (R2 0.96, 0.99, and 0.97, respectively, and RMSE 0.70 cm, 0.04 cm, and 0.99 cm2, respectively).
The leaf size ratio, maximum leaf width position, leaf sag, leaf bending, and leaf twisting of the modelled leaves were calculated in order to further evaluate the retention degree between the wheat leaf modelling results and the morphological leaf features of each cultivar (Table 4). The R2 of the five parameters was 0.97, 0.91, 1, 0.98, and 0.97, respectively, and RMSE was 0.01, 0.01, 0.02, 0.02, and 0.03, respectively. This method scaled the template leaf based on the target leaf’s length and width, thus minimizing the error of the leaf size ratio since it maintains the leaf length to width ratio during the deformation process. However, the maximum leaf width position error was relatively large because of the slight difference in the maximum leaf widths among the cultivars. Meanwhile, the leaf modelling results had a good fit to the measured data because vein-driven mesh deformation is at the core of this method, thus minimizing the error of leaf sag and bend. The error of leaf twisting was larger than that of leaf sag and bend due to the large degree of freedom of leaf twisting. However, the overall error still had a good performance.
The offset distance between the point cloud positions of the modelling results that were based on this method and the coordinate points corresponding to the original 3D digitizing data was calculated in order to verify the similarity between the modelled leaves and the original plant. The box plot of the offset distance is shown in Figure 12, while the quartiles and variances of the offset distance are shown in Table 5. The average variance of the offset distance of the coordinate points was 0.336 cm2, indicating that the 3D model of this method had a good consistency with the measured data in the 3D space.

4.3.3. Time Efficiency Analysis of Wheat Leaf 3D Modelling

Finally, the total number of iterations and the modelling time of a single wheat plant during leaf group deformation were calculated in order to evaluate the efficiency of this method (Table 6). The modelling time of the wheat plant leaf group was within 1.5–2.5 s at the filling stage. Moreover, the time efficiency of obtaining the complete 3D digitizing data of the wheat plants via a 3D digitizer and the 3D modelling of the wheat plants using this method were compared. The accuracy of this method and the 3D digitizer was similar. However, the content of the data acquisition was simplified, which only needed the data points of the plant’s veins, thus reducing the time of the data acquisition process. The data acquisition process of this method improved by 80% in time, while the overall process of the data acquisition and 3D modelling improved by 79.9% in time (Table 7). The above modelling process was conducted using the Windows 10 operating system, using the following computer configuration: Intel(R) Core(TM) i7-10700 CPU @ 2.90GHz, 16G RAM.

4.4. Phenotypic Analysis of Wheat Leaf Group

The 3D model of the wheat leaf group that was obtained using this method was further used to calculate the phenotypic parameters of leaf morphology. Besides the above leaf length, width, area, leaf sag, leaf bending, and leaf twisting, the spatial distribution of the leaf area was also studied. The stratified leaf area distributions were calculated from the vertical and the horizontal cylinder directions in order to extensively describe the wheat plant type. The side and top views of the six cultivars and the calculated vertical and horizontal leaf area distributions are shown in Figure 13.
XN979 and JM106 had the largest total leaf area, while ZM618 had the smallest total leaf area. The leaf area distribution was normal in the vertical direction, with the middle of the plant being the largest. Specifically, the leaf area of JM106 and XN979 were widely distributed from 15–30 cm in height, followed by JM44 and HC3366. The leaf area of ZM618 and ZXM09 were widely distributed from 30–45 cm in height. The leaf area distribution of JM106 extended to the cylinder with a radius of 30 cm in the horizontal direction. The leaf area of HC3366 was distributed in the cylinder with a radius of 25 cm. The leaves JM106 and HC3366 significantly extended outwards in the horizontal direction because the leaf sag of the middle leaves occurred in the middle. The leaf area of the remaining four cultivars was distributed within the cylinder radius of 20 cm, consistent with the characteristics of relatively flat and raised leaves or large leaf sag of the four cultivars. Moreover, the leaf area of the wheat with loose plant type (ZM618) was less distributed in the middle of the horizontal direction and normally distributed on both sides. However, the leaf area of wheat plants with compact plant types (JM44 and HC3366) slightly tilted on one side.

5. Discussion

The skeleton-driven 3D modelling method has the following advantages: (1) the 3D modelling methods of wheat plants [7,9,
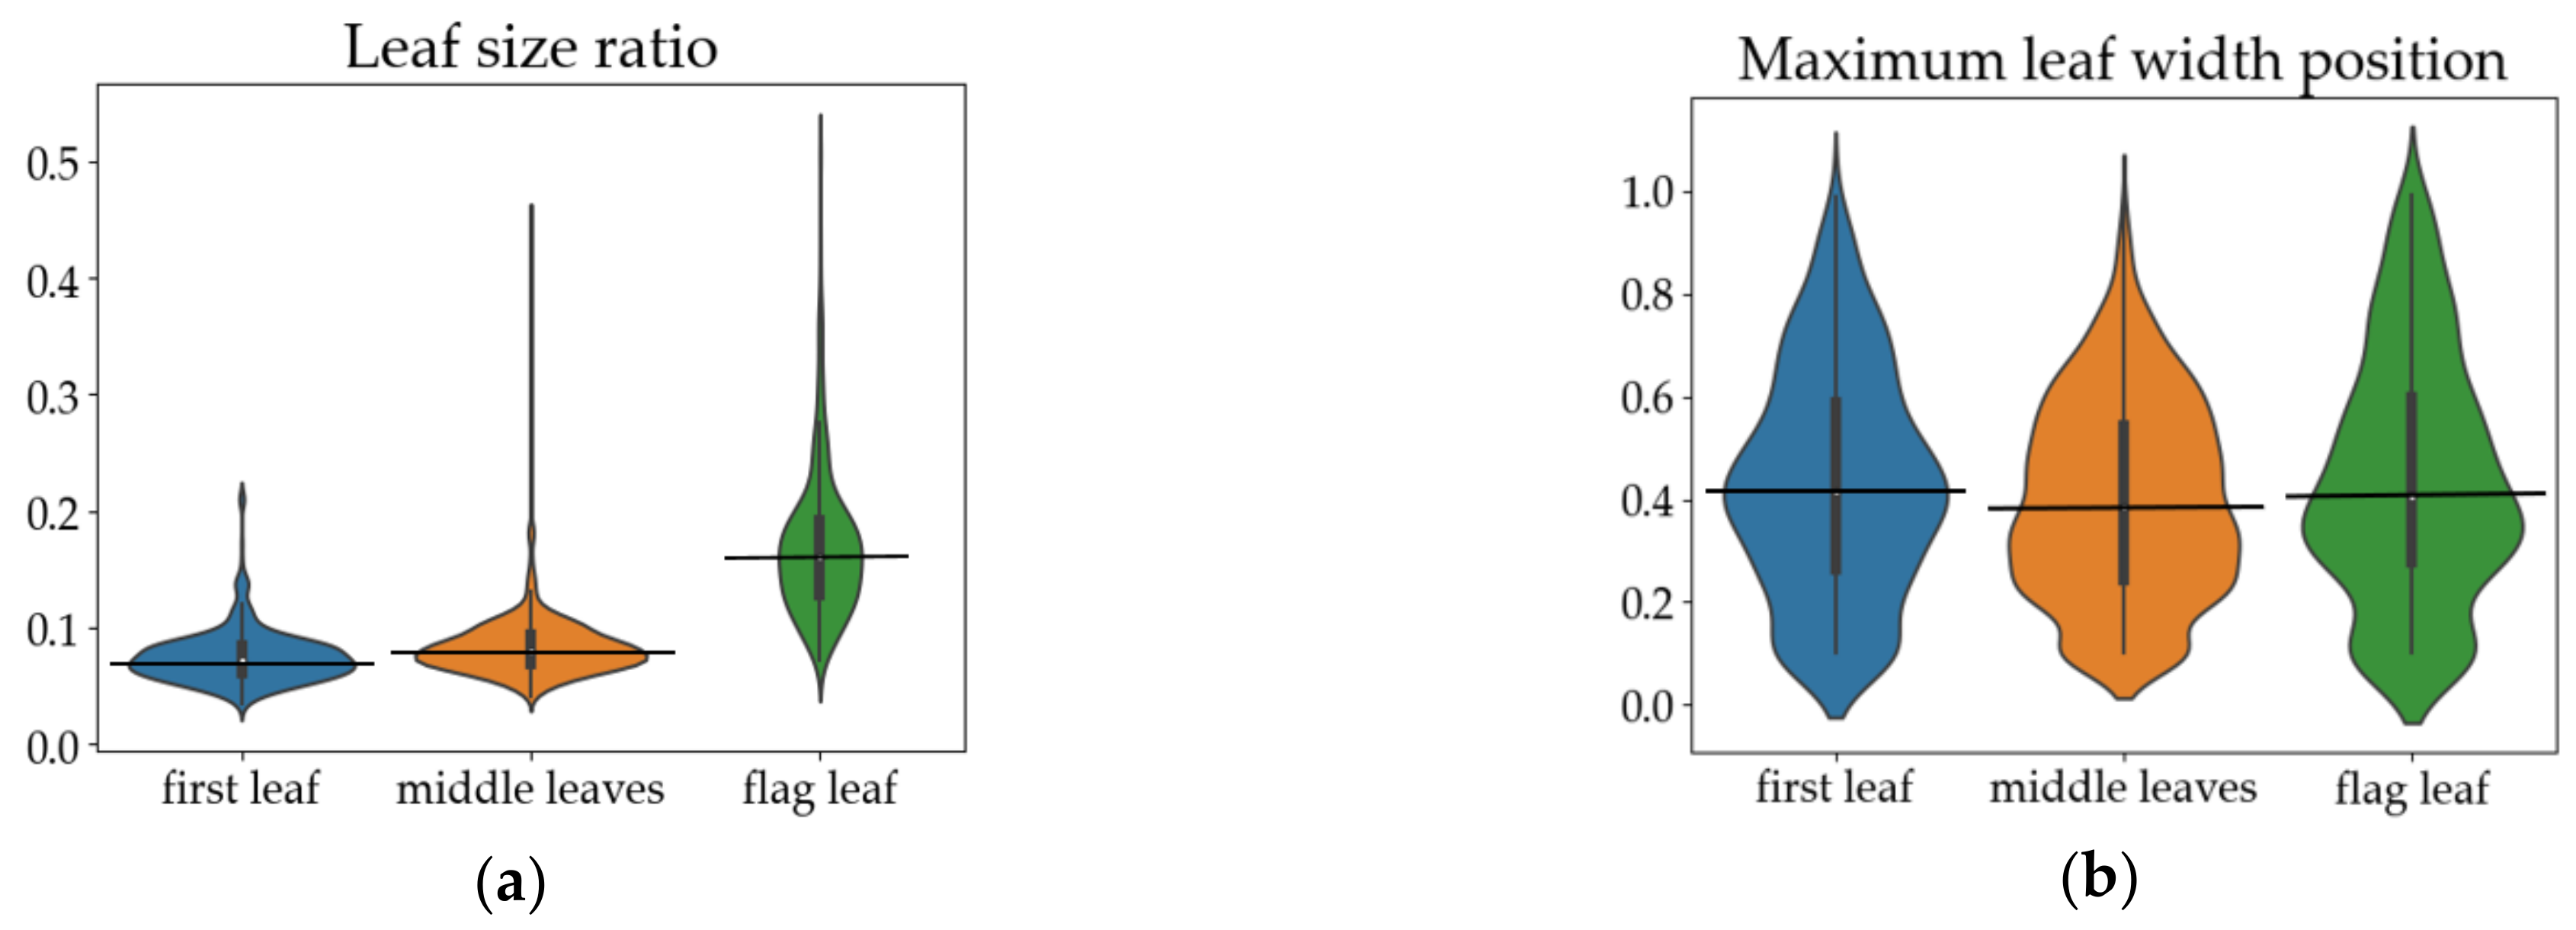
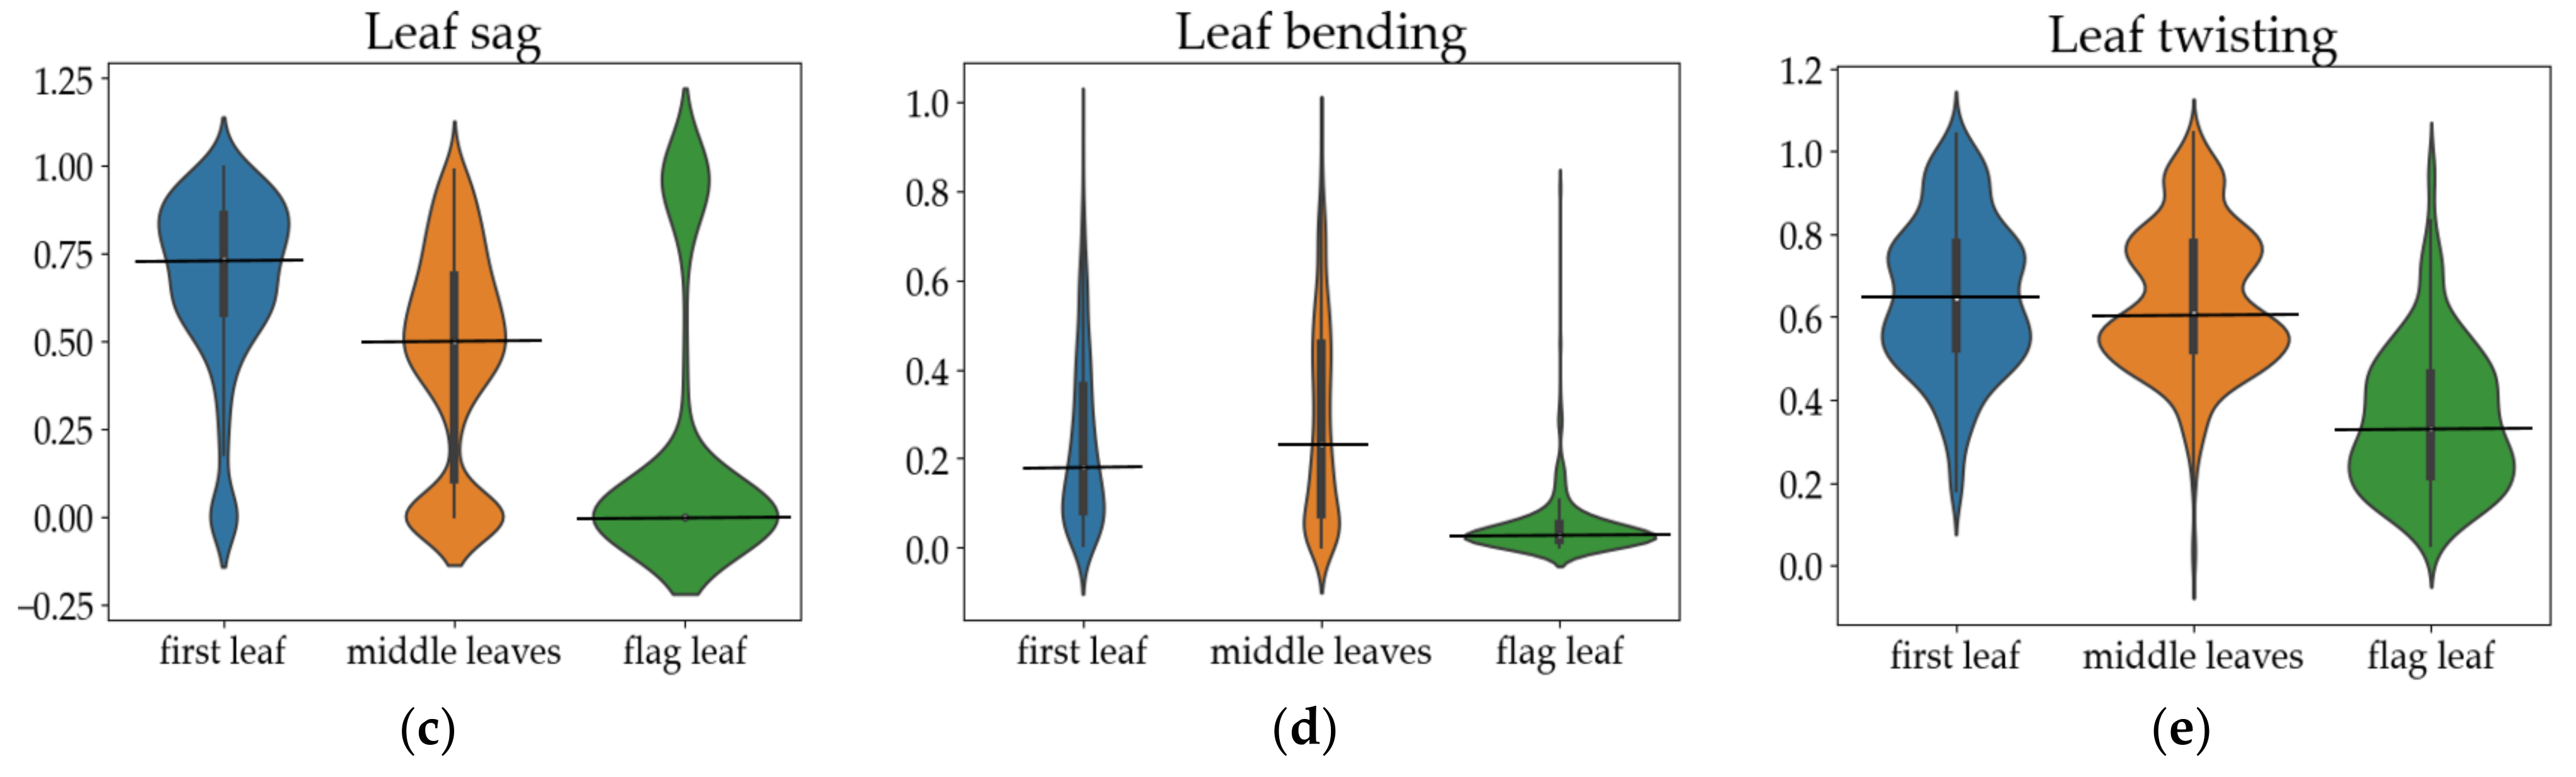
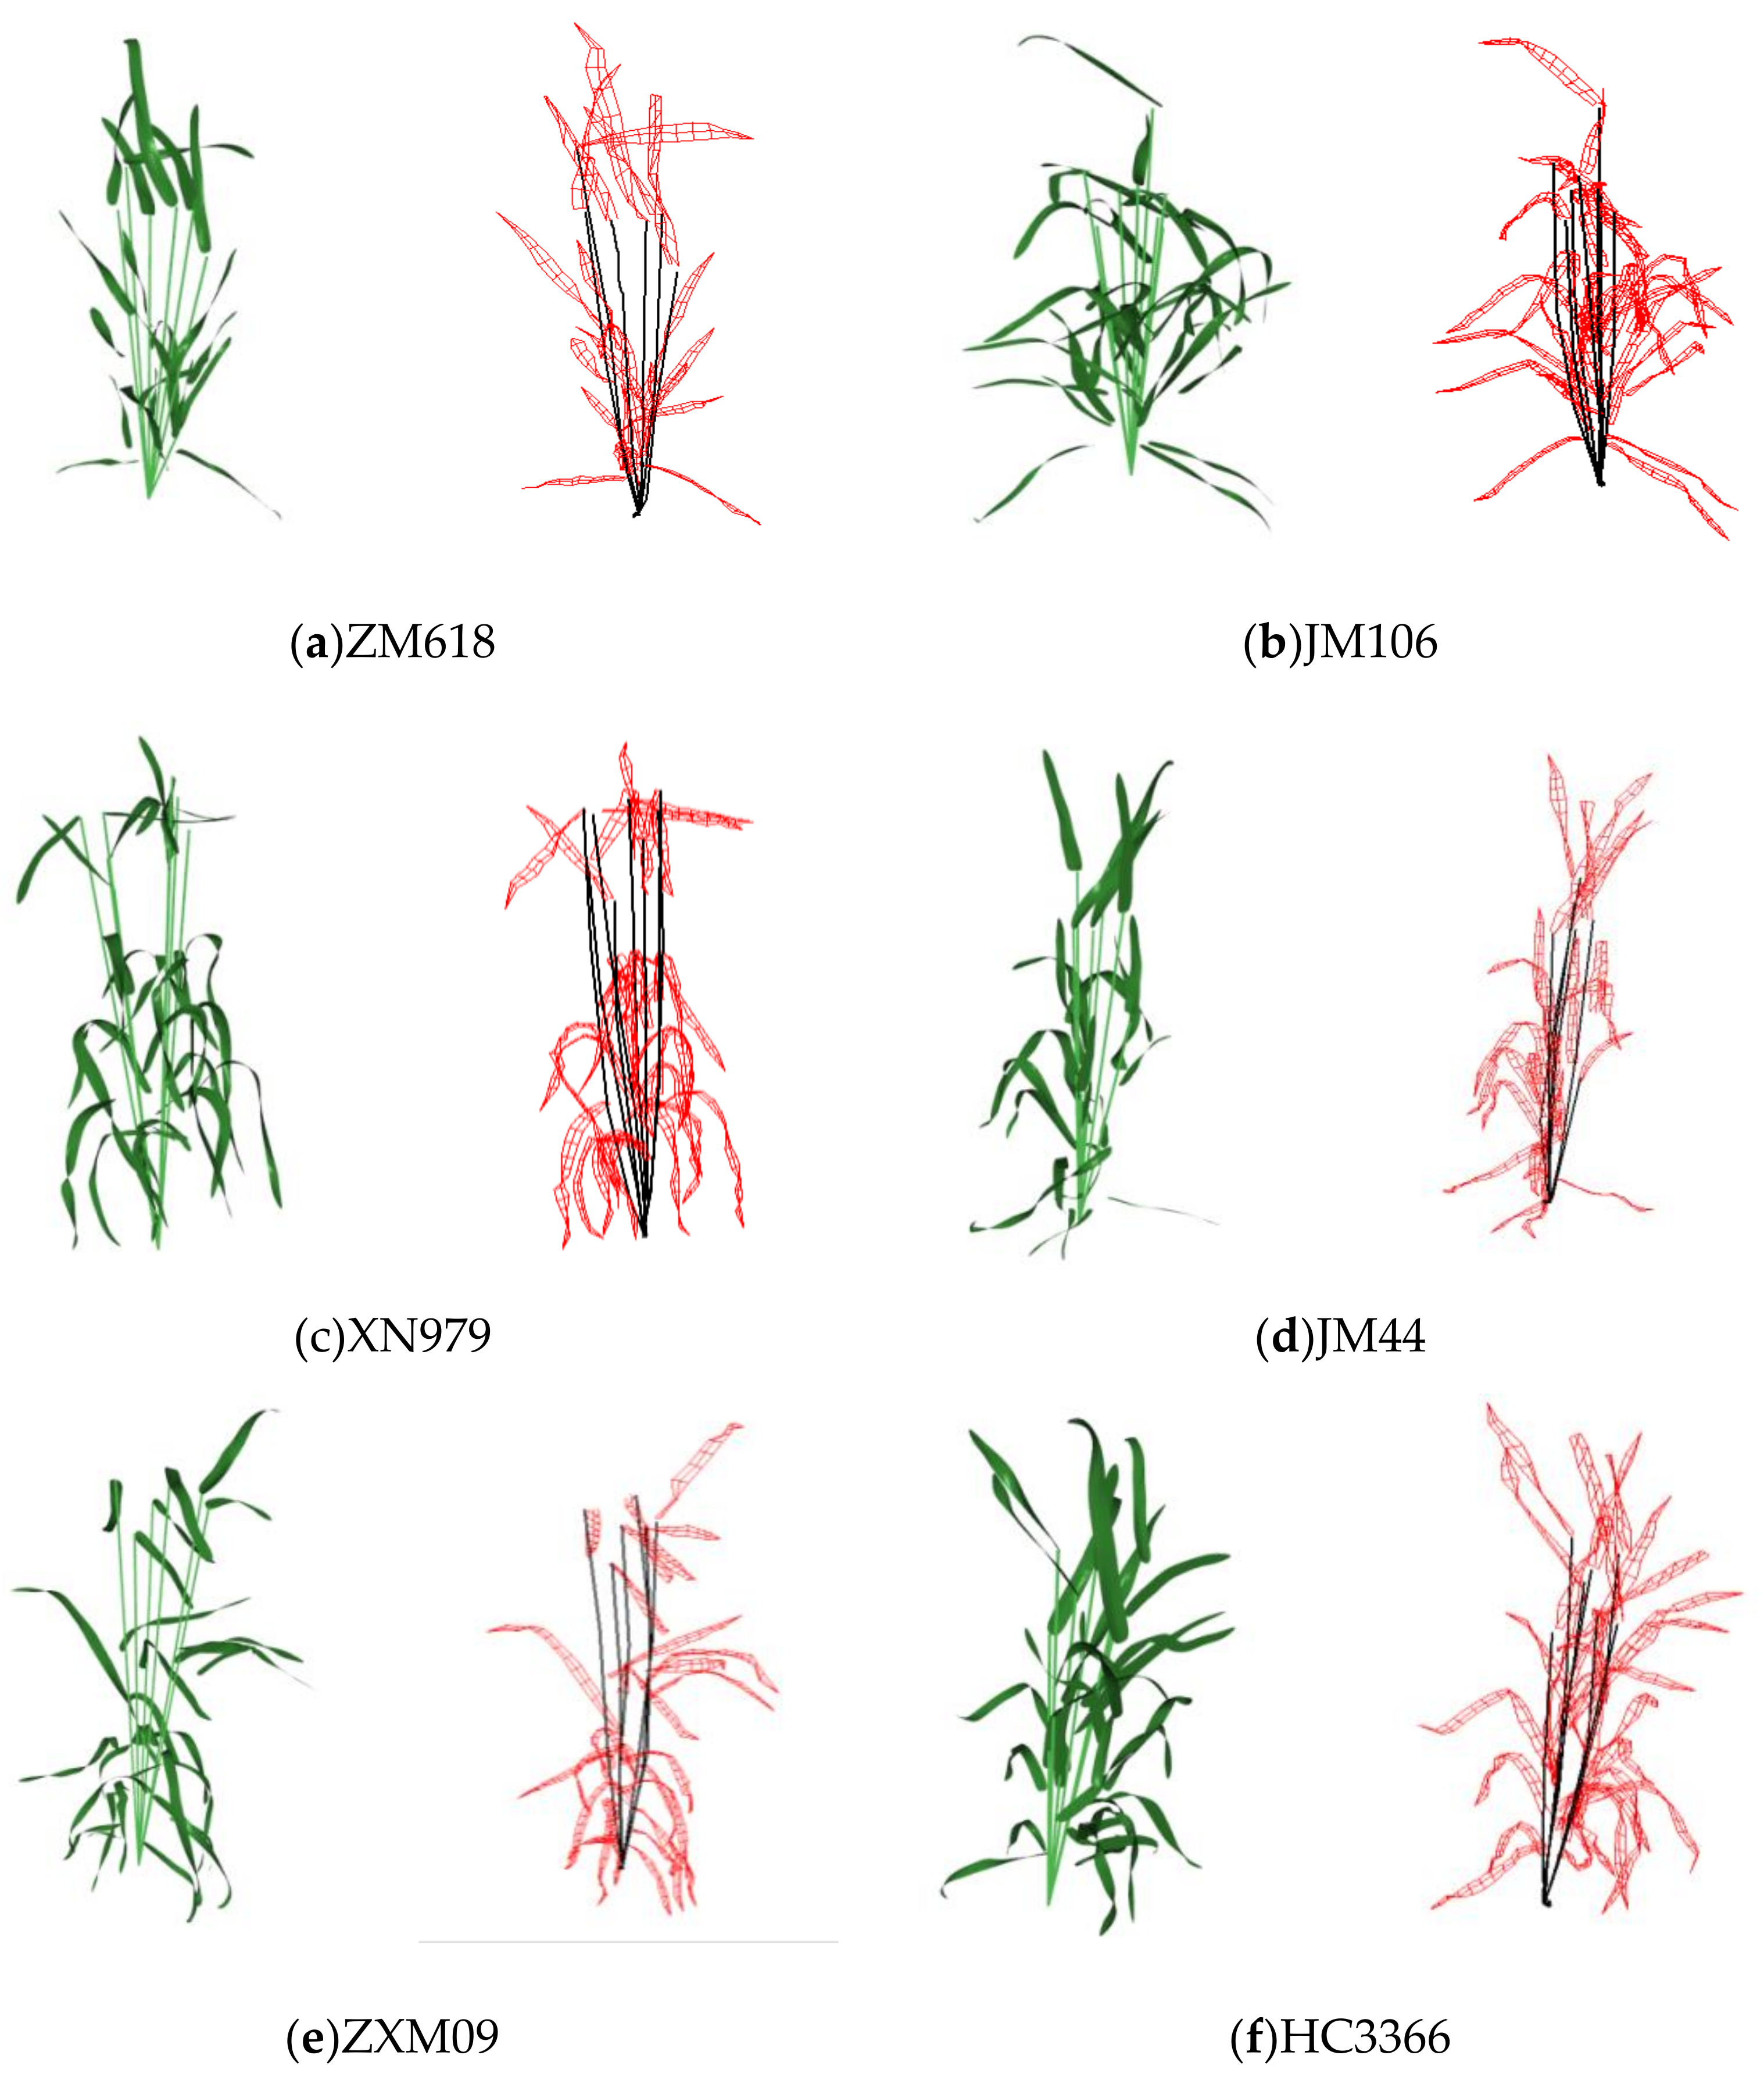
10] that are used to analyze function–structure mostly have significant differences in plant type, ignoring the differences in 3D leaf shape, especially leaf twisting. Herein, five parameters were systematically used to characterize the 3D morphological leaf features of wheat in order to describe the genetic characteristics of wheat leaf shapes. The constructed 3D models of the wheat leaves and leaf groups could reflect the 3D morphological leaf features of the different cultivars, with good consistency with the leaf size ratio, maximum leaf width position, leaf sag, leaf bending, and leaf twisting from the measured data of the corresponding plant leaf group (Table 4). The leaf tilt degree (especially that of the flag leaf) of the wheat plants at the filling stage directly affects their photosynthesis, thus affecting the plants’ yield [
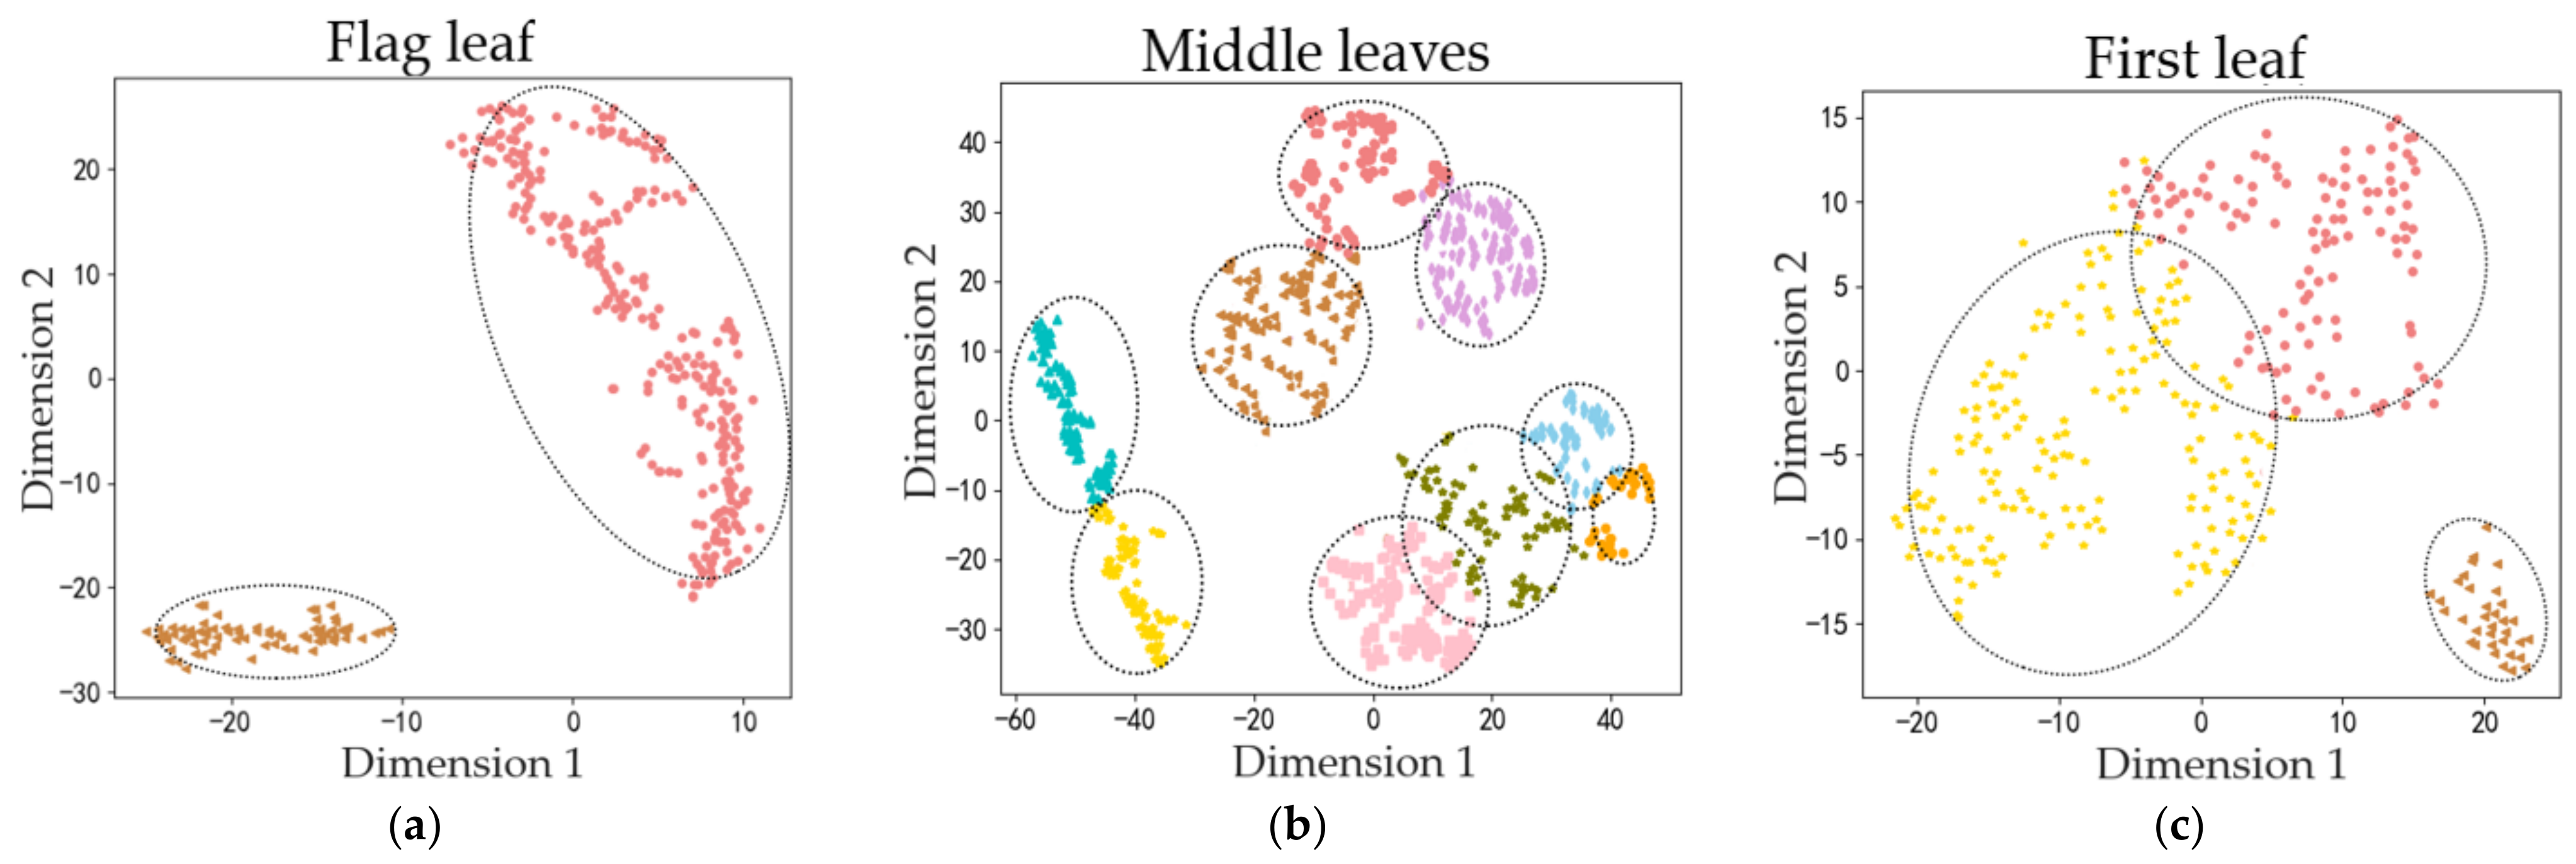
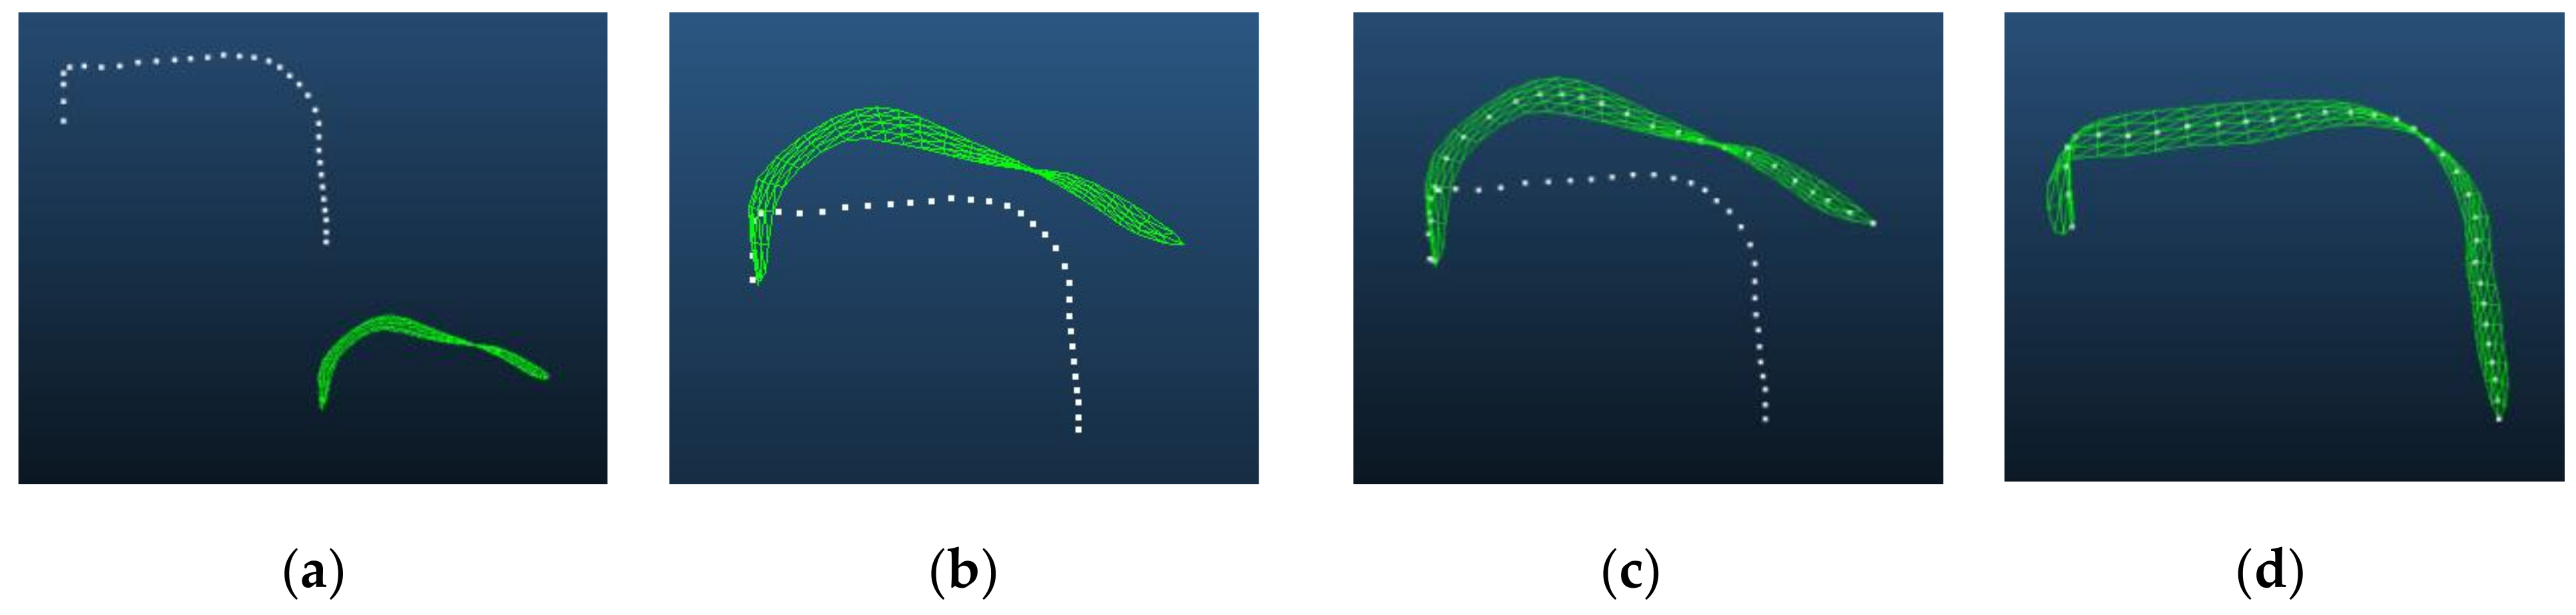
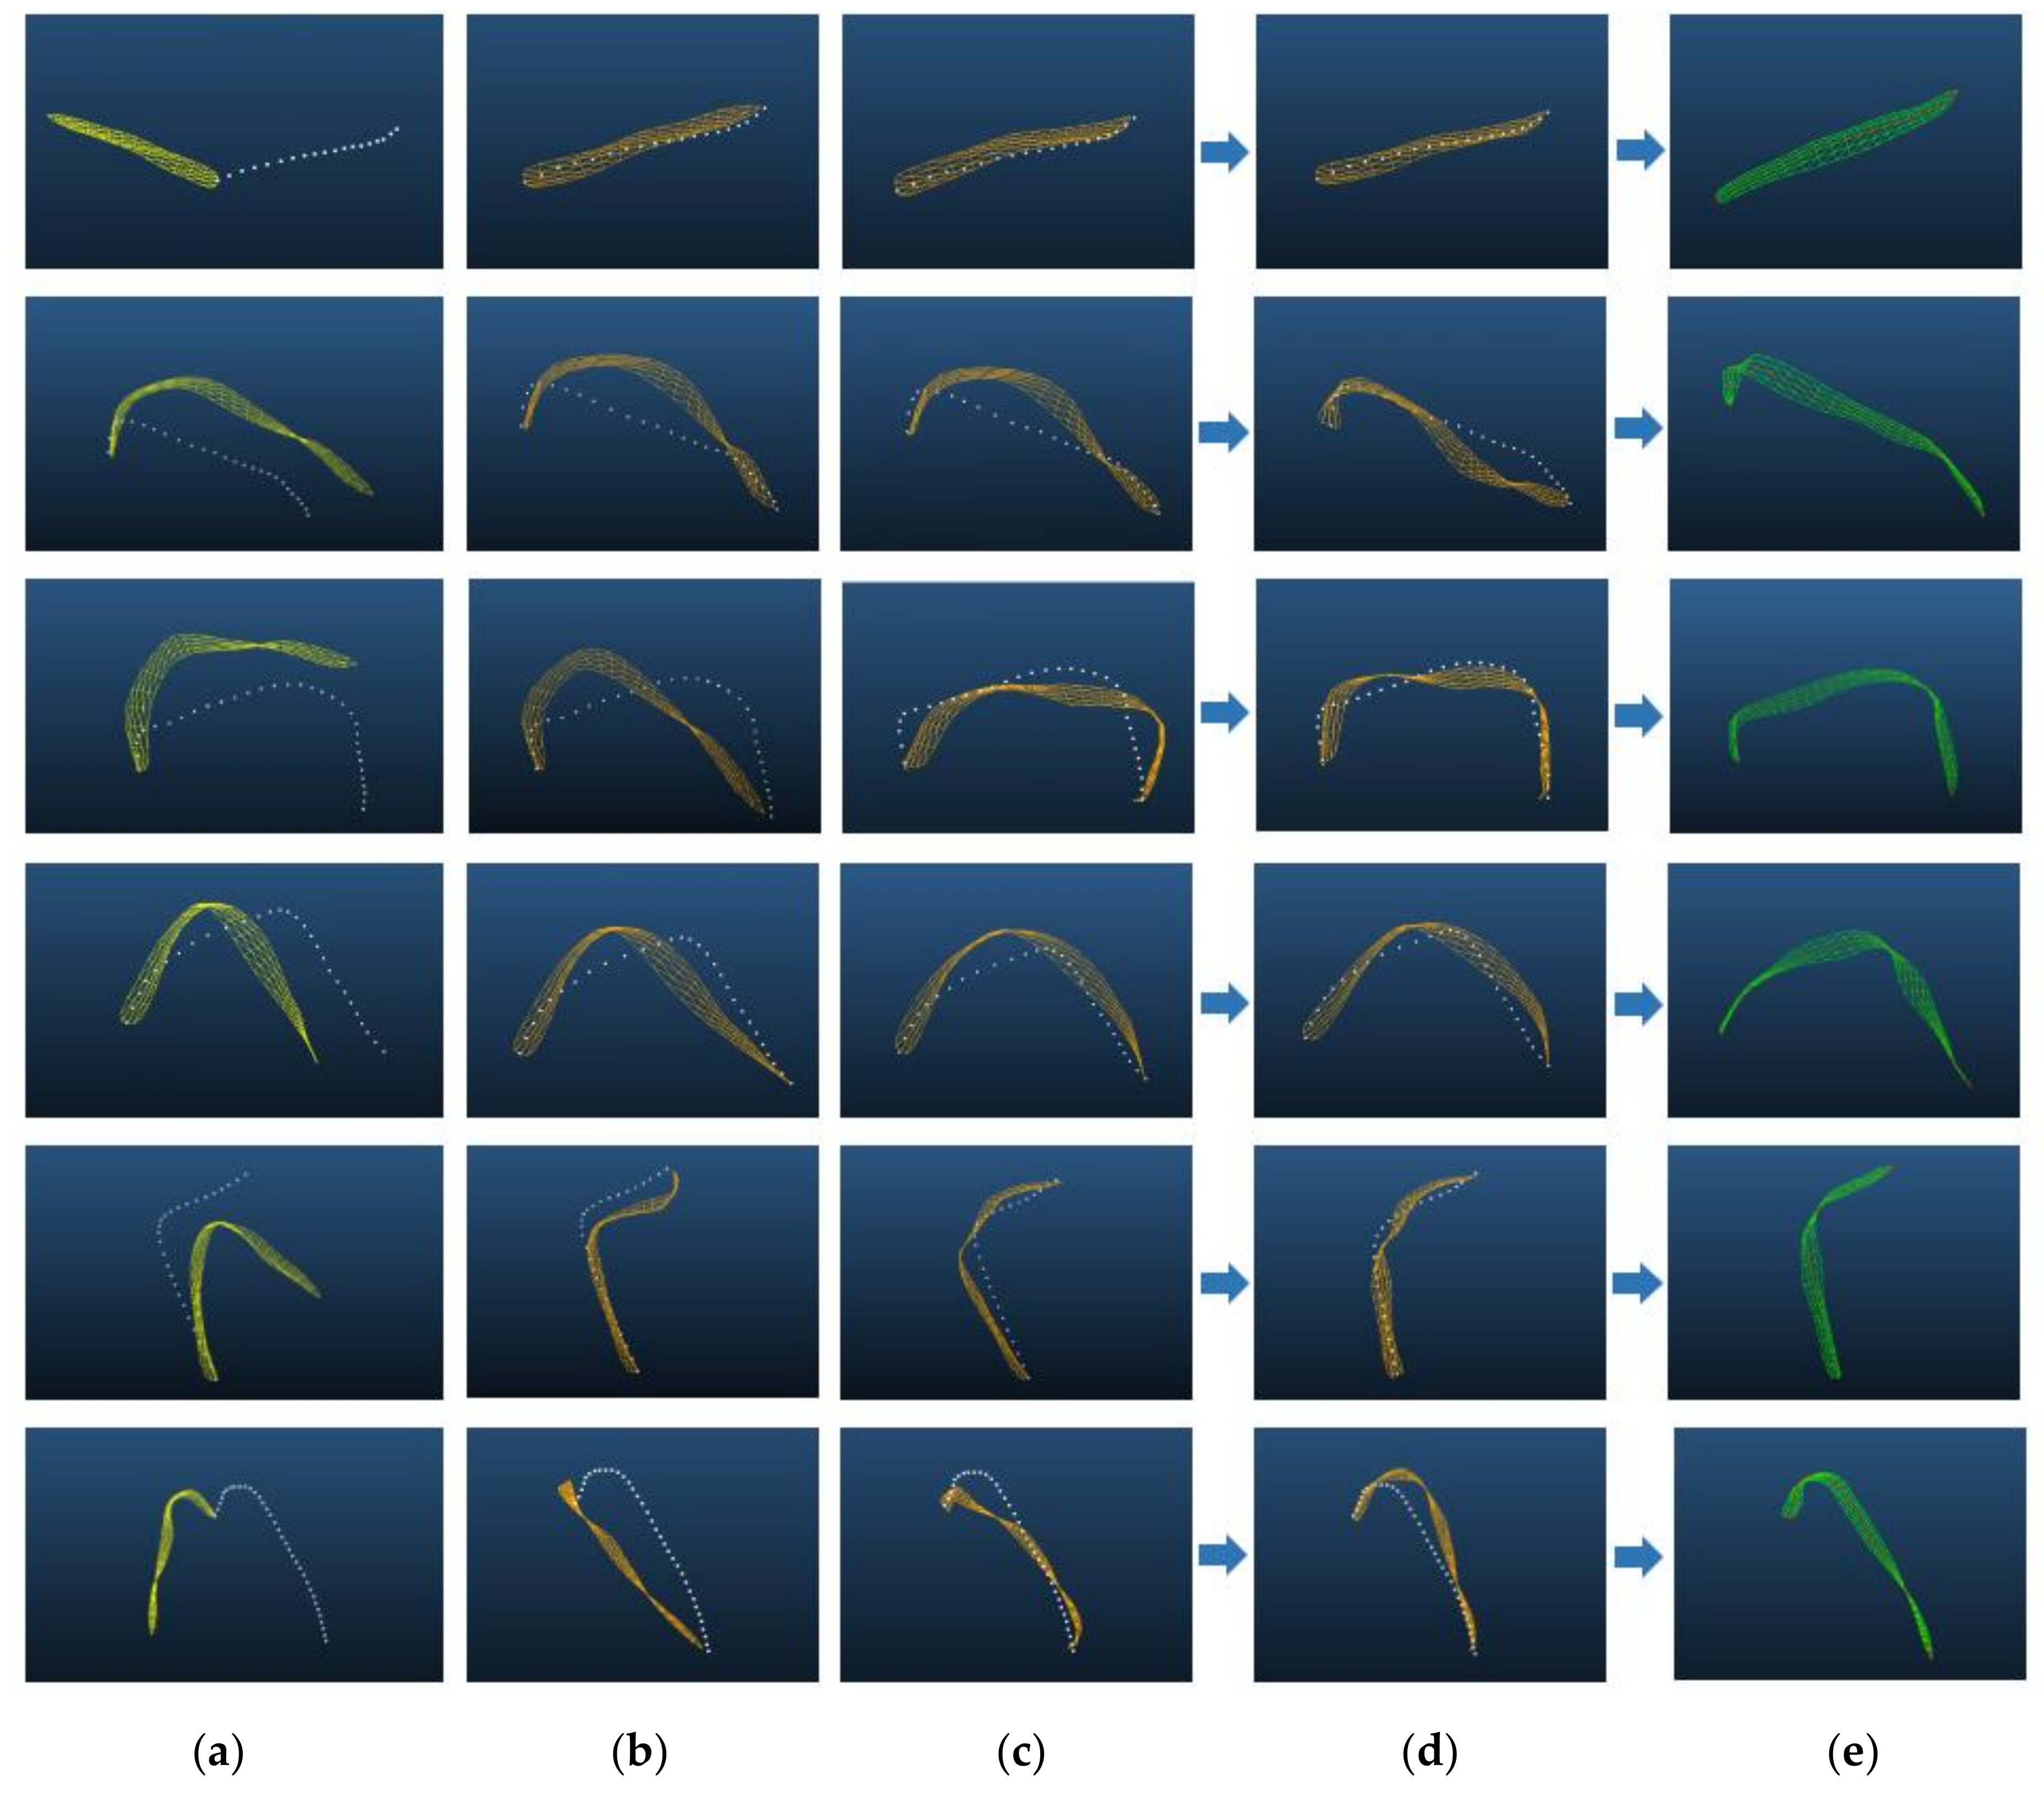
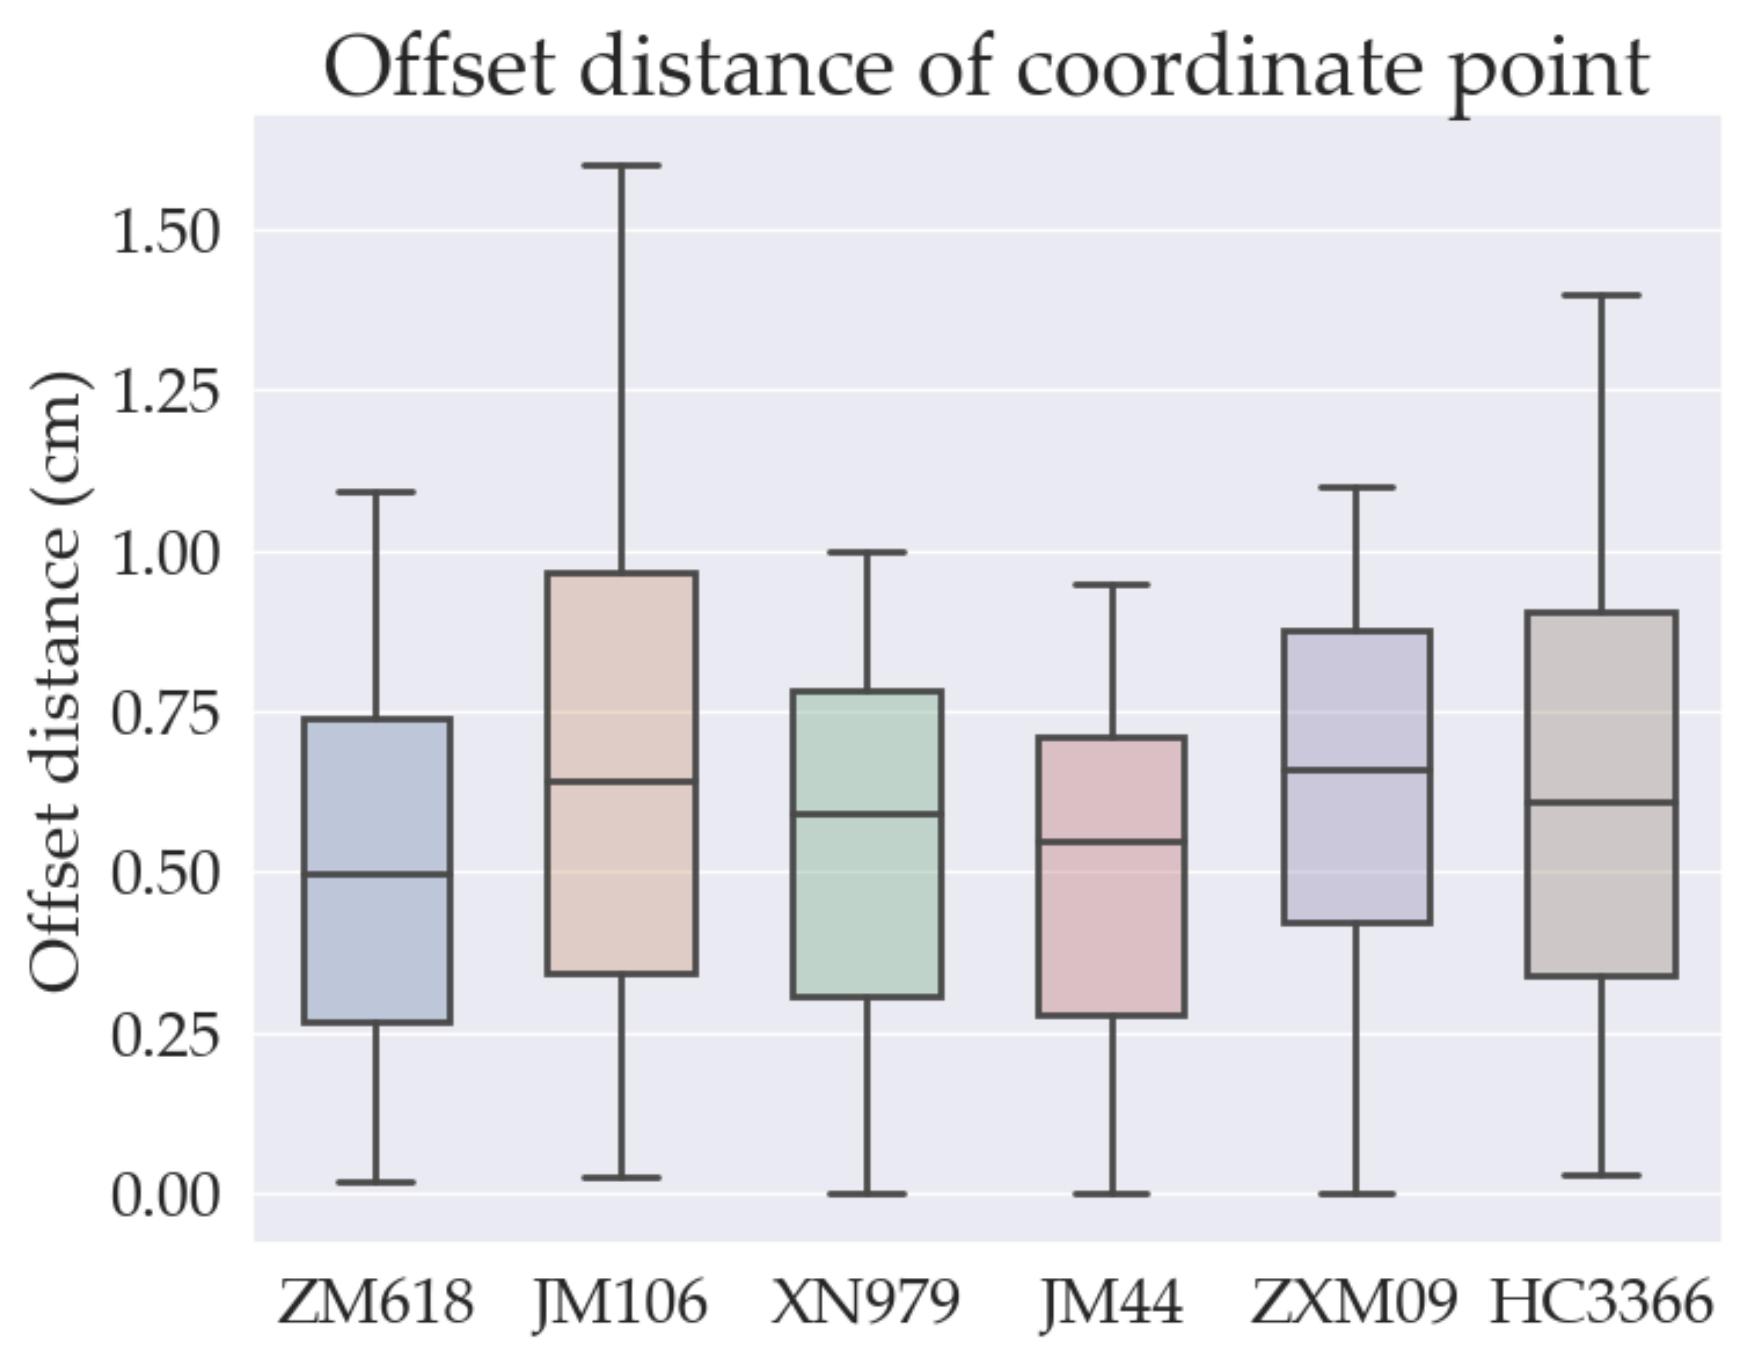
10]. This method could effectively reflect the morphological leaf features, such as those of the flag leaf, middle leaves, and first leaf of wheat, thus improving the resolution of computational research based on a 3D visualization model. (2) The existing technology that is used to achieve the 3D modelling of plants through surface deformation mainly ensures the smoothness and uniformity of global deformation. Therefore, it is difficult to retain the original details of the leaves during the deformation. Previous studies [
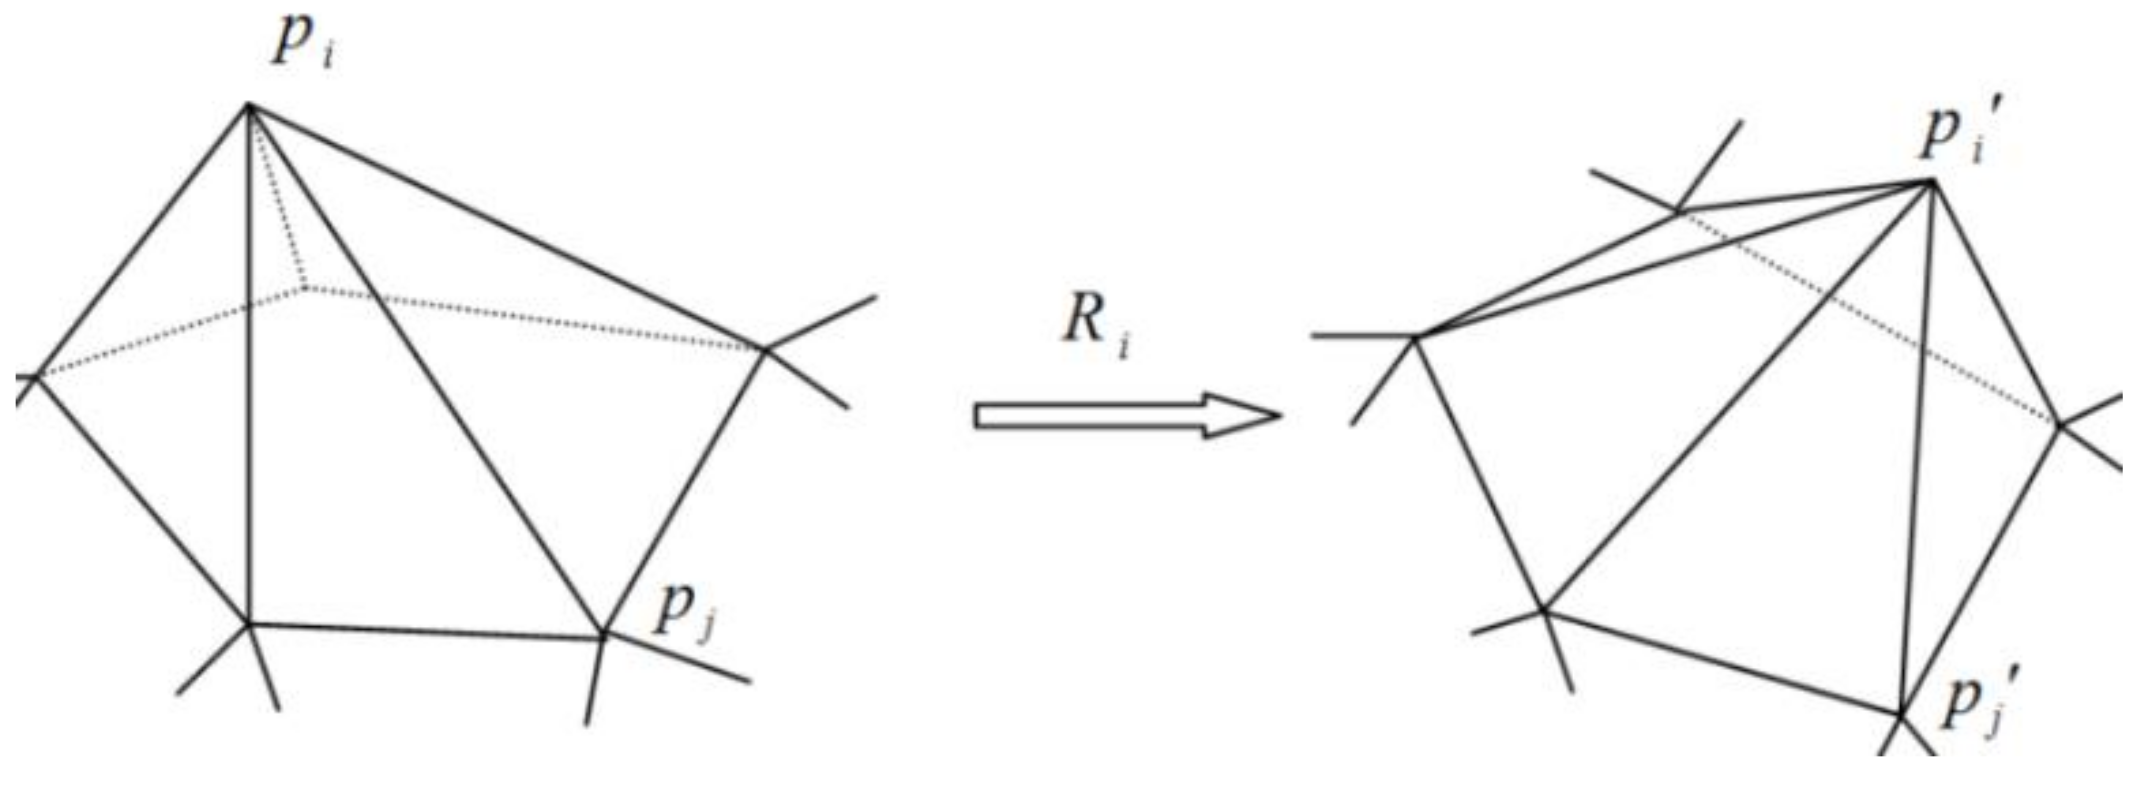
14] have shown that several control points are required in the deformation process (especially, several cross-section control points are required to achieve foliation distortion). As a result, it is difficult to retain the local details. Besides realizing the real reduction of the wheat veins in 3D space, this method can also maintain the local details of the wheat leaf’s surface. The average variance of the offset distance of the coordinate points before and after deformation was 0.336 cm2 (Table 5), indicating a good level of 3D modelling accuracy. (3) Studies have shown that 3D digitizing can effectively obtain and quantify the skeleton information of multi-tiller crops [
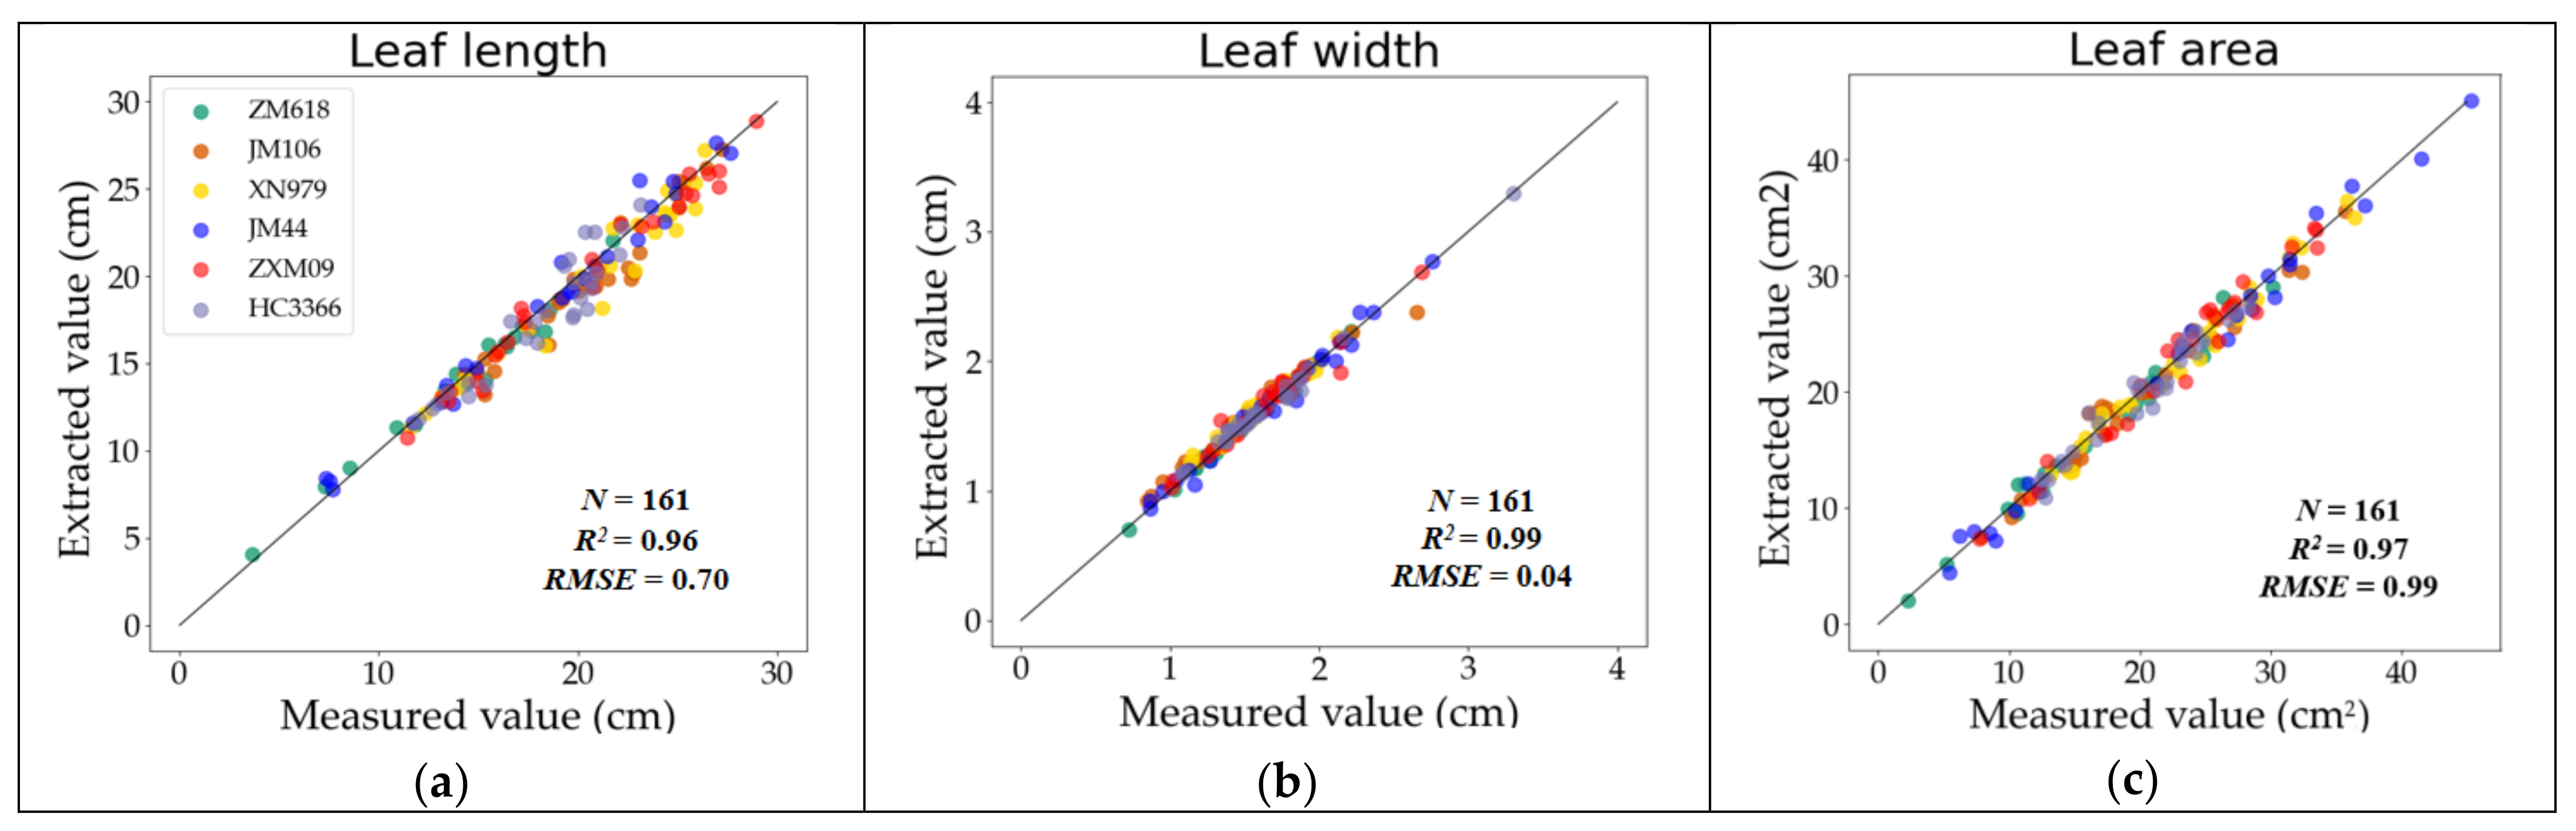
25]. Herein, a 3D digitizer was used to accurately obtain the 3D information of the stem and leaf veins of wheat plants, thus solving the cross-occlusion problem between wheat plant organs. Morphological leaf features and the mesh deformation method were used to construct skeleton data for the mesh model. The three phenotypic parameters (leaf length, width, and area) that were extracted from the reconstructed 3D model of the wheat plant leaf group matched the measured data (Figure 11).
However, this method has some disadvantages. (1) 3D modelling of wheat ears was not conducted due to the complex morphological structure of the wheat ears. Meanwhile, the reconstructed stem was directly generated as a cylinder. Compared with the reconstructed leaves, the realism of the result should be improved. (2) This method relied on leaf vein data. A small amount of typical complete 3D digitizing data of leaves for each cultivar is needed in order to build the cultivar characteristic database. The method relies on earlier data acquisition. The reconstruction speed using this method was improved by 79.9% compared with obtaining the complete 3D digitizing data of wheat plants one at a time (Table 7). However, this method takes longer for data acquisition than other data acquisition methods [21,22].
In this method, data acquisition rules, including wheat plant semantic information, were formulated and a cultivar characteristic database and template database were constructed based on morphological wheat leaf features. Moreover, leaf mesh deformation was conducted based on leaf veins. This whole process is suitable for all wheat growth stages. However, Fang et al. [18] and Duan et al. [19] showed that the method is only applicable to wheat in the early tillering stage. This method can also be used in multi-tiller rice and other crops with long and narrow leaves, such as corn and sorghum. However, it cannot be used to achieve the desired effect in fan-shaped, palm-shaped, finger-shaped, and multi-vein leaves.
In the future, the skeleton extraction method that is based on a point cloud should be used to rapidly construct the vein curve of wheat plants and generate a leaf template based on the high-resolution 3D point cloud of a single leaf. Moreover, the mesh deformation method should be used in order to reduce the time that is required during the data acquisition process, thus improving the efficiency of the method. This method can realize the construction of a high-precision 3D model of wheat and is thus suitable for the analysis of wheat plant phenotypes at the cultivar scale, calculation of wheat population light distribution, functional–structure analysis [7], ideal plant type design, and cultivation decision optimization of wheat [9]. The 3D wheat model can also be used in VR/AR for knowledge enhancement, skill training, and the display of new cultivars.

6. Conclusions

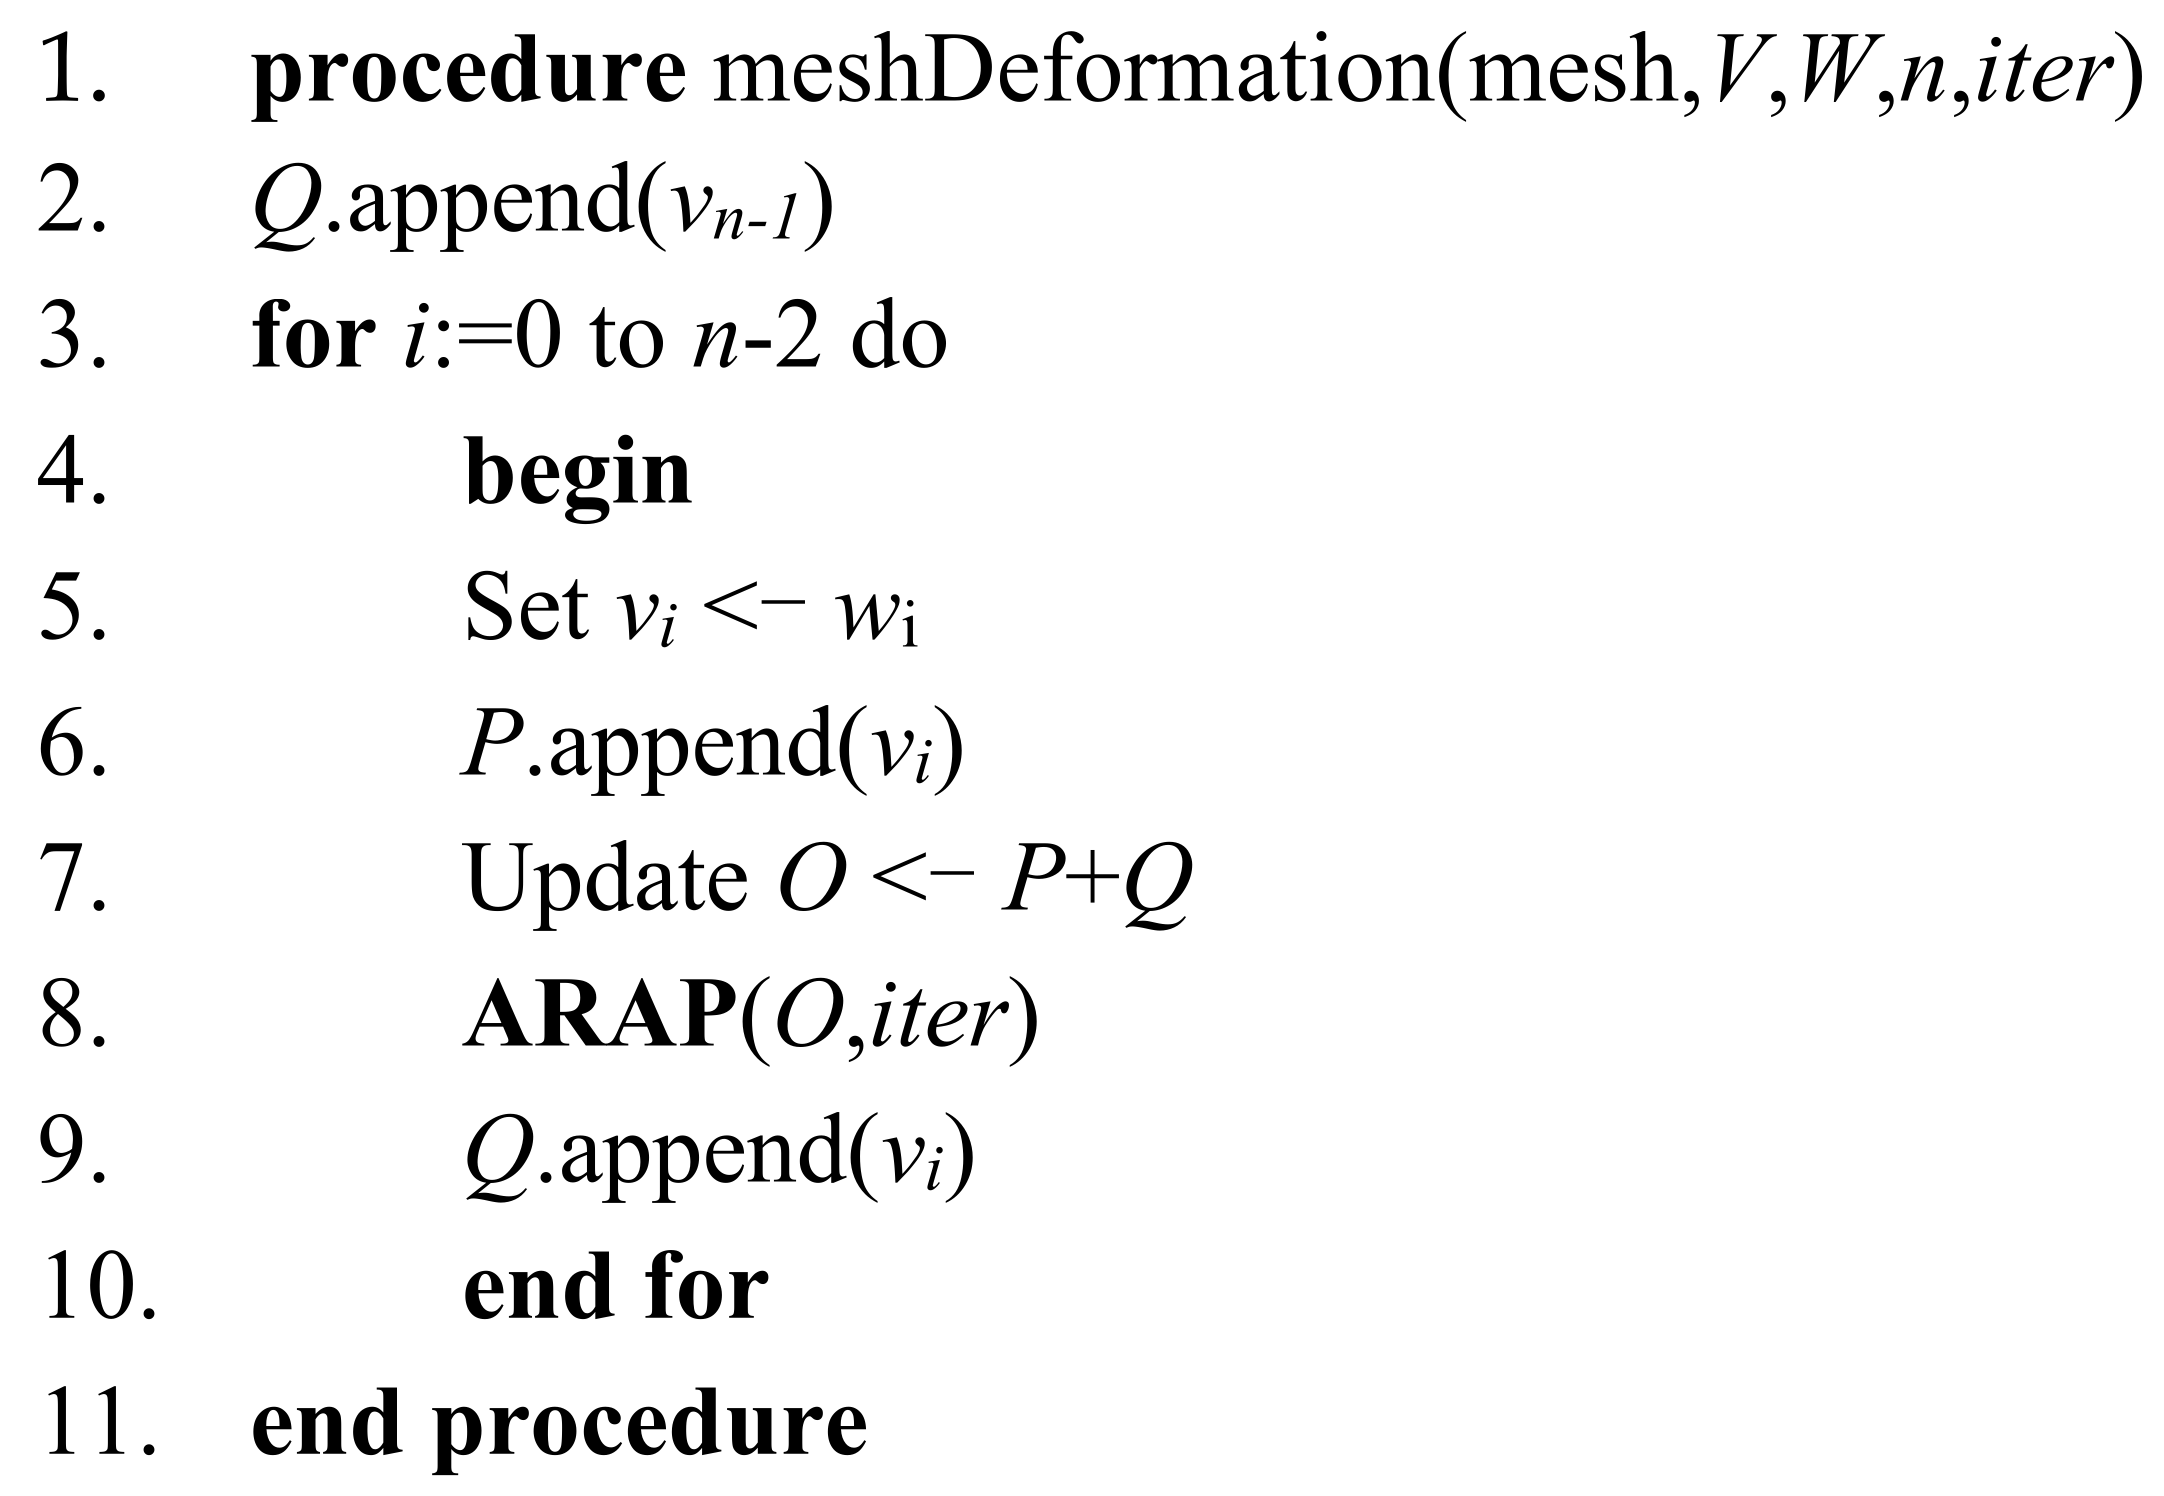
This study developed a 3D wheat modelling method for the individual leaf, leaf group, and individual plant. Five morphological parameters were defined in order to characterize the 3D leaf features. Among which, leaf sag, leaf bending, and leaf twisting were identified to be capable of describing cultivar differences for template selection in next-stage modelling. The ARAP mesh deformation method was introduced in order to model 3D leaves from skeletons and this deformation method was proven to be an effective way of 3D wheat modelling. The 3D modelling efficiency improved 79.9% with this method when compared with direct 3D digitizing data acquisition. The R2 of the extracted leaf sag, leaf bending, and leaf twisting from the constructed 3D model using the proposed method and 3D digitization data were 1.00, 0.98, and 0.97, respectively. The RMSE were 0.01, 0.02, and 0.03, respectively. The approach in the present study overrides the limitation of using leaf or plant skeleton data to construct a 3D mesh model. This approach will provide an accurate and precise 3D model for the phenotypic, structural, and functional analysis of wheat.

Author Contributions

Conceptualization, X.G. and W.W.; Data curation, C.Z. (Chenxi Zheng), W.C., X.L., Z.X., and B.C.; Funding acquisition, X.G. and C.Z. (Chunjiang Zhao); Methodology, C.Z. (Chenxi Zheng) and W.W.; Resource, Q.W. and X.L.; Software, C.Z. (Chenxi Zheng); Supervision, X.G. and C.Z. (Chunjiang Zhao); Validation, C.Z. (Chenxi Zheng); Visualization, C.Z. (Chenxi Zheng); Writing—original draft, C.Z. (Chenxi Zheng), W.W. and X.G.; Writing—review & editing, C.Z. (Chenxi Zheng), W.W. and X.G. All authors have read and agreed to the published version of the manuscript.

Funding

This research was funded by Construction of Collaborative Innovation Center of Beijing Academy of Agricultural and Forestry Sciences, grant number KJCX201917, Reform and Development Project of Beijing Academy of agricultural and Forestry Sciences.

Institutional Review Board Statement

Not applicable.

Informed Consent Statement

Not applicable.

Data Availability Statement

Not applicable.

Acknowledgments

Not applicable.

Conflicts of Interest

The authors declare no conflict of interest.

References

  1. Bucksch, A.; Atta-Boateng, A.; Azihou, A.F. Morphological plant modeling: Unleashing geometric and topological potential within the plant sciences. Front. Plant Sci. 2017, 8, 900. [Google Scholar] [CrossRef]
  2. Yin, K.; Huang, H.; Long, P.; Gaissinski, A.; Gong, M.; Sharf, A. Full 3D plant reconstruction via intrusive acquisition. Comput. Graph. Forum 2016, 35, 272–284. [Google Scholar] [CrossRef]
  3. Louarn, G.; Song, Y. Two decades of functional–structural plant modelling: Now addressing fundamental questions in systems biology and predictive ecology. Ann. Bot. 2020, 126, 501–509. [Google Scholar] [CrossRef]
  4. Amy, M.C.; Long, S.P.; Allen, D.K.; Allen, G.; Yin, X. Crops in silico: Generating virtual crops using an integrative and multi-scale modeling platform. Front. Plant Sci. 2017, 8, 786. [Google Scholar] [CrossRef]
  5. Zhao, C.; Zhang, Y.; Du, J.; Guo, X.; Fan, J. Crop phenomics: Current status and perspectives. Front. Plant Sci. 2019, 10, 714. [Google Scholar] [CrossRef] [Green Version]
  6. Yang, W.; Feng, H.; Zhang, X.; Zhang, J.; Doonan, J.H.; Batchelor, W.D.; Xiong, L.; Yan, J. Crop phenomics and high-throughput phenotyping: Past decades, current challenges, and future perspectives. Mol. Plant 2020, 13, 187–214. [Google Scholar] [CrossRef] [Green Version]
  7. Liu, S.; Martre, P.; Buis, S.; Abichou, M.; Andrieu, B.; Baret, F. Estimation of plant and canopy architectural traits using the digital plant phenotyping platform. Plant Physiol. 2019, 181, 881–890. [Google Scholar] [CrossRef] [Green Version]
  8. Fournier, C.; Andrieu, B.; Ljutovac, S.; Saint-Jean, S. ADEL-Wheat: A 3D Architectural Model of Wheat Development; Plant Growth Modeling and Applications: Berlin, Germany, 2003; pp. 54–63. [Google Scholar]
  9. Barillot, R.; Gutierrez, A.E.; Fournier, C.; Huynh, P.; Combes, D. Assessing the effects of architectural variations on light partitioning within virtual wheat–pea mixtures. Ann. Bot. 2014, 114, 725–737. [Google Scholar] [CrossRef]
  10. Romain, B.; Camille, C.; Christian, F.; Comnes, D.; Pradal, C.; Andrieu, B. Investigation of complex canopies with a functional-structural plant model as exemplified by leaf inclination effect on the functioning of pure and mixed stands of wheat during grain filling. Ann. Bot. 2018, 123, 727–742. [Google Scholar] [CrossRef]
  11. Wu, S.; Wen, W.; Xiao, B.; Guo, X.; Du, J.; Wang, C.; Wang, Y. An accurate skeleton extraction approach from 3D point clouds of maize plants. Front. Plant Sci. 2019, 10, 248. [Google Scholar] [CrossRef] [Green Version]
  12. Mundermann, L.; MacMurchy, P.; Pivovarov, J.; Prusinkiewicz, P. Modeling lobed leaves. In Proceedings of the Computer Graphics International 2003, Tokyo, Japan, 9–11 July 2003; pp. 60–65. [Google Scholar]
  13. Hong, S.M.; Simpson, B.; Baranoski, G. Interactive venation-based leaf shape modeling. Comput. Animat. Virtual Worlds 2005, 16, 415–427. [Google Scholar] [CrossRef] [Green Version]
  14. Wu, Y.; Tang, L.; Cao, W.; Zhu, Y. Crop leaf deformation driven by skeleton. Comput. Eng. Appl. 2011, 47, 11–14. [Google Scholar] [CrossRef]
  15. Li, S.; Liu, H.; Zhu, Y.; Li, S.; Liu, S.; Zhang, H.; Li, Z. 3D visualization of wheat leaves using measured data and NURBS surface. Fujian J. Agric. Sci. 2016, 7, 777–782. [Google Scholar] [CrossRef]
  16. Li, S.; Chu, Y.; Liu, H.; Li, S.; Liu, D.; Zhang, H.; Li, Z. Research and realization of wheat leaf three-dimensional visualization based on NURBS surface. J. Agric. Sci. Technol. 2016, 3, 89–95. [Google Scholar] [CrossRef]
  17. Apolo-Apolo, O.E.; Pérez-Ruiz, M.; Martínez-Guanter, J.; Egea, G. A mixed data-based deep neural network to estimate leaf area index in wheat breeding trials. Agronomy 2020, 10, 175. [Google Scholar] [CrossRef] [Green Version]
  18. Fang, W.; Feng, H.; Yang, W.; Duan, L.; Xiong, L.; Liu, Q. High-through-put volumetric reconstruction for 3D wheat plant architecture studies. J. Innov. Opt. Health Sci. 2016, 9, 1650037. [Google Scholar] [CrossRef]
  19. Duan, T.; Chapman, S.C.; Holland, E.; Rebetzke, G.J.; Guo, Y.; Zheng, B. Dynamic quantification of canopy structure to characterize early plant vigour in wheat genotypes. J Exp. Bot. 2016, 15, 4523–4534. [Google Scholar] [CrossRef] [PubMed]
  20. Burgess, A.J.; Retkute, R.; Pound, M.P.; Foulkes, J.; Preston, S.P.; Jensen, O.E.; Pridmore, T.P.; Murchie, E.H. High-resolution three-dimensional structural data quantify the Impact of photoinhibition on long-term carbon gain in wheat canopies in the field. Plant Physiol. 2015, 169, 1192–1204. [Google Scholar] [CrossRef] [PubMed]
  21. Yang, Y.; Zhang, J.; Wu, K.; Zhang, X.; Sun, J.; Peng, S.; Li, J.; Wang, M. 3D Point Cloud on Semantic Information for Wheat Reconstruction. Agriculture 2021, 11, 450. [Google Scholar] [CrossRef]
  22. Liu, S.; Baret, F.; Abichou, M.; Boudon, F.; Thomas, S.; Zhao, K.; Fournier, C.; Andrieu, B.; Irfan, K.; Hemmerlé, M.; et al. Estimating wheat green area index from ground-based LiDAR measurement using a 3D canopy structure model. Agric. For. Meteorol. 2017, 247, 12–20. [Google Scholar] [CrossRef]
  23. Kempthorne, D.M.; Turner, I.W.; Belward, J.A.; McCue, S.; Barry, M.; Young, J.; Dorr, G.; Hanan, J.; Zabkiewicz, J. Surface reconstruction of wheat leaf morphology from three-dimensional scanned data. Funct. Plant Biol. 2015, 42, 444–451. [Google Scholar] [CrossRef] [Green Version]
  24. Wahabzada, M.; Paulus, S.; Kersting, K.; Mahlein, A.K. Automated interpretation of 3D laser scanned point clouds for plant organ segmentation. BMC Bioinform. 2015, 16, 248. [Google Scholar] [CrossRef] [Green Version]
  25. Zheng, B.; Shi, L.; Ma, Y.; Deng, Q.; Li, B.; Guo, Y. Comparison of architecture among different cultivars of hybrid rice using a spatial light model based on 3D digitising. Funct. Plant Biol. 2008, 35, 900–910. [Google Scholar] [CrossRef]
  26. Zhang, X.; Huang, C.; Wu, D.; Qiao, F.; Li, W.; Duan, L.; Wang, K.; Xiao, Y.; Chen, G.; Liu, Q. High-throughput phenotyping and QTL mapping reveals the genetic Architecture of maize plant growth. Plant Physiol. 2017, 173, 1554. [Google Scholar] [CrossRef] [Green Version]
  27. Jin, S.; Su, Y.; Song, S.; Xu, K.; Hu, T.; Yang, Q.; Wu, F.; Xu, G.; Ma, Q.; Guan, H.; et al. Non-destructive estimation of field maize biomass using terrestrial lidar: An evaluation from plot level to individual leaf level. Plant Methods 2020, 16, 69. [Google Scholar] [CrossRef]
  28. Yang, Y.; Paleari, L.; Wilson, L.T.; Confalonieri, R.; Astaldi, A.Z.; Buratti, M.; Yan, Z.; Christensen, E.; Wang, J.; Samonte, S.O.P.B. Characterizing genotype-specific rice architectural traits using smart mobile app and data modeling. Agronomy 2021, 11, 2428. [Google Scholar] [CrossRef]
  29. Wen, W.; Wang, Y.; Wu, S.; Liu, K.; Gu, S.; Guo, X. 3D Phytomer-based geometric modelling method for plants—The case of maize. AoB Plants 2019, 13, plab055. [Google Scholar] [CrossRef]
  30. Wang, Y.; Wen, W.; Wu, S.; Wang, C.; Yu, Z.; Guo, X.; Zhao, C. Maize plant phenotyping: Comparing 3D laser scanning, multi-view stereo reconstruction, and 3D digitizing estimates. Remote Sens. 2018, 11, 63. [Google Scholar] [CrossRef] [Green Version]
  31. Shi, Z.; An, Y.; Xu, S.; Wang, Z.; Luo, X. Mesh Simplification Method Based on Reverse Interpolation Loop Subdivision; Association for Computing Machinery: New York, NY, USA, 2017; pp. 141–145. [Google Scholar] [CrossRef]
  32. Wen, W.; Guo, X.; Li, B.; Wang, C.; Wang, Y.; Yu, Z.; Wu, S.; Fan, J.; Gu, S.; Lu, X. Estimating canopy gap fraction and diffuse light interception in 3D maize canopy using hierarchical hemispheres. Agric. For. Meteorol. 2019, 276–277, 107594. [Google Scholar] [CrossRef]
  33. Sorkine, O.; Alexa, M. As-rigid-as-possible surface modeling. In Proceedings of the Fifth Eurographics Symposium on Geometry Processing, Barcelona, Spain, 4–6 July 2007; pp. 109–116. [Google Scholar] [CrossRef]
Figure 1. (a) The 3D digital data acquisition instrument; (b) The specific data captured; (c) The extracted leaf skeleton.
Agronomy 12 00414 g001
Figure 2. Overall flow chart of wheat 3D modelling method.
Agronomy 12 00414 g002
Figure 3. Leaf clustering results based on five morphological leaf parameters. (a)–(c) are the clustering results of flag leaf, middle leaves, and first leaf, respectively. Dimension 1 and Dimension 2 are the two principal components in PCA and each circle is a cluster category. Different colors are used to distinguish the clusters.
Agronomy 12 00414 g003
Figure 4. Rigid transformation of a deformation element.
Agronomy 12 00414 g004
Figure 5. The vein-driven leaf mesh deformation process. (a) Template calling; (b) Scaling and translation; (c) Leaf vein curve resampling; (d) Mesh deformation based on ARAP.
Agronomy 12 00414 g005
Figure 7. Distribution of the five morphological leaf parameters at different leaf positions. (a)–(e) are the leaf features distribution of leaf size ratio, maximum leaf width position, leaf sag, leaf bending, and leaf twisting, respectively.
Agronomy 12 00414 g007aAgronomy 12 00414 g007b
Figure 8. Leaf sequencing results of leaf sag (a), bending (b), and twisting (c).
Agronomy 12 00414 g008
Figure 9. Mesh deformation process and results of six typical leaves. (a) Target vein and matched template leaf; (b) Using only one control point at the leaf tip; (c) Five iteration results; (d) Ten iteration results; (e) Final results.
Agronomy 12 00414 g009
Figure 10. Comparison between modelling results and 3D digitizing data of six wheat cultivars. (a)–(f) are the modeling and comparison results of ZM618, JM106, XN979, JM44, ZXM09, and HC3366, respectively.
Agronomy 12 00414 g010
Figure 11. Comparison between extracted and measured parameters of six wheat cultivars. (a) Comparative result of leaf length; (b) Comparative result of leaf width; (c) Comparative result of leaf area.
Agronomy 12 00414 g011
Figure 12. Box plot of the offset distance between the coordinate points of wheat leaf deformation results and the original 3D digitizing data.
Agronomy 12 00414 g012
Figure 13. Spatial leaf area distribution of six wheat cultivars. (a)–(k) are the vertical leaf area distribution of ZM618, JM106, XN979, JM44, ZXM09, and HC3366, respectively; (b)–(l) are the horizontal leaf area distribution of ZM618, JM106, XN979, JM44, ZXM09, and HC3366, respectively.
Agronomy 12 00414 g013aAgronomy 12 00414 g013bAgronomy 12 00414 g013c
Table 1. Summary of the type and quantity of data collected.
Complete PlantComplete Leaves of the Main Stem and a Tiller with Leaf Skeletons on Other TillersSummation
Number of cultivars154560
Number of plants45135180
Number of stems342270612
Total number of leaves154912262775
Table 2. Calculating specific parameters of the five morphological leaf features.
ParameterIdentifierThe Parameter of the Morphological FeatureCalculation FormulaSchematic Diagram
Leaf size ratioFratioThe ratio of the maximum leaf width to the leaf’s length, dependent on the maximum leaf widthFratio = maximum leaf width/leaf length Agronomy 12 00414 i001
Maximum leaf width positionFwposThe proportion of the maximum leaf width, dependent on the maximum leaf widthFwpos = current leaf length from maximum leaf width to leaf birth point/leaf length Agronomy 12 00414 i002
Leaf sagFsagThe overall sagging radian of the leaf based on the position where the drooping point appears on the leaf’s veinFsag = distance from the highest point of the leaf to the tip point/leaf length Agronomy 12 00414 i003
Leaf bendingFbendThe overall bending radian of the leaf, dependent on the height of the highest pointFbend = 1-distance from the birth point of the leaf to the tip point/leaf length Agronomy 12 00414 i004
Leaf twistingFtwistThe overall twisting degree of the leaf, dependent on the trend in the change of the leaf vectorFtwist = the absolute value sum of rotation angle increment connected by the left and right edge points of the leaf along the vein direction/360° Agronomy 12 00414 i005
Table 3. The central value of leaf clusters (Figure 3) based on five morphological parameters of leaves. Note: u is the similarity for further leaf matching, see Equation (1).
Clustering GroupLeaf PositionFsagFbendFtwistFratioFwposNumber of Leavesu
1Flag leaf0.010.010.370.200.384180.10
2Flag leaf0.860.020.440.160.381220.69
3Middle leaves0.010.050.480.080.402320.13
4Middle leaves0.020.080.780.080.392270.18
5Middle leaves0.420.210.620.090.431920.47
6Middle leaves0.500.550.650.080.472520.56
7Middle leaves0.500.550.880.090.461720.61
8Middle leaves0.620.500.710.080.381220.68
9Middle leaves0.640.420.950.080.371500.58
10Middle leaves0.790.160.890.080.391880.77
11Middle leaves0.820.170.580.090.401600.81
12First leaf0.100.170.620.090.38540.24
13First leaf0.800.280.900.070.421810.79
14First leaf0.870.230.650.080.433050.77
Table 4. Comparison between wheat leaf deformation results (A) and leaf shape parameters extracted from original 3D digitizing data (B).
CultivarsLeaf Size RatioMaximum Leaf Width PositionLeaf SagLeaf BendingLeaf Twisting
p3p2p1p3p2p1p3p2p1p3p2p1p3p2p1
ZM618A0.120.090.080.360.410.42000.2600.550.320.420.500.45
B0.130.090.080.380.410.430.040.020.280.030.560.340.440.540.46
JM106A0.120.080.080.400.490.420.580.360.420.100.2500.580.750.70
B0.120.070.070.370.490.420.560.380.410.120.270.050.600.750.72
XN979A0.190.090.080.500.490.400.630.670.650.130.390.400.480.830.83
B0.200.080.080.520.480.410.650.670.650.100.390.410.510.850.86
JM44A0.140.090.080.460.520.4000.360.6400.200.150.320.650.50
B0.140.090.080.450.530.4000.360.6100.200.180.360.650.52
ZXM09A0.190.070.090.420.450.400.830.580.8600.230.150.320.660.70
B0.200.070.090.400.430.400.840.570.8600.240.170.360.680.74
HC3366A0.160.080.070.440.500.4200.430.7200.270.250.400.720.73
B0.150.090.090.450.510.440.020.430.730.010.280.290.430.720.76
Maximum error0.010.010.020.030.020.020.040.020.030.030.020.050.040.040.04
RMSE0.010.010.020.020.03
R20.970.911.000.980.97
Note: p1, p2, and p3 represent the three leaf positions of the first leaf, middle leaves, and flag leaf, respectively. Maximum error represents the max difference in comparison data of six cultivars per column and the corresponding comparison data is marked in bold.
Table 5. The calculation results of offset distance between the coordinate points of wheat leaf deformation and the original 3D digitizing data.
Parameter NameZM618JM106XN979JM44ZXM09HC3366Average Value
Q1 (cm)0.2670.3420.3160.2790.4090.3380.325
Q2 (cm)0.5090.6350.5310.4770.6130.6080.562
Q3 (cm)0.7490.9810.7920.7280.8750.9160.840
Variance (cm2)0.2880.4080.3080.2990.3280.3890.336
Table 6. Time consumption in modelling wheat plant leaf groups.
Parameter NameZM618JM106XN979JM44ZXM09HC3366
Number of leaves223027252628
Total iterations132001660014580126001404014800
Running time (s)1.692.491.961.481.782.04
Table 7. The total time consumption of this method compared with that of the 3D digitizer to obtain complete plants for 3D modelling.
Parameter NameObtaining Complete 3D Digitized DataOur MethodSpeed Growth Rate
Data acquisition time (s)2100–3000420–60080%
Modelling time (s)0.8–1.21.5–2.5−50%
Total time (s)2100.8–3100.2421.5–602.579.9%
Publisher’s Note: MDPI stays neutral with regard to jurisdictional claims in published maps and institutional affiliations.

