Article

Comparison of Proximal Remote Sensing Devices of Vegetable Crops to Determine the Role of Grafting in Plant Resistance to Meloidogyne incognita

by
Yassine Hamdane
1,2,
Adrian Gracia-Romero
1,2,
Maria Luisa Buchaillot
1,2,
Rut Sanchez-Bragado
1,2,
Aida Magdalena Fullana
3,
Francisco Javier Sorribas
3,
José Luis Araus
1,2 and
Shawn C. Kefauver
1,2,*
1
Integrative Crop Ecophysiology Group, Plant Physiology Section, Faculty of Biology, University of Barcelona, Av. Diagonal, 643, 08028 Barcelona, Spain
2
AGROTECNIO (Center for Research in Agrotechnology), Av. Rovira Roure 191, 25198 Lleida, Spain
3
Department of Agri-Food Engineering and Biotechnology, Universitat Politècnica de Catalunya, 08860 Castelldefels, Spain
*
Author to whom correspondence should be addressed.
Submission received: 25 March 2022 / Revised: 20 April 2022 / Accepted: 21 April 2022 / Published: 30 April 2022

Abstract

:
Proximal remote sensing devices are novel tools that enable the study of plant health status through the measurement of specific characteristics, including the color or spectrum of light reflected or transmitted by the leaves or the canopy. The aim of this study is to compare the RGB and multispectral data collected during five years (2016–2020) of four fruiting vegetables (melon, tomato, eggplant, and peppers) with trial treatments of non-grafted and grafted onto resistant rootstocks cultivated in a Meloidogyne incognita (a root-knot nematode) infested soil in a greenhouse. The proximal remote sensing of plant health status data collected was divided into three levels. Firstly, leaf level pigments were measured using two different handheld sensors (SPAD and Dualex). Secondly, canopy vigor and biomass were assessed using vegetation indices derived from RGB images and the Normalized Difference Vegetation Index (NDVI) measured with a portable spectroradiometer (Greenseeker). Third, we assessed plant level water stress, as a consequence of the root damage by nematodes, using stomatal conductance measured with a porometer and indirectly using plant temperature with an infrared thermometer, and also the stable carbon isotope composition of leaf dry matter.. It was found that the interaction between treatments and crops (ANOVA) was statistically different for only four of seventeen parameters: flavonoid (p < 0.05), NBI (p < 0.05), NDVI (p < 0.05) and the RGB CSI (Crop Senescence Index) (p < 0.05). Concerning the effect of treatments across all crops, differences existed only in two parameters, which were flavonoid (p < 0.05) and CSI (p < 0.001). Grafted plants contained fewer flavonoids ( x ¯ = 1.37) and showed lower CSI ( x ¯ = 11.65) than non-grafted plants ( x ¯ = 1.98 and x ¯ = 17.28, respectively, p < 0.05 and p < 0.05) when combining all five years and four crops. We conclude that the grafted plants were less stressed and more protected against nematode attack. Leaf flavonoids content and the CSI index were robust indicators of root-knot nematode impacts across multiple crop types.

1. Introduction

Phytoparasitic nematodes (PPNs) are responsible for significant economic losses to a wide variety of crops worldwide [1].PPNs cause a reduction in crop yield by the direct destruction of root cells or indirectly, by propagating viruses, or by facilitating the invasion of fungi and bacteria through lesions caused during their penetration into the roots. The total losses caused by PPNs are estimated at more than 100 billion dollars per year worldwide, correlatively to reductions in yields of the order of 10–20% for cash crops [2]. These losses are generally greater in tropical regions, where the reproduction rate of nematodes is higher than in temperate zones [2]. In addition, the reduction in yields caused by PPNs could be intensified due to restrictions imposed on the use of chemical fumigants [3] and the voluntary withdrawal of certain nematicides from the market. The environmental complexities facing world agriculture today challenge conventional methods of production. Agronomic research is therefore moving towards alternatives aimed at reducing or even eliminating synthetic nematicides [4].
Meloidogyne are mandatory sedentary endoparasite nematodes (Table 1). They complete their cycle in the root, the only free stage in the soil being the second stage juvenile (J2). They induce significant root transformations leading to the formation of galls typically by infection of the conductive tissues of the plant, which may wither and die, reducing yield and losses in fruit quality. They are characteristically polyphagous, with more than 5500 species of host plants [5].
New techniques have been brought to agriculture by advancements in precision agriculture and plant phenotyping that allow for rapid and nondestructive assessments of crop health [7]. In order to better study the crop physiological status and nutrient or other management requirements, we propose the use of advanced tools such as leaf sensors and proximal remote sensing instruments. For instance, the leaf level chlorophyll (measured for example with a portable device), may be considered a reflection of the reduced capacity of nematode infested roots to capture nutrients. Additionally, measuring the NDVI (Normalized Difference Vegetation Index, an index of above ground biomass and plant vigor combined) is useful for assessing whole plant level vigor and may be understood as a combination of root damage effects on nutrient and water uptake capacity, plus plant reallocation of resources to root growth from shoot growth. Then, the combined used of RGB (red, green, and blue) and multispectral (visible and near infrared reflectance combinations) cameras allows for the calculation of NDVI and other different image indexes informing on Leaf Area Index (LAI), Leaf Chlorophyll Content (LCC), crop biomass and vigor [8]. At the single leaf level, sensors such as the Dualex, assess different pigment contents (chlorophyll, flavonol, anthocyanin) together with the nitrogen balance index, NBI). All of these indices can give a general idea about the modification in the production of the pigment then the reaction of plant against the attack of the pest. The use of natural abundance stable isotopes such as carbon and nitrogen isotope composition may allow monitoring the response of plants to different growing condition because stable isotope data can quickly give information on the condition of the plant [9]. Carbon isotope composition (δ13C) in its natural abundance in plant dry matter has been used for decades as a tool for screening water-use efficiency (WUE) and thus indirectly water plant status during in C3 plants [9]. The use of natural variation on the stable nitrogen isotope composition (δ15N) has been used as a proxy to study nitrogen plant dynamics and as a tracer of then nitrogen sources used by the plant [10,11,12,13]. In this study, field sensors and rapid assessment techniques including non-destructive, proximal, and remote sensing, together with carbon and nitrogen stable signatures and total elemental contents were used to assess the interaction between nematode presence and grafting on physiological status of different horticultural crops growing in a greenhouse. To highlight the need for rapidly assessing nematode damage to crop growth, comparisons were made between the growth and physiological status of different crops grafted to rootstock resistant to root-knot nematodes (RKNs) and those without grafting (non-grafted). In this work, we first summarize some important aspects concerning the different trials and data collected regarding nematodes and horticultural crops, and then we follow with combined analyses, which includes the comparison and synthesis of five seasons of field data collected of different crops grown sequentially in the same greenhouse with a strong nematode presence for five years from 2016–2020.

2. Materials and Methods
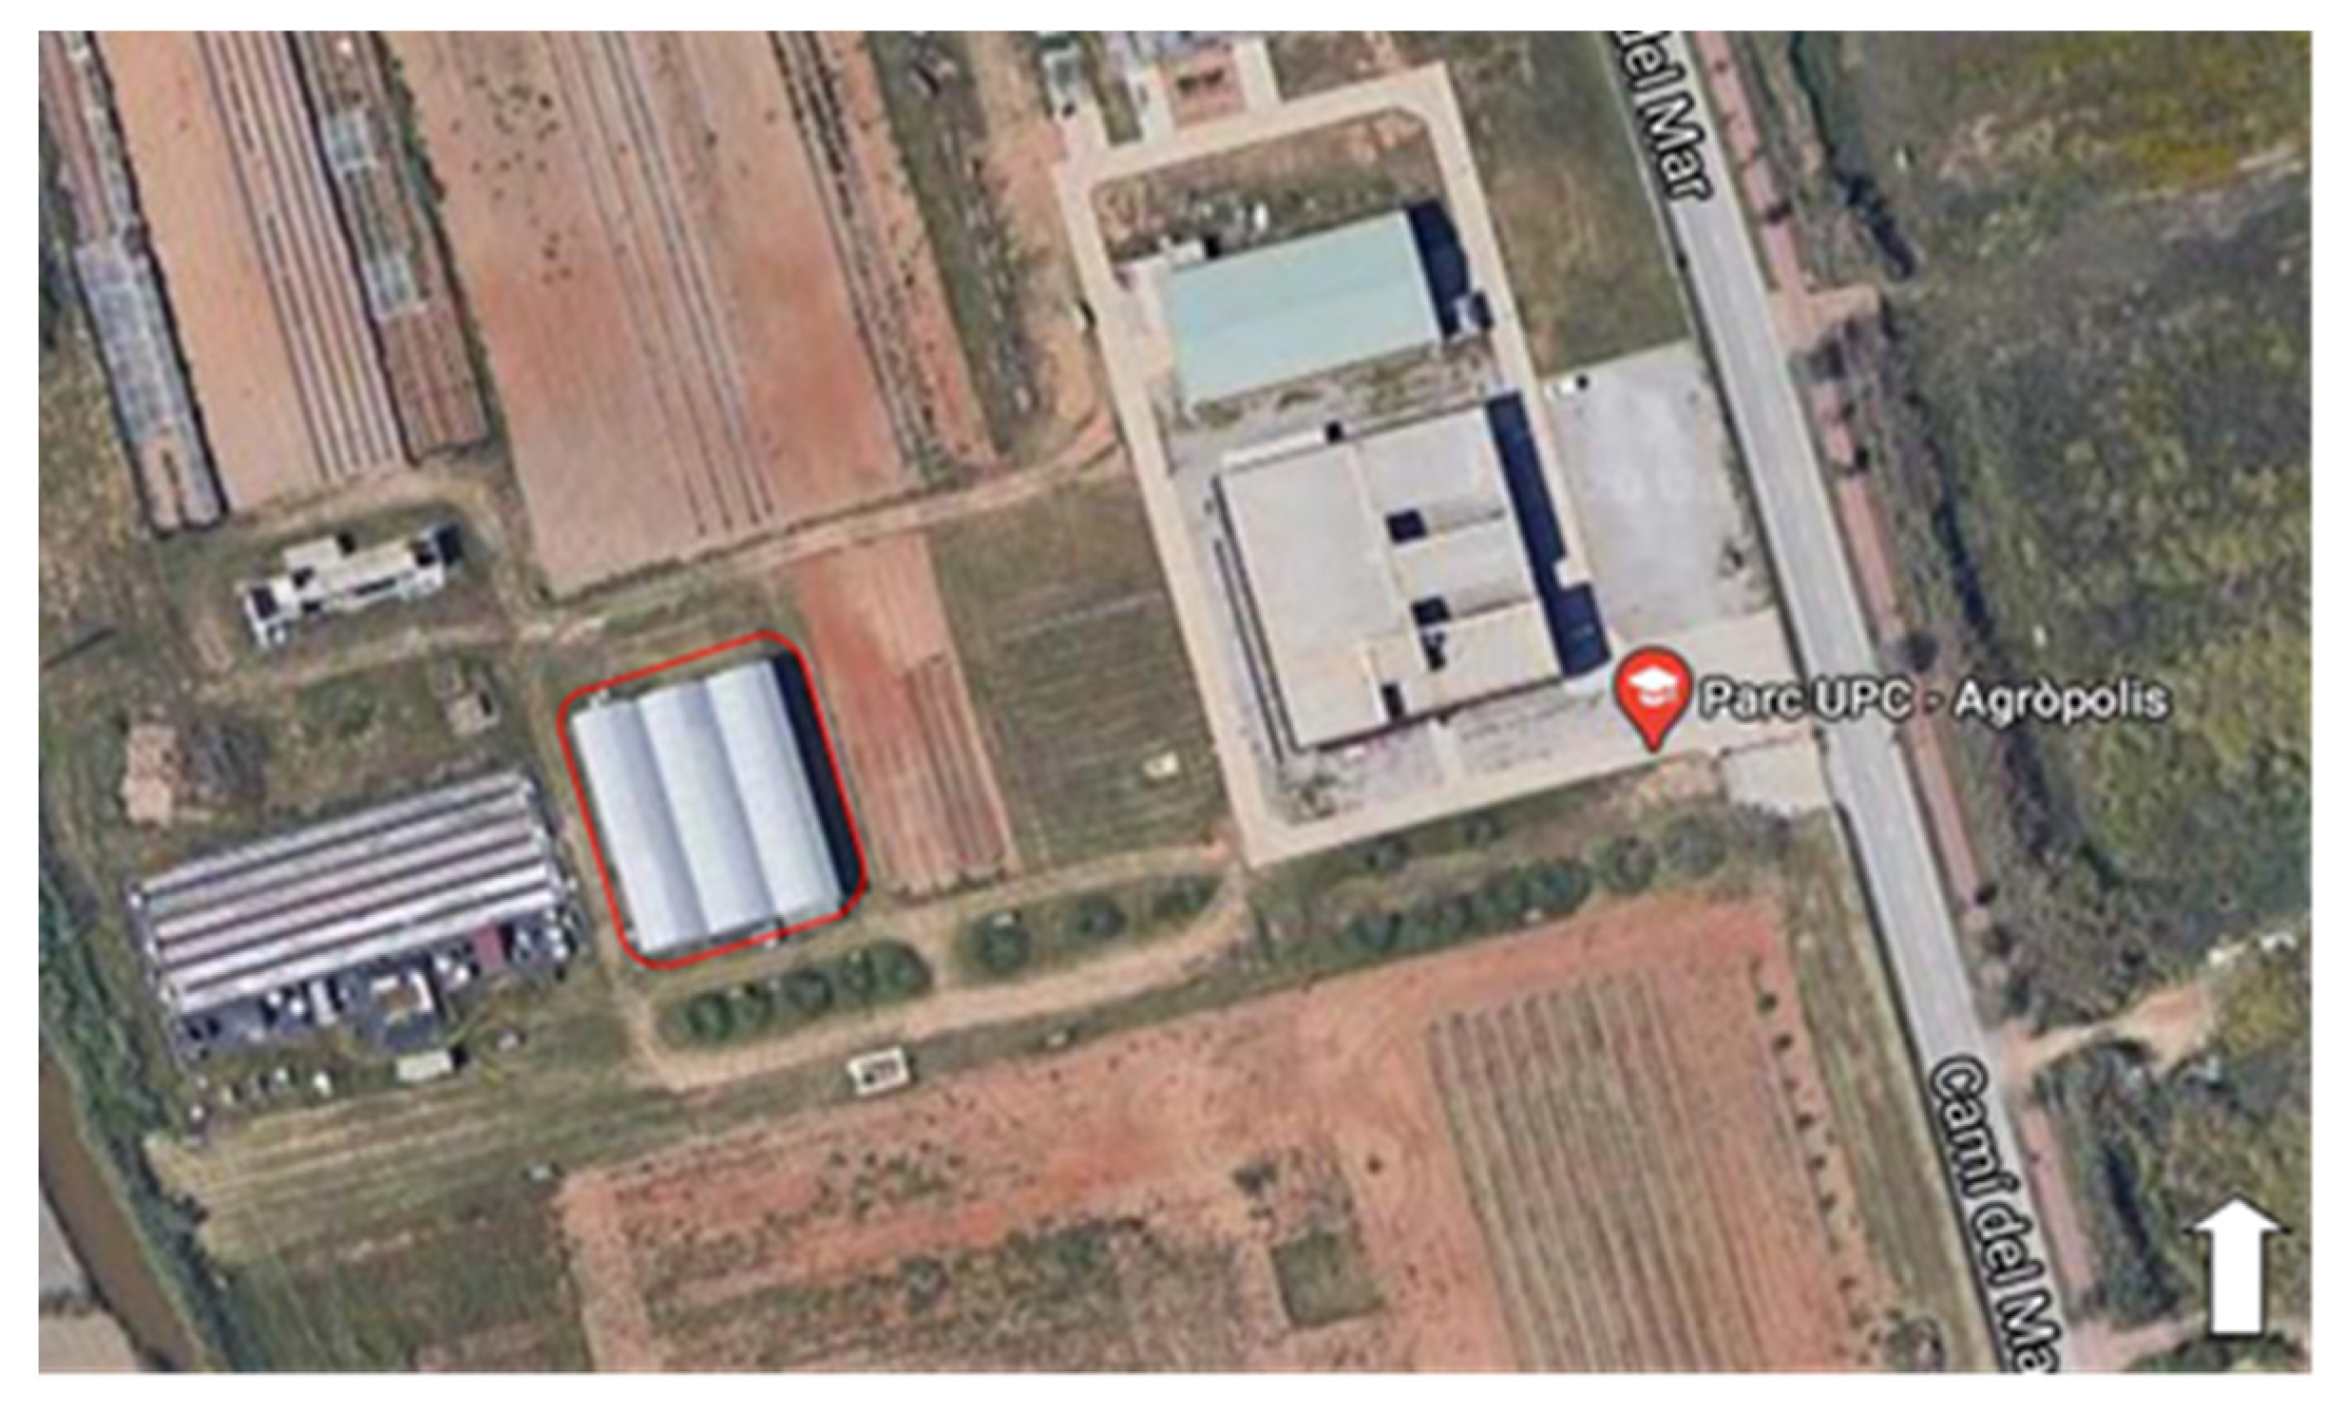
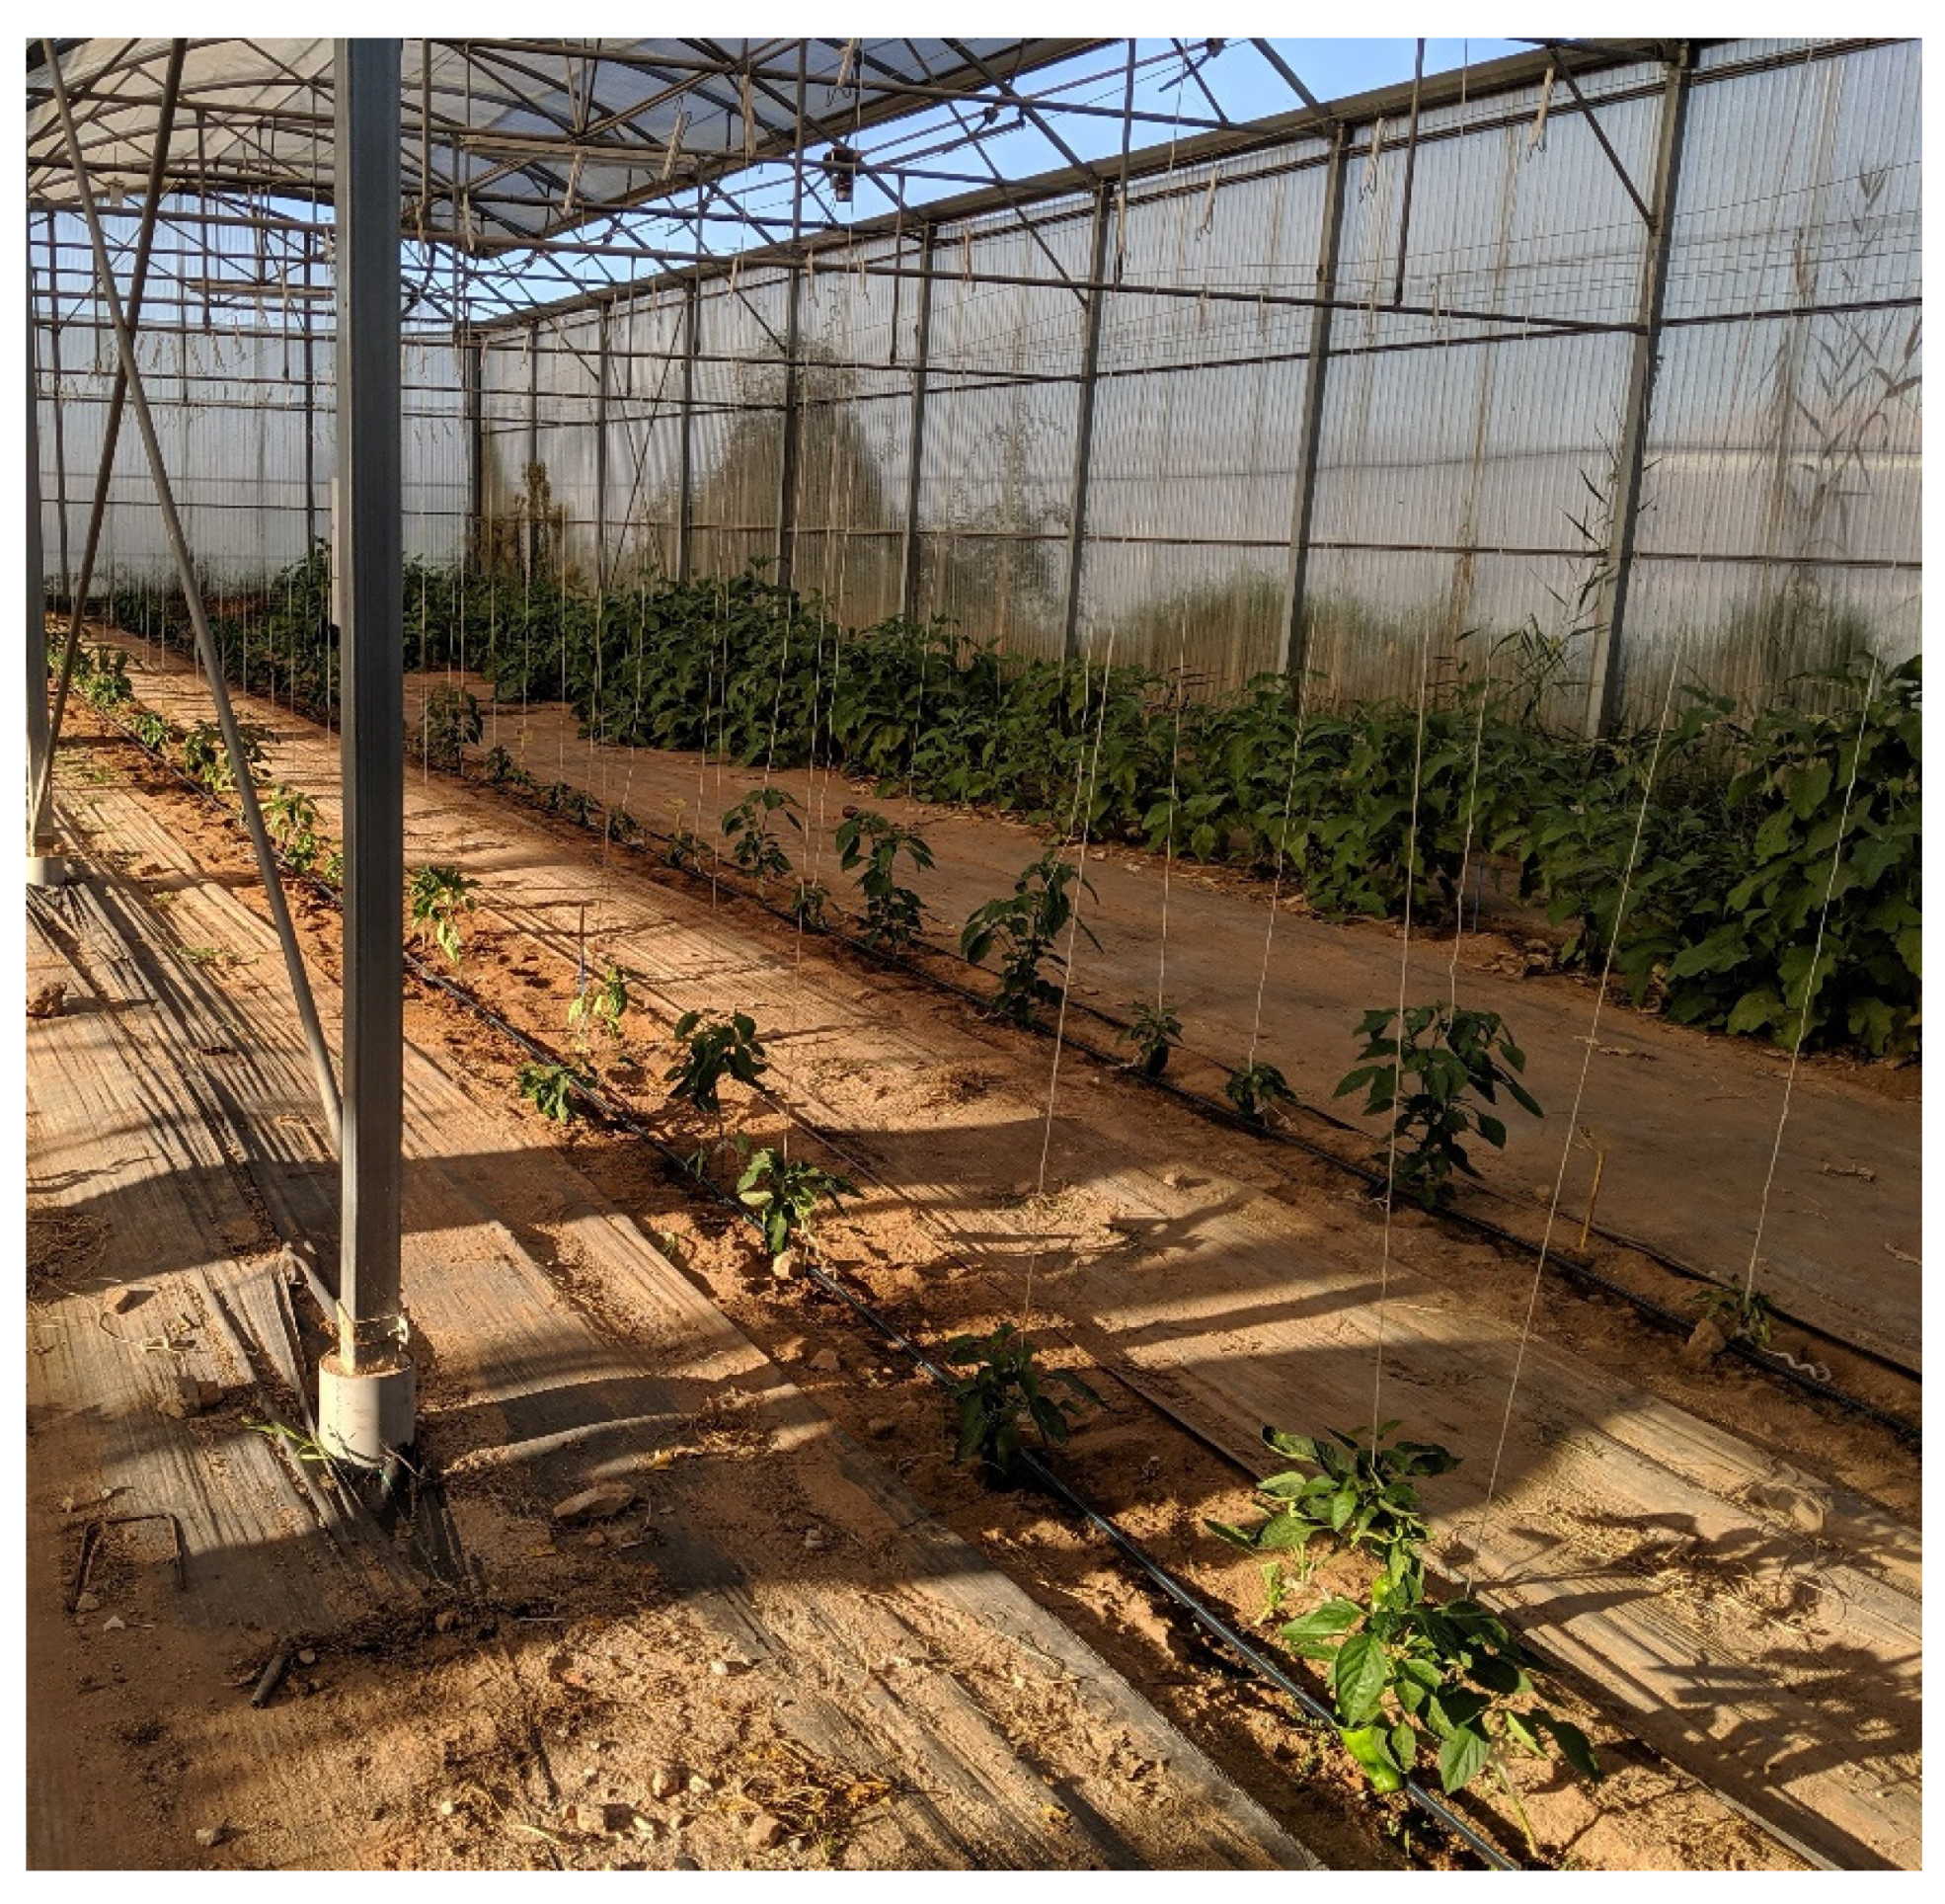
2.1. Study Site

This research was carried out between 28 September and 8 October over five successive years from 2016 to 2020 in a plastic greenhouse located at the experimental station of Agròpolis (41°17′18.1″ N 2°02′38.5″ E + 18 m above the sea level, approx.) of the Barcelona School of Agri-food and Biosystems Engineering of the Universitat Politècnica de Catalunya (EEABB-UPC), in the municipality of Viladecans (Barcelona, Spain) (Figure 1). The inside of the greenhouse during the 2019 trial is shown in Figure 2.

2.2. Experimental Trial Designs

In the year 2016, we used 40 plots total of melon (Cucumis melo var. reticulatus) cv. Paloma, of which each block contained five plants and there were two treatment variables, the first non-grafted or grafted onto the rootstock Cucumis metuliferus and the second consisting of three levels of nematode infection. So, in total, we have two crop treatments (grafted or non-grafted) and (control, low, high infection) for 6 total treatments. Each treatment has repetitions with an increase to 10 plots for grafted and non-grafted control.
Regarding the experiment of the year 2017, during which melon (Cucumis melo var. reticulatus) and tomato plants (Solanum lycopersicum cv. Durinta) were cultivated, the total number of sample plots was 80, which are distributed as 40 melon plots and 40 tomato plots. For the 40 plots of each species, they were divided into six treatments melon grafted onto Cucumis metuliferus or non-grafted and tomato grafted onto the rootstock ‘Alligator’ or non-grafted and (control, low, high infection by nematode). The number of plot repetitions per treatment was five for control, 10 for grafted and 10 for non-grafted.
Moving on to 2018, during which we studied solely eggplant (Solanum melongena cv. Cristal), the total number of 20 sample plots were divided into four blocks containing five plants in each block. At the block level, non-grafted eggplants were placed in front and grafted eggplants onto Solanum torvum ‘Brutus’ in back for both crop lines for 10 non-grafted and 10 grafted eggplants total.
Pepper plants (Capsicum annuum cv. Tinsena) were studied in 2019 with 40 sample plots divided into four lines, with each line containing one treatment. The number of repetitions per treatment per line was ten, so each treatment had 20 repetitions. The treatments were non-grafted and grafted pepper plants onto pepper rootstock ‘Oscos’.
Ending with 2020, 40 sample plots were divided into four lines of tomato (Solanum lycopersicum). Then, two lines were cultivated with tomato cv. Durinta and the rest with the resistant tomato cv. Caramba. In total, we registered 20 susceptible and 20 resistant tomato plots each in order to show its effects on the plant performance.
The experiments were conducted in the same plots from 2016 to 2020: from March to July (spring crop) and July to November (summer crop). In 2017, only the spring crop was carried out. Grafted and non-grafted melon and tomato were cultivated from April to August and from April to September, respectively. Individual plots consisted of a row 2.5 m long and 1.5 m wide containing 4 plants spaced 0.55 m between them. Plots were spaced 0.9 m within a row and 1.5 m between rows. The soil of each plot was prepared separately to avoid cross-contamination. The soil was loamy sand textured, with 1.8 % organic matter (w/w) and 0.5 dS m−1 electric conductivity. Plants were irrigated and fertilized by a drip irrigation system with a solution of NPK (15–5-30) at 31 kg ha−1, and iron chelate and micronutrients at 0.9 kg ha−1. The fruits were collected and weighed when they reached approximately the United Nations Economic Commission for Europe (UNECE) commercial standards for fresh fruit and vegetables (https://unece.org/trade/wp7/FFV-Standards accessed on 20 April 2022 [14]), and the relative crop yield was calculated as the crop yield in a RKN infested plot in relation to the mean crop yield in non-infested plots.

2.3. Sensors and Measurements

All sensors were used during the fruit development phase (varies by crop) in a modified fall season of the open-air greenhouse at the Agròpolis between the last week of September and the first week of October. All the sensors were used at the same time of day for each year in one single data collection activity between 15:30 h and 18:30 h CET.

2.3.1. Determination of Leaf Level Pigments

SPAD

The Konika Minolta SPAD-502 Plus (Spectrum Technologies Inc., Plainfield, IL, USA; [15]) determines the relative chlorophyll concentration by measuring the leaf absorbance in red and near-infrared regions [16] from light emitted by two LEDs with peak wavelengths at 650 nm and 940 nm. With these absorbance values, the SPAD (Soil Plant Analysis Development) calculates a company defined SPAD value by division of light transmission intensities at 650 nm (red) by 942 nm (infrared) to estimate chlorophyll content [15]. For each plant we placed the third mature leaf of each plant in each plot between the two measuring heads and waited for a few seconds to read the SPAD index value of chlorophyll.

Dualex

Leaf pigment contents were measured using a leaf-clip portable sensor Dualex Force-A (Force-A, Orsay, France) that measures chlorophyll, flavonoids and anthocyanins non-destructively, as actual estimations of leaf pigment concentrations [17]. In addition, the Dualex calculates the proprietary Nitrogen Balance Index (NBI), which is the chlorophyll/flavonoids ratio related to the nitrogen and carbon allocation [18]. The Dualex operates with a UV excitation beam at 357 nm, corresponding to the maximum absorption for flavonoids; another LED operates in the green band for anthocyanins; a red reference beam at 650 nm, corresponding to the absorption for chlorophyll; and two other reference bands operate in the near infrared. For each plot, the measurements were done at the adaxial leaf side closing the two terminals of the device on the sheet chosen in the plant.

2.3.2. Determination of Plant Health and Vigor

Trimble GreenSeeker NDVI

The NDVI was determined at ground level for each plot using a portable active sensor, the Greenseeker handheld crop sensor (Trimble, Sunnyvale, CA, USA) by passing the sensor over the middle of each plot at a constant height of 0.5 m above a perpendicular to the canopy [19]. The sensor emits brief bursts of red and infrared light (656 nm and 774 nm), and then measures the amount of each type of light that is reflected from the plant. It continues to sample the scanned area for as long as the trigger remains engaged. Then, the average measured value in terms of an NDVI index reading (ranging from 0.00 to 0.99) is displayed on its LCD display screen.

Red, Green, Blue (RGB) Images

Vegetation indexes derived from RGB images (Table 2) were evaluated for each plot, from the ground. At ground level, one picture was taken per plot, holding the camera at 80 cm above the plant canopy in a zenithal plane and focusing near the center of each plot. RGB images were obtained using a 16-megapixel Panasonic Lumix DMC GX7 (Panasonic, Osaka, Japan). The images were subsequently analyzed using the Cereal Scanner plugin (https://gitlab.com/sckefauver/cerealscanner accessed on 12 March 2019 [20]). This software includes a JAVA8 version of Breedpix 2.0 (https://bio-protocol.org/e1488 accessed on 14 March 2019, IRTA, Lleida, Spain), which calculates RGB vegetation indices using RGB and different color properties, such as Hue, Saturation, and Intensity (HSI) to measure plant properties of interest, such as foliar surface area, a close proxy to plant biomass or Leaf Area Index (LAI). In addition, the portion of pixels with hue classified as green was determined with the green area (GA) and greener area (GGA) indexes. GA is the percentage of pixels in the image with a hue range from 60 to 180, including yellow to bluish-green color values. Meanwhile, GGA is more restrictive, because it reduces the range from 80 to 180, thus excluding the yellowish-green tones. Both indexes are also used for the formulation of the CSI [21], which provides a scaled ratio between yellow and green pixels to assess the percentage of senescent vegetation. Besides the Breedpix indexes mentioned, two other indexes were measured with digital values of the red, green, and blue bands derived from the RGB color model. The Normalized Green Red Difference Index (NGRDI) is similar to the NDVI but uses green instead of near infrared (NIR) bands [22]. The Triangular Greenness Index (TGI) estimates chlorophyll content based on the area of a triangle with the three points corresponding to the red, green, and blue bands [23]. Details of the RGB index calculations are provided in Table 2.

2.3.3. Water Stress and Root Health

Porometer

Measurement of leaf stomatal conductance (mmol m−2 s−1) is critical for numerous aspects of viticulture research. Stomatal conductance regulates many plant processes (carbon dioxide assimilation, respiration, transpiration) and may be used to determine water status, response to climatic factors, stomatal conductance (gs) was measured with a Decagon Leaf Porometer SC-1 (Decagon Device Inc., Pullman, WA, USA). One flag leaf was measured for each plot [27].

Canopy Temperature

Canopy temperature (CT) was measured by the infrared thermometer Photo Temp TM MXSTM TD infrared thermometer (Raytek, Santa Cruz, CA, USA), pointing towards the canopy at approximately 1 m and in the opposite direction to the sun [28]. A few measurements were taken per plant, for plot and leaf temperature. The results are presented in degrees Celsius (°C). The temperature of the plant was further adjusted by the ambient temperature to provide an estimate of crop water stress as the plant actively cools through transpiration; this is called the canopy temperature deficit, which may increase as a sign of nematode damage to the crop root system [29].

Determination of Stable Isotopes: 13C and 15N of the Soluble Fraction

The determination of stable isotopes was conducted to further validate whether the plants suffered from water stress over the whole of the crop season, which can be seen as an integral measurement that is complimentary to the instantaneous water stress assessments provided by the leaf and air temperature measurements. The leaves (obtained from the determination of the dry weight) were dried, weighed and crushed following the soluble fraction extraction protocol as follows. Samples of 50 mg were added to 1 mL of MiliQ (Ultra-pure) and mixed well while on ice and centrifuged for 5 min at 5 °C at 12,000 rpm. The supernatant was recovered and incubated for 5 min at 100 °C and then again put in ice for 6 min. A second centrifugation was carried out for 5 min at 5 °C and rpm to separate the proteins from the soluble fraction. Then, a 50 µL aliquot of protein-free supernatant was transferred and dried for two hours at 70 °C. The stable carbon isotope composition (δ13C) together with the total carbon and nitrogen concentrations of the control and resistant plant leaves were determined using an elemental analyzer (EA; Flash 1112 EA, Thermo Fisher Scientific, Bremen, Germany) coupled with an isotope ratio-mass spectrometer (IRMS; Delta C with CONFLO III interface, Thermo Fisher Scientific, Bremen, Germany) operating in continuous-flow mode in order to determine the stable carbon (13C/12C) isotope ratios of the same samples. Samples of approximately 50 µL were placed into tin capsules, wheigthed, sealed, and then loaded into an automatic sampler (Thermo Fisher Scientific, Bremen, Germany) before EA-IRMS analysis. The 13C/12C ratios of the plant material were expressed in δ notation:  δ13C (‰) = (13C/12C)sample/(13C/12C)standard − 1, where “sample” refers to plant material and “standard” to international secondary standards of known 13C/12C ratios (International Atomic Energy Agency (IAEA) CH7 polyethylene foil, IAEA CH6 Sucrose, and the United States Geological Survey, USGS) 40 l-glutamic acid) calibrated against Vienna Pee Dee Belemnite calcium carbonate with an analytical precision (SD) of 0.10‰. The (15N/14N) ratios of plant material were expressed in δ notation (Coplen, 2008): δ15N = (15N/14N)sample/(15N/14N)standard − 1, where “sample” refers to plant material and “standard” N2 in air. Total carbon and nitrogen contents were expressed as a percentage of the dry matter (%). Measurements were carried out at the Scientific Facilities of the University of Barcelona [30,31].

2.4. Statistical Processing

Statistical treatment was done using Statgraphics Centurion XVI (Developed by Statpoint Technologies, Warrenton, VA, USA) for basic data analyses like mean and standard error and ANOVA. The calculation of correlation values was completed in MS Office Excel 2007 (developed by Microsoft, Redmond, WA, USA). Finally, the graphics were obtained using Sigma Plot 12.5 (Systat software, Chicago, IL, USA).

3. Results

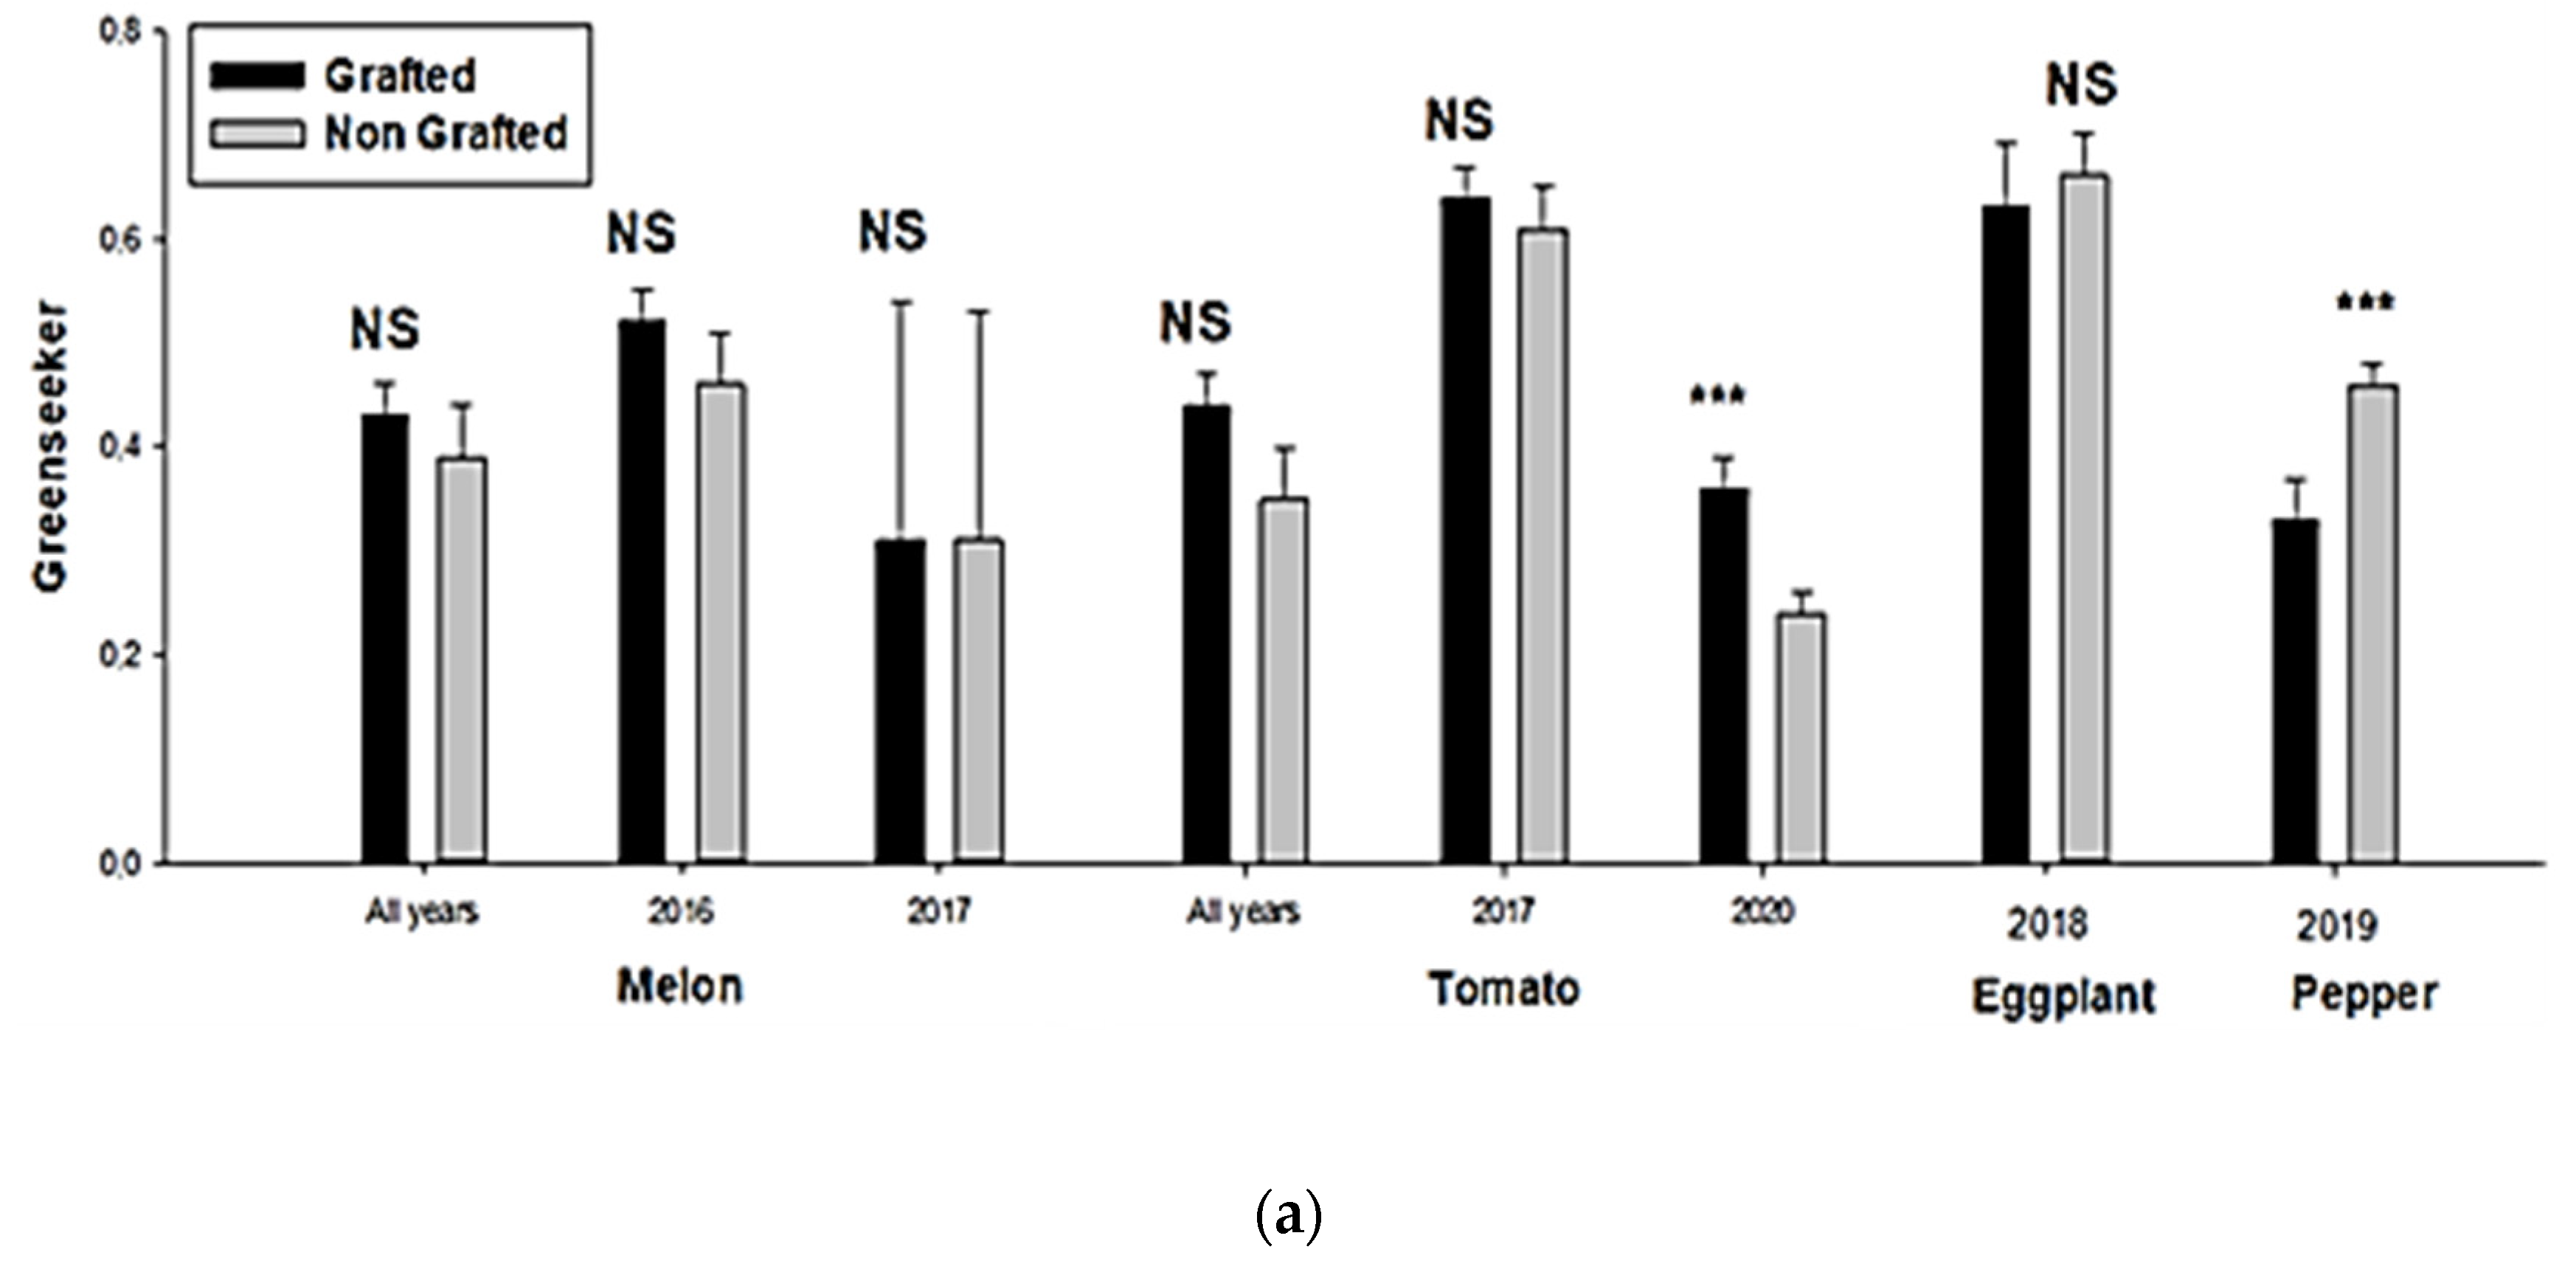
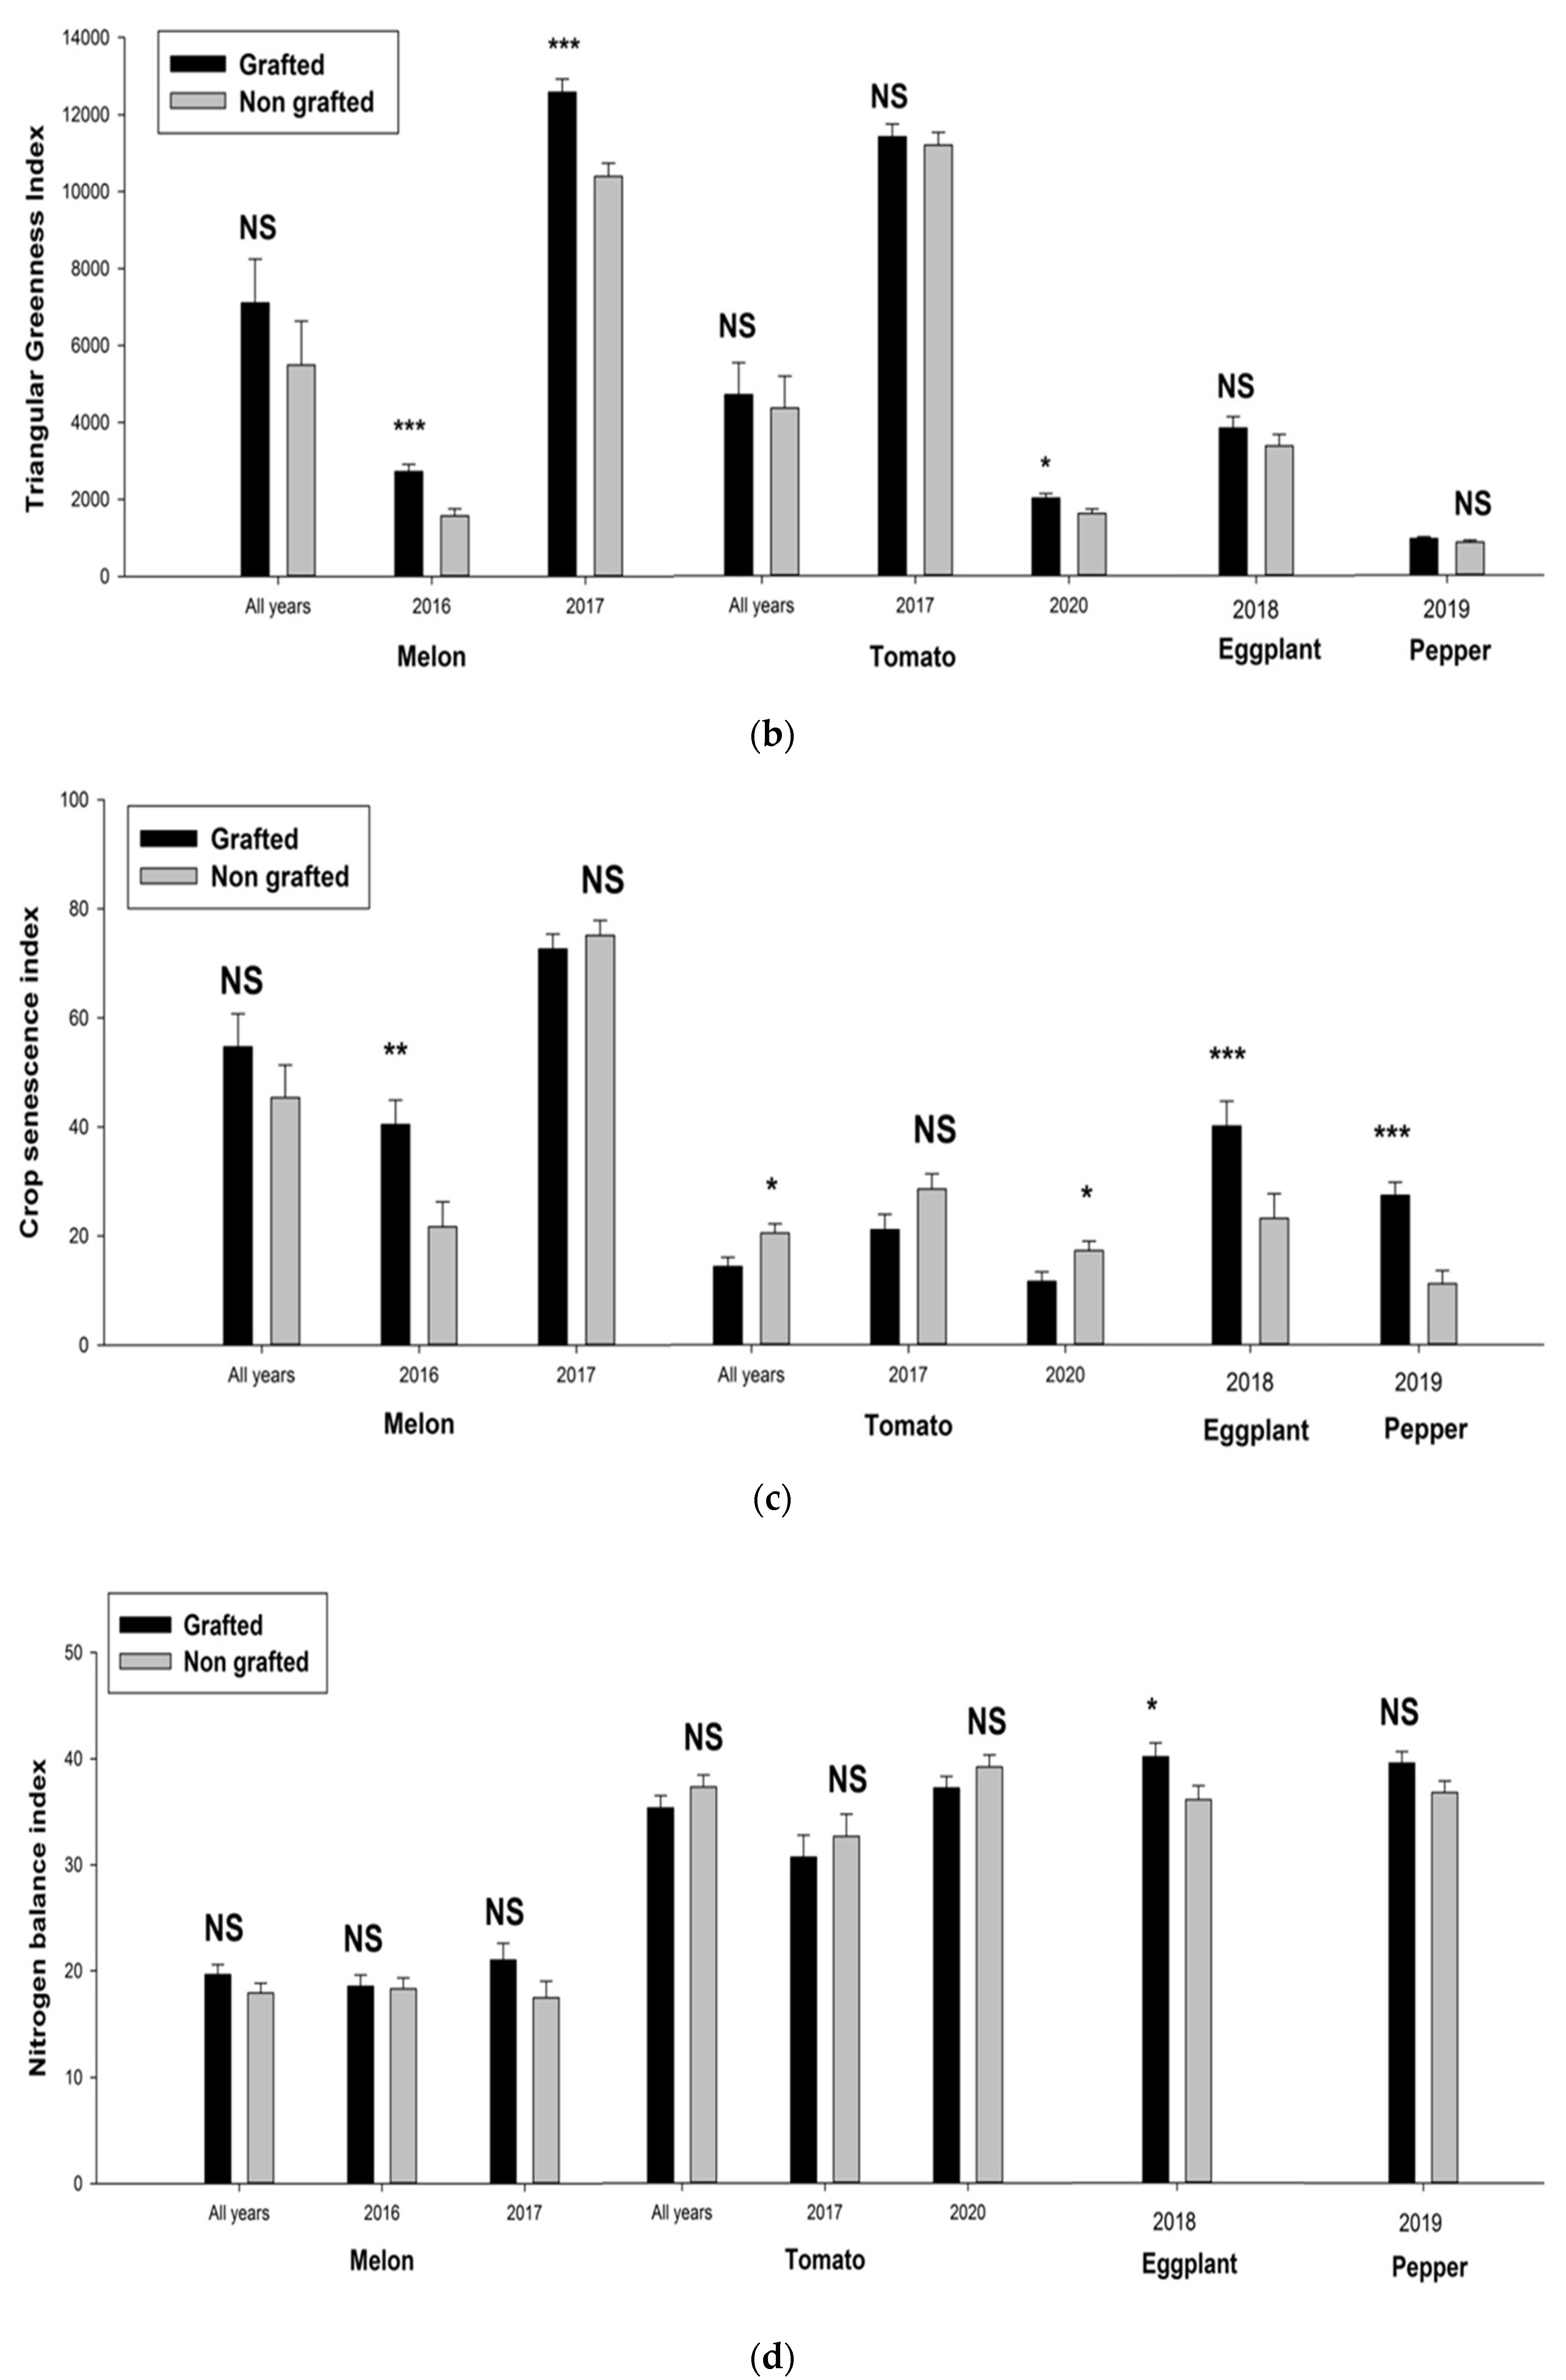
3.1. Physiological Parameters

The general trial data presented in Table 3 is further complemented by the data listed in the supplemental tables (Tables S1, S3, S4, S6, S7, S9 and S11), where for most parameters, we can observe that the values of grafted plants exceeded those of non-grafted plants. We can classify the parameters depending on the higher values recorded in all the crops. We note for melon (Chl, Flav, Anth, NDVI, TGI, CSI), tomato (GGA, NRGDI, Porometer, δ13C, Percent N), eggplant (GA, Percent C), and pepper (SPAD, Temperature, δ13C, δ15N). We should say for eggplant and pepper that porometer was not measured in contrast to the other species. Data analyses for individual years and different combinations of repeated crops are presented as Supplemental Tables S1–S11. SPAD (Soil Plant Analysis Development), Chl (chlorophyll), Flav (flavonoid), Anth (anthocyanin), NBI (Nitrogen Balance Index), GA (Green area), GGA (Greener Green Area), TGI (Triangular Greenness Index), NGRDI (Normalized Green Red Difference Index), CSI (Crop Senescence Index), δ13C (isotopic composition of carbon 13), percent C (percentage of carbon), δ15N (isotopic composition of nitrogen 15), and percent N (percentage of nitrogen).
The trial sensor data from Table 4 are complemented by supplemental data tables in the Supplemental (Tables S2, S5, S8 and S10), where we may furthermore note that for treatments, two factors were statically significant, Flav and CSI. For the interaction crop * treatment, two other parameters were statically significant, NBI and NDVI. The significant difference of parameters measured is important in considering that each species has physiological and biological responses to pest attacks that may affect the measured parameter values. Data analyses for individual years and different combinations of repeated crops are presented as Supplemental Tables S1–S11.
Figure 3a shows the variation of values for the NDVI, an indicator about the general vigor and biomass of each plant. We note that for melon and eggplant no significant differences were observed between grafted and non-grafted plants. In contrast, for tomato and melon during 2020, we observed significant differences for NDVI. Where, the grafted tomato exceeds the non-grafted. However, the opposite is seen for pepper of 2019, where the NDVI values were significantly higher for non-grafted plants.
Figure 3b informs on the variation the RGB image based TGI values as an indicator of the photosynthetically active chlorophyll content of the crop. Significant differences between the two treatments were recorded in melon and tomato, where the grafted treatment was favored. According to previous results presented in Table 4 and Figure 3, we understand that some pigments such as Flav, NBI and other parameters like CSI were the most efficient indicators for plant reaction to Meloidogyne root-knot nematode attacks. TGI, NBI and NDVI were higher in grafted plants, as indicators of crop vigor. In contrast, Flav and CSI recorded higher values in the non-grafted plants, as an indication of the level of stress. In contrast to the treatments (grafted, non-grafted), crop comparisons were not considered, as each species had physiological and biological characteristics that would greatly affect the measurement, especially the canopy proximal remote sensing approaches that are impacted by canopy features, like the RGB indexes TGI and CSI and also the NDVI.
Figure 3c gives a general idea about the variation of the RGB-based CSI. This index is an indicator of senescence level in the plant, which can be accelerated by many factors and may also be impacted by the view of the RGB cameras. The existence of differences in CSI can be observed between the two treatments in the different crops, but this difference was altogether absent in 2017. The most highly significant differences in CSI were detected for eggplant and pepper, where the value of grafted plant exceeded that of non-grafted plants, although, for combined years and in 2020 in tomato crop, the opposite was recorded. The attack of nematode can accelerate the senescence of plant, but other factors can also affect this index like the measurement stage, picture angles, and climatic conditions.
Figure 3d illustrates the variation of NBI values from the Dualex leaf level sensor. From this figure, we observe only one significant difference, that grafted exceeded non-grafted eggplant values. The level of nitrogen balance in the plant may provide information about rate of nitrogen absorption by the plant, thus indirectly providing information about the crop root health and assimilation capacity.
Figure 3e indicates the difference between the treatments in Flav level as measured using the Force-A Dualex leaf sensor. In pepper, we found that non-grafted plant Flav values exceeded that of grafted plants and the same for melon in 2017. Flav is one of the most important indicators of stress state of plants, with Flav production increased with increasing stress.

3.2. Crop Yield

As we see from Table 5, there is a significant difference between grafted and non-grafted plants. It is seen that grafted plants consistently produced more than non-grafted plants with exception of the tomato 2020 rotation, where the susceptible tomato cultivar yielded more than the resistant one due to different performance of the cultivars used that year.

4. Discussion

Grafting onto resistant-tolerant rootstocks is a promising non-chemical technique to suppress RKN populations and to reduce yield losses of the most susceptible cucurbit crops. Similar results as those presented here in this study have been previously discussed by several authors, which have touched on the topic in relation to similar species and the impact of nematodes on crop health. Plant resistance has been noted as an effective and profitable control method to reduce the RKN reproduction rate and equilibrium density [4,32]. The grafting technique was demonstrated to enable an increase in uptake of water and nutrients, resulting from the larger root systems and increased disease tolerance [33].
The different parameters extracted from RGB images like GA, TGI, and CSI and other direct sensor measurements such as the NDVI can provide a means to evaluate overall plant health and growth and, inversely, delayed onset of crop senescence [21,24,34]. These techniques are non-destructive tools that rapidly provide highly relevant information on plant physiological state and effectively quantify how grafted plants benefit in multiple ways from the resistant root stocks and show fewer symptoms related to nutrition or water stress as a sign of an overall improvement in root system function, as reflected in both vegetative vigor and total yields at the end-of-life crop cycle [35,36].
Nutrition is essential for plant growth and production. Crop root capacity for uptake of nitrogen and other essential macro-nutrients that support the production of chlorophyll and other vital processes of plant is essential. The highest values of NBI from the Dualex sensor was consistently recorded in grafted plants when compared over multiple years. NBI is an indicator of the balance of leaf N with other essential macro-nutrients, and thus its ability to positively contribute to plant processes, specifically photosynthesis. Greater NBI thus supported estimations of improved yield when compared over multiple years and crop types, contrary to the analysis made by Silva-Sanchez and others [28] on just one year of the same data, where their results supported the use of whole canopy measurements over leaf sensor measurements such as the Dualex NBI. Thus, another indicator of plant state nutrition, TGI from RGB images, serves as an indicator of leaf chlorophyll content [23]. The highest value of this indicator was observed in grafted plants, indicating that an increased photosynthetic capacity is supported by grafting, and these plants were protected from different stressors that reduce chlorophyll content-improvements in plant nutrition related to healthy roots absorption function [37].
Likewise, leaf senescence, considered as the last stage in leaf development, can serve as an indicator for the acceleration of plant biological life cycle processes. Longer crop cycles often result in a longer reproductive phase and increased yields [38]. Highly regulated changes at the molecular, cellular, biochemical, and physiological levels can cause leaves to senesce, all of which can be advanced by biotic or abiotic factors like pathogen attack (here considering nematodes). The highest values of CSI were observed in the non-grafted tomato crop as a result of increased Meloidogyne impacts due to its susceptibility; crop stress due to the RKN accelerated the process of senescence and subsequently shortened the life cycle of the plants, which usually results in a reduction in the crop production and quality [4,39,40,41].
Another unique parameter derived by the Dualex leaf sensor is flavanoid concentration. Flavanoid biosynthesis pathways in the plant can be induced by a broad pathogenesis response through jasmonic acid, salicylic acid, ethylene, auxin, and ROS cross-talks, likely triggered when the PPNs cause mechanical damage and wounding during feeding and penetration [42]. The higher concentration of Flav recorded in non-grafted plants is related stress signaling and indicative of a reduction in vital processes; the consequences of which may be reduced by grafting because it may limit the RKNs infection.
The stable isotopes of C and N and the percentage of carbon and nitrogen by biomass are general indicators for plant water conditions and nutrient status. Firstly, stable carbon (13C/12C) isotope ratios directly indicate the water state of plant that for (13C/12C) less negative values indicate a poorer hydric state for the plant, while the stable nitrogen isotope ratios (δ15N ) are more indicative of nutrient status and specific nutrient uptake. Although, the concentration of C and N in plant leaf indicate directly plant nutrition. The best ratio of (13C/12C) and (δ15N ) recorded in grafted plant means that this plant benefited from a good water state. Therefore, a good functioning of root. In addition, the same conclusion is founded for C and N concentration in this plant show the good absorption of nutrient by the root [43].
Grafting is also an effective tool for controlling other soil borne pathogens such as bacterial wilt (caused by Ralstonia solanacearum) and fusarium wilt (caused by Fusarium oxysporum fs. lycopersici) [44]. However, resistance to RKN has been found in wild Cucumis spp., including accessions of C. africanus, C. anguria, C. ficifolius, C. metuliferus, C. myriocarpus, C. postulatus, C. subsericeus [45]. One method to solve the problem of nematode infections in melon is to graft susceptible scions onto nematode resistant rootstocks [41,46,47,48]. Another consequence for grafting was that a higher fruit yield was obtained when plants of melon were grafted onto different Cucurbita rootstocks [30]. This may have resulted from different factors such as an increase in uptake of water and nutrients, resulting from the larger root systems and increased diseases tolerance. Other previous studies [48,49] show that the grafting of melon (Cucumis melo), and watermelon (Citrullus lanatus) has been reported to increase crop vigor and yield of melon and may be useful for low-input sustainable horticulture.
Furthermore, yield data, pooled by crop and treatment, indicate that grafting did not affect fruit quality, but that it was decisive in minimizing crop yield losses in RKN infected soil conditions [41]. In our study, the tolerance to Meloidogyne for grafted plants was a crucial factor that determined the crop yield per plant, similar as previously reported by Giné et al. [40]. In relation to melon, Expósito and others [41] found that the yield of non-grafted and grafted melon onto C. metuliferus cultivated in non-nematode infested soil did not differ irrespective of the cropping season, however; another study led by the same authors showed that maximum yield losses did differ at 98% yield losses for non-grafted compared to 38% yield losses for grafted melon. Reports on grafted melon tolerance to RKN and yield losses are scarce. Grafting onto tolerant rootstocks has been used widely to overcome the damage to different abiotic stresses, including high temperatures [50]. Consequently, screening for resistant-RKN and tolerance to abiotic stress will increase the availability of scion–rootstock combinations for agriculture production to overcome RKN and sub-optimal growing conditions.
Concerning the tomato cultivars studied in the 2020 experiment, we have shown that resistant plants registered higher vigor (NDVI), greenness (TGI) and lower senescence (CSI) as shown in Figure 3a–c, yet yielded slightly less than the susceptible variety (Table 5). This suggests that the crop health was improved by RKN resistance and that the differences in yield were related to cultivar normal expected yields. Similarly, Giné et al. [40] showed that in normal conditions and in a soil deprived of RKNs, the susceptible cv. Durinta registered a yield (2.6 ± 0.3 Kg m−2), while the resistant Monika (2.3 ± 0.4 Kg m−2). The soil where both susceptible and resistant cultivars were planted was not sufficiently infected by RKNs to make a difference in yield though other differences were observed in crop physiological status.

5. Conclusions

According to all the results obtained over the five successive years, we note that the grafting techniques constitute a means of protection against attack by root nematodes. This is seen in most cases studied by the value of physiological parameters (NDVI, NBI, Flavonoid, CSI, and TGI) of grafted plants, which indicated better crop health compared to the non-grafted plants. These limited sensor results indicate good functioning of the plant physiological defense processes in the grafted plants inversely to that of the non-grafted, which suffered from the intensity of attacks by nematodes that overcame plant defense mechanisms. In addition, the combination of resistant rootstocks grafted to commercial crop varieties consistently improved crop yields by ensuring good resistance and adaptation to soil containing nematode pests.
This grafting technique has been previously observed to be more effective on other crops and is potentially linked to the compatibility between the rootstock, scion (cultivar) and quality of benefits obtained from the rootstock. Some of these are more efficient than others and bring more qualities to the plant, which affects the growth and the final production in addition to the resistance to RKN. Then, the grafted plants yielded more than non-grafted, improving economic benefits. Considering climate change impacts on aboveground crop performance as well as soil characteristics, both of which may be improved by effective grafting techniques to provide resistance to RKNs and also to changing environmental conditions [51]. These additional desirable traits may be obtained through new techniques such as genetic engineering, which can provide certain characteristics of rootstocks, favoring their adaptation to global change. Despite the important role of grafting in the resistance against this plant-pathogen and the reduction of its impact on the plant growth and production, it alone remains insufficient to fight against nematodes, which necessitates an integrated control strategy combining different techniques, namely biological control by useful microorganisms and physical protection by solarization [52,53].
We also highlighted the potential of more cost-effective RGB images as a non-destructive technique that can ensure a detailed diagnosis of plant health status [7]. Proximal imaging is promising in the agricultural field, on the one hand, to save time, but in addition to directly address the needs of crops and to ensure the best possible condition for development and subsequently optimize production. The use of proximal remote sensing would require training, but not be overly costly for even smallholder farmers and potentially support the management of their farms by providing effective monitoring of biotic and abiotic factors affecting crop production.

Supplementary Materials

The following supporting information can be downloaded at: https://0-www-mdpi-com.brum.beds.ac.uk/article/10.3390/agronomy12051098/s1, Table S1: Mean and standard error of two treatments (grafted, non-grafted) of three classes of parameters (leaf level pigments, canopy vigor and biomass, water stress and root health) combination of the values of the four crops (melon, tomato, eggplant, pepper) n = 152 for 5 years (2016–2020); Table S2: ANOVA of melon crops of two years combined (2016, 2017) n = 20 + 16, including value of separate years of three classes of parameters (leaf level pigments, canopy vigor and biomass, water stress and root health); Table S3: Mean and standard error of two treatments (grafted, non-grafted) of combined two years (2016, 2017) n = 20 + 16 of melon crops grown in a greenhouse in soil infected by root knot nematode of three classes of parameters (leaf level pigments, canopy vigor and biomass, water stress and root health); Table S4: Mean and standard error of two treatments (grafted, non-grafted) of separate years (2016, 2017) n = 20 + 16 of melon crops grown in a greenhouse in soil infected by root knot nematode of three classes of parameters (leaf level pigments, canopy vigor and biomass, water stress and root health); Table S5: ANOVA of tomato crop of two years combined (2017, 2020) n = 16 + 20, and melon separate years of three classes of parameters (leaf level pigments, canopy vigor and biomass, water stress and root health); Table S6: Mean and standard error of two treatments (grafted, non-grafted) of separate years (2017, 2020) n = 17 + 20 of tomato crop grown in a greenhouse in soil infected by root knot nematode of three classes of parameters (leaf level pigments, canopy vigor and biomass, after stress and root health); Table S7: Mean and standard error of two treatments (grafted, non-grafted) of combined two years (2017 and 2020), with n = 16 + 40 of tomato crop grown in a greenhouse in soil infected by root knot nematode of three classes of parameters (leaf level pigments, canopy vigor and biomass, water stress and root health); Table S8: ANOVA of eggplant crop of 2018 with n = 20 of three classes of parameters (leaf level pigments, canopy vigor and biomass, water stress and root health); Table S9: Mean and standard error of two treatments (grafted, non-grafted) of 2018 with n = 20 of eggplant crop grown in a greenhouse in soil infected by root knot nematode; Table S10: ANOVA of Pepper crop of 2019 with n = 40 of three classes of parameters (leaf level pigments, canopy vigor and biomass, water stress and root health); Table S11: Mean and standard error of two treatments (grafted, non-grafted) of 2019 with n = 40 of pepper crop grown in a greenhouse in soil infected by root knot nematode of three classes of parameters (leaf level pigments, canopy vigor and biomass, water stress and root health).

Author Contributions

Conceptualization, Y.H. and S.C.K.; methodology, Y.H., S.C.K., A.M.F. and F.J.S.; software, S.C.K.; validation, Y.H., M.L.B., A.G.-R., R.S.-B., A.M.F. and F.J.S.; formal analysis, Y.H.; investigation, Y.H., M.L.B., A.G.-R., R.S.-B., A.M.F. and F.J.S.; resources, S.C.K. and J.L.A.; data curation, Y.H., M.L.B., A.G.-R., R.S.-B., A.M.F.; writing—original draft preparation, Y.H.; writing—review and editing, S.C.K., F.J.S. and J.L.A.; visualization, Y.H.; supervision, S.C.K. and J.L.A.; project administration, S.C.K., F.J.S., J.L.A.; funding acquisition, S.C.K., F.J.S. All authors have read and agreed to the published version of the manuscript.

Funding

Y.H. acknowledges the support of the Tunisian government from the Ministery of Higher Education and Scientific Research. J.L.A. acknowledges support from the Institució Catalana d’Investigació i Estudis Avançats (ICREA) Academia, Generalitat de Catalunya, Spain. S.C.K. is supported by the Ramon y Cajal RYC-2019-027818-I research fellowship from the Ministerio de Ciencia e Innovación, Spain. Thanks are also given to the Spanish Ministry of Economy and Competitiveness (MINECO) and the European Regional Development Fund (FEDER) for funding the project AGL2013-49040-C2-1-R and to the Ministry of Science and Innovation from the Spanish Government for funding the AGL2017-89785-R, and to the European Regional Development Fund (FEDER) AGL2017-89785-R, and for providing the FPI grant PRE2018-084265 to AMF. This research was also supported by the COST Action CA17134 SENSECO (Optical synergies for spatiotemporal sensing of scalable ecophysiological traits) funded by COST (European Cooperation in Science and Technology, www.cost.eu accessed on 29 April 2022).

Data Availability Statement

Not applicable.

Acknowledgments

The authors thank Picó and Gisbert from COMAV-UPV, for providing seeds of C. metuliferus accession BGV11135; Semillas Fitó for providing the melon cv. Paloma seeds; and Hishtil GS nurseries for providing the grafted plants. The authors are also grateful to Sheila Alcalá, Maria Julià, Sergi García, Miquel Masip, Helio Adán García-Mendívil and Alejandro Expósito for technical assistance.

Conflicts of Interest

The authors declare no conflict of interest. The funders had no role in the design of the study; in the collection, analyses, or interpretation of data; in the writing of the manuscript, or in the decision to publish the results.

References

  1. Koenning, S.R.; Overstreet, C.; Noling, J.W.; Donald, P.A.; Becker, J.O.; Fortnum, B.A. Survey of crop losses in response to phytoparasitic nematodes in the United States for 1994. J. Nematol. 1999, 31, 587. [Google Scholar] [PubMed]
  2. Kashaija, I.; Kizito, F.; McIntyre, B.; Sali, H. Spatial distribution of roots, nematode populations and root necrosis in highland banana in Uganda. Nematology 2004, 6, 7–12. [Google Scholar] [CrossRef]
  3. Djian Caporalino, C. Root knot nematodes (Meloidogyne spp.), a growing problem in French vegetable crops. EPPO Bull. 2012, 42, 127–137. [Google Scholar] [CrossRef]
  4. Sorribas, F.J.; Ornat, C.; Verdejo-Lucas, S.; Galeano, M.; Valero, J. Effectiveness and profitability of the Mi-resistant tomatoes to control root-knot nematodes. Eur. J. Plant Pathol. 2005, 111, 29–38. [Google Scholar] [CrossRef]
  5. Blok, V.C.; Jones, J.T.; Phillips, M.S.; Trudgill, D.L. Parasitism genes and host range disparities in biotrophic nematodes: The conundrum of polyphag versus specialisation. Bioessays 2008, 30, 249–259. [Google Scholar] [CrossRef]
  6. Davila, M.; Dickson, D.W. Base temperature and heat unit requirements for development of Meloidogyne arenaria and Meloidogyne javanica. J. Nematol. 2004, 36, 314. [Google Scholar]
  7. Araus, J.L.; Kefauver, S.C. Breeding to adapt agriculture to climate change: Affordable phenotyping solutions. Curr. Opin. Plant Biol. 2018, 45, 237–247. [Google Scholar] [CrossRef]
  8. Araus, J.L.; Cairns, J.E. Field high-throughput phenotyping: The new crop breeding frontier. Trends Plant Sci. 2014, 19, 52–61. [Google Scholar] [CrossRef]
  9. Condon, A.G.; Richards, R.A.; Rebetzke, G.J.; Farquhar, G.D. Breeding for high water-use efficiency. J. Exp. Bot. 2004, 55, 2447–2460. [Google Scholar] [CrossRef] [Green Version]
  10. Evans, R.D. Physiological mechanisms influencing plant nitrogen isotope composition. Trends Plant Sci. 2001, 6, 121–126. [Google Scholar] [CrossRef]
  11. Rossato, L. Nitrogen storage and remobilization in Brassicanapus L. during the growth cycle: Effects of methyl jasmonate on nitrate uptake, senescence, growth, and VSP accumulation. J. Exp. Bot. 2002, 53, 1131–1141. [Google Scholar] [CrossRef] [PubMed]
  12. Malagoli, P.; Laine, P.; Rossato, L.; Ourry, A. Dynamics of nitrogen uptake and mobilization in field-grown winter oil seed rape (Brassicanapus) from stem extension to harvest: I. Global N flows between vegetative and reproductive tissues in relation to leaf fall and their residual N. Ann. Bot. 2005, 95, 853–861. [Google Scholar] [CrossRef] [PubMed] [Green Version]
  13. Peterson, B.J.; Fry, B. Stable isotopes in ecosystem studies. Annu. Rev. Ecol. Syst. 1987, 18, 293–320. [Google Scholar] [CrossRef]
  14. United Nations Economic Commission for Europe (UNECE) Fresh Fruit and Vegetables-Standards. Available online: https://unece.org/trade/wp7/FFV-Standards (accessed on 20 April 2022).
  15. Konica, M.O. Chlorophyll Meter SPAD-502 Plus-A Lightweight Handheld Meter for Measuring the Chlorophyll Content of Leaves without Causing Damage to Plants. 2012. Available online: http://www.konikcaminolta.com/instrments/download/catalog/color/pdf/spad502plus_e1.pdf (accessed on 12 March 2019).
  16. Kaufmann, H.; Segl, K.; Itzerott, S.; Bach, H.; Wagner, A.; Hill, J.; Müller, A. Hyperspectral Algorithms: Report in the Frame of EnMAP Preparation Activities; Potsdam: Darst, Germany, 2010. [Google Scholar]
  17. Cerovic, Z.G.; Masdoumier, G.; Ghozlen, N.B.; Latouche, G. A new optical leaf-clip meter for simultaneous non-destructive assessment of leaf chlorophyll and epidermal flavonoids. Physiol. Plant. 2012, 146, 251–260. [Google Scholar] [CrossRef]
  18. Cerovic, Z.G.; Ghozlen, N.B.; Milhade, C.; Obert, M.; Debuisson, S.; Le Moigne, M. Nondestructive Diagnostic Test for Nitrogen Nutrition of Grapevine (Vitis vinifera L.) Based on Dualex Leaf-Clip Measurements in the Field. J. Agric. Food Chem. 2015, 63, 3669–3680. [Google Scholar] [CrossRef]
  19. Gracia-Romero, A.; Kefauver, S.C.; Fernandez-Gallego, J.A.; Vergara-Díaz, O.; Nieto-Taladriz, M.T.; Araus, J.L. UAV and ground image-based phenotyping: A proof of concept with Durum wheat. Remote Sens. 2019, 11, 1244. [Google Scholar] [CrossRef] [Green Version]
  20. Kefauver, S.; Kerfal, S.; Fernandez Gallego, J.A.; El-Haddad, G. CerealScanner Gitlab. Available online: https://gitlab.com/sckefauver/cerealscanner (accessed on 14 March 2019).
  21. Zaman-Allah, M.; Vergara, O.; Araus, J.L.; Tarekegne, A.; Magorokosho, C.; Zarco-Tejada, P.J.; Hornero, A.; Albà, A.H.; Das, B.; Craufurd, P.; et al. Unmanned aerial platform-based multi-spectral imaging for field phenotyping of maize. Plant Methods 2015, 11, 35. [Google Scholar] [CrossRef] [Green Version]
  22. Hunt, E.R.; Cavigelli, M.; Daughtry, C.S.; Mcmurtrey, J.E.; Walthall, C.L. Evaluation of digital photography from model aircraft for remote sensing of crop biomass and nitrogen status. Precis. Agric. 2005, 6, 359–378. [Google Scholar] [CrossRef]
  23. Hunt, E.R.; Doraiswamy, P.C.; Mcmurtrey, J.E.; Daughtry, C.S.T.; Perry, E.M.; Akhmedov, B. A visible band index for remote sensing leaf chlorophyll content at the canopy scale. Int. J. Appl. Earth Obser. Geoinf. 2013, 21, 103–112. [Google Scholar] [CrossRef] [Green Version]
  24. Vergara-Díaz, O.; Zaman-Allah, M.A.; Masuka, B.; Hornero, A.; Zarco-Tejada, P.; Prasanna, B.M.; Araus, J.L. A novel remote sensing approach for prediction of maize yield under different conditions of nitrogen fertilization. Front. Plant Sci. 2016, 7, 666. [Google Scholar] [CrossRef] [Green Version]
  25. Stern, A.; Doraiswamy, P.C.; Hunt Jr, E.R. Changes of crop rotation in Iowa determined from the United States Department of Agriculture, National Agricultural Statistics Service cropland data layer product. J. Appl. Remote Sens. 2012, 6, 063590. [Google Scholar] [CrossRef]
  26. Hunt, E.R.; Daughtry, C.S.T.; Eitel, J.U.; Long, D.S. Remote sensing leaf chlorophyll content using a visible band index. Agron. J. 2011, 103, 1090–1099. [Google Scholar] [CrossRef] [Green Version]
  27. Montague, T.; Hellman, E.; Krawitzky, M. Comparison of greenhouse grown, containerized grapevine stomatal conductance measurements using two differing porometers. In Proceedings of the 2nd Annual National Viticulture Research Conference, Davis, CA, USA, 9–11 July 2008; pp. 58–61. [Google Scholar]
  28. Silva-Sánchez, A.; Buil-Salafranca, J.; Cabral, A.C.; Uriz-Ezcaray, N.; García-Mendívil, H.A.; Sorribas, F.J.; Gracia-Romero, A. Comparison of proximal remote sensing devices for estimating physiological responses of eggplants to root-knot nematodes. Proceedings 2019, 18, 9. [Google Scholar]
  29. Duncan, G.A.; Gates, R.; Montross, M.D. Measuring Relative Humidity in Agricultural Environments; Agricultural Engineering Extension Publications-Uknowledge: Lexington, KY, USA, 2005. [Google Scholar]
  30. Cabrera-Bosquet, L.; Albrizio, R.; Nogues, S.; Araus, J.L. Dual Delta 13C/delta 18O response to water and nitrogen availability and its relationship with yield in field-grown durum wheat. Plant Cell Environ. 2011, 34, 418–433. [Google Scholar] [CrossRef] [PubMed]
  31. Yousfi, S.; Serret, M.D.; Araus, J.L. Comparative response of d13C, d18O and d15N in durum wheat exposed to salinity at the vegetative and reproductive stages. Plant Cell Environ. 2013, 36, 1214–1227. [Google Scholar] [CrossRef]
  32. Fernandez-Gallego, J.A.; Kefauver, S.C.; Gutiérrez, N.A.; Nieto-Taladriz, M.T.; Araus, J.L. Wheat ear counting in-field conditions: High throughput and low-cost approach using RGB images. Plant Methods 2018, 14, 1–12. [Google Scholar] [CrossRef] [Green Version]
  33. Miguel, A.; Maroto, J.V.; San Bautista, A.; Baixauli, C.; Cebolla, V.; Pascual, B.; Guardiola, J.L. The grafting of triploid watermelon is an advantageous alternative to soil fumigation by methyl bromide for control of Fusarium wilt. Sci. Hortic. 2004, 103, 9–17. [Google Scholar] [CrossRef]
  34. Casadesus, J.; Kaya, Y.; Bort, J.; Nachit, M.M.; Araus, J.L.; Amor, S.; Ferrazzano, G.; Maalouf, F. Using vegetation indices derived from conventional digital cameras as selection criteria for wheat breeding in water-limited environments. Ann. Appl. Biol. 2007, 150, 227–236. [Google Scholar] [CrossRef]
  35. De Guiran, G. Protection des Cultures Maraîchères et Fruitières Face Aux Capacités D’adaptation des Nématodes Meloidogyne; Comptes Rendus de l’Académie d’agriculture: Paris, France, 1983. [Google Scholar]
  36. Feng, X.; Zhan, Y.; Wang, Q.; Yang, X.; Yu, C.; Wang, H.; He, Y. Hyperspectral imaging combined with machine learning as a tool to obtain high-throughput plant salt-stress phenotyping. Plant J. 2020, 101, 1448–1461. [Google Scholar] [CrossRef]
  37. Yang, M.D.; Tseng, H.H.; Hsu, Y.C.; Tsai, H.P. Semantic segmentation using deep learning with vegetation indices for rice lodging identification in multi-date UAV visible images. Remote Sens. 2020, 12, 633. [Google Scholar] [CrossRef] [Green Version]
  38. Sinclair, T.R.; Rufty, T.W. Nitrogen and water resources commonly limit crop yield increases, not necessarily plant genetics. Glob. Food Secur. 2012, 1, 94–98. [Google Scholar] [CrossRef]
  39. Munné-Bosch, S.; Queval, G.; Foyer, C.H. The impact of global change factors on redox signaling underpinning stress tolerance. Plant Physiol. 2013, 161, 5–19. [Google Scholar] [CrossRef] [PubMed] [Green Version]
  40. Giné, A.; González, C.; Serrano, L.; Sorribas, F.J. Population dynamics of Meloidogyne incognita on cucumber grafted onto the Cucurbita hybrid RS841 or non-grafted and yield losses under protected cultivation. Eur. J. Plant Pathol. 2017, 148, 795–805. [Google Scholar] [CrossRef] [Green Version]
  41. Expósito, A.; Pujolà, M.; Achaerandio, I.; Giné, A.; Escudero, N.; Fullana, A.M.; Cunquero, M.; Loza-Alvarez, P.; Sorribas, F.J. Tomato and melon Meloidogyne resistant rootstocks improve crop yield but melon fruit quality is influenced by the cropping season. Front. Plant Sci. 2020, 1742. [Google Scholar] [CrossRef] [PubMed]
  42. Goverse, A.; Smant, G. The activation and suppression of plant innate immunity by parasitic nematodes. Ann Rev. Phytopath. 2014, 52, 243–265. [Google Scholar]
  43. Haverkort, A.J.; Valkenburg, G.W. The influence of cyst nematodes and drought on potato growth. 3. Effects on carbon isotope fractionation. Neth. J. Plant Pathol. 1992, 98, 12–20. [Google Scholar] [CrossRef]
  44. Rivard, C.L.; Louws, F.J. Grafting to manage soilborne diseases in heirloom tomato production. Hort Sci. 2008, 43, 2104–2111. [Google Scholar] [CrossRef] [Green Version]
  45. Guan, W.; Zhao, X.; Dickson, D.W.; Mendes, M.L.; Thies, J. Root-knot nematode resistance, yield, and fruit quality of specialty melons grafted onto Cucumis metulifer. Hort Sci. 2014, 49, 1046–1051. [Google Scholar] [CrossRef] [Green Version]
  46. Sigüenza, C.; Schochow, M.; Turini, T.; Ploeg, A. Use of Cucumis metuliferus as a rootstock for melon to manage Meloidogyne incognita. J. Nematol. 2005, 37, 276. [Google Scholar]
  47. Expósito, A.; Munera, M.; Giné, A.; López-Gómez, M.; Cáceres, A.; Picó, B.; Gisbert, C.; Medina, V.; Sorribas, F.J. Cucumis metuliferus is resistant to root-knot nematode Mi1.2 gene (a)virulent isolates and a promising melon rootstock. Plant Pathol. 2018, 67, 1161–1167. [Google Scholar] [CrossRef] [Green Version]
  48. Expósito, A.; García, S.; Giné, A.; Escudero, N.; Sorribas, F.J. Cucumis metuliferus reduces Meloidogyne incognita virulence against the Mi1.2 resistance gene in a tomato–melon rotation sequence. Pest Manag. Sci. 2019, 75, 1902–1910. [Google Scholar] [CrossRef]
  49. Bletsos, F.A. Use of grafting and calcium cyanamide as alternatives to methyl bromide soil fumigation and their effects on growth, yield, quality, and fusarium wilt control in melon. J. Phytopathol. 2005, 153, 155–161. [Google Scholar] [CrossRef]
  50. Tao, M.Q.; Jahan, M.S.; Hou, K.; Shu, S.; Wang, Y.; Sun, J.; Guo, S.-R. Bitter Melon (Momordica charantia L.) Rootstock Improves the Heat Tolerance of Cucumber by Regulating Photosynthetic and Antioxidant Defense Pathways. Plants 2020, 9, 692. [Google Scholar] [CrossRef] [PubMed]
  51. Abd-Elgawad, M.M. Biological control agents in the integrated nematode management of potato in Egypt. Egypt. J. Biol. Pest Control. 2020, 30, 1–13. [Google Scholar] [CrossRef]
  52. Gassmann, A.J.; Stock, S.P.; Sisterson, M.S.; Carrière, Y.; Tabashnik, B.E. Synergism between entomopathogenic nematodes and Bacillus thuringiensis crops: Integrating biological control and resistance management. J. Appl. Ecol. 2008, 45, 957–966. [Google Scholar] [CrossRef]
  53. Nisha, M.S.; Sheela, M.S. Bio-Management of Meloidogyne incognita on Coleus, Solenostemon rotundifolius by Integrating Solarization, Paecilomyces lilacinus, Bacillus macerans and Neemcake. Indian J. Nematol. 2006, 36, 136–138. [Google Scholar]
Figure 1. Satellite image of the experimental station of Agròpolis (The red box indicates the specific location of the research greenhouse).
Agronomy 12 01098 g001
Figure 2. The greenhouse at Agròpolis, place of realization of the experiments, showing rows of pepper plants (Capsicum annuum cv. Tinsena) from year 2019. Drip irrigation was used, and plastic mats were deployed between rows to limit weed growth.
Agronomy 12 01098 g002
Figure 3. Variation of (a) Greenseeker (NDVI), (b) RGB-based Triangular Greenness Index (TGI), (c) RGB-based Crop Senescence Index (CSI), (d) Nitrogen Balance Index (NBI), and (e) Flavonoid (Flav) values between two treatments (grafted, non-grafted) for four crops (melon, tomato, eggplant, pepper) during five years of experience (2016–2020). For melon, we present both the combined and separate analyses for 2016 and 2017. Concerning the tomato crop combined years and 2017 and 2020 are shown. The eggplant crop was studied for just one year (2018) as well as pepper (2019). NS: non-significant (p > 0.05), *: weakly significant (p < 0.05), **: significant (p < 0.01), ***: highly significant (p < 0.001).
Agronomy 12 01098 g003aAgronomy 12 01098 g003bAgronomy 12 01098 g003c
Table 1. General characteristics of Meloidogyne.
Size and DescriptionMicroscopic Soil Worm Measuring 0.3 mm Long (2nd Grade Juvenile Free
Stage in the Soil) at 0.7 mm (Female Obese Pear Shaped in the Root). Oral
Perforator Stylus [6].
ReproductionSexual or asexual (parthenogenesis) [1].
Life cycle3 weeks to 3 months (depending on temperature). Mandatory
endoparasite (inside the root). Eggs/juveniles/adults: 4 successive molts
–evolution, Female [1].
MultiplicationLays 300 to 1000 eggs per cycle, Several possible cycles per year = 300
to 200,000 eggs per year [1].
ConservationIn the form of eggs in the soil, between 5 and 30 cm deep [1].
SurvivalJuveniles live at least up to 15 days, depending on environmental conditions (pH, temperature, soil moisture, presence or not of plants). Eggs > 1 year, under certain conditions. Dispersion can be by humans (shoes, tools, machines) and by water at stage J2 [6]
WalesDamage to roots (gall index from 0 to 10). Wilting, withering or even death of plants [1].
Main hostsVegetables: asparagus, eggplant, vegetable beet, carrot, celery, chicory, cucumber, melon, pumpkin, zucchini, spinach, beans, lettuce, onion, pepper, tomato, potato, leek; rapeseed; cereals; fruit trees; flower crops; weeds including Rumex spp., amaranth, nightshade [6].
ProtectionProphylaxis: cleaning, disinfection of tools, no spreading potentially by waste or sludge. Physical protection: solarization, steam disinfection, soil flood. Biological protection: organic matter, bacteria, mushrooms, mycorrhizae. Chemical protection: pre- and post-planting, treatment seeds, plant extract Crop protection: rotation, trap plant, green manure “nematicide”, black fallow, bio-fumigation, anaerobic bio-disinfection Varietal protection: resistance, grafting [6].
Table 2. Indexes derived from the RGB cameras.
Target GroupIndexFormula
Vegetation CoverGreen Area (GA)60 < Hue < 180 [20]
Greener Area (GGA)80 < Hue <180 [20]
GreennessCrop Senescence Index (CSI)(GA-GGA)/GA [24]
Normalized Green-Red Difference Index (NGRDI)(R550-R670)/(R550 + R670) [25]
Triangular Greenness Index (TGI)−0.5[190(R670 − R550) −120(R670 − R480) [26]
Table 3. Mean and standard error of each crop combining values of repeated years of crops for three classes of parameters (leaf level pigments, canopy vigor and biomass, water stress and root health), n = 152.
ParametersMean Melon
2016 + 2017
n = 36 (20 + 16)
Mean Tomato
2017 + 2020
n = 56 (16 + 40)
Mean Eggplant
2018 n = 20
Mean pepper 2019
n = 40
Leaf level pigments
(SPAD, Dualex)
SPAD39.42 ± 1.1644.58 ± 0.9340.16 ± 1.5655.03 ± 1.10
Chl33.20 ± 0.6724.20 ± 0.5424.04 ± 0.9024.76 ± 0.64
Flav1.82 ± 0.040.69 ± 0.050.65 ± 0.040.66 ± 0.03
Anth0.17 ± 0.010.05 ± 0.020.02 ± 0.040.02 ± 0.02
NBI18.79 ± 0.8336.31 ± 0.6738.09 ± 1.1238.17 ± 0.79
Canopy vigor, biomass (GA and GGA up to RGB)NDVI0.41 ± 0.020.39 ± 0.040.64 ± 0.030.39 ± 0.02
GA0.43 ± 0.030.37 ± 0.020.68 ± 0.040.07 ± 0.03
GGA0.22 ± 0.030.49 ± 0.020.48 ± 0.030.06 ± 0.02
NGRDI−0.60 ± 0.361.46 ± 0.290.05 ± 0.48−0.13 ± 0.35
TGI6300.72 ± 603.654525.35 ± 4843601.41 ± 809.89895.58 ± 588.37
CSI50.09 ± 2.5817.45 ± 2.0731.63 ± 3.4619.29 ± 2.45
Water stress and root healthPorometer102.60 ± 5.89123.21 ± 4.72
Temp25.18 ± 0.2724.36 ± 0.2225.53 ± 0.3626.67 ± 0.26
δ13C14.16 ± 1.13−30.57 ± 0.89−30.19 ± 1.54−29.58 ± 1.06
Percent C21.12 ± 1.3536.81 ± 1.0737.94 ± 1.8426.63 ± 1.26
δ15N4.02 ± 0.304.63 ± 0.246.05 ± 0.417.12 ± 0.28
Percent N1.16 ± 0.133.31 ± 0.102.96 ± 0.181.96 ± 0.12
Table 4. ANOVA of three classes of parameters (leaf level pigments, canopy vigor and biomass, water stress and root health) achieved for four crops (melon, tomato, eggplant, pepper) with two treatments (grafted, non-grafted) n = 152 for an experience during five years (2016–2020) under greenhouse in soil infected by root-knot nematode in order to show the role of grafting in the protection of plant and reduce the effect of this pest. We also show the effect separately of crop, treatments, and the interaction of both. SPAD (Soil Plant Analysis Development), Chl (chlorophyll), Flav (flavonoid), Anth (anthocyanin), NBI (Nitrogen Balance Index), GA (Green area), GGA (Greener Green Area), TGI (Triangular Greenness Index), NGRDI (Normalized Green Red Difference Index), CSI (Crop Senescence Index), δ13C (isotopic composition of carbon 13), percent C (percentage of carbon), δ15N (isotopic composition of nitrogen 15), and percent N (percentage of nitrogen), *: Interaction between variables.
Parametersp Value Treatments
(Grafted, Non-Grafted)
p Value Interaction
(Crop * Treatments)
Leaf level pigments (SPAD and Dualex)SPAD0.1100.380
Chl0.1400.066
Flav0.0030.002
Anth0.6070.565
NBI0.0600.044
Canopy vigor, biomass
(GA and GGA up to RGB)
NDVI0.7680.004
GA0.7250.606
GGA0.1020.810
NGRDI0.4740.889
TGI0.3220.810
CSI0.0010.002
Water stress and
root health
Porometer0.7240.267
Temperature0.1780.654
δ13C0.8190.984
Percent C0.7020.925
δ15N0.3350.121
Percent N0.7930.210
Table 5. Variation of crop yield between grafted and non-grafted plants for the different species cultivated during the different years, *: ANOVA test significance p ≤ 0.05.
Crop Yield (kg/plant)
YearCropGraftedNon-grafted
2016Melon0.8 ± 0.20.1 ± 0.1 *
2017Melon3.1 ± 0.30.3 ± 0.1 *
Tomato2.9 ± 0.22.0 ± 0.2 *
2018Eggplant4.0 ± 0.41.9 ± 0.2 *
2019Pepper0.4 ± 0.0020.2 ± 0.05
2020TomatoResistant cv. CarambaSusceptible cv. Durinta
1.6 ± 0.012.2 ± 0.2 *
Publisher’s Note: MDPI stays neutral with regard to jurisdictional claims in published maps and institutional affiliations.

