
Exogenous Applications of Spermidine Improve Drought Tolerance in Seedlings of the Ornamental Grass Hordeum jubatum in Northeast China

 , ,
, ,
Abstract
:1. Introduction
2. Materials and Methods
2.1. Plant Material and Stress Conditions
2.2. Growth Measurements
2.3. Gas Exchange Measurements
2.4. Chlorophyll Fluorescence Parameter Measurements
2.5. Malondialdehyde (MDA) Content Measurements
2.6. Protein Content Measurements
2.7. Proline Content Measurements
2.8. Soluble Sugar Content Measurements
2.9. Antioxidant Enzyme Activity Measurements
2.10. Statistical Analysis
3. Results
3.1. Growth
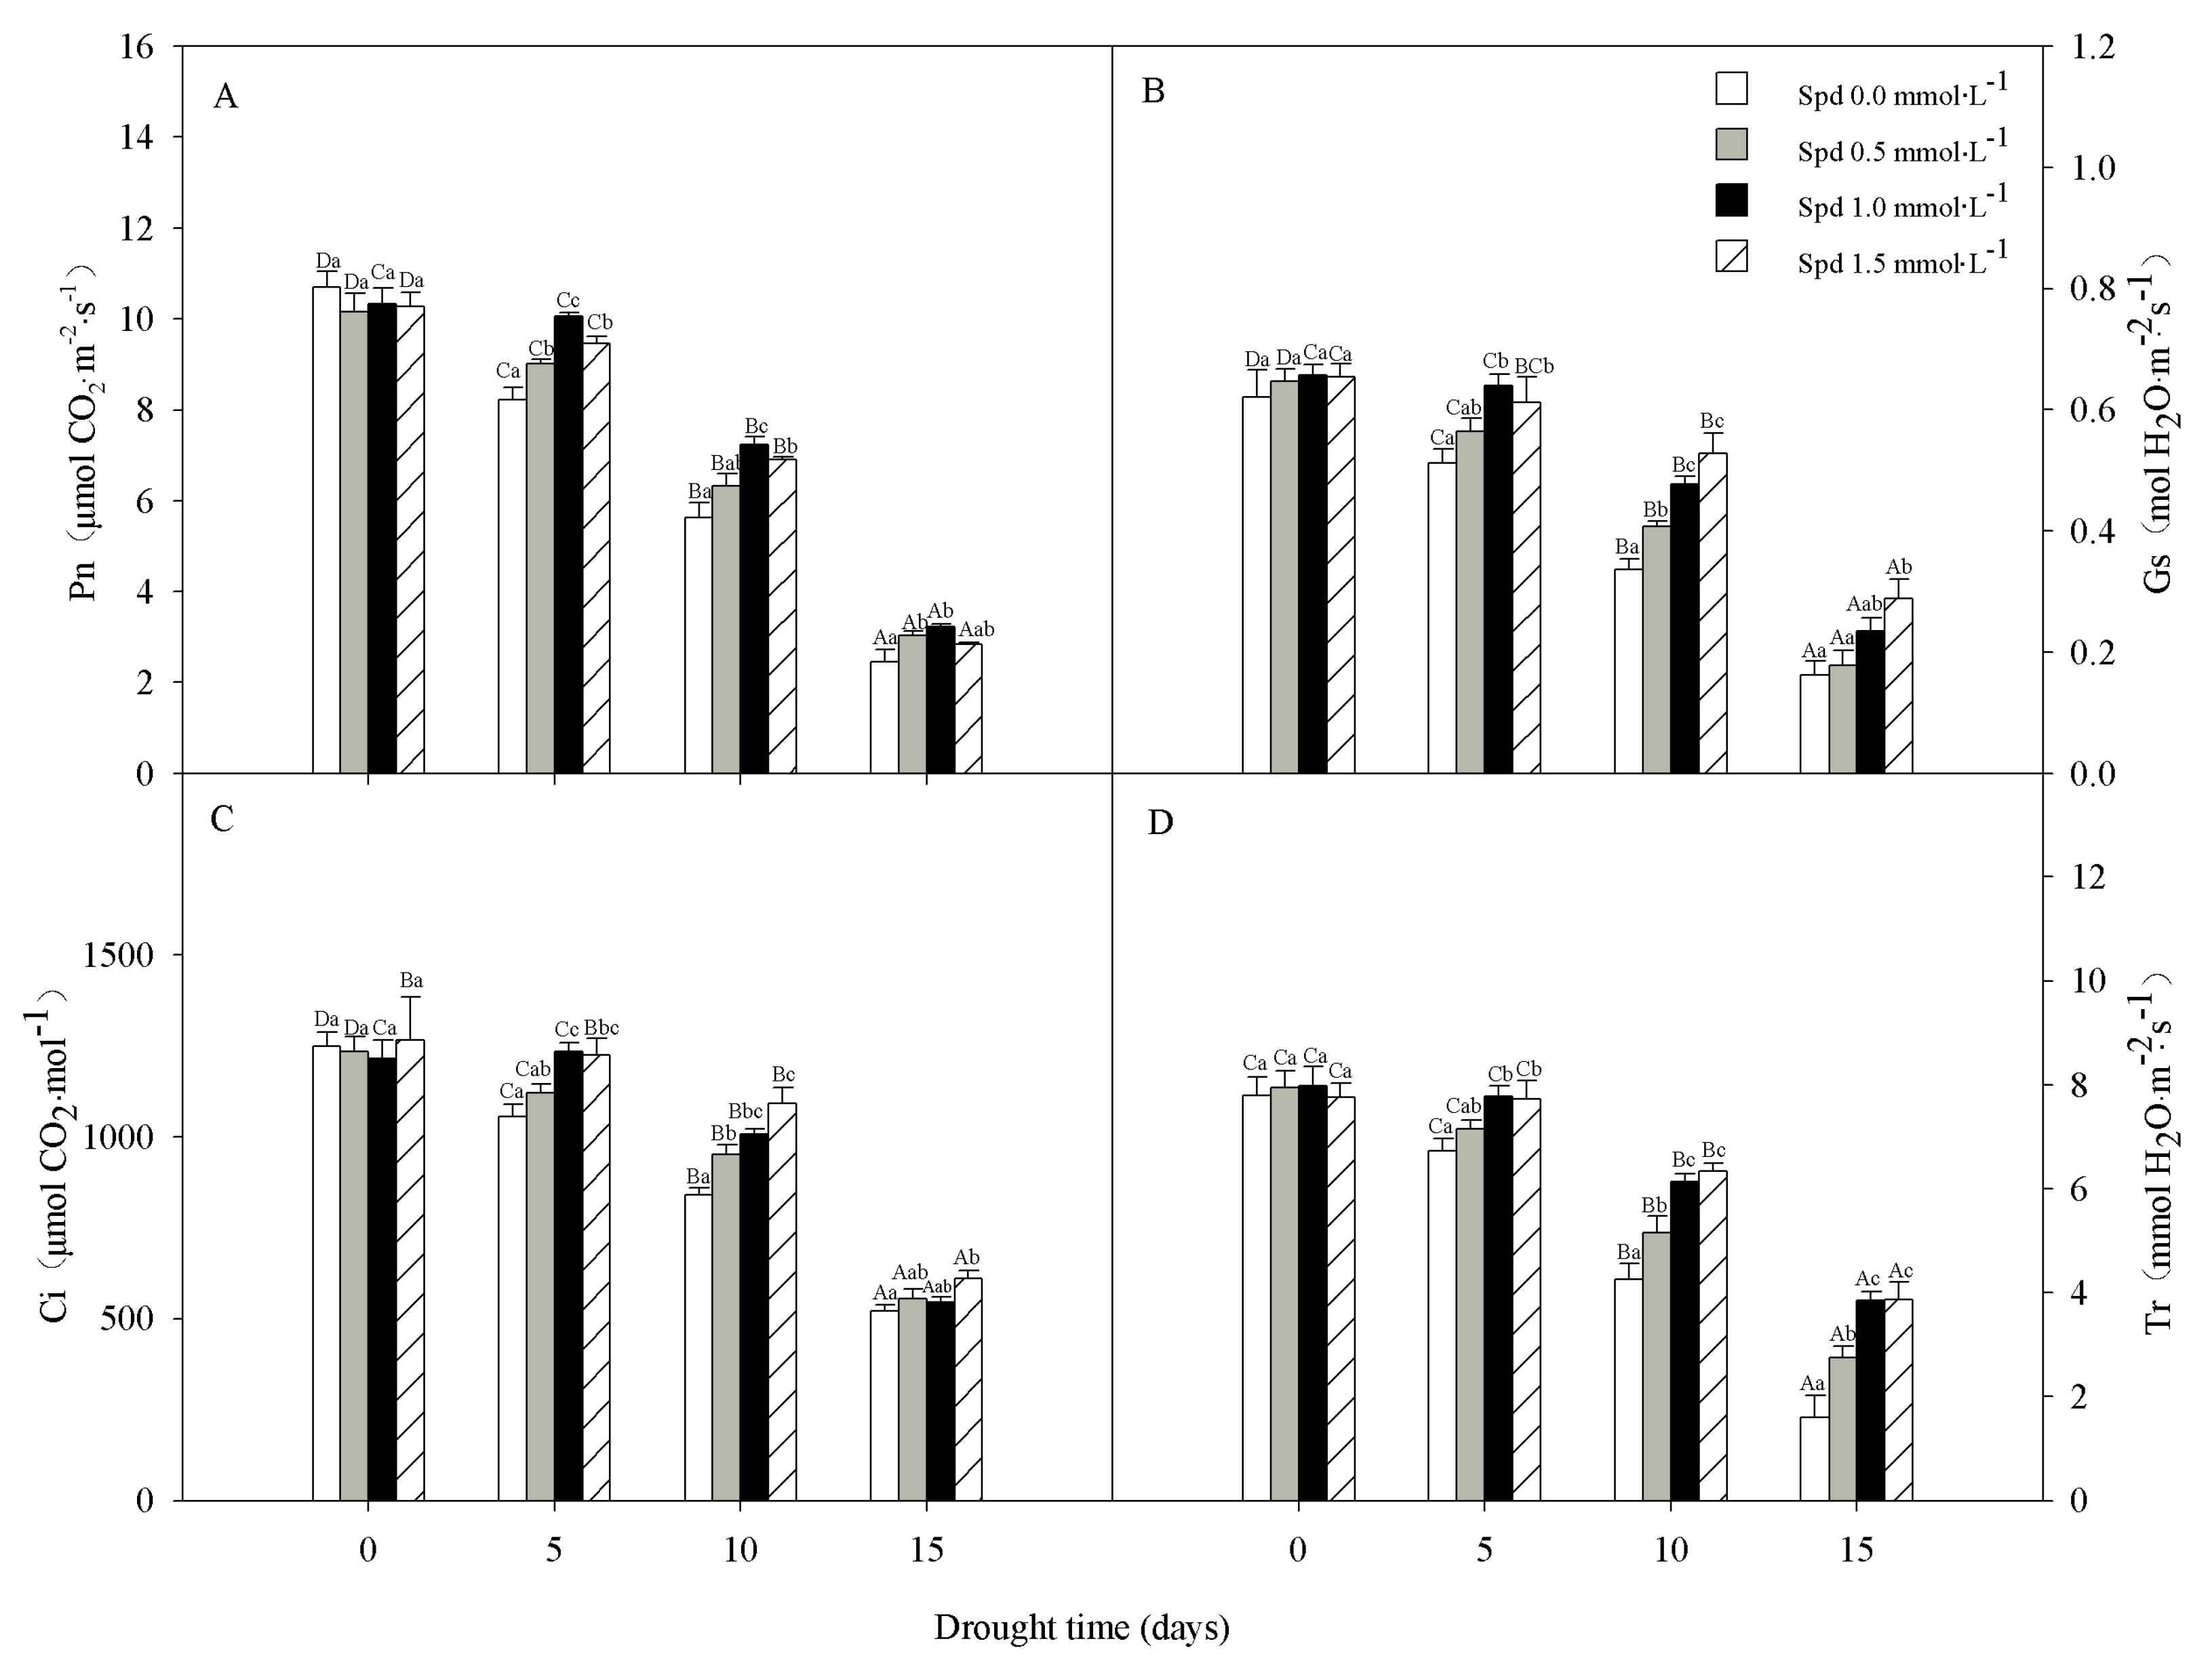
3.2. Photosynthesis
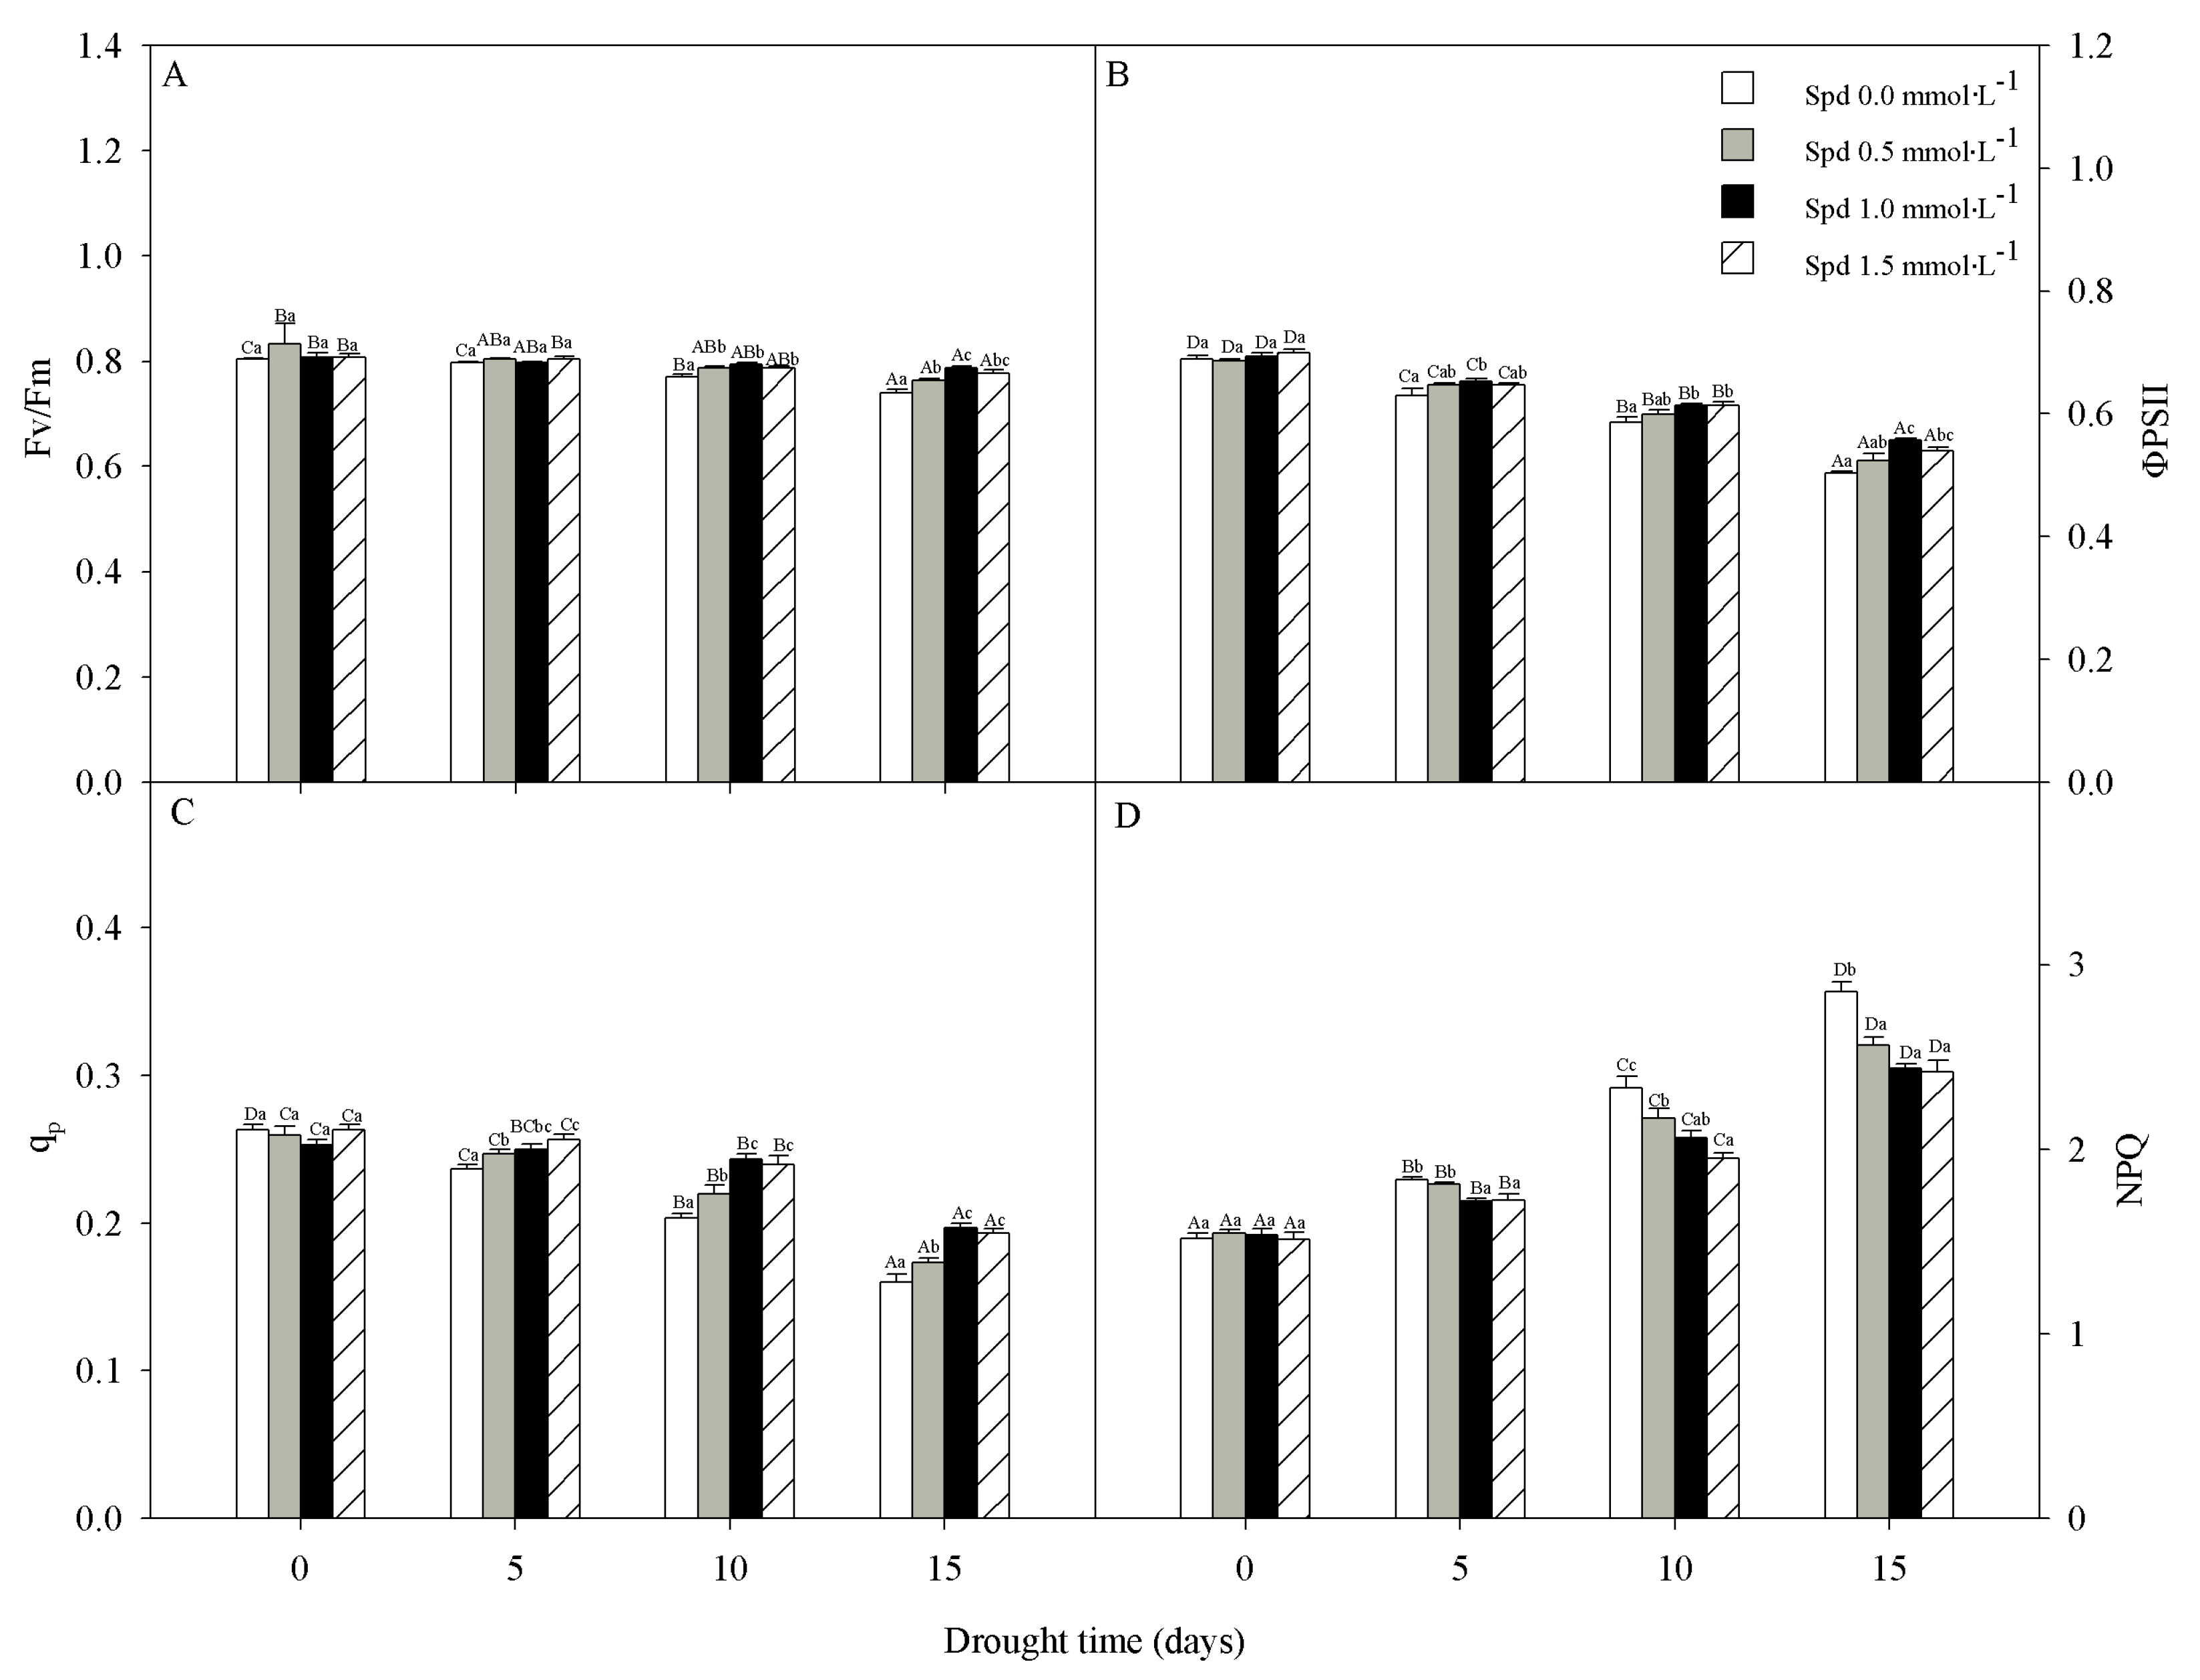
3.3. Chlorophyll Fluorescence
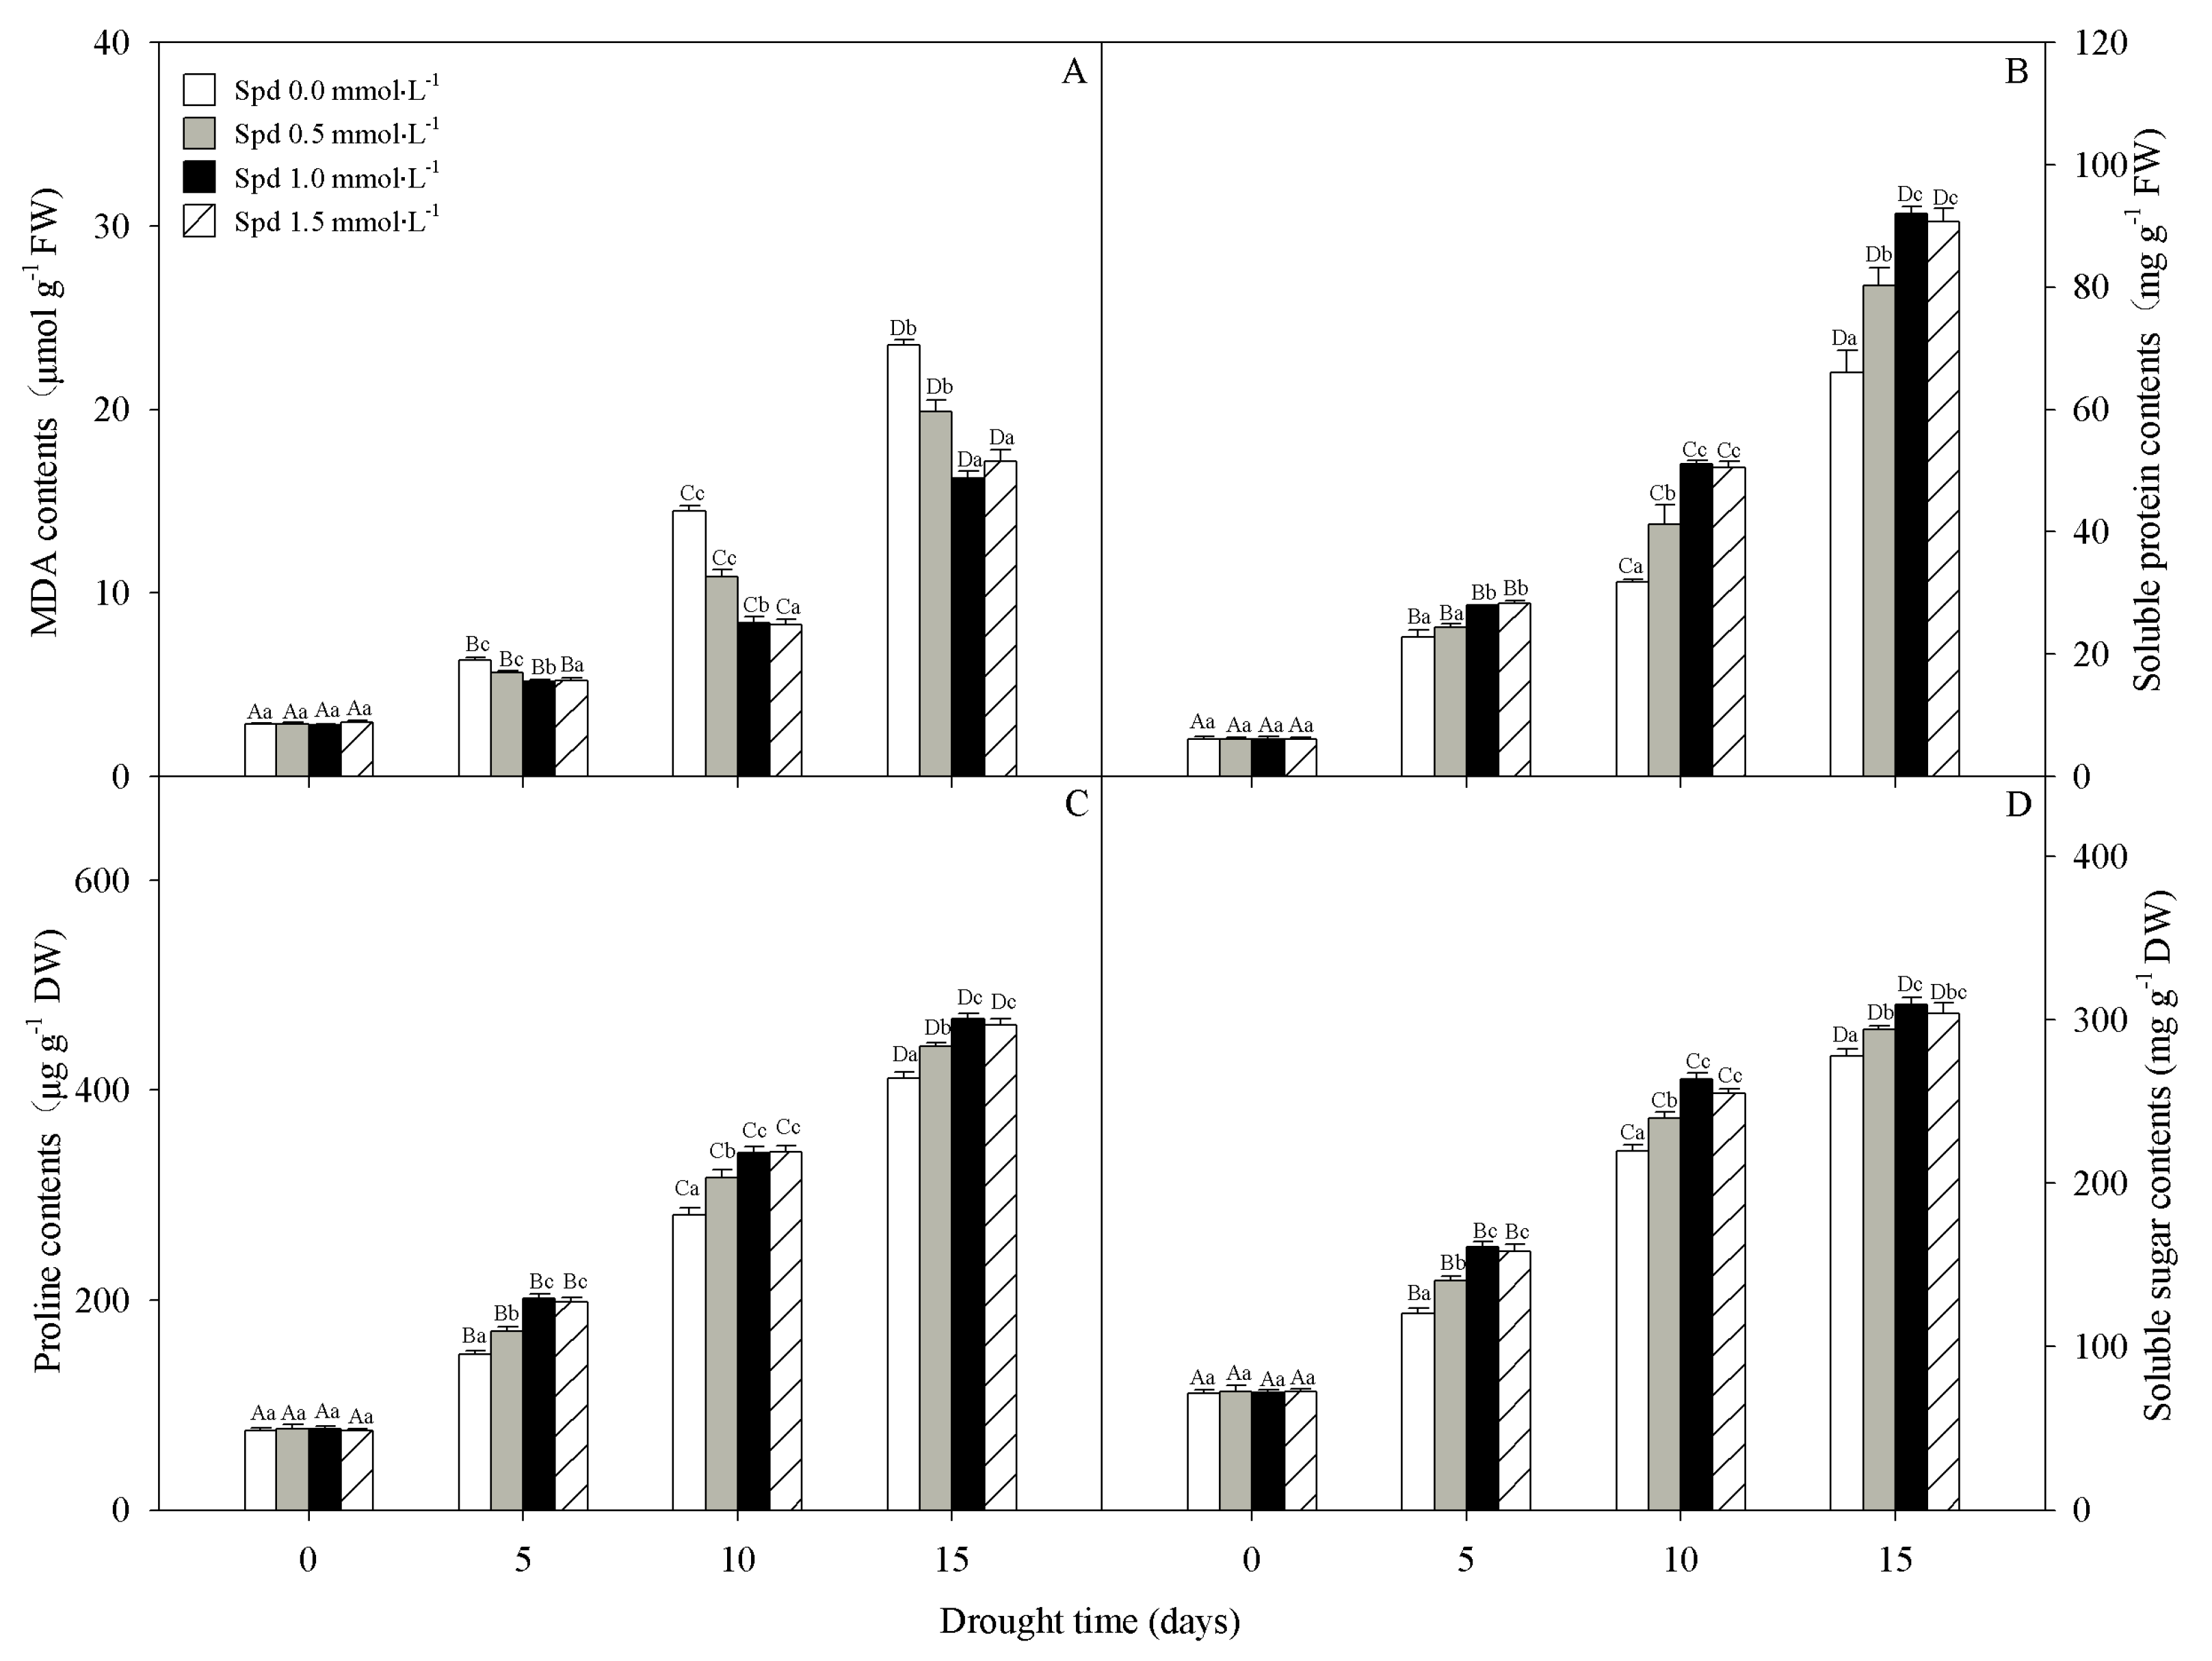
3.4. Lipid Peroxidation and Osmolyte Accumulation
3.5. Antioxidant Enzyme Activities
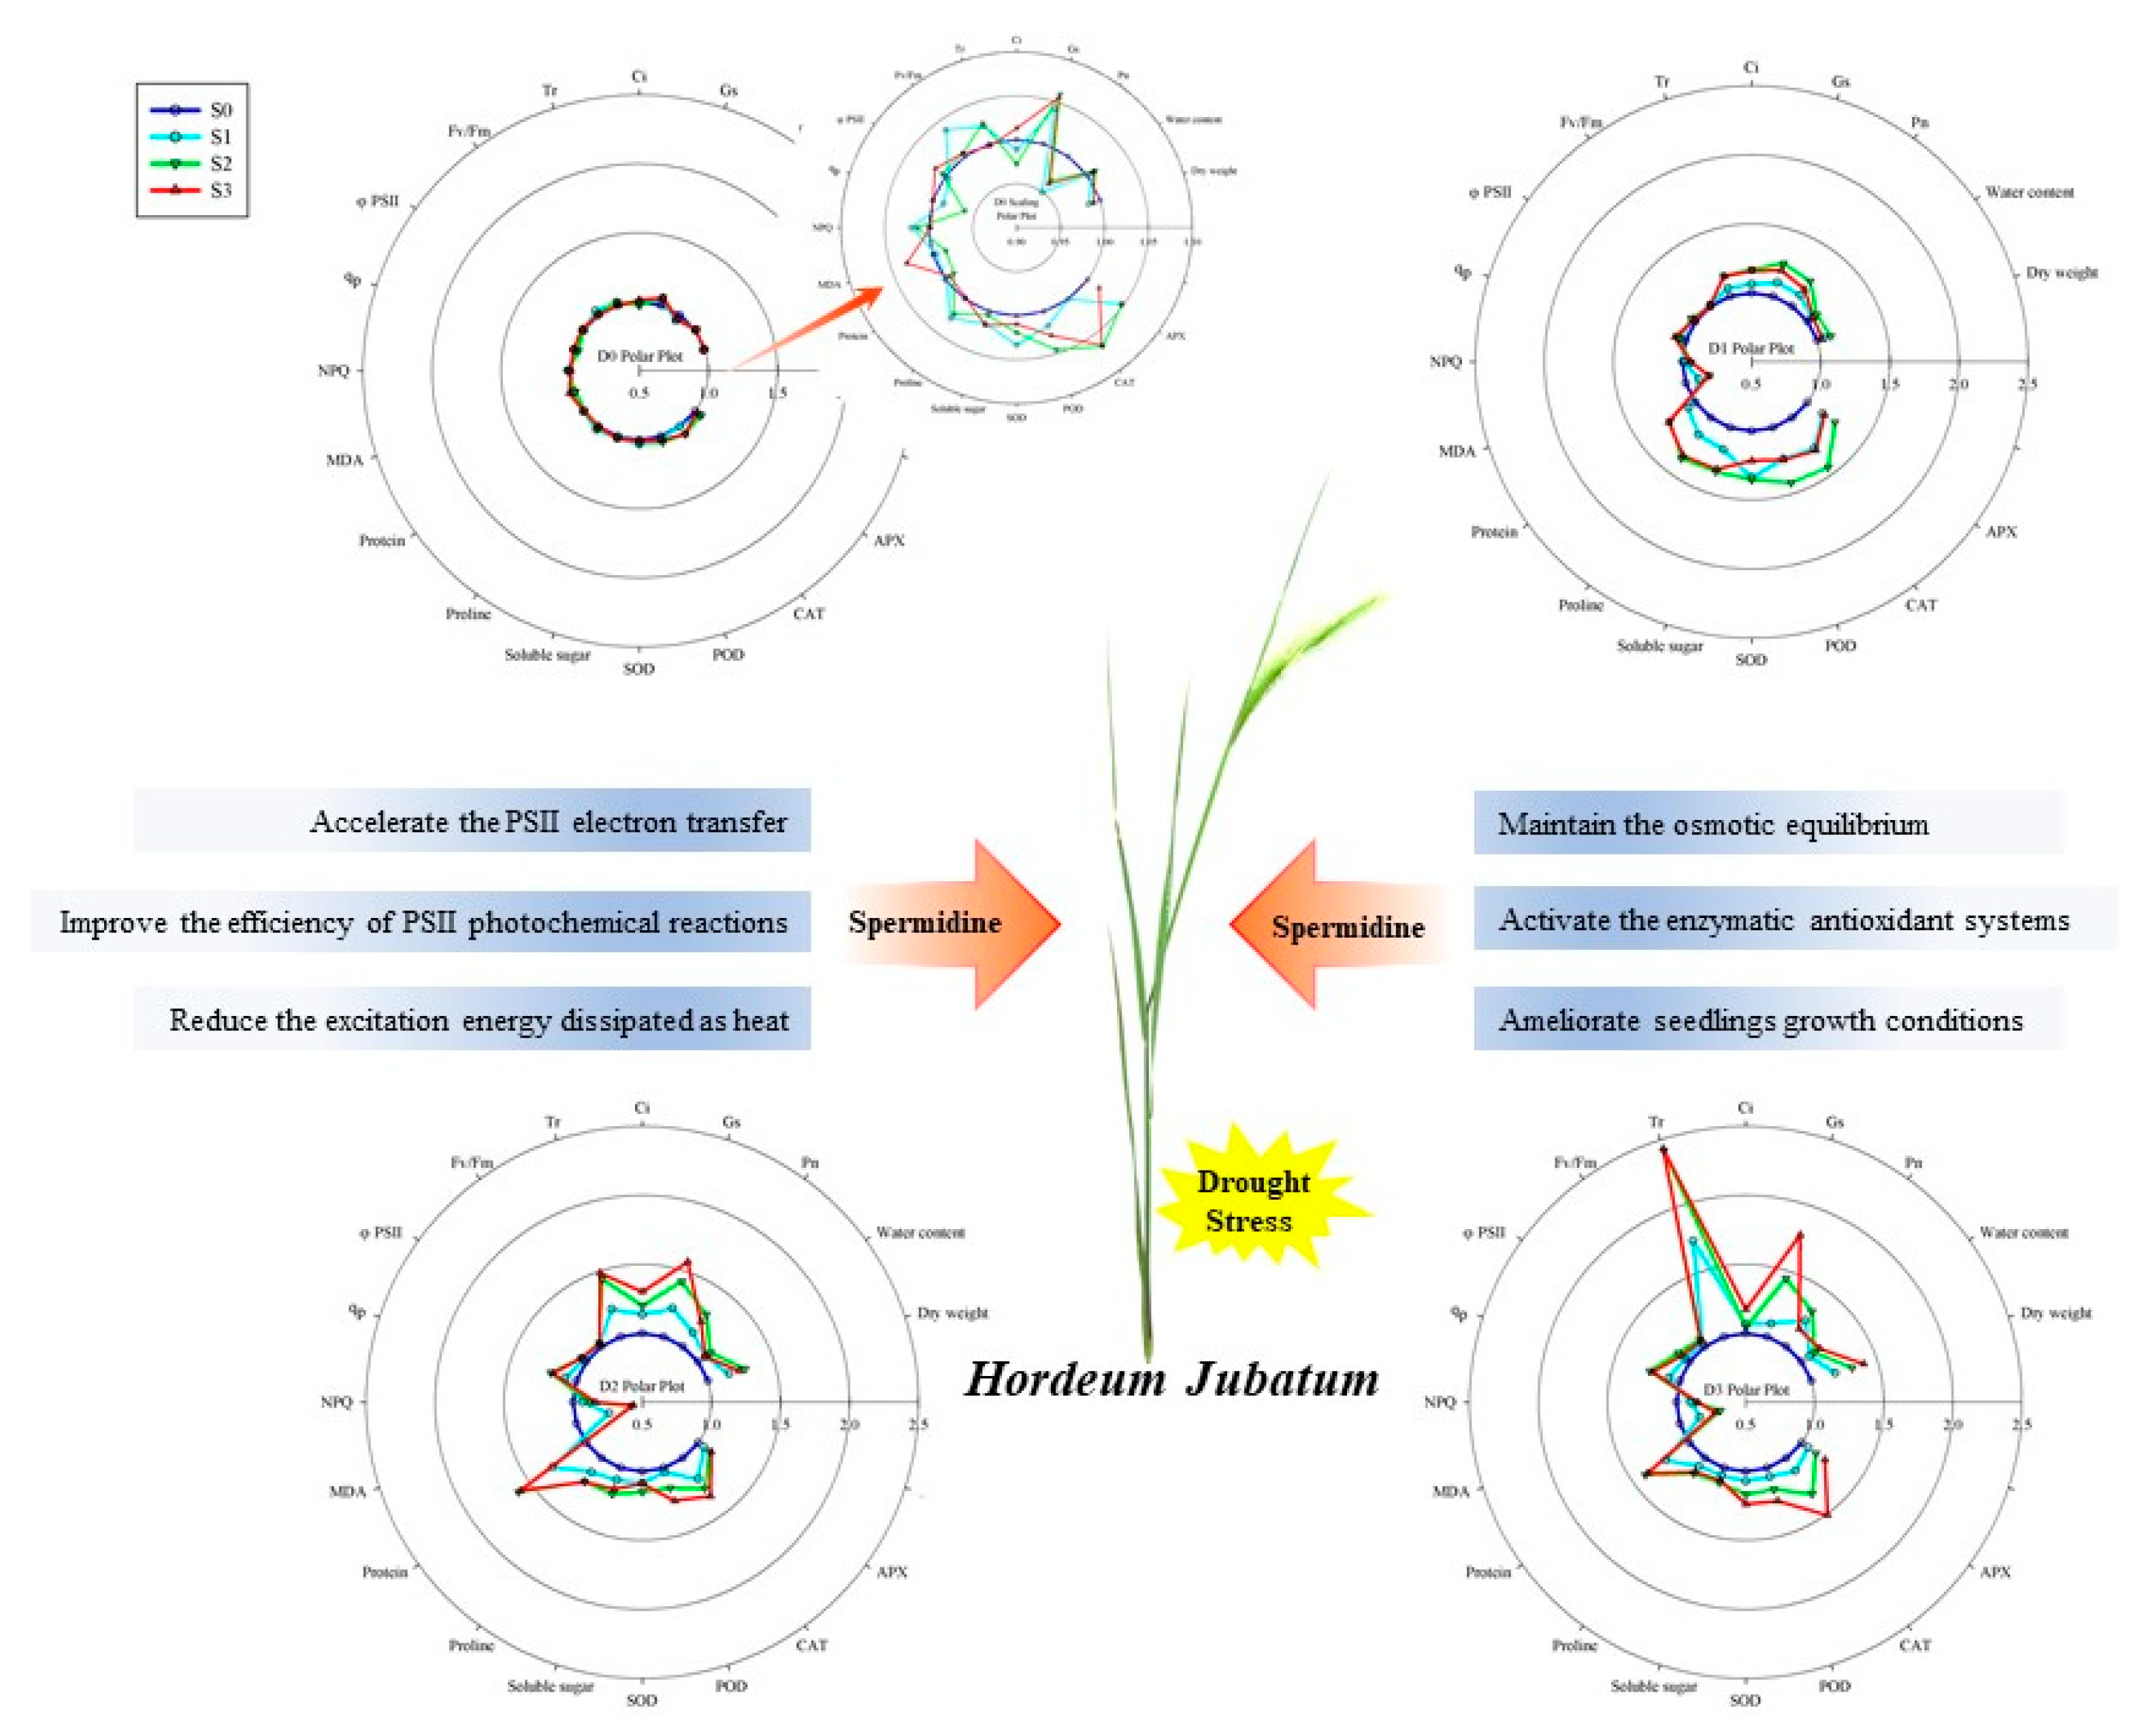
4. Discussion
5. Conclusions
Author Contributions
Funding
Data Availability Statement
Acknowledgments
Conflicts of Interest
Appendix A

| Chemicals | Formula | Manufacturers |
|---|---|---|
| Hydrogen peroxide | H2O2 | Merck |
| Spermidine | C7H19N3 | Crovell |
| Trichloroacetic acid | C2HCl3O2 | Mayao |
| Thiobarbituric acid | C4H4N2O2S | Amitychem |
| Ethylenediamine tetraacetic acid | C10H16N2O8 | Damao |
| Polyvinyl pyrrolidone | C13H16O4 | Crovell |
| Ninhydrin | C9H6O4 | Amitychem |
| Sulfosalicylic acid | C7H6O6S | Crovell |
| Glacial acetic acid | C2H4O2 | Yingruida |
| Toluene | C6H5CH3 | Merck |
| Ethanol | C2H6O | Jiaoze |
| Anthrone | C14H10O | Beierka |
| Guaiacol | C7H8O2 | Longfei |
| Nitro blue tetrazolium | C40H30Cl2N10O6 | Amitychem |
Appendix B
Appendix B.1
| Correlations | DW | WC | PN | Gs | Ci | Tr | Fv/Fm | ϕPSII | qp | NPQ | MDA | SP | Proline | SS | SOD | POD | CAT | APX |
|---|---|---|---|---|---|---|---|---|---|---|---|---|---|---|---|---|---|---|
| DW | 1 | |||||||||||||||||
| WC | 0.938 | 1 | ||||||||||||||||
| PN | 0.905 | 0.994 ** | 1 | |||||||||||||||
| Gs | 0.842 | 0.974 * | 0.991 ** | 1 | ||||||||||||||
| Ci | 0.736 | 0.921 | 0.954 * | 0.985 * | 1 | |||||||||||||
| Tr | 0.733 | 0.921 | 0.953 * | 0.984 * | 0.999 ** | 1 | ||||||||||||
| Fv/Fm | −0.113 | 0.09 | 0.075 | 0.133 | 0.191 | 0.221 | 1 | |||||||||||
| ϕPSII | 0.971 * | 0.912 | 0.862 | 0.797 | 0.687 | 0.691 | 0.087 | 1 | ||||||||||
| qp | 0.496 | 0.758 | 0.79 | 0.851 | 0.905 | 0.916 | 0.579 | 0.529 | 1 | |||||||||
| NPQ | −0.668 | −0.866 | −0.915 | −0.956 * | −0.987 * | −0.983 * | −0.099 | −0.586 | −0.869 | 1 | ||||||||
| MDA | −0.763 | −0.938 | −0.956 * | −0.979 * | −0.982 * | −0.987 * | −0.327 | −0.757 | −0.935 | 0.94 | 1 | |||||||
| SP | 0.644 | 0.861 | 0.908 | 0.954 * | 0.991 ** | 0.989 * | 0.193 | 0.583 | 0.912 | −0.995 ** | −0.958 * | 1 | ||||||
| Proline | 0.755 | 0.934 | 0.962 * | 0.989 * | 0.999 ** | 0.999 ** | 0.219 | 0.716 | 0.911 | −0.977 * | −0.990 ** | 0.984 * | 1 | |||||
| SS | 0.768 | 0.942 | 0.964 * | 0.988 * | 0.992 ** | 0.995 ** | 0.271 | 0.746 | 0.922 | −0.959 * | −0.998 ** | 0.971 * | 0.997 ** | 1 | ||||
| SOD | 0.875 | 0.865 | 0.811 | 0.762 | 0.67 | 0.683 | 0.355 | 0.961 * | 0.631 | −0.547 | −0.777 | 0.57 | 0.707 | 0.751 | 1 | |||
| POD | 0.960 * | 0.994 ** | 0.977 * | 0.946 | 0.878 | 0.88 | 0.106 | 0.950 * | 0.72 | −0.81 | −0.911 | 0.806 | 0.896 | 0.911 | 0.909 | 1 | ||
| CAT | 0.933 | 0.991 ** | 0.975 * | 0.951 * | 0.892 | 0.896 | 0.192 | 0.939 | 0.771 | −0.819 | −0.935 | 0.824 | 0.911 | 0.93 | 0.921 | 0.996 ** | 1 | |
| APX | 0.949 | 0.998 ** | 0.985 * | 0.959 * | 0.898 | 0.9 | 0.116 | 0.936 | 0.745 | −0.834 | −0.927 | 0.831 | 0.914 | 0.928 | 0.896 | 0.999 ** | 0.997 ** | 1 |
Appendix B.2
| Correlations | DW | WC | PN | Gs | Ci | Tr | Fv/Fm | ϕPSII | qp | NPQ | MDA | SP | Proline | SS | SOD | POD | CAT | APX |
|---|---|---|---|---|---|---|---|---|---|---|---|---|---|---|---|---|---|---|
| DW | 1 | |||||||||||||||||
| WC | 0.945 | 1 | ||||||||||||||||
| PN | 0.989 * | 0.931 | 1 | |||||||||||||||
| Gs | 0.903 | 0.712 | 0.902 | 1 | ||||||||||||||
| Ci | 0.879 | 0.677 | 0.860 | 0.991 ** | 1 | |||||||||||||
| Tr | 0.956 * | 0.811 | 0.960 * | 0.987 * | 0.966 * | 1 | ||||||||||||
| Fv/Fm | 0.970 * | 0.980 * | 0.935 | 0.787 | 0.775 | 0.862 | 1 | |||||||||||
| ϕPSII | 0.980 * | 0.864 | 0.980 * | 0.968 * | 0.944 | 0.995 ** | 0.904 | 1 | ||||||||||
| qp | 0.977 * | 0.876 | 0.991 ** | 0.949 | 0.913 | 0.987 * | 0.897 | 0.995 ** | 1 | |||||||||
| NPQ | −0.899 | −0.705 | −0.888 | −0.998 ** | −0.998 ** | −0.980 * | −0.791 | −0.961 * | −0.937 | 1 | ||||||||
| MDA | −0.984 * | −0.873 | −0.972 * | −0.963 * | −0.949 | −0.989 * | −0.924 | −0.996 ** | −0.984 * | 0.962 * | 1 | |||||||
| SP | 0.983 * | 0.874 | 0.985 * | 0.961 * | 0.935 | 0.993 ** | 0.909 | 1.000 ** | 0.997 ** | −0.954 * | −0.995 ** | 1 | ||||||
| Proline | 0.985 * | 0.874 | 0.970 * | 0.961 * | 0.949 | 0.987 * | 0.927 | 0.995 ** | 0.982 * | −0.961 * | −1.000 ** | 0.994 ** | 1 | |||||
| SS | 0.992 ** | 0.935 | 1.000 ** | 0.903 | 0.864 | 0.961 * | 0.942 | 0.982 * | 0.990 ** | −0.891 | −0.975 * | 0.986 * | 0.974 * | 1 | ||||
| SOD | 0.964 * | 0.998 ** | 0.951 * | 0.756 | 0.723 | 0.848 | 0.986 * | 0.895 | 0.905 | −0.750 | −0.903 | 0.904 | 0.904 | 0.955 * | 1 | |||
| POD | 0.783 | 0.547 | 0.810 | 0.966 * | 0.945 | 0.930 | 0.615 | 0.891 | 0.881 | −0.955 * | −0.869 | 0.883 | 0.864 | 0.807 | 0.600 | 1 | ||
| CAT | 0.941 | 0.783 | 0.916 | 0.983 * | 0.987 * | 0.981 * | 0.866 | 0.975 * | 0.949 | −0.989 * | −0.984 * | 0.969 * | 0.985 * | 0.921 | 0.821 | 0.902 | 1 | |
| APX | 0.952 * | 0.800 | 0.951 * | 0.991 ** | 0.974 * | 0.999 ** | 0.857 | 0.993 ** | 0.981 * | −0.987 * | −0.989 * | 0.990 * | 0.987 * | 0.952 * | 0.837 | 0.933 | 0.987 * | 1 |
Appendix B.3
| Correlations | DW | WC | PN | Gs | Ci | Tr | Fv/Fm | ϕPSII | qp | NPQ | MDA | SP | Proline | SS | SOD | POD | CAT | APX |
|---|---|---|---|---|---|---|---|---|---|---|---|---|---|---|---|---|---|---|
| DW | 1 | |||||||||||||||||
| WC | 0.998 ** | 1 | ||||||||||||||||
| PN | 0.663 | 0.618 | 1 | |||||||||||||||
| Gs | 0.933 | 0.948 | 0.373 | 1 | ||||||||||||||
| Ci | 0.829 | 0.860 | 0.226 | 0.864 | 1 | |||||||||||||
| Tr | 0.980 * | 0.966 * | 0.772 | 0.878 | 0.702 | 1 | ||||||||||||
| Fv/Fm | 0.915 | 0.889 | 0.875 | 0.764 | 0.538 | 0.976 * | 1 | |||||||||||
| ϕPSII | 0.869 | 0.839 | 0.853 | 0.738 | 0.445 | 0.949 | 0.989 * | 1 | ||||||||||
| qp | 0.949 | 0.933 | 0.750 | 0.873 | 0.622 | 0.987 * | 0.976 * | 0.973(*) | 1 | |||||||||
| NPQ | −0.970 * | −0.956 * | −0.819 | −0.820 | −0.723 | −0.983 * | −0.962 * | −0.912 | −0.944 | 1 | ||||||||
| MDA | −0.947 | −0.926 | −0.836 | −0.817 | −0.608 | −0.992 ** | −0.996 ** | −0.979(*) | −0.987 * | 0.975 * | 1 | |||||||
| SP | 0.967 * | 0.949 | 0.817 | 0.840 | 0.664 | 0.997 ** | 0.987 * | 0.960(*) | 0.983 * | −0.988 * | −0.997 ** | 1 | ||||||
| Proline | 0.952 * | 0.932 | 0.840 | 0.816 | 0.626 | 0.993 ** | 0.994 ** | 0.971(*) | 0.982 * | −0.983 * | −0.999 ** | 0.999 ** | 1 | |||||
| SS | 0.931 | 0.907 | 0.862 | 0.785 | 0.573 | 0.984 * | 0.999 ** | 0.983(*) | 0.980 * | −0.971 * | −0.999 ** | 0.993 ** | 0.998 ** | 1 | ||||
| SOD | 0.985 * | 0.990 ** | 0.547 | 0.980 * | 0.846 | 0.953 * | 0.868 | 0.834 | 0.937 | −0.918 | −0.909 | 0.928 | 0.910 | 0.886 | 1 | |||
| POD | 0.975 * | 0.983 * | 0.491 | 0.990 * | 0.869 | 0.931 | 0.833 | 0.797 | 0.914 | −0.892 | −0.879 | 0.901 | 0.881 | 0.853 | 0.998 ** | 1 | ||
| CAT | 0.964 * | 0.974 * | 0.457 | 0.995 ** | 0.868 | 0.917 | 0.814 | 0.782 | 0.904 | −0.873 | −0.862 | 0.885 | 0.863 | 0.835 | 0.995 ** | 0.999 ** | 1 | |
| APX | 0.975 * | 0.985 * | 0.482 | 0.988 * | 0.889 | 0.924 | 0.821 | 0.779 | 0.901 | −0.892 | −0.869 | 0.895 | 0.872 | 0.842 | 0.996 ** | 0.999 ** | 0.998 ** | 1 |
References
- Ortega-Gaucin, D.; Ceballos-Tavares, J.A.; Sanchez, A.O.; Castellano-Bahena, H.V. Agricultural drought risk assessment: A spatial analysis of hazard, exposure, and vulnerability in Zacatecas. Water 2021, 13, 1431. [Google Scholar] [CrossRef]
- Cao, J.; Tian, H.; Adamowski, J.F.; Zhang, X.; Cao, Z. Influences of afforestation policies on soil moisture content in China’s arid and semi-arid regions. Land Use Policy 2018, 75, 449–458. [Google Scholar] [CrossRef]
- Guo, Y.Y.; Li, H.J.; Liu, J.; Bai, Y.W.; Xue, J.Q.; Zhang, R.H. Melatonin alleviates drought-induced damage of photosynthetic apparatus in maize seedlings. Russ. J. Plant Physiol. 2020, 67, 312–322. [Google Scholar]
- Xu, L.; Naylor, D.; Dong, Z.; Simmons, T.; Pierroz, G.; Hixson, K.K.; Kim, Y.M.; Zink, E.M.; Engbrecht, K.M.; Wang, Y.; et al. Drought delays development of the sorghum root microbiome and enriches for monoderm bacteria. Proc. Natl. Acad. Sci. USA 2018, 115, E4284–E4293. [Google Scholar] [CrossRef] [PubMed] [Green Version]
- Chen, D.; Wang, S.; Xiong, B.; Cao, B.; Deng, X. Carbon/Nitrogen imbalance associated with drought-induced leaf senescence in Sorghum bicolor. PLoS ONE 2015, 10, e0137026. [Google Scholar] [CrossRef] [PubMed]
- Fang, Y.; Xiong, L. General mechanisms of drought response and their application in drought resistance improvement in plants. Cell. Mol. Life Sci. 2015, 72, 673–689. [Google Scholar] [CrossRef]
- Qin, H.; Fu, M. Impacts of continuous drought on plant growth and soil moisture. Bull. Soil Water Conserv. 2005, 25, 41–43. [Google Scholar]
- Li, G.; Liang, Z.; Li, Y.; Liao, Y.; Liu, Y. Exogenous spermidine regulates starch synthesis and the antioxidant system to promote wheat grain filling under drought stress. Acta Physiol. Plant. 2020, 42, 110. [Google Scholar] [CrossRef]
- Do, P.T.; Drechsel, O.; Heyer, A.G.; Hincha, D.K.; Zuther, E. Changes in free polyamine levels, expression of polyamine biosynthesis genes, and performance of rice cultivars under salt stress: A comparison with responses to drought. Front. Plant Sci. 2014, 5, 182. [Google Scholar] [CrossRef] [Green Version]
- Paschalidis, K.A.; Roubelakis-Angelakis, K.A. Spatial and temporal distribution of polyamine levels and polyamine anabolism in different organs/tissues of the tobacco plant. Correlations with age, cell division/expansion, and differentiation. Plant Physiol. 2005, 138, 142–152. [Google Scholar] [CrossRef] [Green Version]
- Tanaka, H.; Takeda, K.; Imai, A. Polyamines alleviate the inhibitory effect of the DNA cross-linking agent mitomycin C on root growth. Plant Signal. Behav. 2019, 14, e1659687. [Google Scholar] [CrossRef] [PubMed]
- Guo, D.P.; Sun, Y.Z.; Chen, Z.J. Involvement of polyamines in cytoplasmic male sterility of stem mustard (Brassica juncea var. tsatsai). Plant Growth Regul. 2003, 41, 33–40. [Google Scholar] [CrossRef]
- Zhang, X.; Ji, N.; Zhen, F.; Ren, P.; Li, F. Metabolism of endogenous arginine in tomato fruit harvested at different ripening stages. Sci. Hortic. 2014, 179, 349–355. [Google Scholar] [CrossRef]
- Sood, S.; Nagar, P.K. The effect of polyamines on leaf senescence in two diverse rose species. Plant Growth Regul. 2003, 39, 155–160. [Google Scholar] [CrossRef]
- Kuehn, G.D.; Phillips, G.C. Role of polyamines in apoptosis and other recent advances in plant polyamines. Crit. Rev. Plant Sci. 2005, 24, 123–130. [Google Scholar] [CrossRef]
- Zhang, C.; Huang, Z. Effects of endogenous abscisic acid, jasmonic acid, polyamines, and polyamine oxidase activity in tomato seedlings under drought stress. Sci. Hortic. 2013, 159, 172–177. [Google Scholar] [CrossRef]
- Ebeed, H.T.; Hassan, N.M.; Aljarani, A.M. Exogenous applications of polyamines modulate drought responses in wheat through osmolytes accumulation, increasing free polyamine levels and regulation of polyamine biosynthetic genes. Plant Physiol. Biochem. 2017, 118, 438–448. [Google Scholar] [CrossRef]
- Doneva, D.; Pal, M.; Brankova, L.; Szalai, G.; Tajti, J.; Khalil, R.; Ivanovska, B.; Velikova, V.; Misheva, S.; Janda, T.; et al. The effects of putrescine pre-treatment on osmotic stress responses in drought-tolerant and drought-sensitive wheat seedlings. Physiol. Plant. 2021, 171, 200–216. [Google Scholar] [CrossRef]
- Shi, H.; Ye, T.; Chan, Z. Comparative proteomic and physiological analyses reveal the protective effect of exogenous polyamines in the bermudagrass (Cynodon dactylon) response to salt and drought stresses. J. Proteome Res. 2013, 12, 4951–4964. [Google Scholar] [CrossRef]
- Li, L.; Gu, W.; Li, C.; Li, W.; Li, C.; Li, J.; Wei, S. Exogenous spermidine improves drought tolerance in maize by enhancing the antioxidant defence system and regulating endogenous polyamine metabolism. Crop Pasture Sci. 2018, 69, 1076–1091. [Google Scholar] [CrossRef]
- Yin, Z.P.; Li, S.; Ren, J.; Song, X.S. Role of spermidine and spermine in alleviation of drought-induced oxidative stress and photosynthetic inhibition in Chinese dwarf cherry (Cerasus humilis) seedlings. Plant Growth Regul. 2014, 74, 209–218. [Google Scholar] [CrossRef]
- Kubis, J. Polyamines and “scavenging system”: Influence of exogenous spermidine on catalase and guaiacol peroxidase activities, and free polyamine level in barley leaves under water deficit. Acta Physiol. Plant. 2003, 25, 337–343. [Google Scholar] [CrossRef]
- Li, Z.; Zhou, H.; Peng, Y.; Zhang, X.; Ma, X.; Huang, L.; Yan, Y. Exogenously applied spermidine improves drought tolerance in Creeping bentgrass associated with changes in antioxidant defense, endogenous polyamines and phytohormones. Plant Growth Regul. 2015, 76, 71–82. [Google Scholar] [CrossRef]
- Peng, D.; Wang, X.; Li, Z.; Zhang, Y.; Peng, Y.; Li, Y.; He, X.; Zhang, X.; Ma, X.; Huang, L.; et al. No is involved in spermidine-induced drought tolerance in white clover via activation of antioxidant enzymes and genes. Protoplasma 2016, 253, 1243–1254. [Google Scholar] [CrossRef]
- Shen, W.; Nada, K.; Tachibana, S. Involvement of polyamines in the chilling tolerance of cucumber cultivars. Plant Physiol. 2000, 124, 431–439. [Google Scholar] [CrossRef] [Green Version]
- Puyang, X.; An, M.; Han, L.; Zhang, X. Protective effect of spermidine on salt stress induced oxidative damage in two Kentucky bluegrass (Poa pratensis L.) cultivars. Ecotoxicol. Environ. Saf. 2015, 117, 96–106. [Google Scholar] [CrossRef]
- Shalaeva, O. The growth and development of Hordeum jubatum under conditions of introduction at the European North-East. Agrar. Nauka Evro-Sev.-Vost. 2012, 3, 17–19. [Google Scholar]
- Azhar, A.; Makihara, D.; Naito, H.; Asano, K.; Takagi, M.; Unoki, S.; Tomita, R.; Abbas, B.; Ehara, H. Sago palm (Metroxylon sagu Rottb.) response to drought condition in terms of leaf gas exchange and chlorophyll a fluorescence. Plant Prod. Sci. 2021, 24, 65–72. [Google Scholar] [CrossRef]
- Meng, X.; Zhao, Q.; Jin, Y.; Yu, J.; Yin, Z.; Chen, S.; Dai, S. Chilling-responsive mechanisms in halophyte Puccinellia tenuiflora seedlings revealed from proteomics analysis. J. Proteom. 2016, 143, 365–381. [Google Scholar] [CrossRef]
- Kang, J.; Yang, Q.; Fan, F. Effects of drought stress on induced protein in the different drought resistance alfalfa leaf. Acta Agrestia Sin. 2005, 13, 199–202. [Google Scholar]
- Zhang, J.; Tang, C.; Wu, J.; Zhou, Y.; Mo, Z. Physiological response of bermudagrass (Cynodon dactylon) to different drought stresses. Pratacultural Sci. 2011, 28, 117–120. [Google Scholar]
- Maswada, H.F.; Abd El-Kader, N.I.K. Redox halopriming: A promising strategy for inducing salt tolerance in bread wheat. J. Agron. Crop Sci. 2016, 202, 37–50. [Google Scholar] [CrossRef]
- Ren, Y.; Liu, S.; Qi, W.; Luo, C.; Gong, B.; Ou, L. Changes of super oxygen anion in mulberry varieties under water stress. Guihaia 2017, 37, 1122–1129. [Google Scholar]
- Xiong, J.; Zou, X.; Zou, X.; Li, S.; Chen, L.; Song, L. Effects of drought stress on agronomic traits and yield of different rape-seed genotypes. Jiangsu J. Agric. Sci. 2015, 31, 494–499. [Google Scholar]
- Yang, Y.; Huang, C.; Gu, Q.; Qu, X.; Liu, S.; Xu, X. An analysis of physiological index of and gene expression differences in drought tolerance of two citrus rootstock seedlings. Acta Agric. 2012, 34, 1118–1123. [Google Scholar]
- D’Arcy-Lameta, A.; Ferrari-Iliou, R.; Contour-Ansel, D.; Pham-Thi, A.T.; Zuily-Fodil, Y. Isolation and characterization of four ascorbate peroxidase cdnas responsive to water deficit in cowpea leaves. Ann. Bot. 2006, 97, 133–140. [Google Scholar] [CrossRef] [PubMed]
- Anjum, S.A.; Ashraf, U.; Tanveer, M.; Khan, I.; Hussain, S.; Shahzad, B.; Zohaib, A.; Abbas, F.; Saleem, M.F.; Ali, I.; et al. Drought induced changes in growth, osmolyte accumulation and antioxidant metabolism of three maize hybrids. Front. Plant Sci. 2017, 8, 69. [Google Scholar] [CrossRef] [PubMed]
- Zhang, J.; Poudel, B.; Kenworthy, K.; Unruh, J.B.; Rowland, D.; Erickson, J.E.; Kruse, J. Drought responses of above-ground and below-ground characteristics in warm-season turfgrass. J. Agron. Crop Sci. 2019, 205, 1–12. [Google Scholar] [CrossRef] [Green Version]
- Stratopoulos, L.M.F.; Zhang, C.; Haeberle, K.H.; Pauleit, S.; Duthweiler, S.; Pretzsch, H.; Roetzer, T. Effects of drought on the phenology, growth, and morphological development of three urban tree species and cultivars. Sustainability 2019, 11, 5117. [Google Scholar] [CrossRef] [Green Version]
- Farooq, M.; Wahid, A.; Lee, D.J. Exogenously applied polyamines increase drought tolerance of rice by improving leaf water status, photosynthesis and membrane properties. Acta Physiol. Plant. 2009, 31, 937–945. [Google Scholar] [CrossRef]
- Menezes-Silva, P.E.; Sanglard, L.M.V.P.; Avila, R.T.; Morais, L.E.; Martins, S.C.V.; Nobres, P.; Patreze, C.M.; Ferreira, M.A.; Araujo, W.L.; Fernie, A.R.; et al. Photosynthetic and metabolic acclimation to repeated drought events play key roles in drought tolerance in coffee. J. Exp. Bot. 2017, 68, 4309–4322. [Google Scholar] [CrossRef] [PubMed]
- Hetherington, A.M.; Woodward, F.I. The role of stomata in sensing and driving environmental change. Nature 2003, 424, 901–908. [Google Scholar] [CrossRef] [PubMed]
- Guha, A.; Sengupta, D.; Rasineni, G.K.; Reddy, A.R. An integrated diagnostic approach to understand drought tolerance in mulberry (Morus indica L.). Flora 2010, 205, 144–151. [Google Scholar] [CrossRef]
- Gururani, M.A.; Venkatesh, J.; Lam-Son Phan, T. Regulation of photosynthesis during abiotic stress-induced photoinhibition. Mol. Plant 2015, 8, 1304–1320. [Google Scholar] [CrossRef] [Green Version]
- Maxwell, K.; Johnson, G.N. Chlorophyll fluorescence-a practical guide. J. Exp. Bot. 2000, 51, 659–668. [Google Scholar] [CrossRef]
- Banks, J.M. Continuous excitation chlorophyll fluorescence parameters: A review for practitioners. Tree Physiol. 2017, 37, 1128–1136. [Google Scholar] [CrossRef]
- Batra, N.G.; Sharma, V.; Kumari, N. Drought-induced changes in chlorophyll fluorescence, photosynthetic pigments, and thylakoid membrane proteins of Vigna radiata. J. Plant Interact. 2014, 9, 712–721. [Google Scholar] [CrossRef] [Green Version]
- Ghotbi-Ravandi, A.A.; Shahbazi, M.; Shariati, M.; Mulo, P. Effects of mild and severe drought stress on photosynthetic efficiency in tolerant and susceptible barley (Hordeum vulgare L.) genotypes. J. Agron. Crop Sci. 2014, 200, 403–415. [Google Scholar] [CrossRef]
- Guan, X.K.; Song, L.; Wang, T.C.; Turner, N.C.; Li, F.M. Effect of drought on the gas exchange, chlorophyll fluorescence and yield of six different-era spring wheat cultivars. J. Agron. Crop Sci. 2015, 201, 253–266. [Google Scholar] [CrossRef]
- Zivcak, M.; Kalaji, H.M.; Shao, H.B.; Olsovska, K.; Brestic, M. Photosynthetic proton and electron transport in wheat leaves under prolonged moderate drought stress. J. Photochem. Photobiol. B 2014, 137, 107–115. [Google Scholar] [CrossRef]
- Pinnola, A.; Dall’Osto, L.; Gerotto, C.; Morosinotto, T.; Bassi, R.; Alboresi, A. Zeaxanthin binds to light-harvesting complex stress-related protein to enhance nonphotochemical quenching in Physcomitrella patens. Plant Cell 2013, 25, 3519–3534. [Google Scholar] [CrossRef] [PubMed] [Green Version]
- Ioannidis, N.E.; Kotzabasis, K. Polyamines in chemiosmosis in vivo: A cunning mechanism for the regulation of ATP synthesis during growth and stress. Front. Plant Sci. 2014, 5, 71. [Google Scholar] [CrossRef] [PubMed] [Green Version]
- Turner, N.C. Turgor maintenance by osmotic adjustment, an adaptive mechanism for coping with plant water deficits. Plant Cell Environ. 2017, 40, 1–3. [Google Scholar] [CrossRef] [PubMed]
- Zahoor, R.; Zhao, W.; Abid, M.; Dong, H.; Zhou, Z. Potassium application regulates nitrogen metabolism and osmotic adjustment in cotton (Gossypium hirsutum L.) functional leaf under drought stress. J. Plant Physiol. 2017, 215, 30–38. [Google Scholar] [CrossRef]
- Blum, A. Osmotic adjustment is a prime drought stress adaptive engine in support of plant production. Plant Cell Environ. 2017, 40, 4–10. [Google Scholar] [CrossRef]
- Alcazar, R.; Bueno, M.; Tiburcio, A.F. Polyamines: Small amines with large effects on plant abiotic stress tolerance. Cells 2020, 9, 2373. [Google Scholar] [CrossRef]
- Gechev, T.; Petrov, V. Reactive oxygen species and abiotic stress in plants. Int. J. Mol. Sci. 2020, 21, 7433. [Google Scholar] [CrossRef]
- Hasanuzzaman, M.; Bhuyan, M.; Zulfiqar, F.; Raza, A.; Mohsin, S.M.; Al Mahmud, J.; Fujita, M.; Fotopoulos, V. Reactive oxygen species and antioxidant defense in plants under abiotic stress: Revisiting the crucial role of a universal defense regulator. Antioxidants 2020, 9, 681. [Google Scholar] [CrossRef]
- Li, L.; Gu, W.; Li, J.; Li, C.; Xie, T.; Qu, D.; Meng, Y.; Li, C.; Wei, S. Exogenously applied spermidine alleviates photosynthetic inhibition under drought stress in maize (Zea mays L.) seedlings associated with changes in endogenous polyamines and phytohormones. Plant Physiol. Biochem. 2018, 129, 35–55. [Google Scholar] [CrossRef]


| Source of Variation | Variable | ||
|---|---|---|---|
| D | S | D × S | |
| Dry weight | 982.84 *** | 51.01 *** | 15.01 *** |
| Water content | 134.10 *** | 30.53 *** | 5.00 *** |
| Net photosynthetic rate (PN) | 766.61 *** | 11.33 *** | 3.44 ** |
| Stomatal conductance (Gs) | 217.98 *** | 15.92 *** | 1.56 NS |
| Intercellular CO2 concentration (Ci) | 198.76 *** | 6.66 ** | 1.45 NS |
| Transpiration rate (Tr) | 240.12 *** | 20.42 *** | 2.91 * |
| Fv/Fm | 13.59 *** | 2.79 NS | 1.13 NS |
| ϕPSII | 457.15 *** | 13.94 *** | 1.99 NS |
| qp | 302.90 *** | 26.96 *** | 6.44 *** |
| NPQ | 562.38 *** | 28.95 *** | 6.33 *** |
| Malondialdehyde (MDA) | 2129.56 *** | 115.45 *** | 28.49 *** |
| Soluble protein | 1546.63 *** | 52.15 *** | 11.61 *** |
| Proline | 4465.64 *** | 66.72 *** | 7.51 *** |
| Soluble sugar | 3359.01 *** | 56.10 *** | 6.61 *** |
| Superoxide dismutase (SOD) | 1684.53 *** | 45.89 *** | 10.02 *** |
| Peroxidase (POD) | 2276.98 *** | 66.73 *** | 12.50 *** |
| Catalase (CAT) | 1863.74 *** | 84.43 *** | 16.72 *** |
| Ascorbate peroxidase (APX) | 932.95 *** | 32.54 *** | 6.04 *** |
Publisher’s Note: MDPI stays neutral with regard to jurisdictional claims in published maps and institutional affiliations. |
© 2022 by the authors. Licensee MDPI, Basel, Switzerland. This article is an open access article distributed under the terms and conditions of the Creative Commons Attribution (CC BY) license (https://creativecommons.org/licenses/by/4.0/).
Share and Cite
Tian, J.; Zhao, Y.; Pan, Y.; Chen, X.; Wang, Y.; Lin, J.; Wang, J.; Yang, Q. Exogenous Applications of Spermidine Improve Drought Tolerance in Seedlings of the Ornamental Grass Hordeum jubatum in Northeast China. Agronomy 2022, 12, 1180. https://0-doi-org.brum.beds.ac.uk/10.3390/agronomy12051180
Tian J, Zhao Y, Pan Y, Chen X, Wang Y, Lin J, Wang J, Yang Q. Exogenous Applications of Spermidine Improve Drought Tolerance in Seedlings of the Ornamental Grass Hordeum jubatum in Northeast China. Agronomy. 2022; 12(5):1180. https://0-doi-org.brum.beds.ac.uk/10.3390/agronomy12051180
Chicago/Turabian StyleTian, Jingyao, Yi Zhao, Yuqiao Pan, Xiaoxuan Chen, Yingnan Wang, Jixiang Lin, Jinghong Wang, and Qingjie Yang. 2022. "Exogenous Applications of Spermidine Improve Drought Tolerance in Seedlings of the Ornamental Grass Hordeum jubatum in Northeast China" Agronomy 12, no. 5: 1180. https://0-doi-org.brum.beds.ac.uk/10.3390/agronomy12051180