1. Introduction
Sweet cherry (
Prunus avium L.) is cultivated widely [
1], and consumers highly appreciate the fruits due to their excellent organoleptic characteristics [
2]. Research has shown that sweet cherry has a high nutritional value and an important content of bioactive compounds [
3]. The global sweet cherry production is around 4.0 million tons per year. The sweet cherry production share in 2021/2022 concerning the principal producing countries was Turkey (21.4%), followed by the European Union (16.6%), China (14.9%), Chile (9.9%) and the United States (9.8%) [
4].
The extraction process is one of the fundamental steps for the recovery of phenolic compounds from the food industry and the related by-products or residues [
5]. Different methodologies are available to perform this operation [
6] but the choice will also depend on the kind of food product or residue under analysis [
7]. The extraction of phenolic compounds can be performed by techniques such as infusion, decoction, maceration, percolation, digestion, Soxhlet extraction, aqueous alcoholic extraction by phytonics pro-cesses, supercritical fluid extraction, counter current extraction, ultrasound extraction, or by fermentation [
8]. Undoubtedly, solid–liquid extraction has been the most extensively utilized to separate several phenolic compounds or families of compounds. However, the efficiency of the extraction process is highly variable and is dependent on the processing conditions, especially the type and concentration of solvent, the ratio of solvent-to-mass of the sample, the extraction time, and the temperature [
9]. Naczk and Shahidi [
10] showed that extraction times longer than 24 h could increase the oxidation process of phenolic compounds, therefore they should not be used in order to preserve the antioxidant properties of the phenolic compounds. Golpour et al. [
6] evaluated the effect of different operating conditions on the extraction of phenolic compounds form strawberry, namely time, solvent concentration and volume/mass ratio. They found that total phenolic compounds were better extracted when using a volume/mass ratio of 12 mL/g, using a methanol aqueous solution with a concentration of 70% methanol and extraction time of 40 min. Guiné et al. [
11] described the optimization of extraction of bioactive compounds from beetroot, and found that the ratio mass of sample/volume of solvent was a factor highly influencing the extraction efficiency. Ahmad et al. [
12] studied the effect of solvent and temperature on the extraction of phenolic compounds from olive fruits, and reported that the type of solvent greatly influenced the extraction, while temperature did not. However, Beaufils et al. [
13] reported the strong effect of temperature on the extraction of phenolic compounds, following the trends of other studies. Casagrande et al. [
14] described an optimal temperature for the extraction of phenolics of 80 °C, and also Marete et al. [
15] reported the best extraction temperatures in the range from 80 to 100 °C. However, some authors state that such high temperatures can have a negative effect on the compounds by degrading them and reducing their biological activity [
16].
The quantification of phenolic compounds in cherry fruits has been performed by Kashyap et al. [
17]. In their study, the authors used response surface methodology to optimize the extraction conditions, in particular solvent concentration (40 to 80%), solvent/mass ratio (10 to 30 mL/g), extraction time (90 to 240 s), and microwave power (300 to 600 W). The optimized extract resulted in a total phenolic content of 155.27 ± 2.76 mg GAE/g in the cherry pomace. Schmidt et al. [
18] evaluated the phenolic profile of cherry fruits and found that the major phenolics were procyanidins (1380.64 to 1888.00 μg/g). Basanta et al. [
19] investigated the preservation of the antioxidant effects of phenolic compounds in cherry surfaces and found that anthocyanins were more degraded by light, while flavonols remained more stable. The study of phenolic compounds from cherry seeds is scarce, but Oliveira et al. [
20] studied some separation methods to isolate compounds with antioxidant activity from Brazilian cherry seeds. They found that temperature and time influenced the extraction yield of phenolic compounds.
Two main strategies are adequate to implement a circular economy in any industrial sector: reducing pollution levels and finding the most sustainable solution to manage the waste resulting from the processes of the agri-food industry. The large quantity of organic waste produced by the food industry, besides representing a significant loss of valuable materials, also poses serious management problems, both from economic and environmental points of view [
21]. Waste recovery has been defined as the process of converting waste into more valuable products [
22]. This constitutes a useful approach to addressing waste materials’ management, thus increasing the competitiveness of agri-food industries, where a wide variety of products can be obtained using waste as a raw material [
23]. Agri-food waste is a valuable bioresource that can originate a variety of convenient materials, ingredients and chemicals [
24,
25]. In addition, opportunities for the application of industrial symbiosis in the valorisation of wastes in the food manufacturing industry have already been identified [
21]. Because food waste has great potential to provide beneficial social and environmental benefits, several countries are already promoting strategies for its valorisation [
21]. In addition to the ecological benefits, there is also an economic gain for the companies, linked with the integration of recovered ingredients into human food supply chains [
26].
The fresh-cut fruit industry discards large percentages of by-products, such as peels, seeds, or even flesh that is not used for specific quality reasons. However, these residues can present similar contents of bioactive compounds or even higher than the parts effectively used, such as the flesh. These bioactive compounds include, for example, phenolic compounds, carotenoids and vitamins [
21]. Sweet cherry seeds result from processing sweet cherry for the production of sweets, juices and jams. Generally, seeds are considered as production waste, which has gained strong interest due to the environmental aspects related to waste disposal. Additionally, it is well documented that production waste, such as peels, seeds, and pomace, contains high-value bioactive compounds [
27]. Hence, the present work focuses on using cherry seeds that are waste derived from food manufacturing industries. The extraction potential of various organic solvents and different extraction conditions was investigated to optimize the extraction parameters such as type of solvent and temperature for maximum yield of bioactive compounds extracted. The bioactive substances evaluated in the extracts were total phenolic compounds and different families of phenolics.
2. Materials and Methods
2.1. Samples
The waste management company Nutrofertil, located in Portugal, namely in the district of Viseu (Tondela), provided the Seeds of Sweet Cherry (SSC) for this study. Since the company uses cherries from different varieties for processing, the seeds were not from a single variety, but rather from mixed varieties. This is an industrial waste to be valued instead of being discarded. The samples used were pre-dried in the sun. After this, the samples were crushed in a mill (Retsch SMI—Retsch GmbH, Haan, Germany) and sieved for 30 min at 50 rpm (Retsch AS200 sieve—Retsch GmbH, Haan, Germany). A fraction of the particles with sizes over 0.425 mm (>35 mesh) were used for the tests. Then, the fractions obtained were again dried on a stove for 24 h at a temperature of 40 °C, for better preservation during storage until further usage.
2.2. Preparations of Extracts
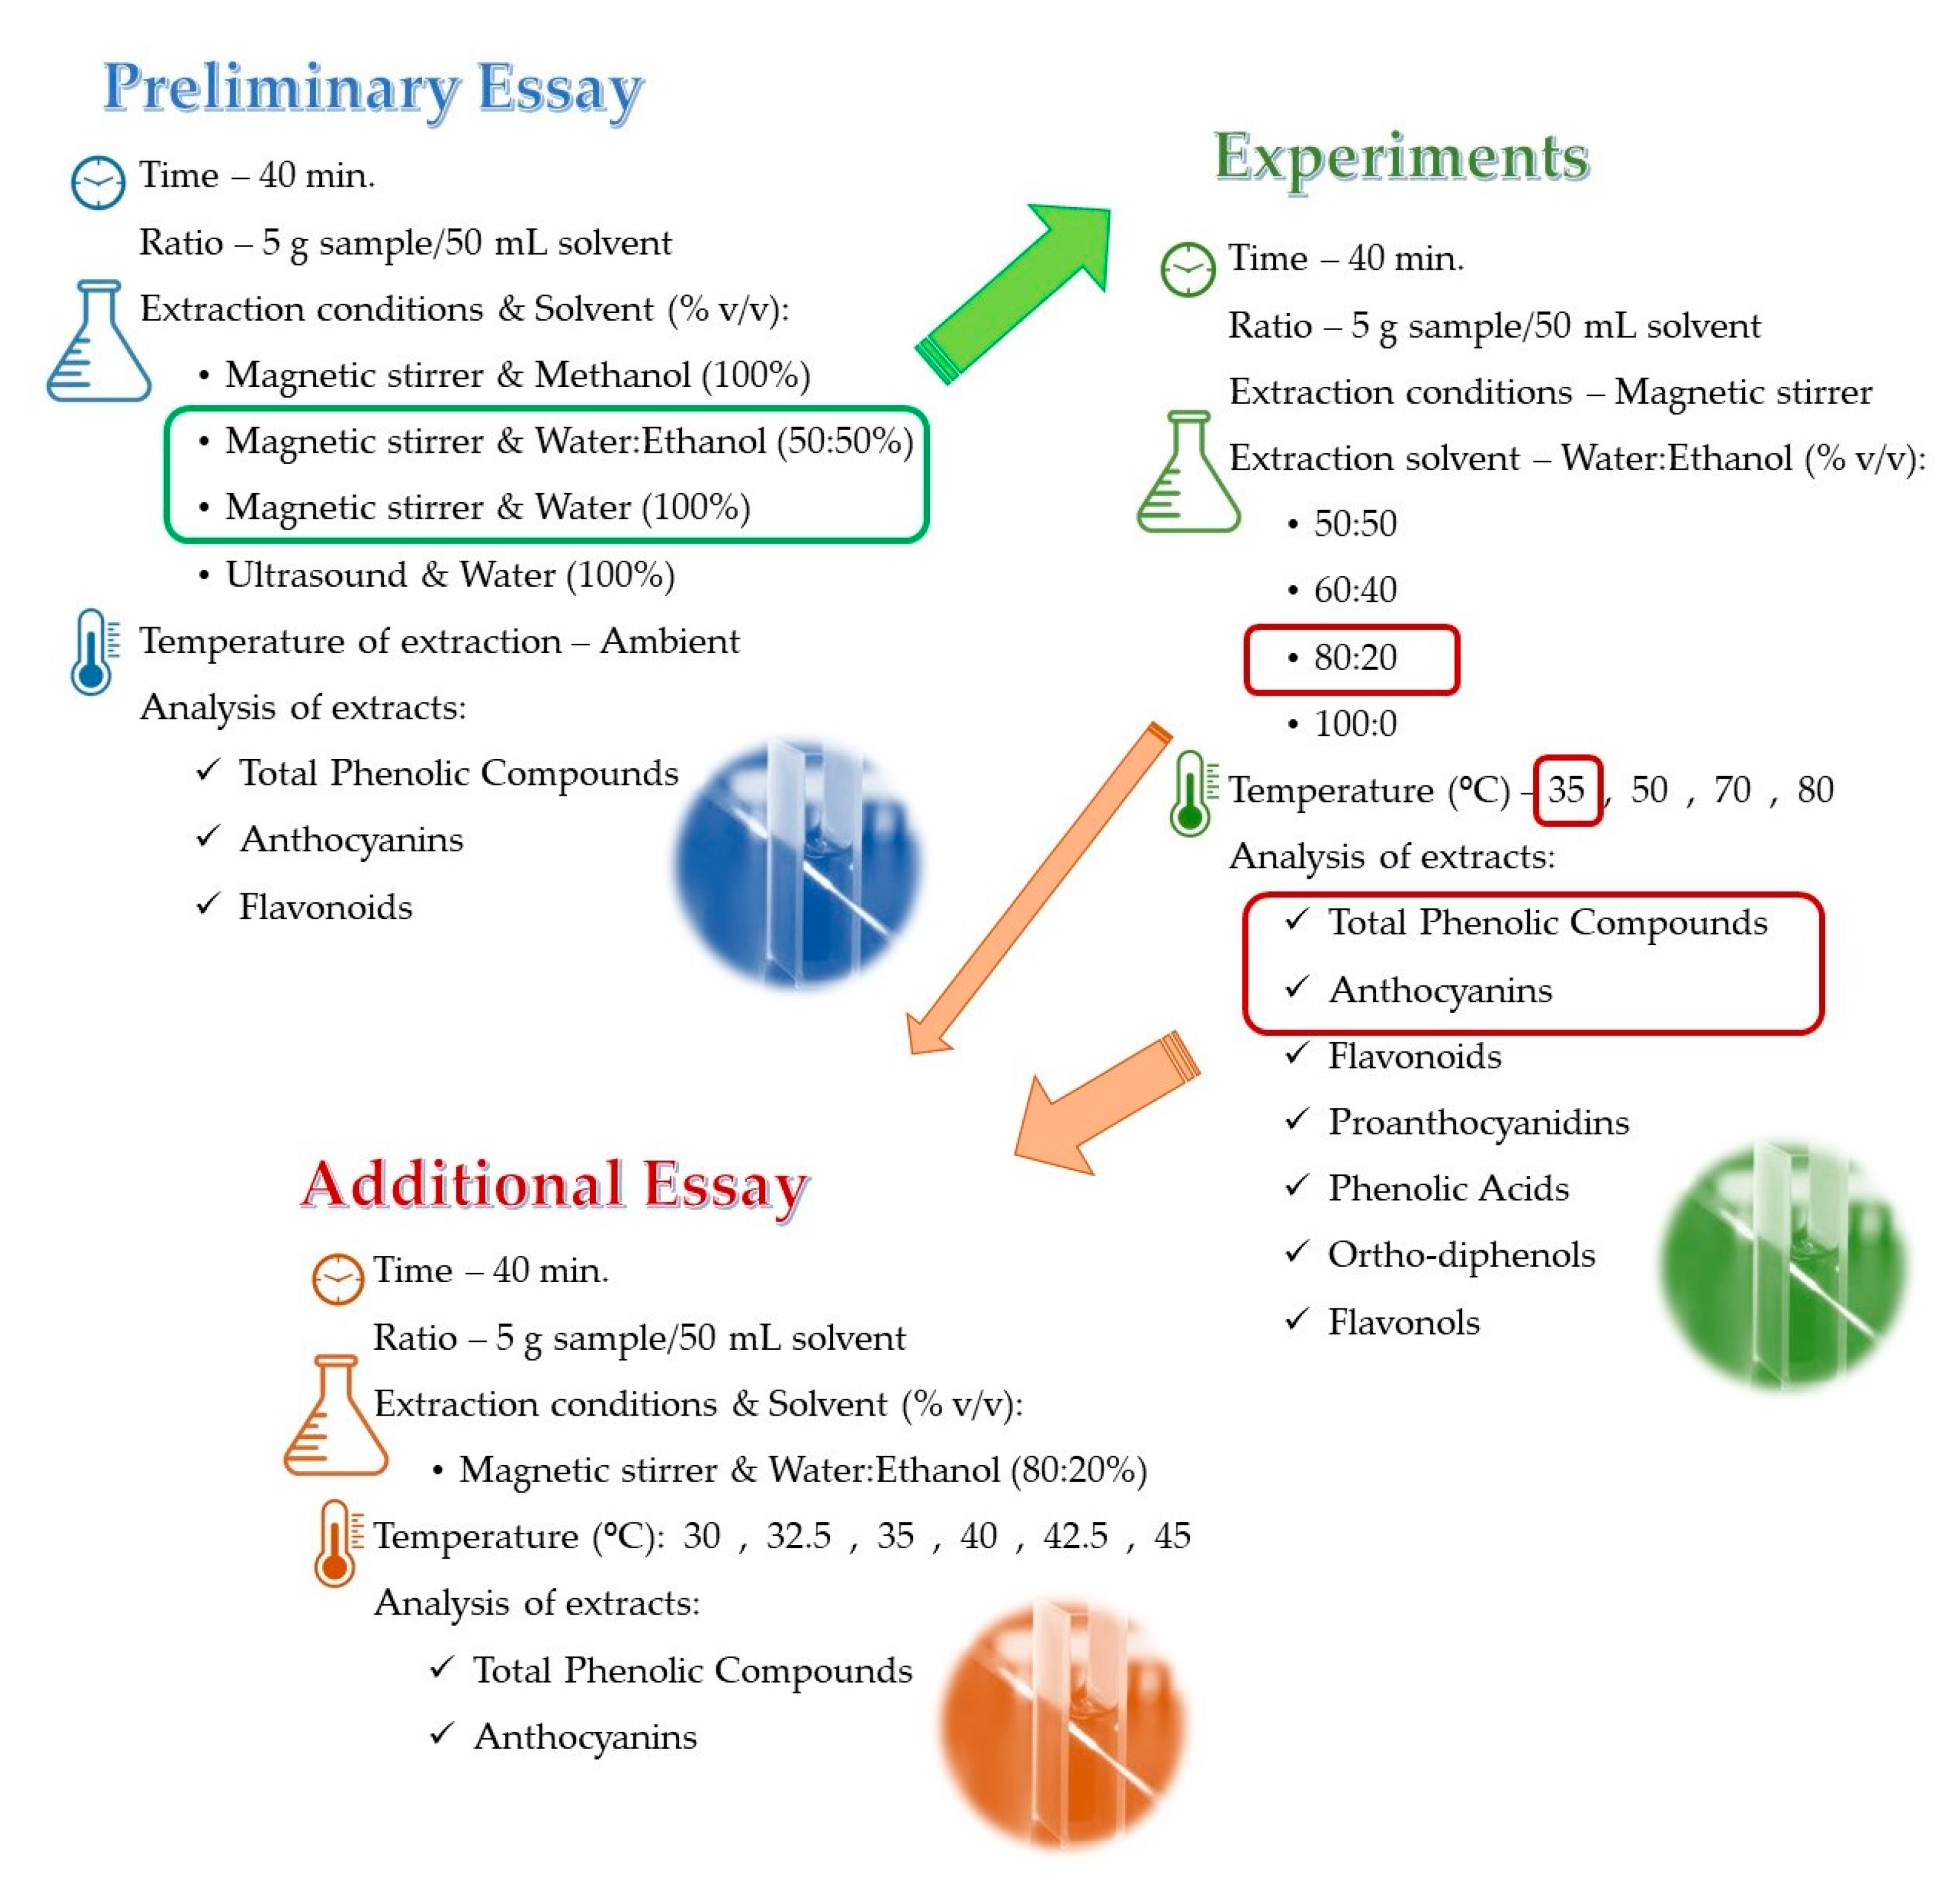
The extracts were obtained from the contact between 5 g of sample with 50 mL of solvent for 40 min under various experimental conditions, as depicted in
Figure 1. In a preliminary assay, extractions were performed at room temperature under magnetic stirring at medium speed for different extracting solutions. One more extraction was also performed with water using an ultrasonic bath. Each extract was filtered into a 50 mL volumetric flask using Whatman N
o. 3 paper filter and allowed to stand in the dark at room temperature until analysis. Oxidation was prevented by leaving the flasks away from light in closed cabinets. The samples were left for a period of up to one hour, and the experiments were repeated three times. Based on the results of the preliminary assay, the experiments of the core work were made using a similar methodology, but different processing conditions, namely the extraction solvent, were now reduced to mixtures of water:ethanol but at various proportions (water:ethanol ratios—50:50; 60:40; 80:20; 100:0 %
v:
v), and the extraction was carried out at different temperatures of 35 °C, 50 °C, 70 °C and 80 °C, all under magnetic stirring for 40 min. Some extra experiments were made to further investigate results for the number of anthocyanins and total phenolic compounds, as depicted in
Figure 1 under the additional assay.
2.3. Quantification of Total Phenols
The Folin–Ciocalteu method is one of the relatively simple spectrophotometric assays used to determine the content of total phenolic compounds [
6]. For measurements, 125 μL of samples (or standard solution) were mixed with 750 μL of distilled water and 125 μL of Folin–Ciocalteu reagent. After 6 min, 2 mL of sodium carbonate was added 5% (
v:
v) and the prepared solution was left for 60 min at room temperature in the dark for the reaction to occur. Then, the mixture was shaken, and the absorbance of the standards and samples was measured at λ = 760 nm. Autozero was performed with distilled water and the blank with 125 μL of distilled water instead of the samples. At the same time, the calibration curve was obtained with standard gallic acid solutions with different concentrations between 0 and 1 g/L. The results were calculated as mean value and standard deviation from three replicates of spectrophotometric measurements for each sample and expressed in milligrams of gallic acid equivalents per gram of sample (mg GAE/g).
2.4. Quantification of Anthocyanins
The extracts obtained (1 mL) were diluted to a final volume V with the solution of 1 mL of HCl (concentration of 37%), 70 mL of ethanol and 30 mL of H
2O, previously prepared in a 100 mL flask, with three replicates. The cells of 1 cm of optical path were filled, and the spectrophotometer was read at 540 nm. Quantitative determination of anthocyanins was carried out in slightly acidic media in the wavelength range of 490–550 nm [
28]. This is possible because anthocyanins have a typical absorption band around this range. This band is far from the absorption bands of other phenols, which have spectral maxima in the UV range [
29].
The samples were analysed in triplicate, and the anthocyanin content in the extract was determined using the following expression, taking into account the dilution factor (V): Total Anthocyanins (mg/mL) = Absorbance at 540 × 16.17 × V.
Final results were calculated as mean value and standard deviation from three repetitions and expressed as micrograms of malvidin-3-glucoside (Mv3G) equivalents per gram of sample of cherry seeds (µg Mv3G/g) [
30].
2.5. Quantification of Proanthocyanidins
The quantitative determination of proanthocyanidins (condensed tannins) was performed using the vanillin assay, a method widely used in tests on vegetables and fruits. [
31]. The vanillin/HCl assay measured proanthocyanidins content according to the procedure reported by Zam et al. [
32]. Aliquots of 1 mL of samples were mixed with 2.5 mL of 1% vanillin-methanol solution and 2.5 mL of 8% HCl-methanol solution. Then, the reaction mixture was incubated in a water bath for 20 min at 30 °C. The absorbance was measured at 500 nm and blanked with methanol. Total proanthocyanidins contents were calculated as mean value and standard deviation from three repetitions and expressed as catechin equivalents in milligrams per gram (mg CE/g) using catechin (0.06–0.3 mg/mL) for the standard curve.
2.6. Quantification of Flavonoids
Aluminium chloride (AlCl
3) was used to quantify flavonoid content [
33]. Total flavonoids were estimated according to the method described by Gonçalves et al. [
34], after some adjustments. A calibration curve was performed with standard quercetin solutions with different concentrations (0.0; 0.1; 0.2 and 0.3 g/L) to quantify the flavonoid content. One millilitre of the sample was thoroughly mixed with 1 mL of 2% AlCl
3·6H
2O (2 g in 100 mL of methanol). The absorbance was measured at 370 nm after 10 min of rest. The total flavonoids content was calculated as mean value and standard deviation from three repetitions and expressed as quercetin equivalent (QE) in milligrams per gram of samples.
2.7. Quantification of Ortho-Diphenols
The ortho-diphenol content was determined colourimetrically by the complexation of ortho-diphenols with the molybdate ions [
35].
The experimental procedure was adapted from Santos et al. [
36]. In one tube, 4 mL of properly diluted samples and 1 mL of 5% (
v:
v) dehydrated sodium molybdate in ethanol/water (1:1) were added, stirred and remained at room temperature for 15 min. The samples were analysed by spectrophotometry at a wavelength of 370 nm. A blank was obtained by measuring a mixture of 4 mL of phenolic solution with 1 mL of ethanol/water (1:1). In parallel, a calibration curve was determined with standard solutions of gallic acid with different concentrations in the range 5–300 mg/L. The ortho-diphenol content of each sample was then determined by interpolating the values obtained colourimetrically in the calibration curve. The results were calculated as mean value and standard deviation from three repetitions and expressed as gallic acid equivalents per gram of samples (mg GAE/g).
2.8. Quantification of Phenolic Acids
Total phenolic acid determinations were carried out according to the Arnov method described by Gawlik-Dziki et al. [
37]. One millilitre of the sample was mixed with 5 mL of distilled water, 1 mL 0.5 mol/L HCl, 1 mL of Arnov reagent (10 g sodium molybdate and 10 g sodium nitrite dissolved in 100 mL of distilled water) and 1 mL 1 mol/L NaOH and complete to 10 mL with distilled water. Total phenolic acids were determined by measuring the absorbance at 490 nm of the complex formed between phenolic acids and sodium molybdate—sodium nitrite as an equivalent of caftaric acid. The total phenolic acids content was calculated as mean value and standard deviation from three repetitions and expressed as caftaric acid equivalents (CAE) in milligrams per gram of extract.
2.9. Quantification of Flavonols
Series of reference quercetin solutions containing 0.05, 0.1, 0.15, 0.2, 0.3, 0.4, and 0.5 mg/mL of quercetin were prepared. Two millilitres of such reference were mixed with 2 mL of aluminium trichloride solution (20 g/L) in 95% (
v/
v) ethanol, and 6 mL of sodium acetate solution in ethanol (50 g/L) were added. The absorbance was read at 440 nm after 2.5 h at 20 °C. A calibration curve expressing the dependence of the absorbency on the concentration of quercetin was drawn. Seed extract samples were prepared under the same conditions using 2 mL of extract (10 g/L) in 95% ethanol instead of quercetin. All determinations were performed in triplicate. The percentage of flavanols was calculated by the formula:
where
C is the concentration of quercetin, determined from the calibration curve (mg QE/mL);
V is the volume of plant extract (mL);
m is the weight of pure plant extract (g) [
38]. Final results were calculated as mean value and standard deviation from three repetitions and expressed as milligrams of quercetin equivalents per gram of sample of cherry seeds (mg QE/g).
2.10. Statistical Analysis
To test differences between mean values for multiple groups, the analysis of variance was undertaken (ANOVA), coupled with post hoc test Tukey to identify differences when significant at the level of 5%. Additionally, statistical techniques were used to classify the data and find grouping structures between them. A hierarchical cluster analysis was performed for values of total phenolic compounds and anthocyanins considering the data obtained from the three phases of the research, using squared Euclidean distance and the average linkage between groups method. Finally, principal component factor analysis with varimax rotation was undertaken. The suitability of the data for the application of the analysis was verified by the Kaiser–Meyer–Olkin measure of sample adequacy and the Bartletts’ Test of sphericity, as well as on the values of the coefficients in the anti-image matrix. All statistical analyses were made with SPSS software (from IBM Inc., Armonk, NY, USA) version 26, and a significance level of 5% was considered (p < 0.05).
3. Results and Discussion
3.1. Preliminary Assay
Figure 2 presents the content of total phenolic compounds, anthocyanins and flavonoids in the extracts obtained in the preliminary assay, all performed at ambient temperature. The most efficient solvents for the recovery of polyphenols were the mixture water:ethanol and water extraction, using magnetic stirring (extracting approximately 1.3 mg GAE/g in both cases and without statistically significant differences between them). The least interesting extraction conditions were water using ultrasound stirring or methanol with magnetic stirring. Methanol was also inefficient in extracting flavonoids, which were maximum for 50% water:ethanol solutions (1.04 ± 0.06 mg QE/g). On the other hand, methanol removed the highest number of anthocyanins, more than 250 µg Mv3G/g. Taking the global results of this preliminary phase and considering the problems associated with methanol from an environmental point of view when compared with ethanol, as well as its highest negative health impact, the following experiments were performed with water:ethanol solutions at variable ratios and using different temperatures to maximize the contents of various phenolic compounds.
Because the samples used in the experiments consisted of waste possibly containing cherry seeds from different varieties, it is not possible to establish a direct association between the obtained results and a particular type of cherry seed, i.e., from a specific cultivar or variety. Nevertheless, it is possible that results from seeds of different cherry varieties could differ in terms of chemical composition or content of phenolic compounds. Results from other studies show that cherry kernel oil can differ in terms of composition [
39] or texture [
40] according to variety. Since the pits can be a waste possible of valorisation, they can be used both for the production of oil as well as extraction of bioactive compounds. Hence, differentiation of the chemical composition of pits, based on distinctive cultivars, could be of high relevance. On the other hand, considering that these wastes come from food processing industrial plants, most of the time they are not separated according to variety. So, additional research could be conducted on the basis of academic studies focusing on individual varieties. Górnaś et al. [
41] evaluated the effect of the cultivar of sour cherry pits on oil yield and the content of individual fatty acids, tocochromanols, carotenoids, sterols and squalene. Similar studies could, in the future, focus on the evaluation of phenolic compounds according to the variety of cherry pits.
3.2. Core Experiments for Optimization of Extraction Conditions
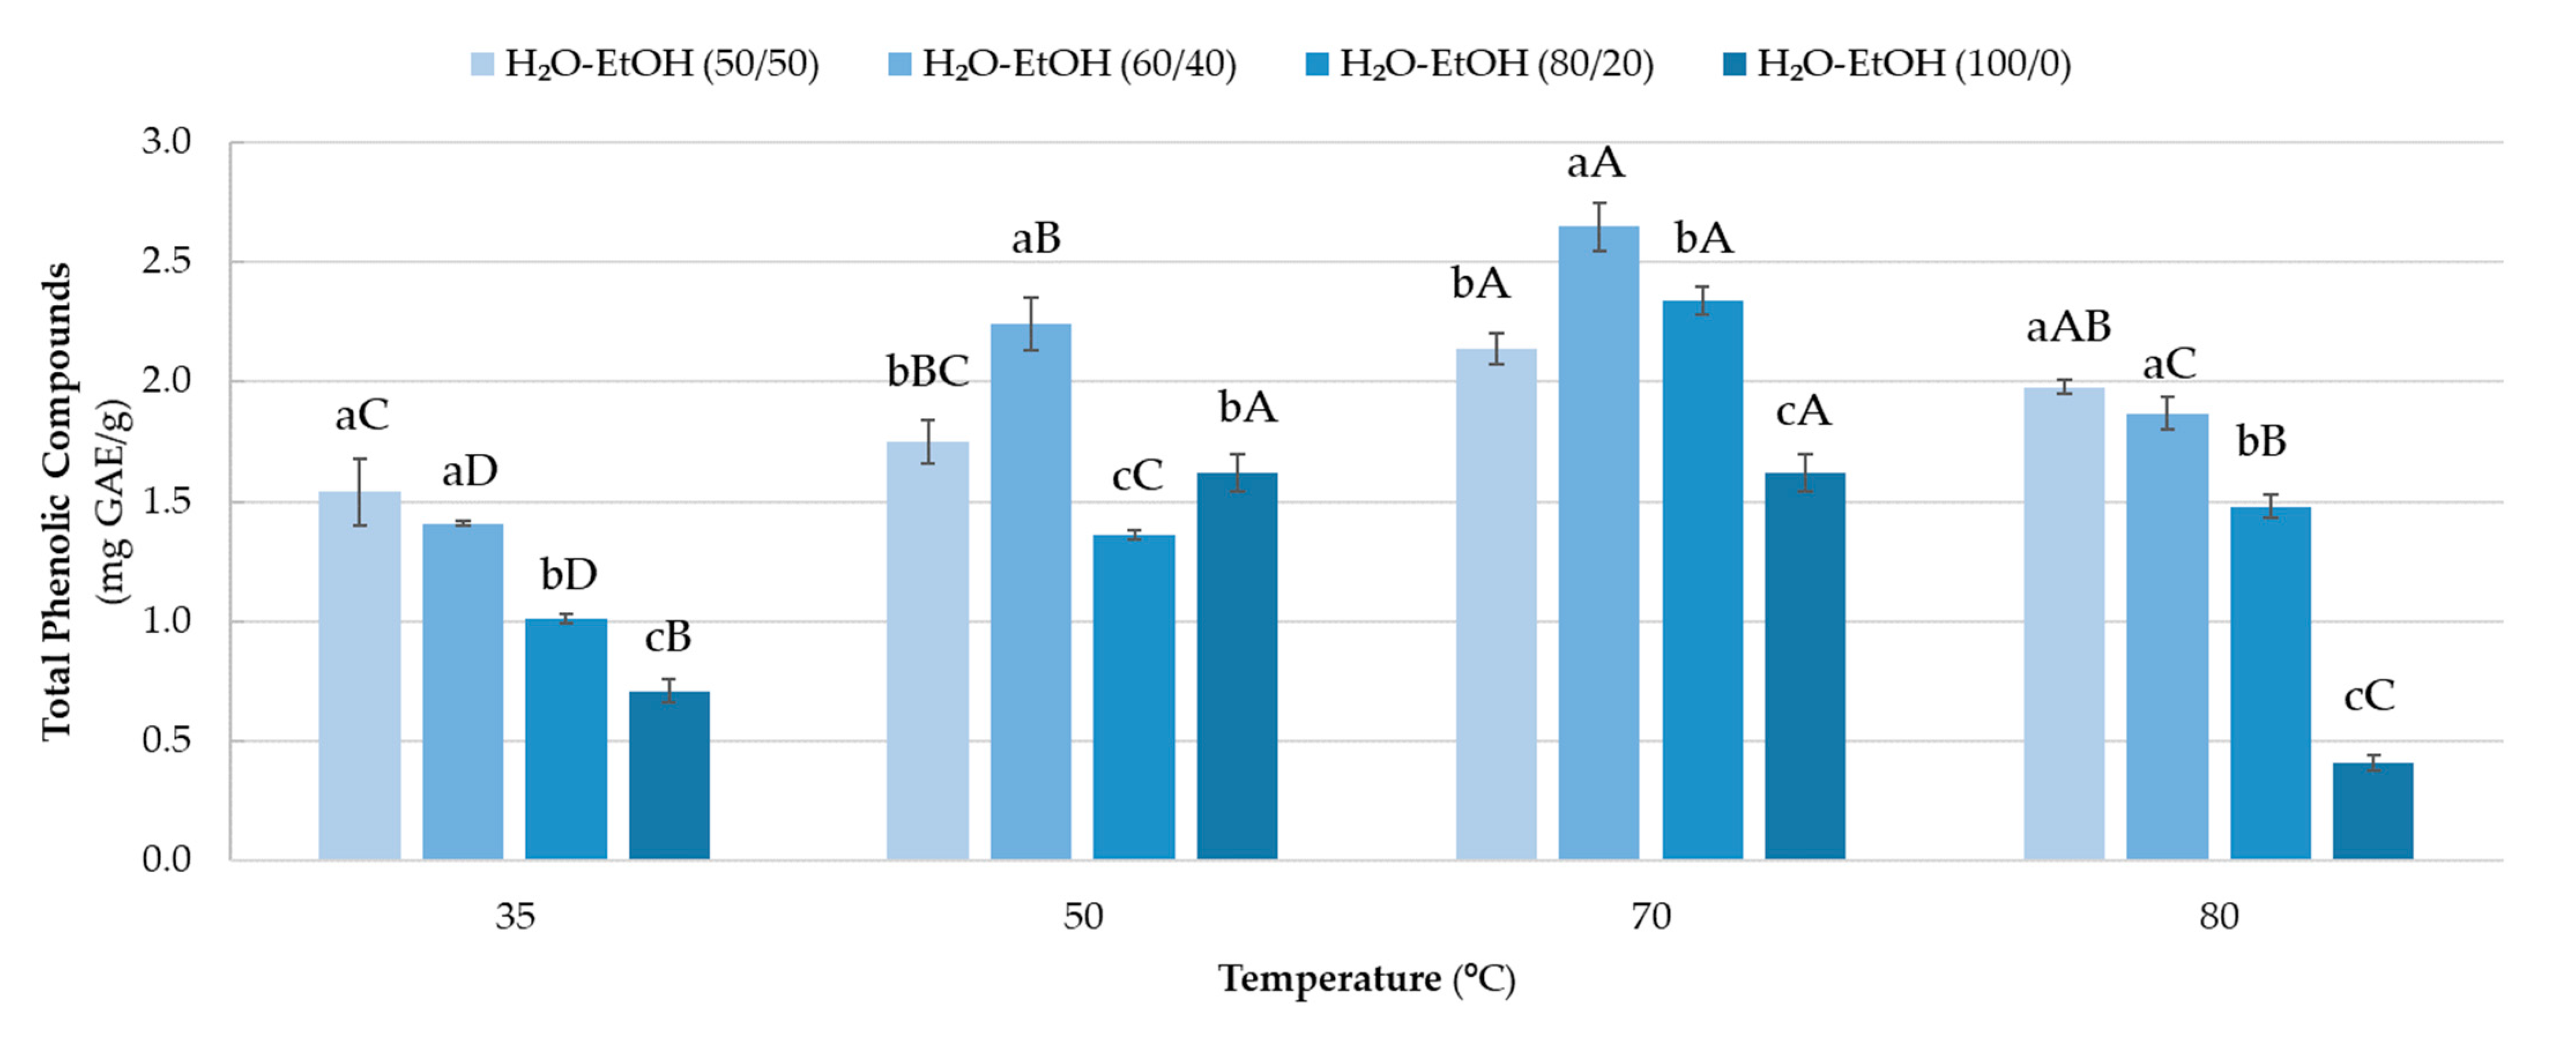
Figure 3 shows the concentrations of total phenolic compounds according to the extraction conditions (temperature and solution ratio). Results show that the best ratios to recover total phenolic compounds at 35 °C were water:ethanol 50:50 (1.54 ± 0.14 mg GAE/g) and 60:40 (1.41 ± 0.01 mg GAE/g), with no significant differences between them. Higher content of water significantly decreased the total phenolic compounds in the extract. Similar results were obtained at 80 °C. On the other hand, for 50 °C and 70 °C the highest extraction was obtained with the 60:40 ratio, decreasing for higher water content. The highest amount was obtained at 70 °C and with a 60:40 ratio. Some increase in temperature allows extracting more phenolic compounds, either due to the increased permeability of cell walls and modifications in the structure or as a response to some degree of stress-induced in the biological material. However, higher temperatures do not favour the increase in total phenolics, probably due to the thermal degradation happening around 80 °C [
36,
42]. The results obtained for the total phenolic compounds removed by ethanol: water extraction are not that different from those reported by Afonso et al. [
43] that presented amounts of total phenolics varying between 1.17 and 2.76 mg GAE/g for sweet cherry kernels extracted with 70% methanol at 70 °C.
Table 1 presents the concentrations of the different groups of phenolic compounds according to the extraction conditions (temperature and solution ratio). It was found that a change in the concentration of water:ethanol solution significantly affected the final result obtained on extracted flavonoids from SCS at lower temperatures (35 and 50 °C). The largest amount of extractable components at 35 °C was obtained using a solution of water:ethanol with a concentration of 50:50 (4.74 ± 0.05 mg QE/g). With an increase in water concentration in the solution, the amount of the extractable compounds decreased very intensively to only 0.76 ± 0.22 mg QE/g when 100% water was used. Therefore, flavonoids were more easily removed by ethanol than water and the increase in the ethanol percentage allowed better recovery of these phenolics. These results were lower than those obtained by Engida et al. [
44] with 40%, 60% and 80% ethanol solutions in the extraction of flavonoids from sarang semut (
Myrmecodia pendan) (63.28 ± 1.75 mg QE/g) and by Domingués-Perles et al. [
45] from red grape (
Vitis vinifera L.) (37.34 ± 6.60 to 71.49 ± 2.33 mg CE/g). When extracting the compounds at a temperature of 50 °C, again, the amount of the extracted flavonoids decreased for a lower concentration of the ethanol:water solution used. The most significant number of flavonoids (4.45 ± 0.12 mg QE/g) was extracted for 50:50 water:ethanol ratio. Globally, it was found that increasing temperatures as well as increasing the percentage of ethanol yields higher concentrations of flavonoids, being maximum at 80 °C and 50:50 ratio (7.26 ± 0.05 mg QE/g). The solubilisation of compounds in a specific solvent is dependent on the polarity of the molecules of the solvent as well as those to be solubilized, which explains differences in the solubilisation capacity of water versus ethanol. According to Herrera-Pool et al. [
46] there is a direct relation between the dielectric constant accounting for the polarity of the solvents and the extraction of phenolic compounds. The results obtained in the present work for the content of flavonoids are higher than those obtained by Afonso et al. [
43] that presented amounts of total flavonoids varying between 0.23 ± 0.03 and 2.59 ± 0.44 mg CE/g for sweet cherry kernels extracted with 70% methanol at 70 °C but very similar with results obtained by Beghari et al. [
47], who presented the total amount of flavonoids ranging from 1.45 to 7.30 mg CE/g for sweet cherry seeds extracted with a solution of 50:50 water:ethanol.
The result for the extraction of ortho-diphenols at 35 °C showed similar values for the concentration of the water:ethanol solution 50:50 and 60:40 (around 20 mg GAE/g), but with an increase in the concentration of water in the solution; the amount of the extracted compounds decreased significantly in a similar trend as that observed previously for flavonoids. Similar results were presented by Domingués-Perles et al. [
45] for red grape stems, where ortho-diphenols extraction was higher for higher concentrations of ethanol. At 50 °C and 70 °C, the concentrations of ortho-diphenols differed significantly for all used concentrations of the water:ethanol solution, decreasing with decreasing ethanol concentration. The highest values were obtained again for the 50:50 ratio solution (around 21 mg GAE/g). Unlike the trends observed for all other temperatures, for 80 °C there were no significant differences for the extracts obtained with ratios 50:50, 60:40 or 80:20 ratios, and only for the 100% water solution was the amount significantly lower (7.66 ± 0.15 mg GAE/g). Meanwhile, it should be noted that the sample with the largest amount of ortho-diphenols (21.47 ± 0.40 mg GAE/g) was obtained at 50 °C, and the most efficient solution was water:ethanol 50:50. This was higher than the results obtained by Afonso et al. [
43] for seeds of sweet cherry extracted with a water:methanol solution, which varied from 0.09 ± 0.01 to 0.16 ± 0.02 mg CE/g. The differences in the values might be attributed to the standard used in each of the determinations: gallic acid in this case and catechin in the work by Afonso et al. [
43].
The best extracting conditions to maximize the concentration of proanthocyanidins were using water:ethanol ratio of 50:50 at 70 °C (6.43 ± 0.38 mg CE/g), and also the 60:40 ratio (5.93 ± 0.22 mg CE/g) at the same temperature, with these conditions providing results statistically not significantly different. So, it was found that with the increase in water percentage, and regardless of temperature, there was a decrease in the amount of extracted proanthocyanidins, as previously observed for other families of phenolics. The range of values obtained in the present work is higher than the results obtained by Chaovanalikit et al. [
48], who presented total amounts of proanthocyanidins ranging from 4.70 ± 0.81 to 22.5 ± 1.86 mg epicatechin equivalents/100 g for sweet cherry seeds extracted with 70% (
v:
v) acetone.
The results for flavonols extraction showed that the highest values were achieved with the 50:50 water:ethanol solution for higher temperatures (3.88 ± 0.28 and 3.63 ± 0.01 mg QE/g at 70 and 80 °C, respectively). However, for lower temperatures, the efficacy of extraction of flavonols increased with the ratio of water in the extracting solution, with relatively high amounts quantified at 35 and 50 °C when the solvent used was water at 100% (3.32 ± 0.21 and 2.61 ± 0.07 mg QE/g, respectively). The least efficient conditions for flavonols’ extraction were 50 °C, with extracting solution water:ethanol 50:50 (1.36 ± 0.04 mg QE/g) and 70 °C with extracting solution water 100% (1.37 ± 0.02 mg QE/g). These results were in a higher range than those obtained by Chaovanalikit et al. [
48], which presented total amounts of flavonols ranging from 1.59 ± 0.21 to 63.2 ± 4.17 mg rutin equivalents/100 g for sweet cherry seeds extracted with 70% (
v/
v) acetone.
The number of phenolic acids was lower than all the other phenolic compounds. The results show that there was, again, increased extraction for a higher percentage of ethanol in the solution. Extraction at 70 °C and 80 °C presented a significant yield compared to the extraction results at 35 °C and 50 °C. The highest amount was obtained at 80 °C in the water:ethanol solution 50:50 with a value of 1.68 ± 0.05 mg CAE/g, which was higher than the result presented by Chaovanalikit et al. [
48] for total amounts of phenolic acids for sweet cherry seeds extracted with 70% (
v/
v) acetone (ranging from 5.58 ± 0.38 to 14.5 ± 1.28 mg chlorogenic acid/100 g).
Regarding the results for the extraction of total anthocyanins, it was observed that at 50 °C for all water:ethanol concentrations, the results were similar (in the range 23.71 ± 1.22 to 26.63 ± 0.37 µg Mv3G/g, with no significant differences), i.e., the proportion of ethanol in the solution did not influence the extraction capacity. However, for higher temperatures, 70 or 80 °C, the use of water (100%) becomes much less efficient in extracting the anthocyanins. At 80 °C the highest amount was obtained with a ratio of 80:20 (23.50 ± 1.95 µg Mv3G/g), and the lowest was obtained for 100% water (13.58 ± 0.86 µg Mv3G/g). The results, interestingly, showed that at 35 °C and using a solution with a ratio 80:20, maximum anthocyanins content was extracted (66.08 ± 0.49 µg Mv3G/g). On the other hand, the lowest amount was found in the assay performed with a ratio of 60:40 for the extracting solution (16.17 ± 0.65 µg Mv3G/g). The incredibly high value accounted for anthocyanins in the 80:20 extract compared with all other results led us to carry out a test to verify if there was a trend explaining this high value.
3.3. Additional Tests for Temperature Range 30–50 °C
To verify the results obtained previously for the anthocyanins, an additional test was carried out, for which the 80:20 ratio water:ethanol was chosen, and the extraction was performed at different temperatures around 35 °C (varying from 30 to 45 °C). These additional tests aimed to verify if the high value obtained for the anthocyanins with solution 80:20 and at a temperature of 35 °C (66.08 ± 0.49 µg Mv3G/g) was not considered an outlier, resulting from a possible experimental error, since it was considerably higher than for all other conditions (concentrations and temperatures), varying from a minimum of 12.29 ± 0.56 to a maximum of 26.63 ± 0.37 µg Mv3G/g.
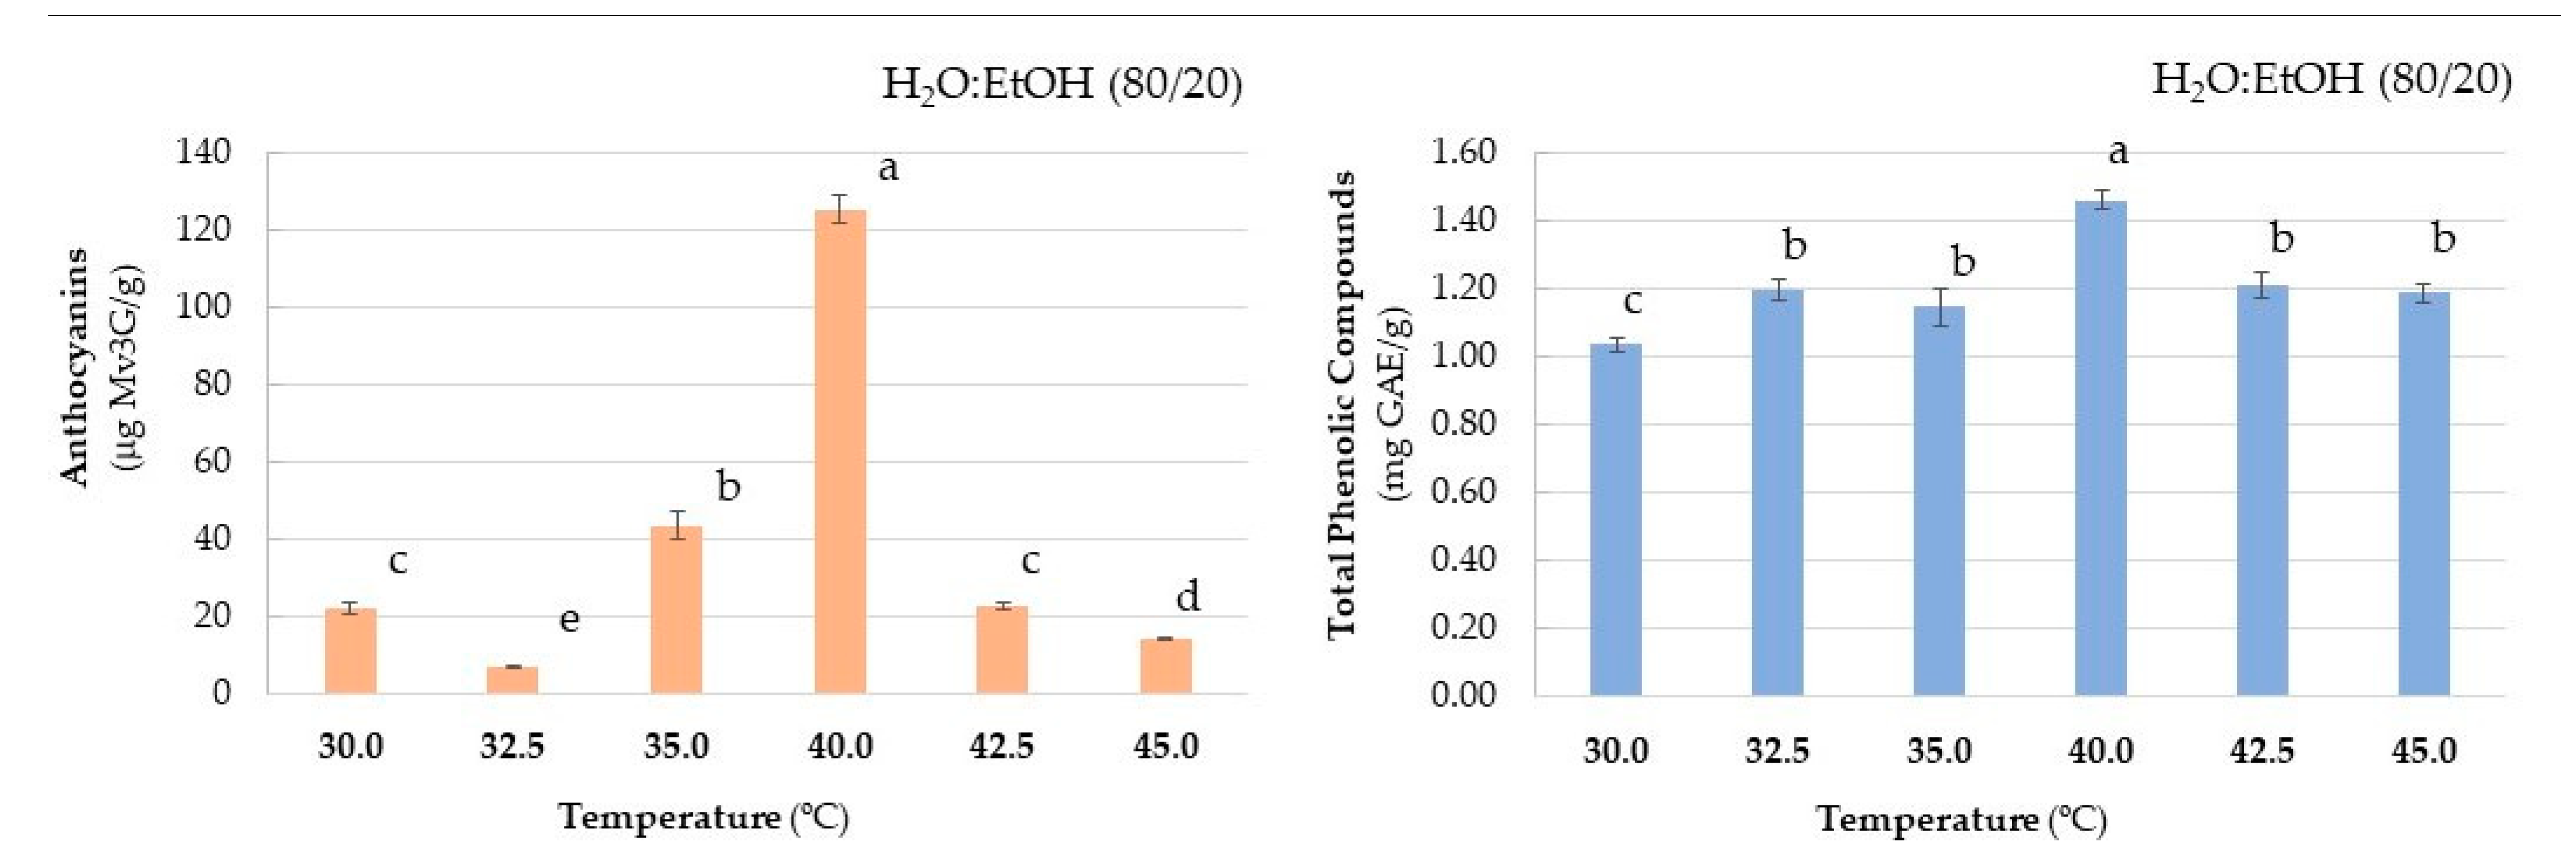
Figure 4 shows the content of anthocyanins and also of total phenolic compounds in the extracts obtained in this additional test with the aforementioned conditions.
Regarding the contents of anthocyanins, a trend of increasing concentration with temperature until 40 °C was observed, followed by a decrease after that, with significant differences for practically all temperatures. As previously observed for the temperature of 35 °C, an even more considerable increase in the extracted amount was obtained at 40 °C (125.37 ± 3.90 μgMv3G/g), which seems to be the best temperature for the extraction of anthocyanins. In fact, for temperatures higher than 40 °C, the extraction efficiency decreased again, so that similar values were obtained at 30 °C and 42.5 °C (21.67 ± 1.48 and 22.64 ± 0.86 μgMv3G/g, respectively). The maximum extraction of anthocyanins was in a similar range when compared to the value of 10.4 mg of cyanodin-3-glucoside/100 g (equal to 104 μg/g) obtained by Chaovanalikit et al. [
48] for cherry seeds of the cultivar Bing, but higher than the values for cherry seeds of cultivars Royal Ann, Rainier and Montmorency, determined by the same authors (0.1 to 0.8 mg/100 g corresponding to 1–8 μg/g).
Concerning the total phenolic compounds, it was found that the lowest value of 1.03 ± 0.02 mg GAE/g was obtained at 30 °C. However, the results increased with the increase in temperature up to 40 °C, as verified for the anthocyanins. For example, at 32.5 °C and 35 °C, the amounts were 1.20 ± 0.03 and 1.15 ± 0.06 mg GAE/g, respectively, without significant differences. It should be noted that 40 °C was the best temperature for extracting total phenolic compounds, with a value of 1.46 ± 0.03 mg GAE/g. However, it was observed that the values fall again for 42.5 °C and 45 °C, being 1.21 ± 0.04 and 1.19 ± 0.03 mg GAE/g, respectively. These are very similar to the values obtained at 32.5 °C and 35 °C. These results confirm that a temperature of 40 °C appears to be optimal for the recovery of total phenolic compounds and anthocyanins from the SCS.
3.4. Global Analysis of Extracts
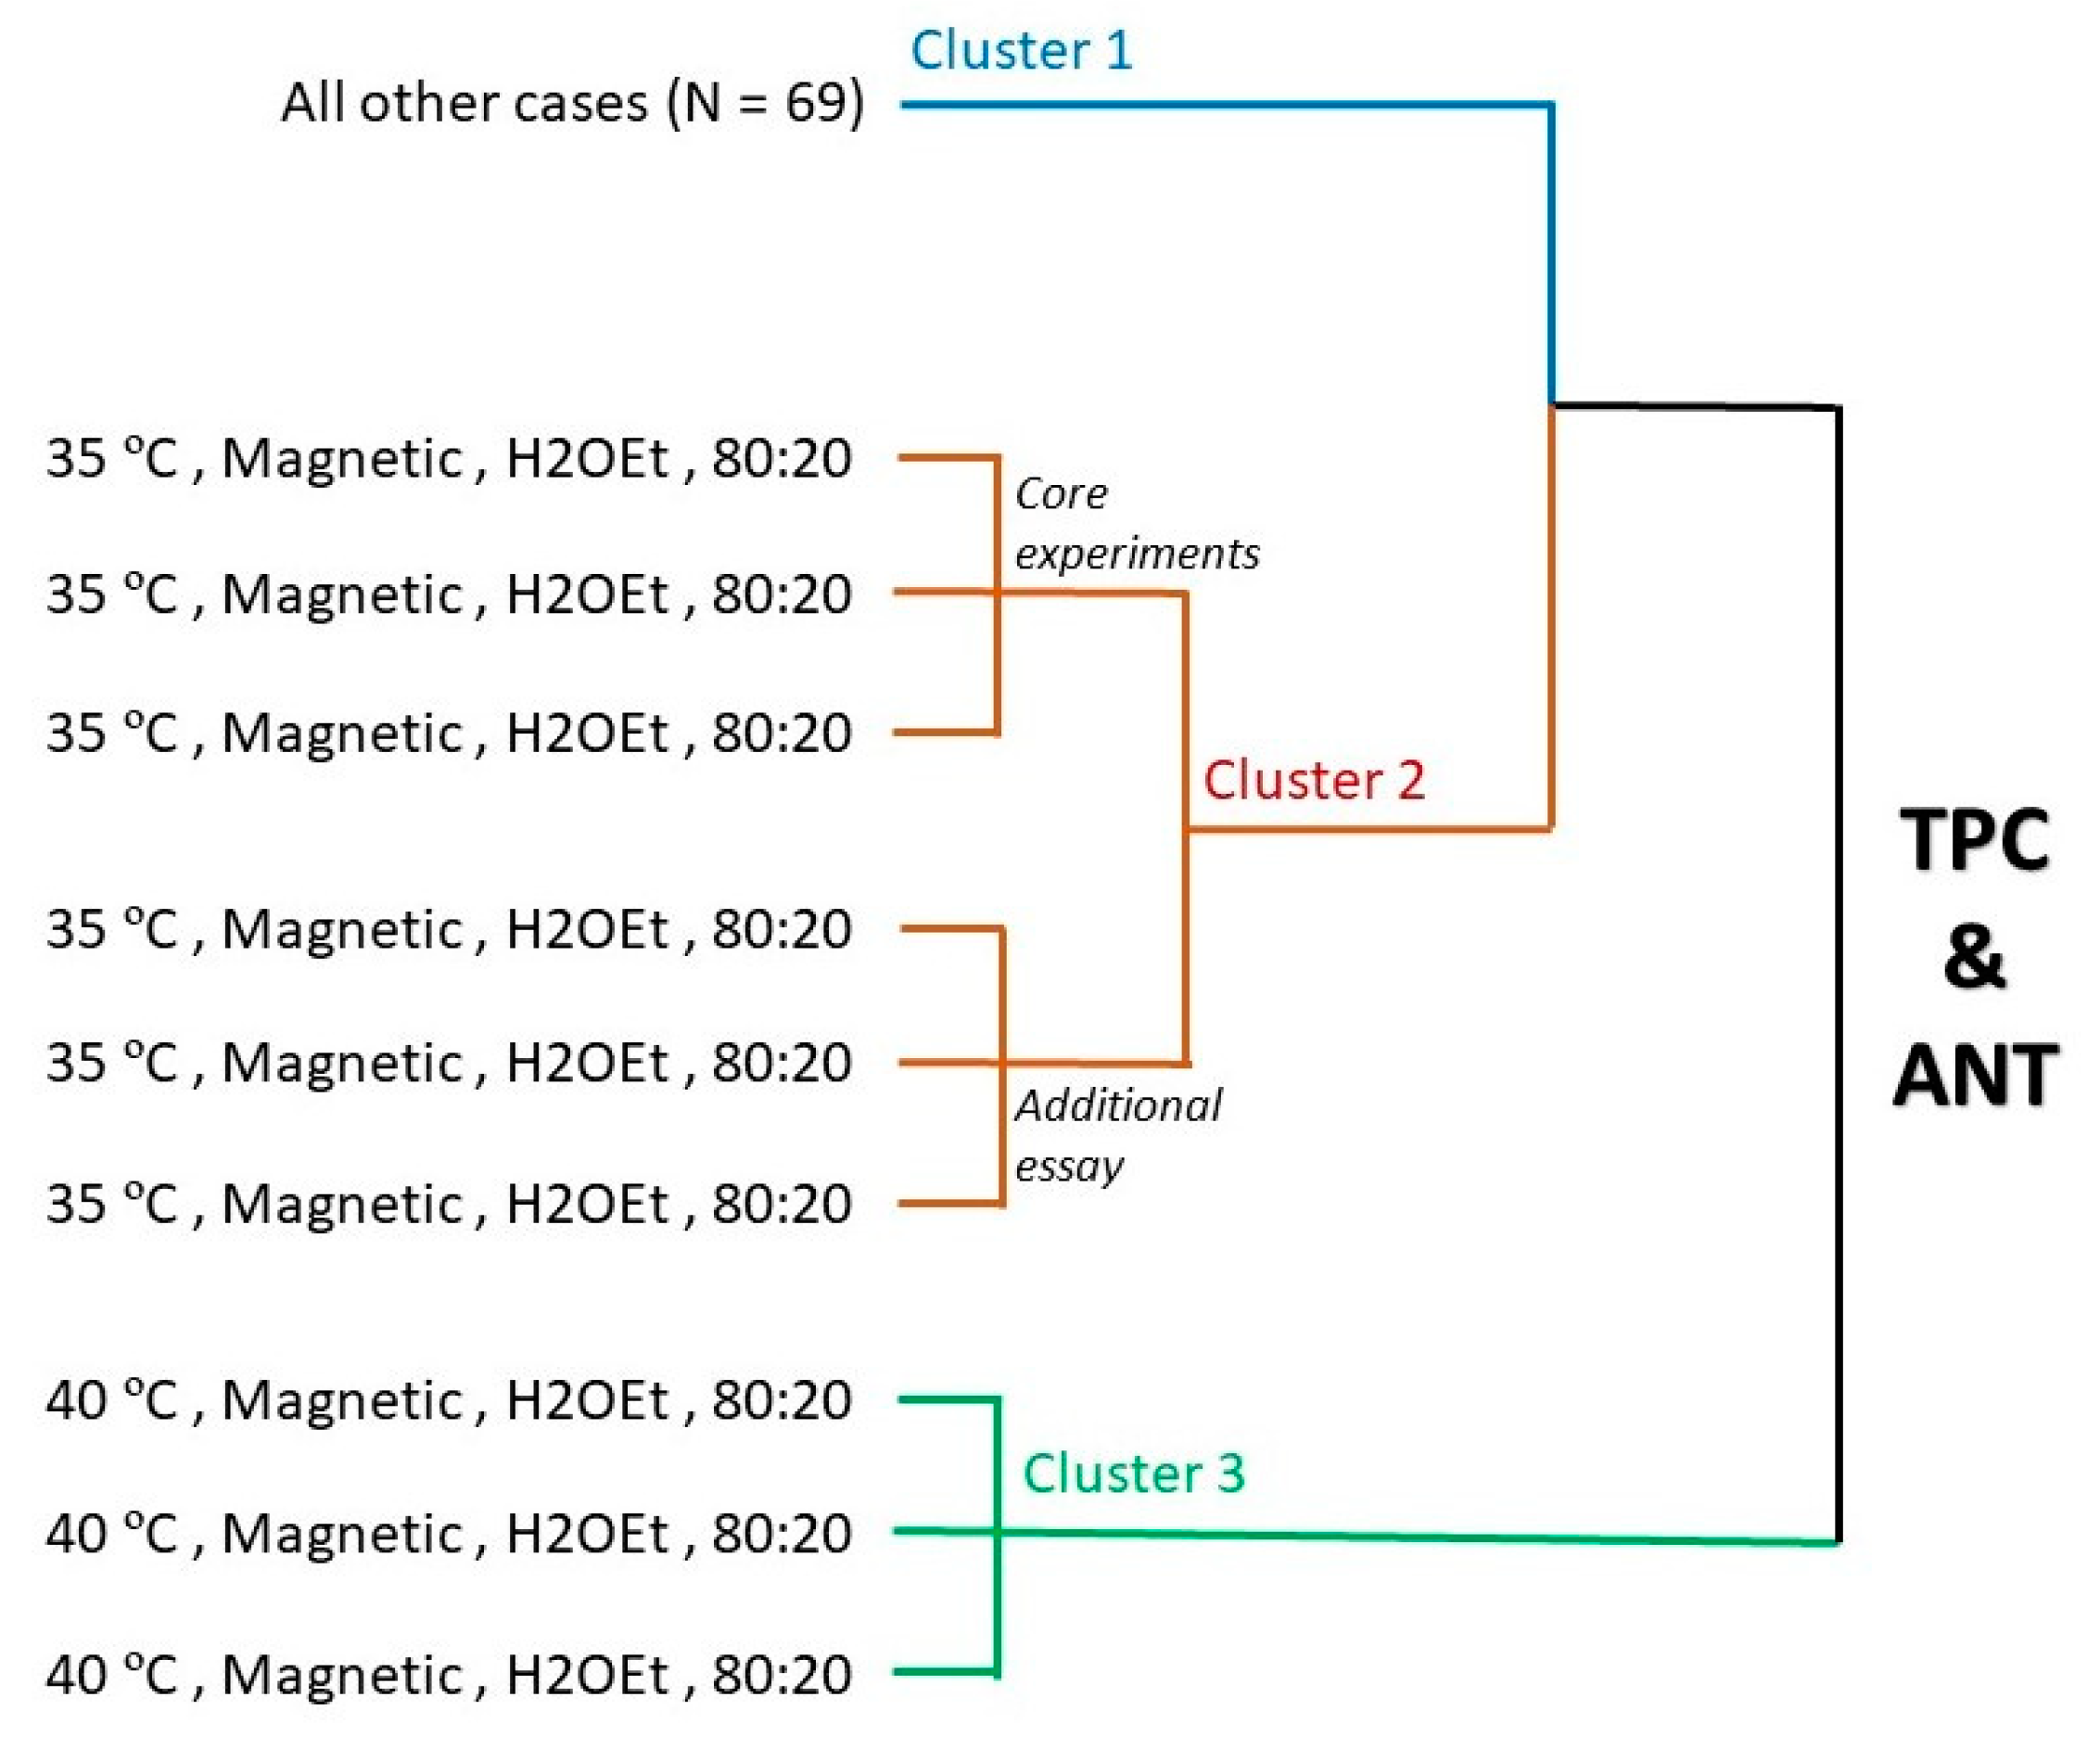
Figure 5 shows the dendogram for hierarchical clustering obtained for total phenolic compounds and antocyanins using the average linkage between groups method and considering the data from all experiments, i.e., the preliminary assay, the core experiments and also the additional assay. The results confirm that measurements made at 40 °C, with magnetic stirring and using extracts obtained with aqueous solutions of ethanol (80:20 %
v/
v) constitute a separate cluster and that those obtained with similar conditions but for a slightly lower temperature of 35 °C constitute another isolated cluster. These results confirm the high contents found for these specific conditions, particularly in what concerns the anthocyanins.
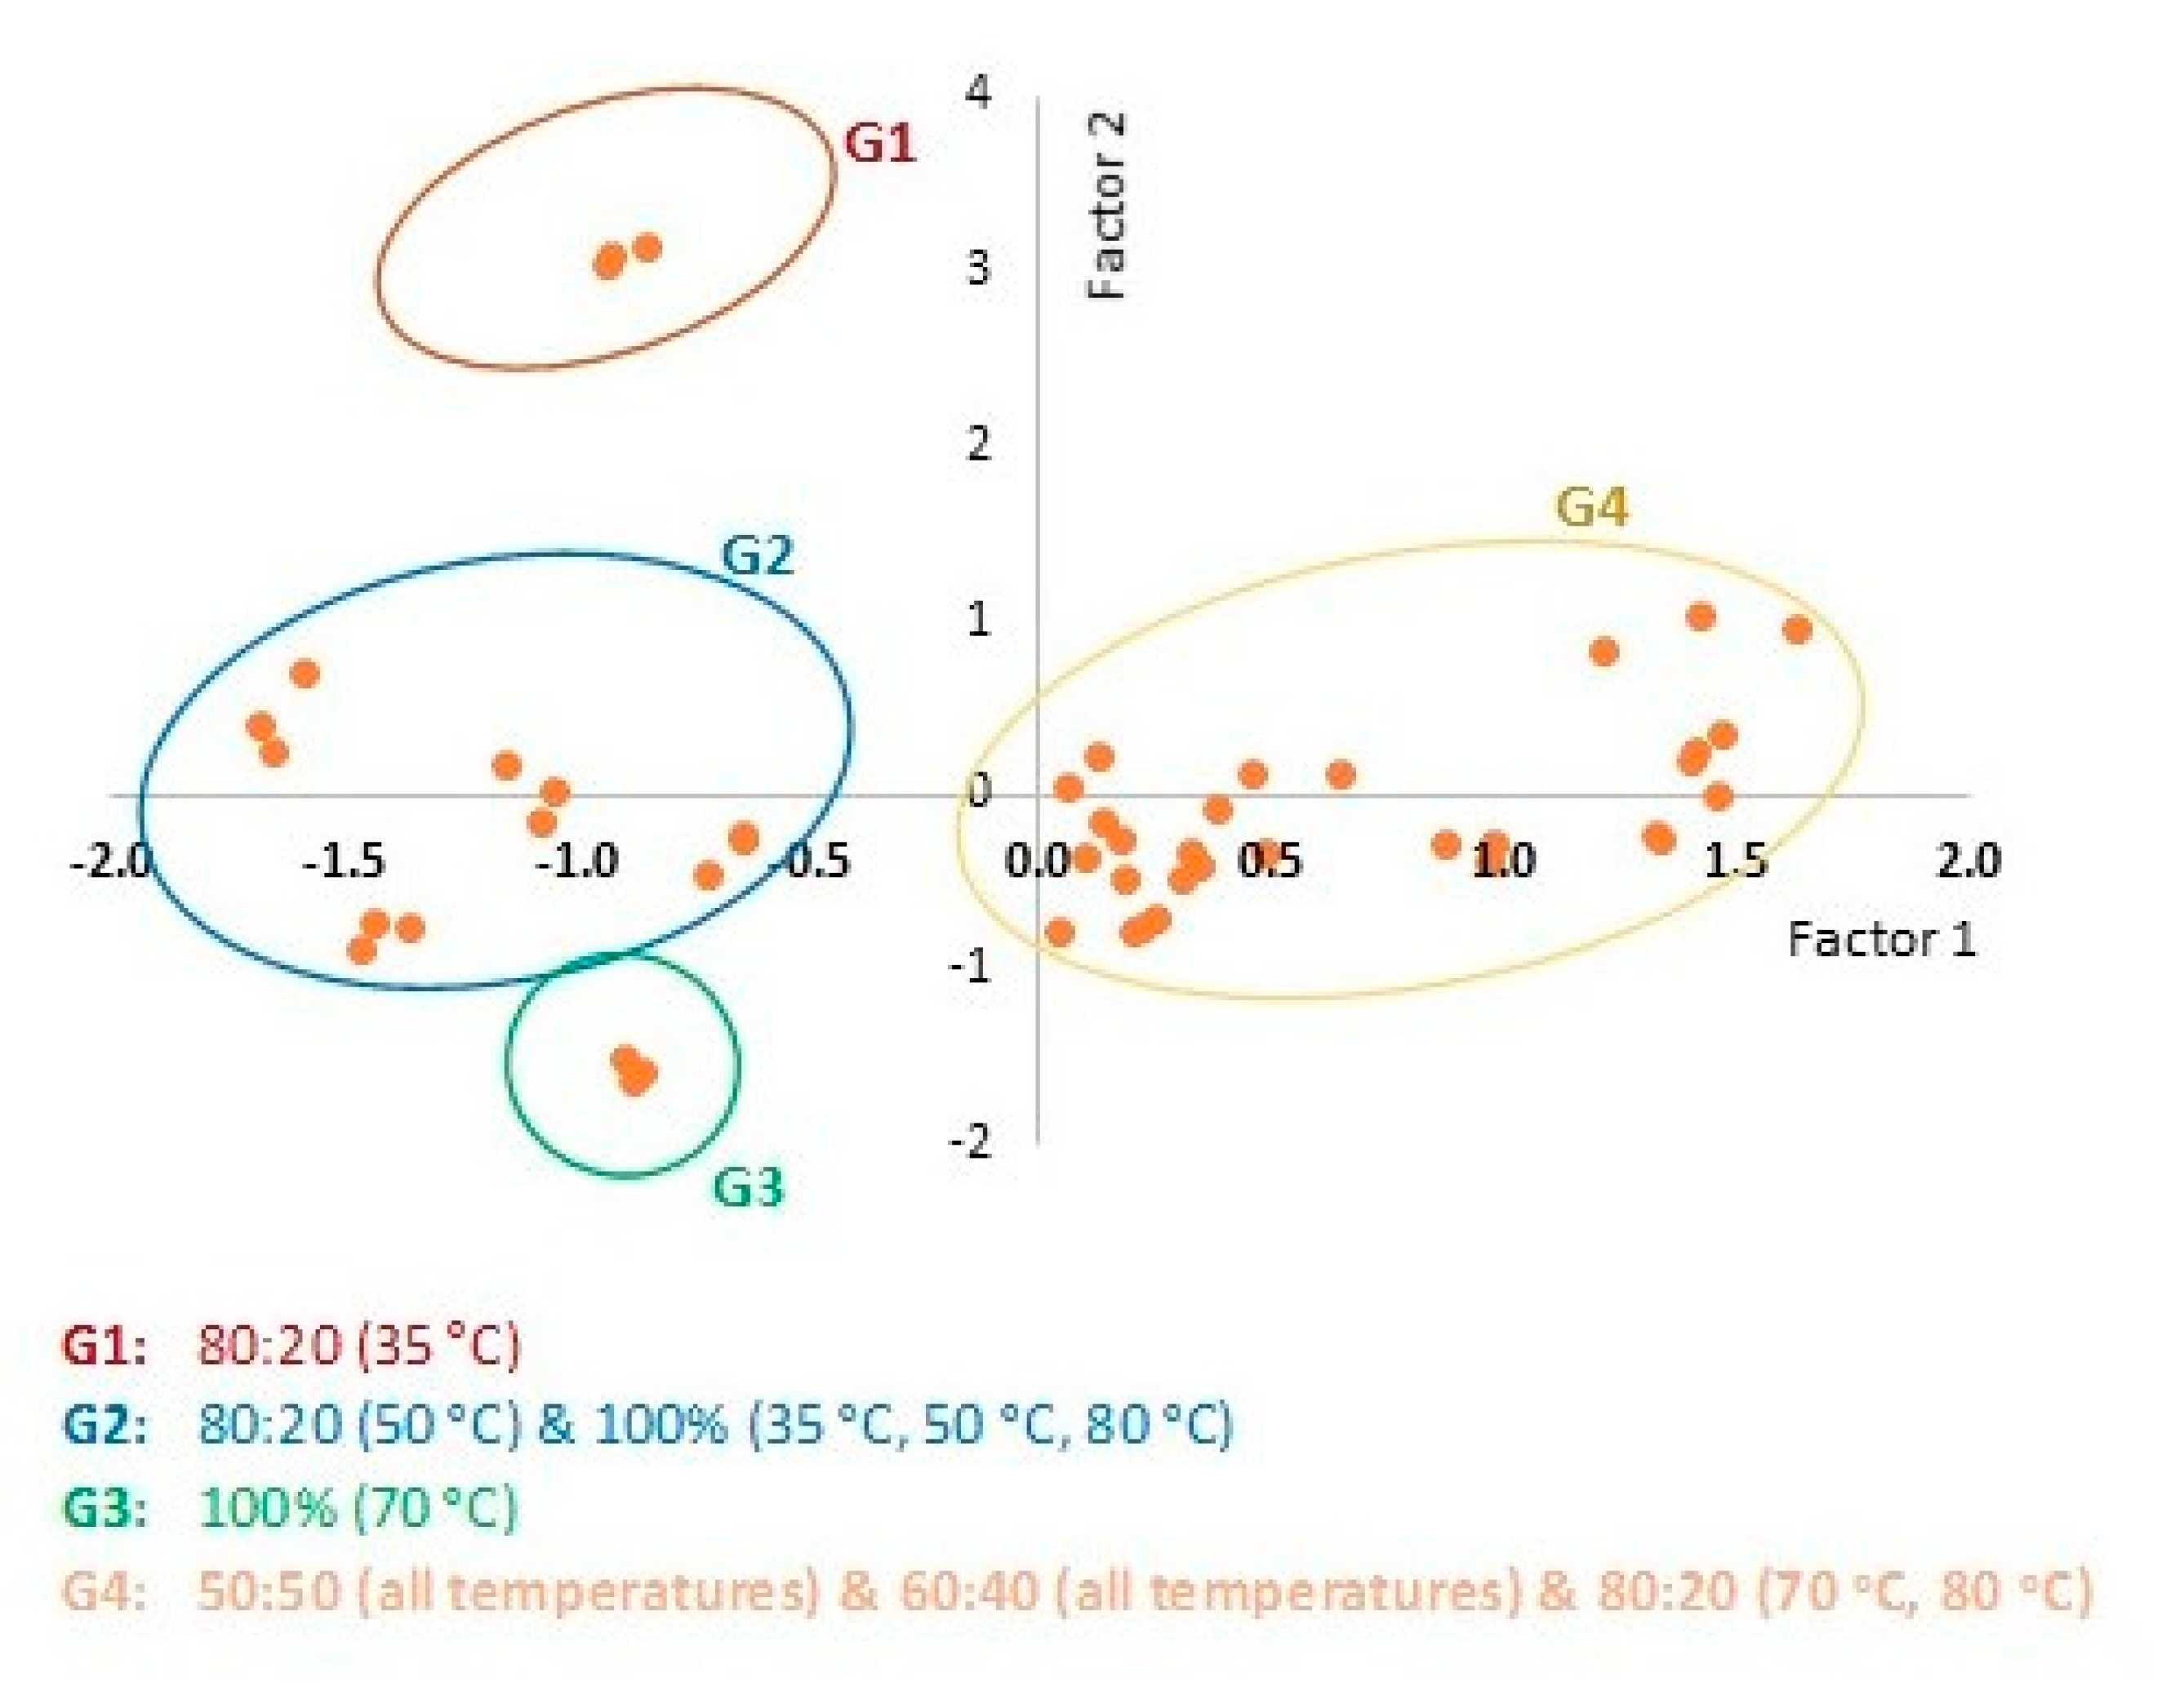
Considering all variables measured during phase two (the core experiments), factor analysis was also carried out. The Kaiser–Meyer–Olkin (KMO) measure of sample adequacy was reasonably high (KMO = 0.732), and the Bartletts’ Test of sphericity was highly significant (
p < 0.0005). The anti-image matrix showed practically all values higher than 0.5, the highest being for flavonoids (0.894) and lower for anthocyanins and flavonols. The results showed that two factors were extracted, which explained 75.65% of the variance (58.06% for factor 1 and 17.59% for factor 2). The rotated component matrix, obtained by principal component analysis and Varimax rotation in three iterations, indicated that anthocyanins and flavonols are associated with factor 2. In contrast, all other measured variables are associated with factor 1. The graph in
Figure 6 clearly shows four groups. One group for the samples with water:thanol 80:20 (%
v/
v) for 35 °C (G1) corresponded to the extraction of the highest amounts of anthocyanins, thus corresponding to the highest values of factor 2. Another group accounts for the samples 100% water at 70 °C (G3), with particularly low values of factor 2, i.e., low contents of anthocyanins and flavonols. The other two groups are differentiated in terms of their values of factor 1, where group G2 refers to extracts with low contents of total phenolic compounds, flavonoids, proanthocyanidins, ortho-diphenols and phenolic acids. At the same time, G4 includes extracts with higher contents in those compounds.
4. Conclusions
The main focus in the present work was the extraction of polyphenols from cherry seeds that are considered residues of food processing industries. The extraction potential of different conditions was investigated to optimize the extraction parameters, such as solvent and temperature, for the maximum yield of extracted bioactive compounds. The bioactive compounds evaluated were total phenolic compounds, anthocyanins, flavonoids, ortho-diphenols, proanthocyanidins, flavonols and phenolic acids. The results showed that the best extraction technique for phenolic compounds was an aqueous ethanol solution. The results indicated that temperatures that are too high, of 80 °C, are not beneficial and can degrade some families of phenolic compounds, reducing the extraction of total phenolic compounds, anthocyanins ortho-diphenols, proanthocyanidins and flavonols. On the contrary, these temperatures favour the recovery of flavonoids and phenolic acids. Concerning the composition of the extracting solution, most families of phenolics analysed were better extracted with water:ethanol solution with a ratio 50:50, except for total phenolic compounds (best for ratio 60:40) and anthocyanins (best for ratio 80:20). Given these results, and after discarding the use of methanol, which showed lower extracting capacity in a preliminary assay, ethanol is less pollutant, and the ratio of water can be 50% or even higher to obtain desirable results. Nonetheless, it was also concluded that using 100% water would not allow a proper extraction of the bioactive molecules studied. Nowadays, there are more attempts to use environmentally friendly extraction methods, using a more sustainable approach, resulting in the maximum recovery of bioactive compounds, using ecologically correct solvents and minimum processing costs. Extracts of bioactive compounds obtained from SCS can find other applications in the food, pharmaceutical or cosmetic industries, thus contributing to the eco-valorisation of agricultural or industrial residues, and the principles of circular economy.


 ,
, 


