Article

Identification and Quantification of Actual Evapotranspiration Using Integrated Satellite Data for Sustainable Water Management in Dry Areas

1
International Center for Agricultural Research in Dry Areas, Victoria Sq Ismail El-Shaaer Building Maadi, Cairo 11742, Egypt
2
National Authority for Remote Sensing and Space Sciences (NARSS), Elnozha El-Gedidah, Cairo 11843, Egypt
3
Arab Organization for Agricultural Development, Cairo 11843, Egypt
4
Faculty of Agriculture, Ain Shams University, Hadayek Shobra, Cairo 11241, Egypt
5
Office of Innovation, Food and Agriculture Organization of the United Nations (UN-FAO), 00120 Rome, Italy
6
International Center for Agricultural Research in Dry Areas, Rabat 10080, Morocco
*
Author to whom correspondence should be addressed.
Submission received: 6 August 2022 / Revised: 2 September 2022 / Accepted: 4 September 2022 / Published: 9 September 2022
(This article belongs to the Special Issue Transforming AgriFood Systems under a Changing Climate)

Abstract

:
Evapotranspiration (ET) is a significant consumer of irrigation water and precipitation on cropland. Global and regional interest in the sustainable management of limited freshwater supplies to meet the rapidly increasing population and food demands has resulted in advanced scientific research on ET measurement, rapid water accounting, and irrigation schedules in the NENA region. The primary goal of this paper is to compare actual daily evapotranspiration (ET) collected by a remote sensing model and validated by Energy Balance (EB) flux tower field measurements. The flux tower was installed in a wheat field in Sids Agricultural Research Station in Beni Suef Governorate. Through the integration of Moderate Resolution Imaging Spectroradiometer (MODIS) Terra and Sentinel-2 data, a new remote sensing-based ET model is built on two parties: Thermal condition factor (TCF) and vegetation condition fraction (VCF). The remote sensing-based ET estimation model was evaluated using ET field measurements from the Energy Balance flux tower. The land use and land cover maps were created to assist the interpretation of remotely sensed ET data. Field data for five categories were collected to test the accuracy of the land use and cover maps: Water bodies (93 points), urban areas (252 points), trees (104 points), other field crops (227 points), and wheat (249 points), for a total of 925 ground points. The Google Earth Engine (GEE) imported sentinel-2 datasets and filtered the necessary dates and regions. From 1 October 2020 to 30 May 2021, sentinel-2 data were processed and transformed into the Normalized Difference Vegetation Index (NDVI), Normalized Difference Water Index (NDWI), and Normalized Difference Built-up Index (NDBI), which were then combined. The composite layer data were classified using the Random Forest (RF) method on the GEE platform, and the results showed an overall accuracy of 91 percent. The validation factors revealed good indices when RS-based ET results were compared to ground-measured ET. The Root Mean Square Error (RMSE) was 0.84 mm/day. The ‘r’ and ‘d’ values indicated satisfactory results, where ‘r’ yielded a value of 0.785, which indicates that the correlation between predicted and reference results is robust. The analysis of d values revealed a high degree of correlation between predicted (RS-based ET) and reference results (measured ET). The d value was found to be 0.872. Between 21 November 2020 and 30 April 2021, RS-based accumulated ET was 418 mm/season, while ground-measured ET was 376 mm/season. The new RS-based ET model produced acceptable daily and seasonal results.

1. Introduction

Egypt is a water-scarce country, with extreme water scarcity predicted by 2025 [1]. As a result, it is necessary to plan the available water resources strategically and sustainably in terms of management and allocation, as well as to implement good practices to ensure alignment with the imperatives of setting appropriate limits on water consumption and making the best use of each drop of water to improve water productivity and water efficiency at the farm and regional levels.
The agricultural water demand and supply improvements are required to rationalize agricultural water use under current and future weather conditions. Irrigation scheduling is the most effective water management practice based on precise evapotranspiration estimates. Estimating reference evapotranspiration (ETo) is the first practical step in determining agricultural water demands, which have a significant economic impact, particularly in arid areas. The ETo is calculated using on-site meteorological data and then multiplied by the crop coefficient (Kc) to estimate crop evapotranspiration (ETc), which is then multiplied by the stress coefficient (Ks) to obtain actual evapotranspiration (ET) [2,3,4,5,6,7]. Exact evapotranspiration estimations are required to manage crop water demand [8,9]. The difficulty of obtaining accurate field measurements is concurrent with using actual evapotranspiration (ET) for irrigation scheduling. ETo can be calculated using a weather station with a reference surface but determining actual evapotranspiration (ET) requires more sophisticated (and expensive) technology.
The actual evapotranspiration (ET) could be detected in two ways: First, the water balance equation, and second, the energy balance equation. The parameters are precisely measured by the two methods using field devices during the growth period. The field measurements give precise data but represent one field or specific area. To maximize the benefits of these data, it is better to evaluate and/or calibrate higher spatial distribution data, such as space-borne satellite data.
The actual evapotranspiration (ET) measurements were collected from an Energy Balance (EB) station to validate the actual evapotranspiration (ET) derived from satellite data. The station is installed in a wheat field at Sids station in Beni Suef Governorate, Egypt.
The energy balance depicts how the sun’s radiant energy reaches the earth’s surface. The sun’s rays are either reflected or absorbed. The following parameters are determined by the equation of energy balance (Equation (1)):
Rn − H − G = LE
where Rn stands for net radiation, LE stands for latent heat flow, H stands for sensible heat flux, and G stands for soil heat flux (all in W/m2) [1,10]. The energy balance describes the dynamics of radiant energy dispersion from the sun to the terrestrial surface. The fraction absorbed is the Rn, which is positive when energy moves toward the surface (plant canopy) and negative when energy moves away from the surface. The absorbed Rn can then be transmitted to the soil as G, to the air as H, or used to evaporate water as LE.
The energy balance approach and energy balance flux tower technique provide reasonably accurate estimates for ecosystem water balances at a low cost [11]. It has been used to create annual water budgets at the ecosystem level [1,10,11,12]. ET data from energy balance towers are routinely used to validate classical hydrologic models [6].
Thermal infrared spectrum data are used to model energy balance equation components such as net radiation, soil heat flow, sensible heat flux, and latent heat flux. Most satellite instruments have a lower spatial resolution and require calibrated satellite imagery. When modeling large-scale ET with diverse surface conditions, critical surface features that affect energy balance must be preserved.
The majority of previous studies in this investigated area focused on estimating the crop coefficient (Kc) using satellite data (FAO 56) and calculating crop evapotranspiration (ETc) by multiplying the reference ETo by the Crop coefficient (Kc). Simultaneously, soil evaporation is negligible [13], and Penman–Monteith is one of the best empirical models. Still, precise in situ measurements are required, which is difficult and costly for developing countries. Furthermore, the current study overcomes those challenges by erecting an energy balance flux tower to measure actual evapotranspiration and obtain the most accurate in situ data in measuring all energy balance components, soil heat flux (G), and sensible heat flux (H). In addition to upgrading and updating crop coefficient (Kc) using the equation (Kc = ET/ETo) to improve water management in Bani Swaif, latent heat (LE) was divided by the latent heat of vaporization to obtain the actual ET using the surface energy balance equation: LE = Rn − G − H.
The cultivated area must be determined to estimate the water consumption of the wheat crop. In the case of small landholdings, high spatial resolution is required. The average acreage in Egypt’s Nile delta and the valley is less than 0.5 hectares (ha), necessitating high satellite data resolution, such as sentinel-2, with a spatial resolution of 10 m or higher. Cooperation among farmers improves crop monitoring and yield forecasting in such areas by cultivating the same crop simultaneously with the same cultivar. However, there is a complex agricultural system in the absence of crop rotation, which was common in the past.
Analyzing land-use intensity or agricultural land abandonment necessitates the use of accurate geographic data [14]. The detection and mapping of croplands using satellite data archives have been validated. Existing high-resolution cropland maps (such as 10 m from Sentinel-2) are not provided annually due to a lack of in situ reference data, irregular timing of Landsat and Sentinel-2 image time series, and enormous agro-climatic variability [15]. Landsat is the most commonly used remote sensing data for cropland classification mapping and tracking change over time [16,17,18]; high spatiotemporal resolution and long-term data are required in many decision support applications. Sentinel-2 data became available in 2015, with a temporal resolution of 10 days and multi-spatial resolutions (10 m, 20, and 60 m). In 2017, a temporal resolution of 5 days became available following the second satellite launch (Sentinel-2b).
Processing “huge data” and obtaining cloud-free images are two significant challenges for large-scale land cover mapping. Daily updates to the database’s massive collection of global historical satellite data from 1972 to the present improve spatial and temporal resolutions. It would be highly time-consuming to preprocess data using standard methods such as cloud masking or atmospheric correction. Large datasets necessitate large storage capacities and powerful processing and labor. When dealing with high-level data availability scenarios requiring complex operations, it is critical to use highly efficient processors. Users can quickly access and analyze massive pre-processed geographic datasets using web-based interfaces and powerful programming languages. Google Earth Engine (GEE) is a cloud-based geospatial analytic platform that enables users to address the fundamental challenges of managing massive data volumes, storage, integration, processing, and analysis [19,20].
The GEE, a cloud-based computing platform, is capable of overcoming the most difficult challenges in large-area land cover mapping. Users can evaluate all remotely sensed images available using a web-based Integrated Development Environment (IDE) code editor. This enables users to quickly access, select, and handle massive amounts of data [19]. Aside from the speed, GEE is gaining popularity due to the many packages and algorithms available to specialists and non-experts. GEE publications have increased steadily since 2013, according to [21]. The most commonly used datasets in GEE have been optical satellite data, notably the 40-year Landsat time series. Forest and vegetation studies were the most common application fields, followed by land use and cover studies. This paper compares the actual evapotranspiration (ET) calculated based on remotely sensed data to Energy Balance (EB) measurements installed in the wheat field at Sids station in Beni Suef Governorate, Middle Egypt.

2. Materials and Methods
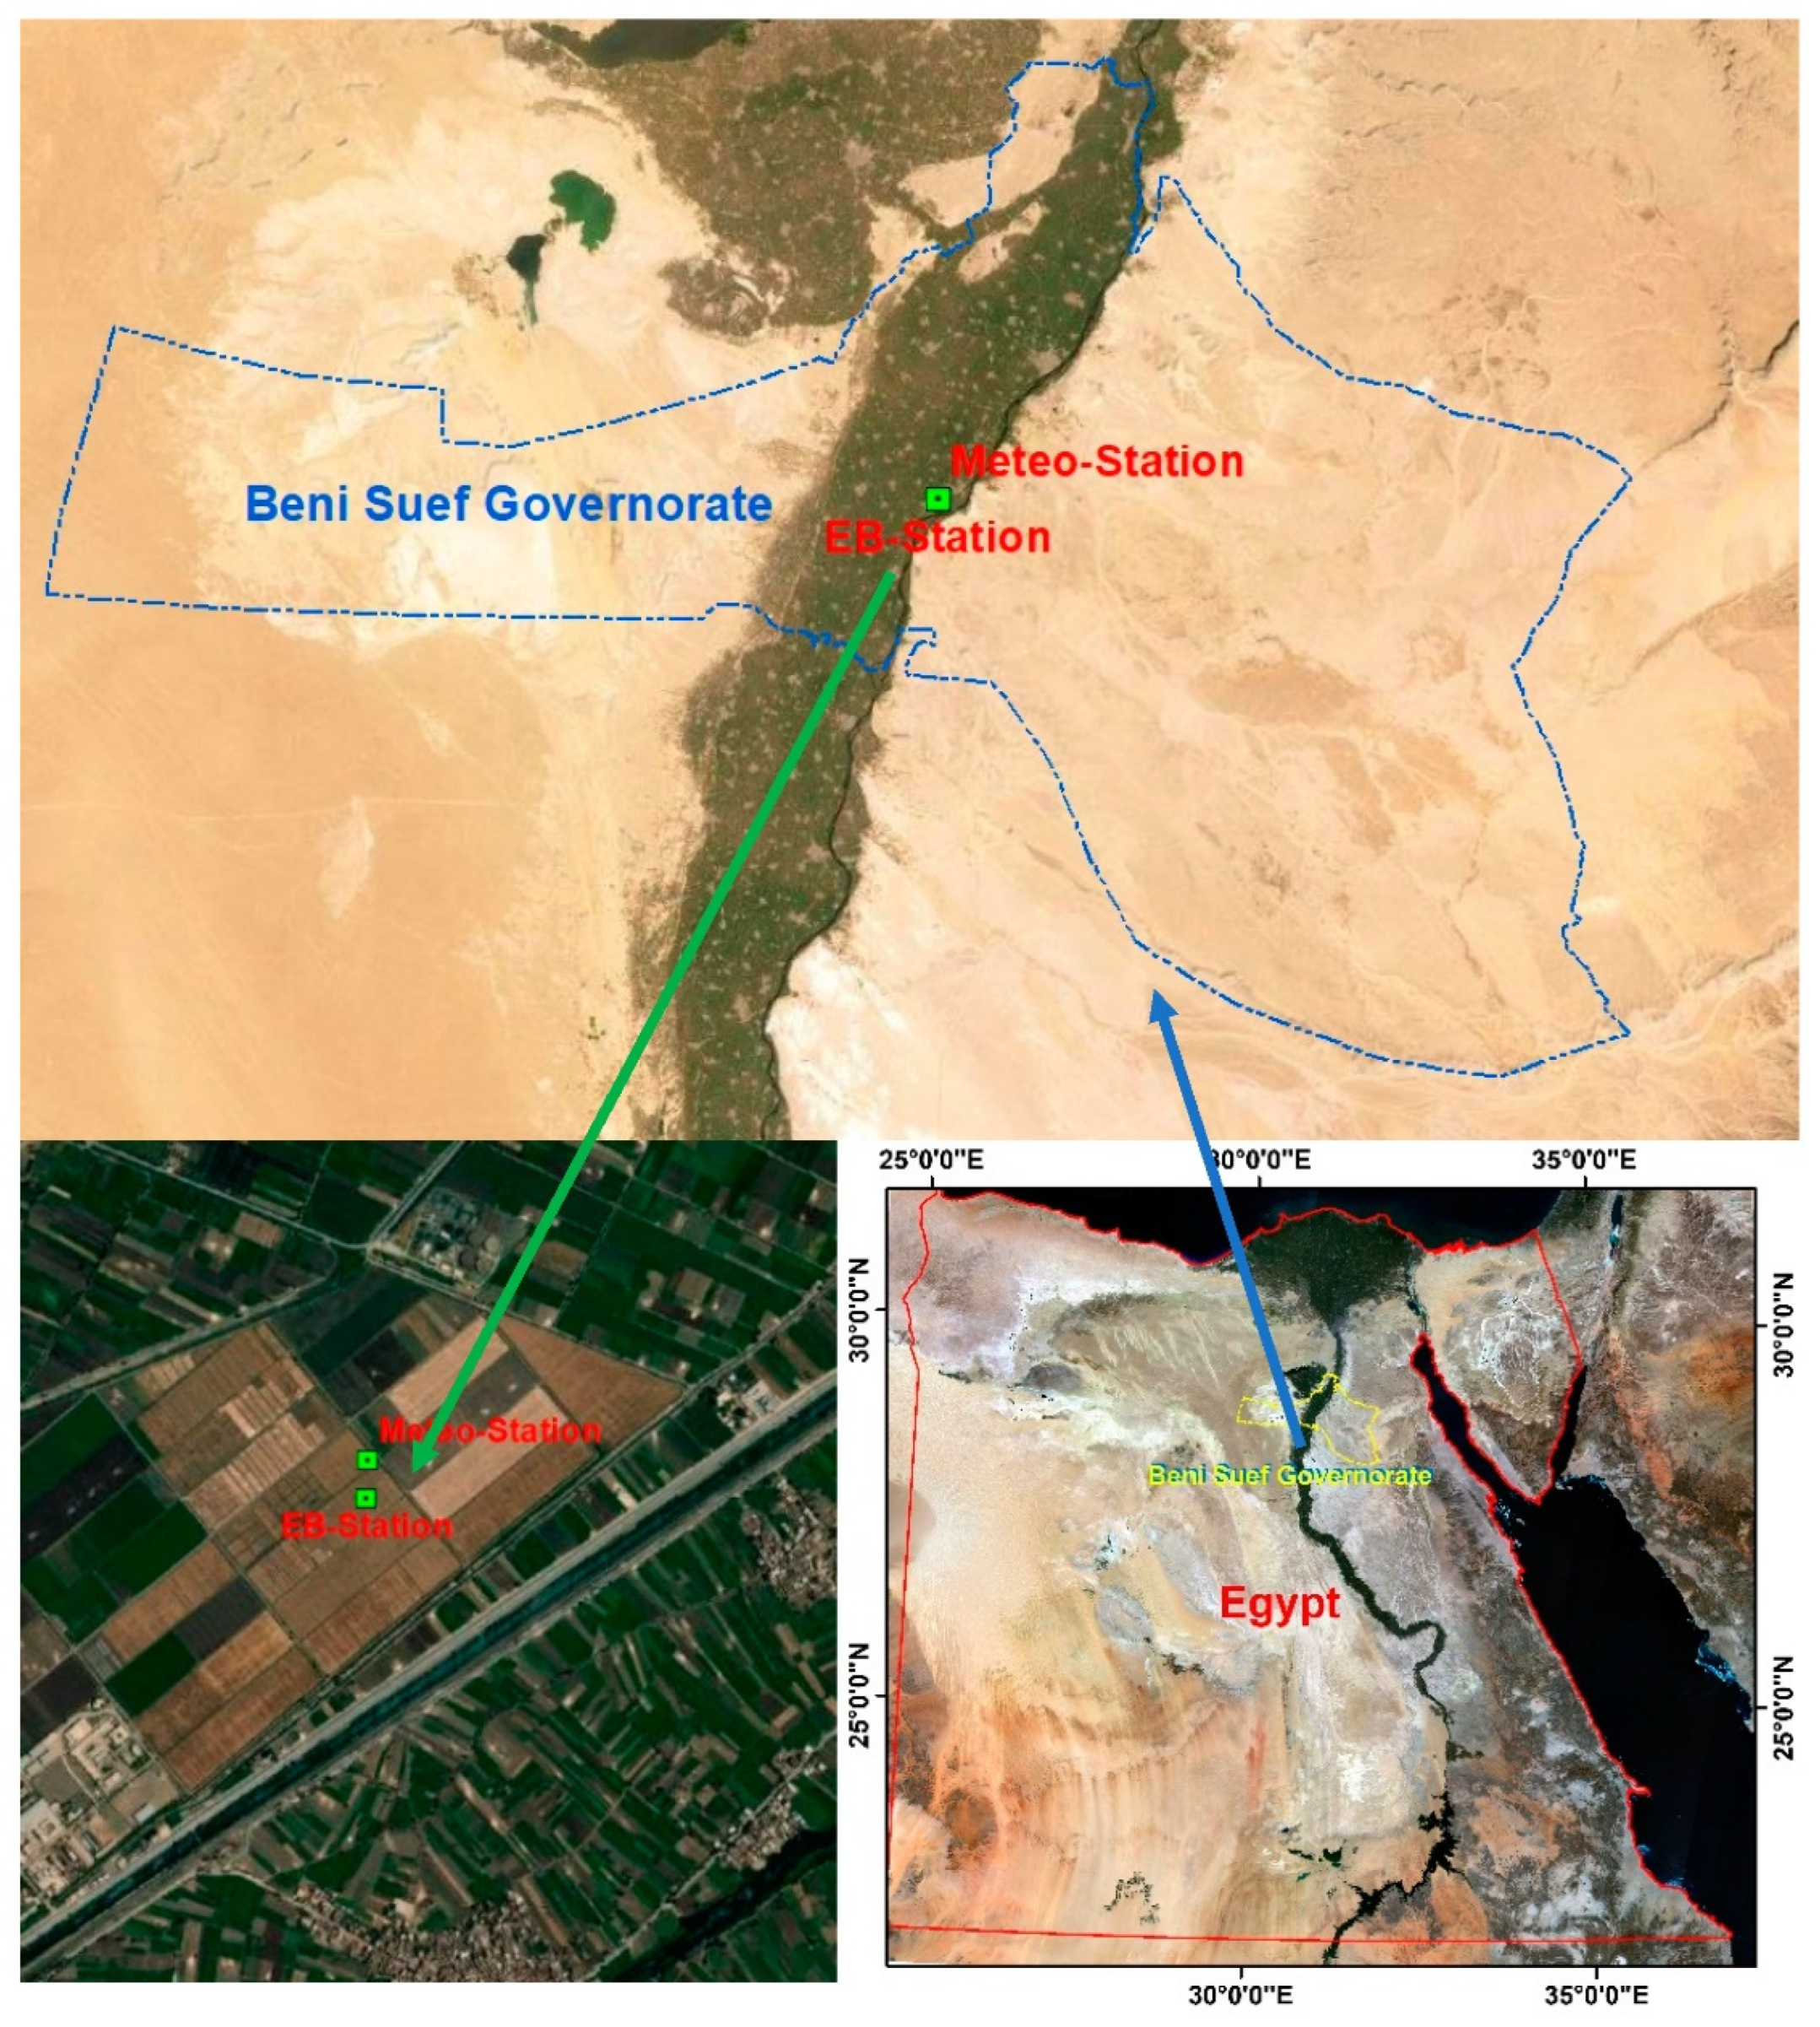
2.1. Study Area

Beni Suef Governorate is located in Middle Egypt. The common crops include wheat, clover, maize, and horticulture crops. The soils of the governorate are of two primary categories: Clay soil in the Nile Valley area and sandy soil in the desert extension of the Nile Valley, as shown in Figure 1. The study was conducted during the winter season (2020–2021) in Sids station, Beni Suef governorate, Agriculture Research Center (ARC), located at 29°3′58.06″ N latitude, 31°5′57.79″ E longitude, 32.2 m elevation above mean sea level in the Middle Egypt Semi-Arid region. The experimental soil is a clay loam texture (more than 45% clay), bulk density has an average of 1.165 g/cm3, and field capacity is approximately 35.38% on a weight basis. The permanent wilting point is 16.84%, the irrigation water (IW) system is surface flood and depends mainly on fresh Nile water, and its EC ranges from 0.7–0.8 ds/m with a PH level of 7.8.

2.2. Weather Conditions and Parameters during the Growing Season

The minimum and maximum temperature, relative humidity (RH), solar radiation (Rs), and wind speed during the winter season (2020–2021) are shown in Table 1 for the Sids station.

2.3. Experimental Design and Treatments

The experimental field size is 2.0 ha in Sids. Before planting in the Sids site, the soil was plowed in two perpendicular paths and laser-leveled. Wheat was cultivated on 25 November 2020, with a seed rate of 45 kg/acre. The site was cultivated in a raised bed 130 cm in width, 100 m in length, and 25 cm in furrow depth, with seven rows of wheat planted on the top of the beds 15 cm apart using a raised bed machine. A water flowmeter measured the accumulated applied water at the field inlet.
A calibrated Energy Balance (EB) flux tower was installed at the experimental site in the first week of November 2020 to measure the actual evapotranspiration (ET).
Fertilization had been added as per the agriculture research center (ARC) recommended doses: 75 nitrogen units, 25 phosphorus units, and 20 potassium units. Half of the recommended nitrogen doses were added during the first irrigation, and the rest were added in the second irrigation event. Phosphorus and potassium fertilizers were completely added before planting, with manual weed control employed during the season.

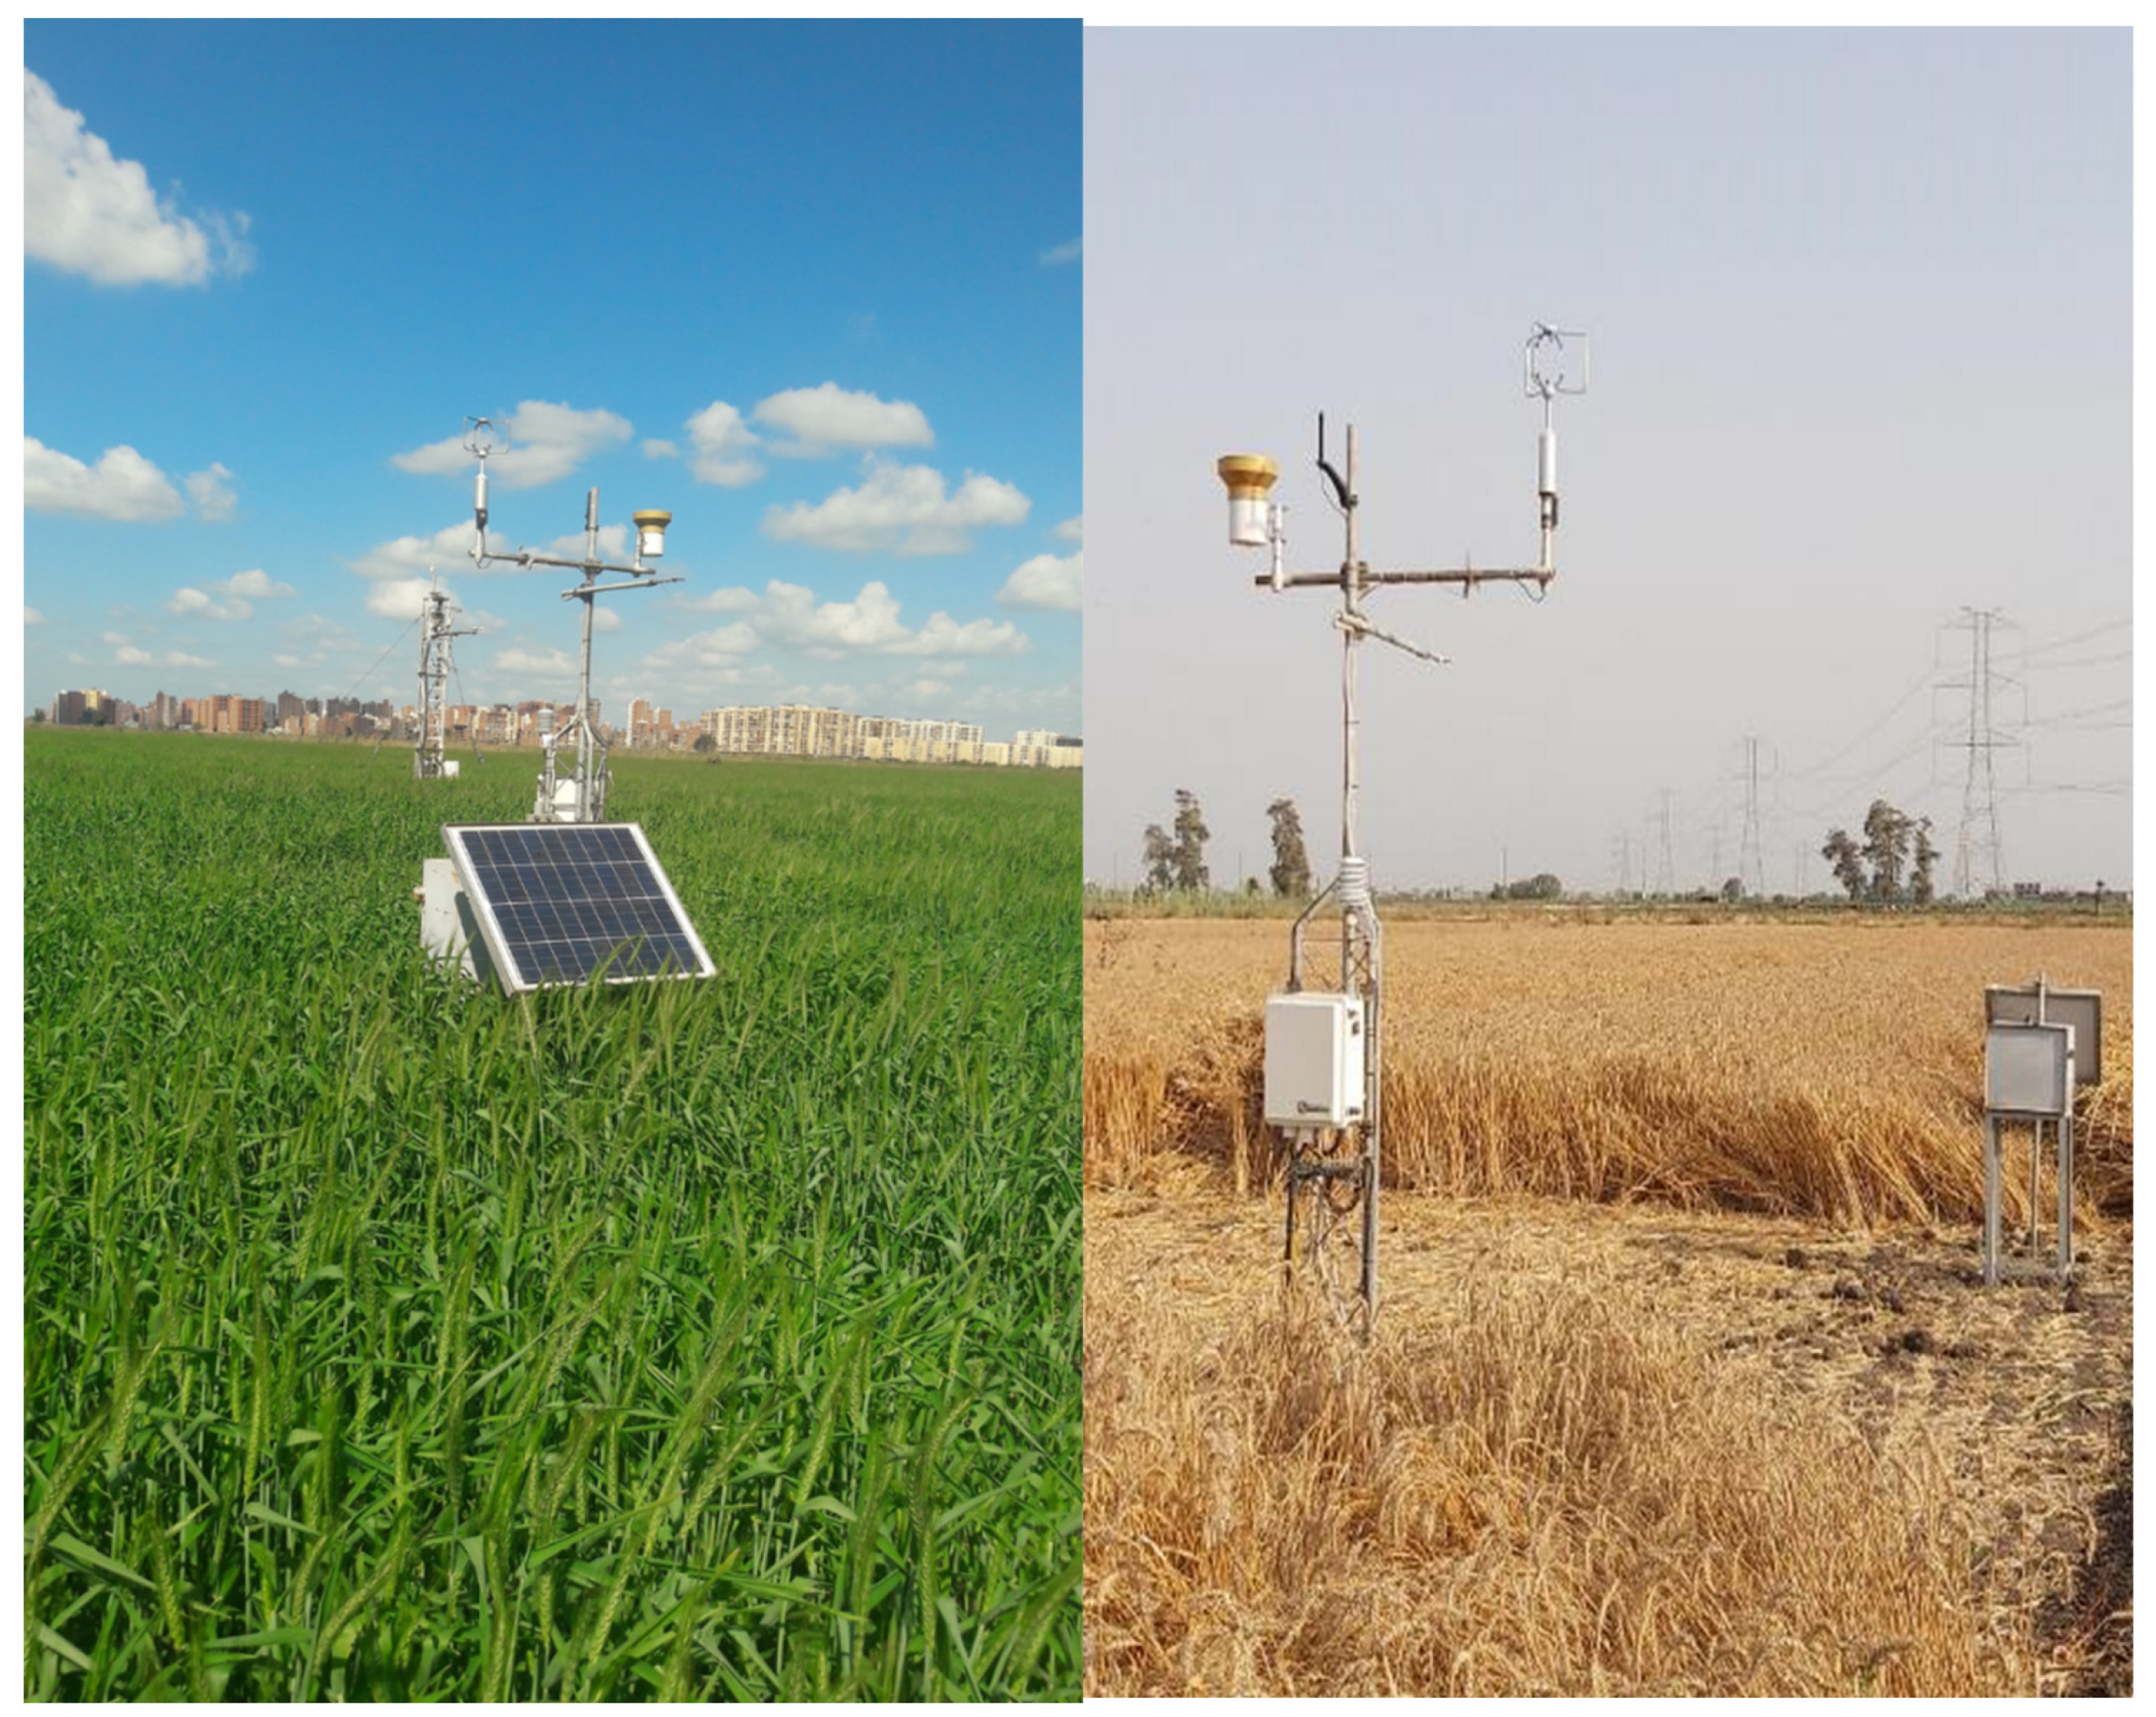
2.4. Field Measurements of Evapotranspiration and Allied Indicators

The current study used a simplified energy balance (EB) technique [22] to quantify ET for wheat. This method involves measuring the different components of the surface energy balance equation in a simple, accurate, and cost-effective way and then determining the unknown evapotranspiration (ET). In this context, two solar-powered flux towers were installed at the experimental site with appropriate sensors to measure various components of the surface EB and agro-metrological climate parameters for reference evapotranspiration measurements (ETo).
One of the most precise techniques for measuring sensible heat (H) was utilized, which was based on high-frequency (10 Hz) data for 3D wind vector components (Ux, Uy, and Uz) measured with a sonic anemometer (model 81000VRE, R. M. Young Company, Traverse City, MI, USA). It derives the corrected sensible heat from vertical wind (w) and high-frequency sonic temperature (Ts) covariance.
The net radiation (Rn) and ground heat flux (G) were measured using a Net Solar Radiometer (sensor model: NRLite2, Kipp&Zonen, Delft, Netherlands) and Soil Heat Flux plates (sensor model: HFP01, HukseFlux, Delft, Netherlands) with a scanning time interval of 30 min. The soil temperature gradient (measured using sensor model: TCAV Campbell Scientific Inc, Logan, UT, USA) and soil moisture (measured using a Campbell Scientific Inc, Logan, UT, USA sensor model: CS655) were monitored to compute Heat Storage ‘S’ in the soil surface layer. It was anticipated that the canopy’s heat storage capacity was insignificant. In addition to the wind direction (sensor model: 81000VRE, R. M. Young Company, Traverse City, MI, USA), ambient temperature, and relative humidity (sensor model: HS2s3, Rotronic, Bassersdorf, Switzerland), rainfall was also recorded (sensor model: TE525MM, Texas Electronics, Dallas, TX, USA).
The sensors were mounted (Figure 2) to an adjustable height (from 2.6 m above ground to 1.5 m above the highest canopy height) instrumentation tower to facilitate the maintenance of the equipment and adapt to different crops and crop heights, ensuring that all sensors were well-placed to cover the area of interest. The station’s datalogger (CR3000, Campbell Scientific Inc., Logan, UT, USA) computed onsite data processing using fully corrected fluxes every 30 min for Net Solar Radiation, Ground Heat flux, and Sensible Heat flux (Rn − G − H). Latent heat LE was then calculated using the energy balance equation LE = (Rn − G) − H. To obtain 30-min ET as the residual term of the energy balance, the latent heat total flux during the 30 min was divided by the latent heat of vaporization.
In the current study updating the crop coefficient (Kc) using (Kc = ET/ETo) to improve water management in Beni Suef, latent heat (LE) was divided by the latent heat of vaporization to obtain actual ET using the surface energy balance equation.

2.5. Remote Sensing Derived Data

Remote sensing data can be used to examine local or global environmental dynamics. These data are utilized to detect changes over time, i.e., Landsat, Sentinel and Spot images, and are also used to visualize, classify, and analyze regions in space and time. Two satellites were used: MODIS Terra and Sentinel-2. MOD11A1 V6 gives daily LST and emissivity measurements in a 1200 × 1200 km grid. When using the MOD11 L2 swath product above 30 degrees latitude, some pixels may contain several clear-sky observations. An average of all qualifying observations is used when this happens. MODIS bands 31 and 32 and six observation layers are included with the day and night surface temperature bands and associated quality indicator layers. The MODIS data extracted the land surface temperature (LST) at daily and spatial resolution 1 Km levels. Sentinel-2 is a wide-swath, high-resolution, multi-spectral imaging mission supporting Copernicus Land Monitoring research. The sentinel data were used to calculate vegetation indices at a high spatial resolution of 10 m and a temporal resolution of 5 days.

2.5.1. The Normalized Difference Vegetation Index (NDVI)

The normalized difference vegetation index (NDVI) is a widely used satellite data indicator for assessing crop growth. The NDVI, similar to other vegetation indices, shows the cover of surface vegetation. It is the most used vegetation index. NDVI may determine vegetation conditions, coverage, and other factors. The NDVI, a worldwide standard for satellite imaging land cover, assesses aridity. The NDVI is also used to measure vegetation greenness and helps evaluate vegetation density and monitor changes in plant health. The NDVI value varies from −1 to 1. Higher values of NDVI reflect high Near-Infrared (NIR) values, which represent dense greenery. NDVI is traditionally computed as a ratio of red (R) to near-infrared (NIR) values (Equation (2)).
NDVI = N I R R   N I R + R
The NDVI value is driven by Sentinel-2, as shown in Equation (3).
NDVI = B a n d   8 B a n d   4   B a n d   8 + B a n d   4
At full canopy coverage, red light absorption via leaves peaks, while multiple scattering causes NIR to increase [23]. While near-infrared reflectance responds significantly to moderate-to-high vegetation density in crop fields, red reflectance becomes nearly flat once LAI exceeds 2 (LAI from 2 to 6). The NDVI ratio is altered by a slight reduction in red and high NIR reflection, which results in a weak correlation with biomass. NIR reflectance should almost double in order to make up for red reflectance in order to double the ratio [23].

2.5.2. The Normalized Difference Water Index (NDWI)

The NDWI is used to analyze water bodies. Green and near-infrared remote sensing pictures are used. In most circumstances, the NDWI can improve water data. It affects land development and overestimates water bodies. The NDWI products can be utilized with NDVI change products to analyze the context of the change. Low-reflective water bodies only reflect visible light. Water is more reflective in the blue (0.4–0.5 µm) spectrum than the green (0.5–0.6 µm) and red (0.6–0.7 µm) spectra—clear water has a high blue reflection. In contrast, turbid water reflects more light. In NIR and beyond, there is no reflection. Previous authors [21] created NDWI to improve water elements in landscapes. This index uses the NIR (10 m) and SWIR bands (20 m). The ability of GEE to deal with various spatial resolutions is high. The NDWI formula is as follows:
NDWI = N I R S W I R   N I R + S W I R  
The NDWI value is driven by Sentinel-2, as shown in Equation (5).
NDWI = B a n d   8 B a n d   11   B a n d   8 + B a n d   11
However, the above formula could be used for vegetation water status beside water bodies. The modified NDWI (MNDWI) employs SWIR and green as follows:
MNDWI = G r e e n S W I R   G r e e n + S W I R  
The MNDWI value is driven by Sentinel-2, as shown in Equation (7).
MNDWI = B a n d   3 B a n d   11   B a n d   3 + B a n d   11
Similarly, the NDWI ranges from −1 to 1. Water bodies have NDWI values greater than 0.5. Vegetation has lower values, making it easier to distinguish it from water.

2.5.3. The Normalized Difference Built-Up Index (NDBI)

Built-up areas and bare soil reflect SWIR well, while water does not reflect infrared, and NIR is more reflective than SWIR in green vegetation. The NDBI ranges from −1 to +1. A negative NDBI represents less densely populated places, which means the value of NDBI for vegetation is low. The NDBI formula is as follows:
NDBI = S W I R N I R   S W I R + N I R  
The NDBI value is driven by Sentinel-2, as shown in Equation (9).
NDBI = B a n d   11 B a n d   8   B a n d   11 + B a n d   8

2.6. Remote Sensing-Based ET Estimates

The remote sensing-based ET model was built using two parties: The thermal condition factor (TCF) and vegetation condition fraction (VCF), as follows:

2.6.1. Thermal Condition Factor (TCF)

The surface temperature represents the recorded temperature at the boundary between the external earth’s surface and the instantaneous atmosphere to express the substance type, energy, and water [24,25]. LST represents the potential of specific energy objectives [26,27,28]. It is impacted by physical, chemical, and biological activities on the surface. The TCF equation is used as follows:
T C F = 0.0037 L S T 2 + 0.037 L S T

2.6.2. Vegetation Condition Fraction (VCF)

Relative air humidity (RH) changes according to changes in vegetation indices, the values of the desert (dry regions), irrigation or drainage canals (water bodies), and agricultural areas (vegetation cover), where land cover is the driving parameter in atmospheric physical parameters. Plant cover and ET indicators are covered under climate and vegetation cover [29]. The evaluation of ET includes both the surface temperature and NDVI from remote sensing using multiple regression [6,30].
V C F = 1.2 V d V C I 2
Vd is the difference between the minimum and maximum values of the vegetation combination index (VCI) for vegetation or agricultural crops. The VCI is calculated based on visible-near infrared sensors; blue, green, red, and NIR bands are used to calculate VCI as follows:
V C I = 0.25 G r e e n B l u e G r e e n + B l u e + 0.5 N I R R e d N I R + R e d + 0.15 G r e e n R e d G r e e n + R e d
The TCF and VCF are represented as two independent layers, and actual ET is calculated after integrating the two layers as follows:
E T = T C F × V C F
The ET has been developed in arid zones and resulted as preliminary results from a new model used in this study to estimate ETa using simple empirical models based on remote sensing data. The TCF is an empirical model that reflects thermal behavior for different targets. The thermal behavior may be caused by energy changes or water changes. The low water content in the soil increases the soil surface; at the same time, the plant has the same effect. When the plant is under water or thermal stress, it is reflected in the plant’s surface temperature. These conditions are expected in dry areas. The TCF reflects the thermal behavior of the land surface as a reaction to environmental parameter effects. It can also represent the reference evapotranspiration (ETo) in the FAO-56 paper. The VCF reflects plant behavior as a response to plant characteristics, plant density, water availability, and environmental conditions. The blue, green, red, and Near-Infrared bands were chosen to build an empirical model with weighted factors to represent land cover behavior. It could represent the dual crop coefficients (Kc and Ks (stress factor)).

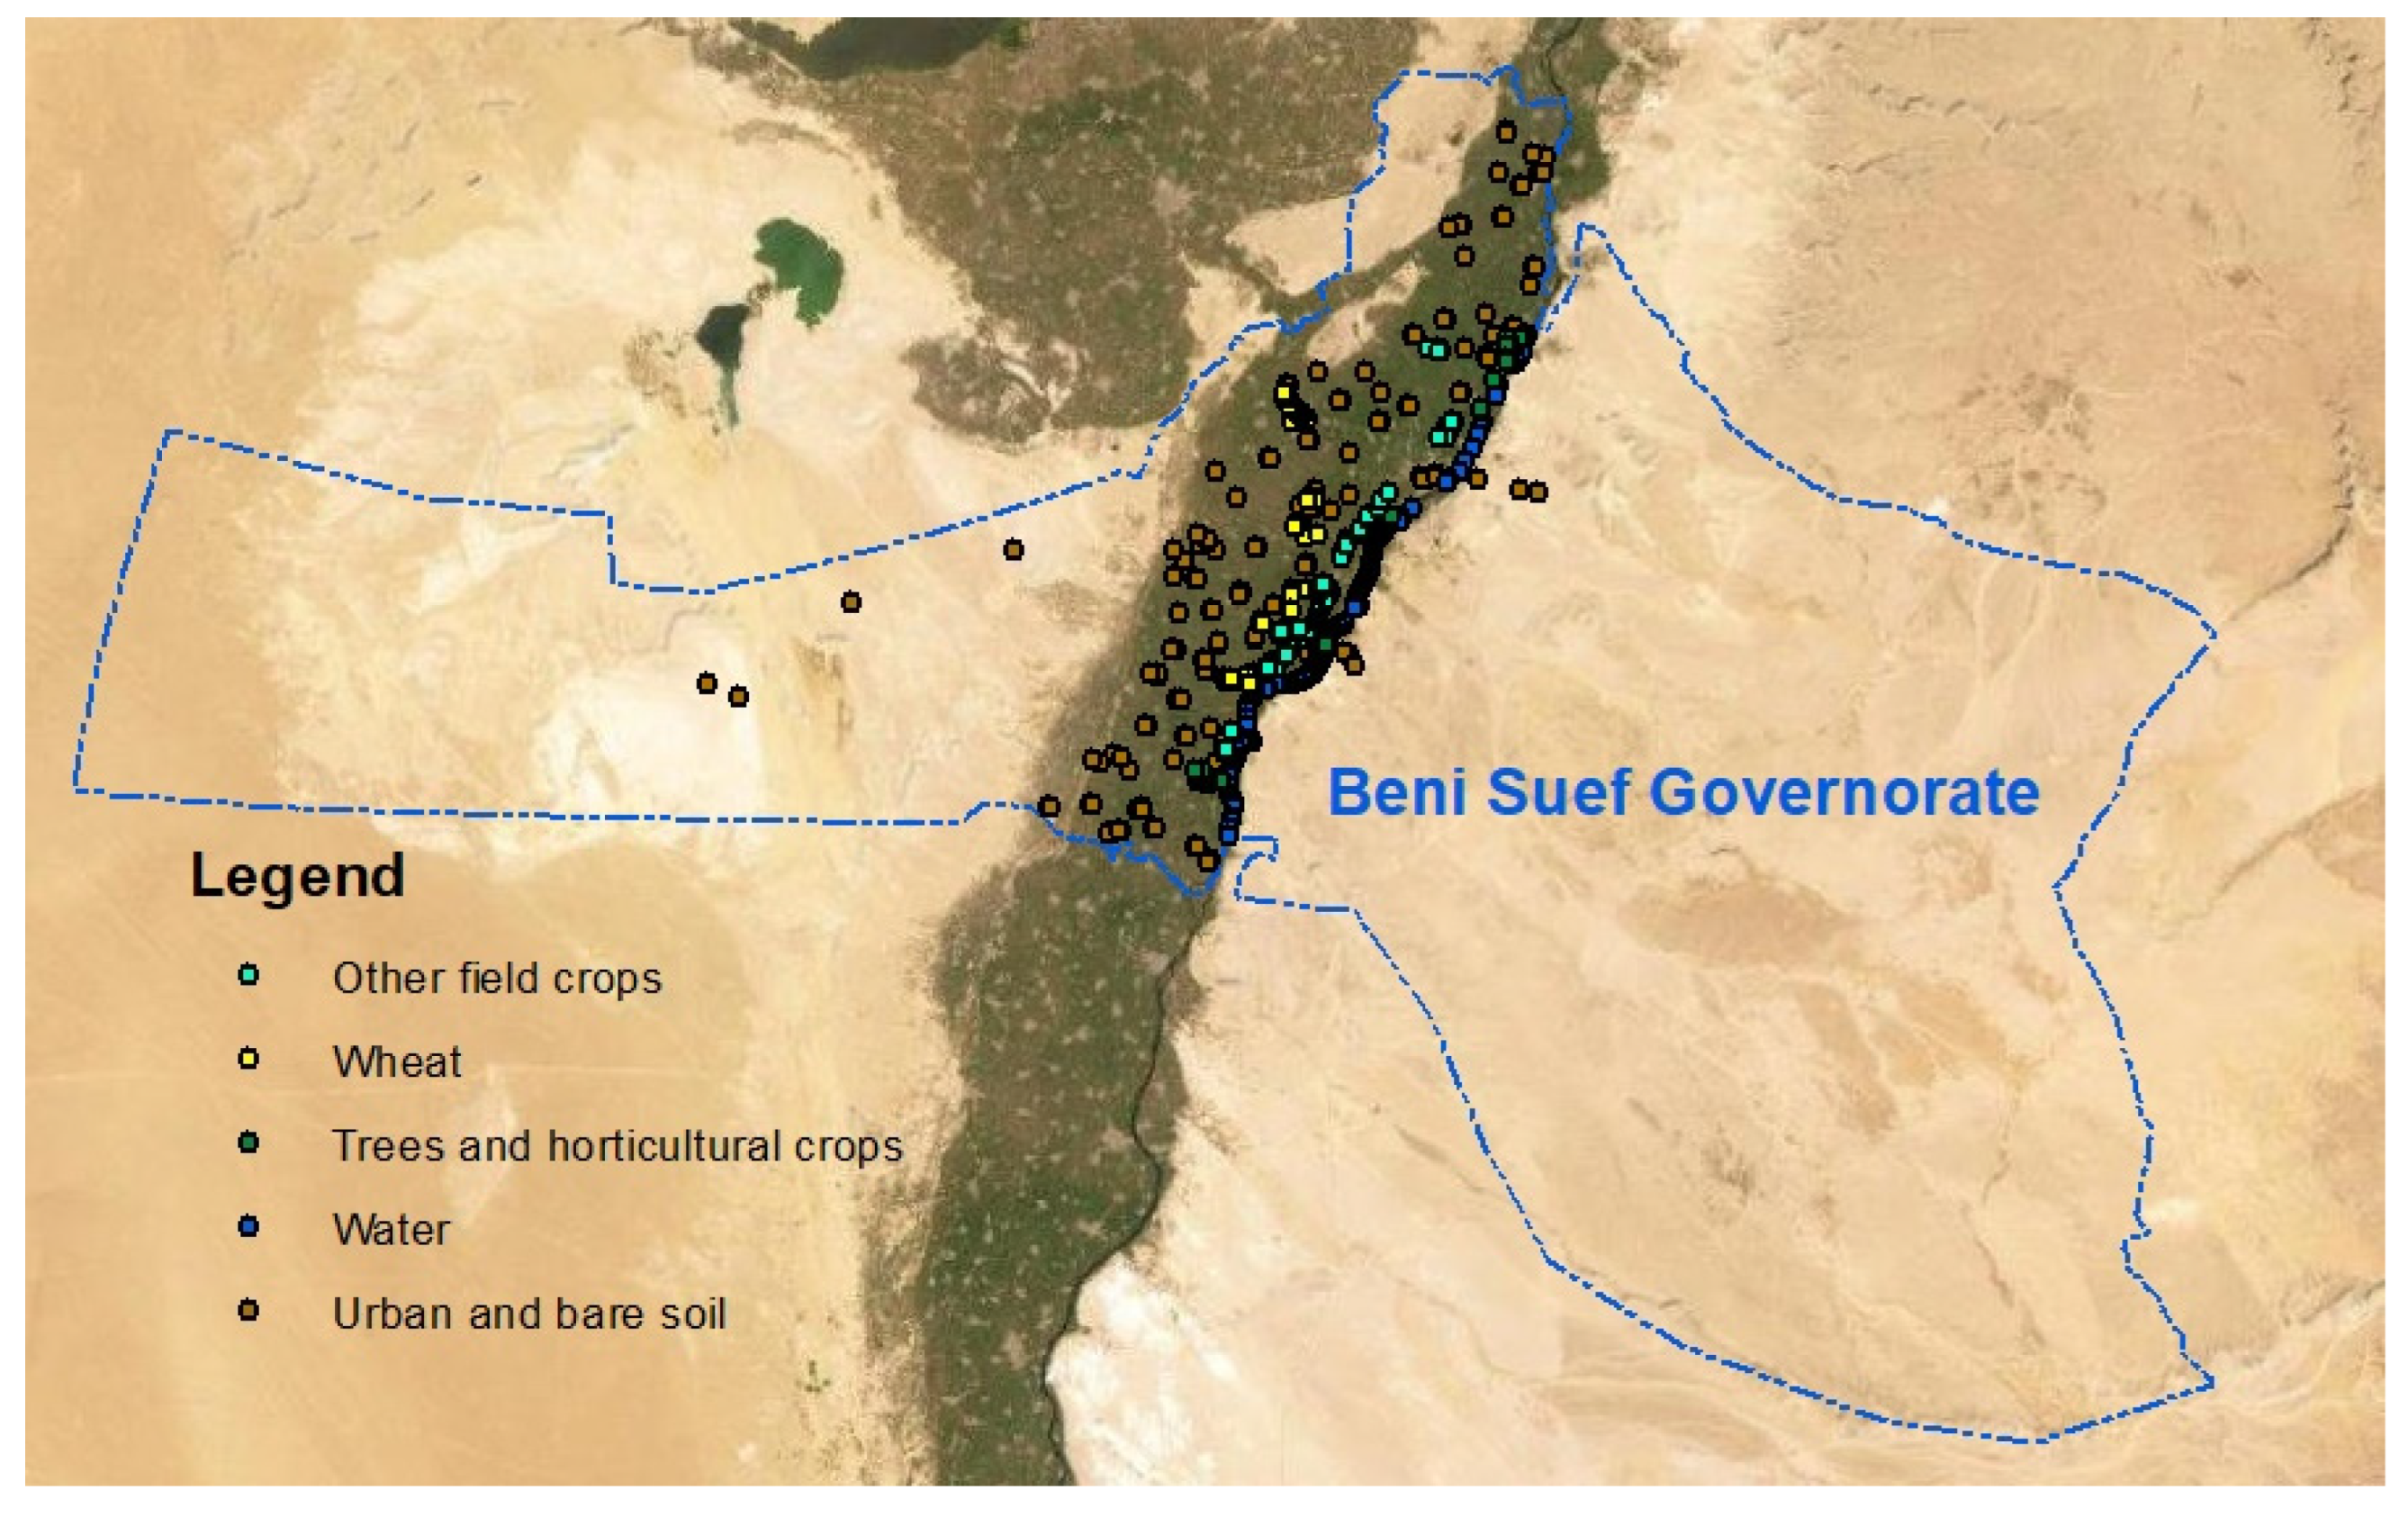
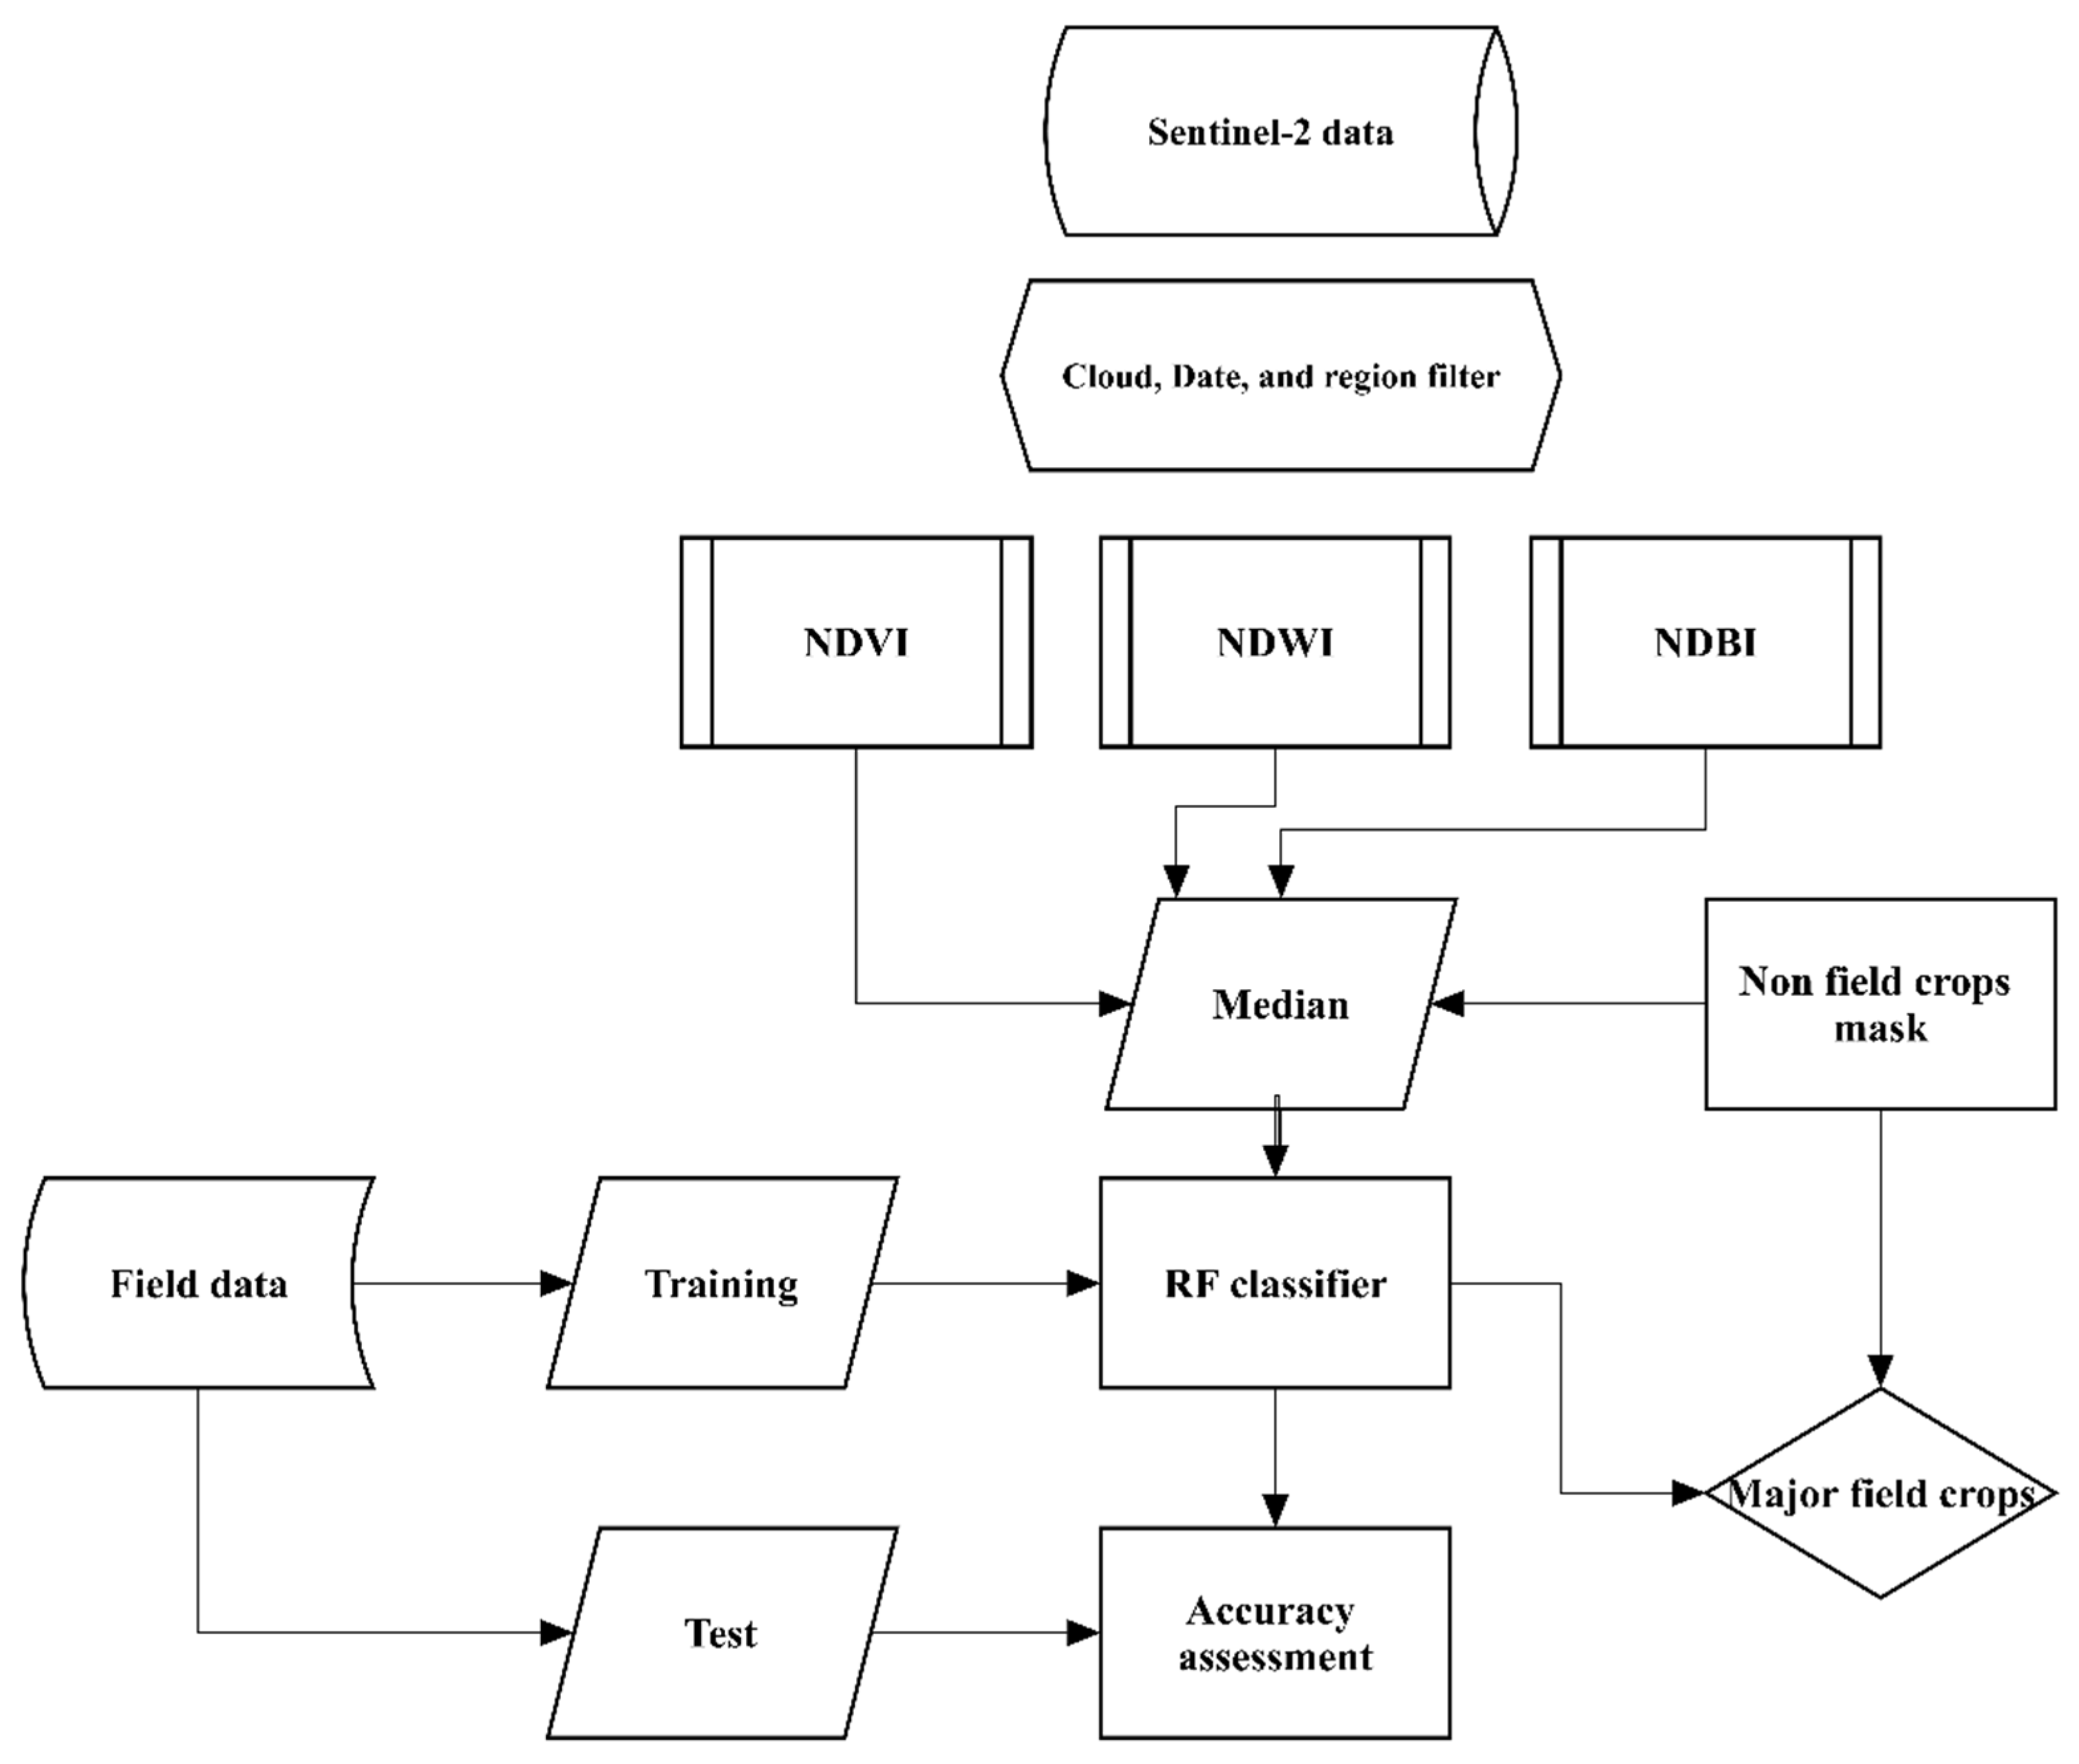
2.7. Land Use and Land Cover Maps

In addition to clover, wheat is a significant winter field crop. Winter crops collected include wheat, clover, other fields, trees near water bodies, and urban and bare soils. The collected data totaled 3083 ground points. Water bodies (310 points), urban areas (840 points), trees (347 points), other field crops (756 points), and wheat were all collected (830 points). The field data are categorized as 1, 2, 3, 4, and 5. Figure 3 depicts the spatial distribution of the field points in the Beni Suef governorate for the winter season of 2021.

2.8. Google Earth Engine (GEE)

It is possible to process large amounts of data using the GEE platform, which Google provides. GEE is a geospatial analysis platform that runs in the cloud and can perform global-scale geospatial analysis. The GEE was used to import sentinel-2 datasets. The data were filtered for required dates and regions, excluding cloudy data with more than 30% cloud infection, which was banned by median analysis. The median research needs high-frequency data to work well and excluded the infected pixels. The mask layer was applied with the composite of the selected bands during the winter seasons. Sentinel-2 data had a temporal resolution of 10 days and multiple spatial resolutions of 10 m, 20, and 60 m when released; however, after the second satellite was launched in 2017, the temporal resolution was reduced to five days (Sentinel-2b). In this study, sentinel-2 data from 1 October 2020 to 30 May 2021 was processed and transformed into NDVI, NDWI, and NDBI data. The processed data were reduced to monthly median values with specific combinations for the most suitable conditions to achieve the best possible results and avoid cloud effects. Figure 4 represents a simple diagram of methodology steps applied by GEE to classify the major field crops for the winter season in the Beni Suef governorate.

2.9. Random Forest (RF) Method

The composite layer data were classified through the Random Forest (RF) method, which is considered a machine learning (ML) classification method. The GEE was used to apply the RF, a simple decision tree with a tendency to overfit the data. The RF method generates several decision trees trained on minor changes in the training data. The majority of the individual decision trees form the final output, referred to as ensemble learning. Seventy percent of the field data were used to train the RF classifier, and 30% were used to test the results.

2.10. Validation Methods

Tree statistical parameters were used to evaluate the reliability of the remote sensing-based ET model related to the measured Et data by the energy balance station. These parameters are defined as follows:
R M S E = i = 1 n X i X obs 2 n
d = 1 i = 1 n X i X m X o b s X m 2 i = 1 n X i X m + X o b s X m 2
r = X o b s X i X o b s X i X o b s 2 X o b s 2   X i 2 X i 2
where RMSE is the root mean square error, d is the index of agreement, r is the correlation coefficient, n is the number of observations, Xobs, i is the observation of sample i, Xi is the simulated result for sample i, and Xm is the average value.

3. Results and Discussion

3.1. Field-Based ET Estimates Using Energy Balance

There are several devices and methods available for measuring or estimating ET. The reference ET (ETo) and crop coefficient (Kc) products are standard methods. A reference crop, such as short-cut, well-watered grass or alfalfa, is estimated using meteorological data [2]. It is calculated as follows: ETc = Kc × ETo, where ETc is usually calculated on a daily time scale for irrigation scheduling. ETc calculates the crop’s water use in the absence of water stress. Stresses from a lack of available water, nutrients, pests, etc., may cause crop ET to be less than ETc in the field. So, actual ET may be more relevant than ETo or ETc for irrigation management.

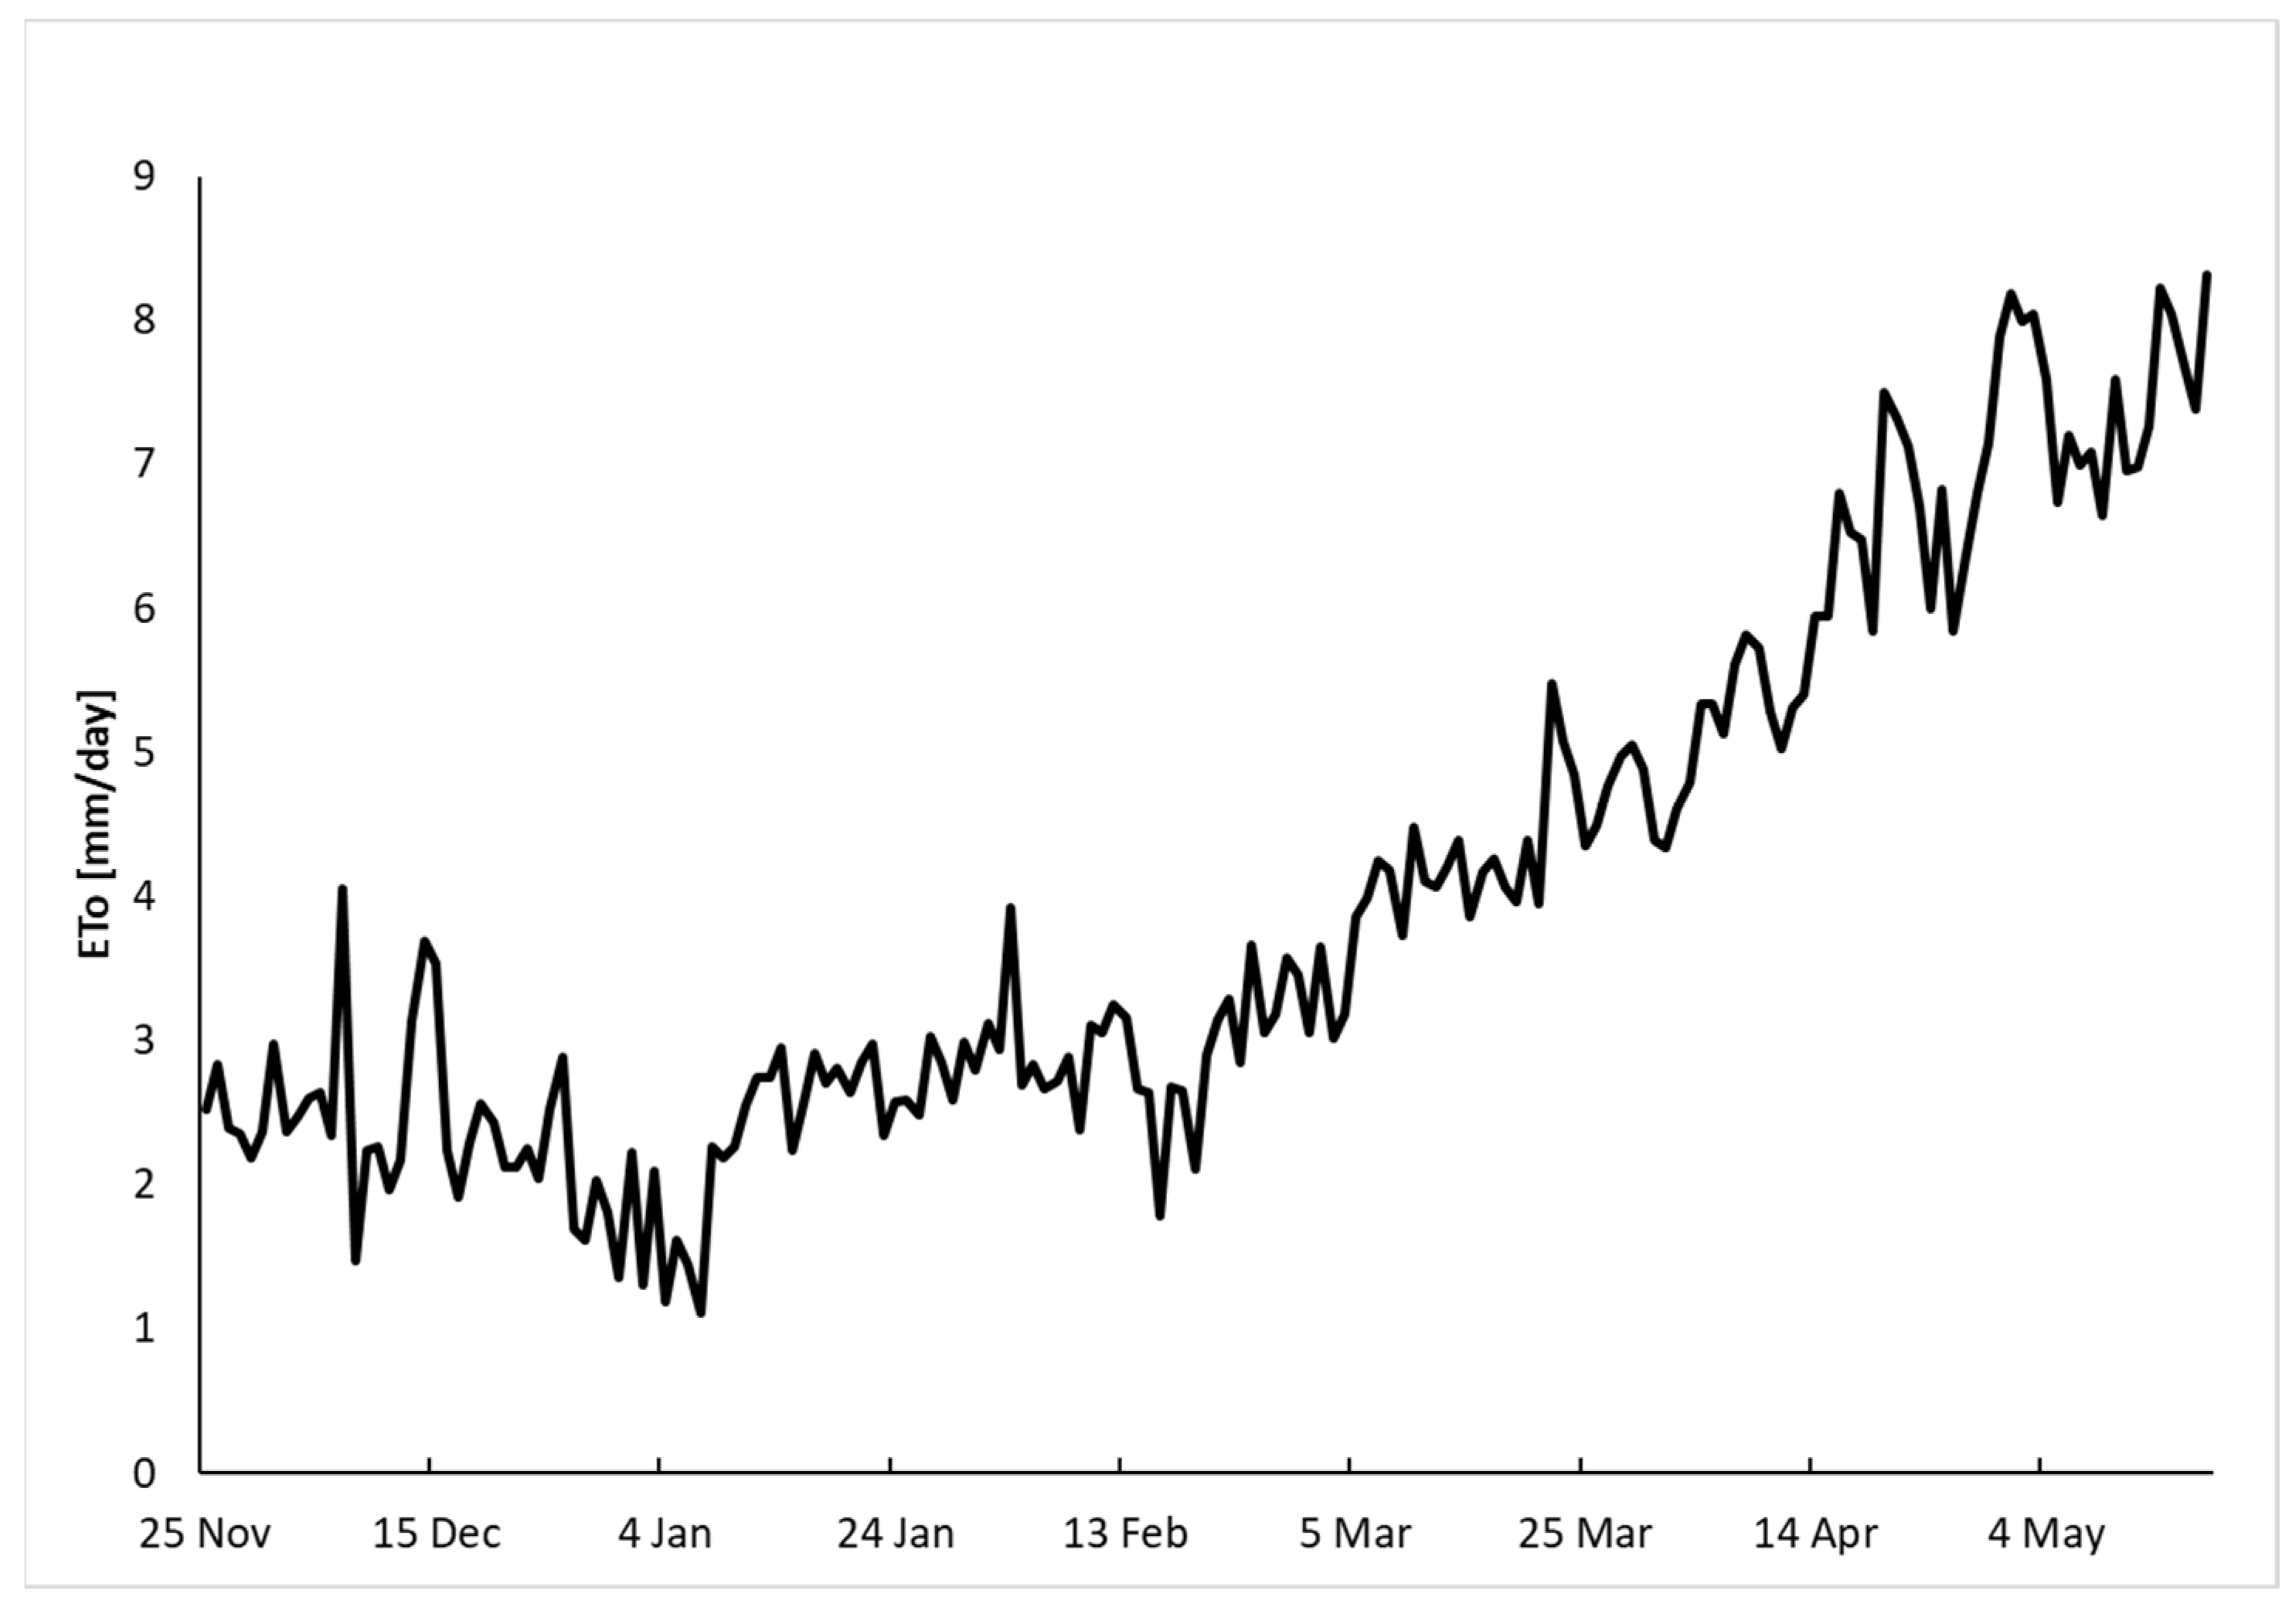
3.1.1. Reference Evapotranspiration (ETo)

The reference evapotranspiration (ETo) is needed for calculating crop coefficients (Kc = ET/ETo), which can help to understand crop growth stages, plant health, and the variation between published Kc references and actual on-site Kc in presumably well-watered conditions, which shows the effect of non-micrometeorological parameters on ET such as water and salinity stresses. ETo is calculated from hourly meteorological data; the daily values were obtained from the summation of 24-hourly records of ETo. Solar radiation (Rs) is measured using a Thermopile pyranometer, which works well under most sky conditions. This eliminates the errors caused by cloudy-sky conditions when standard silicon pyranometers are used instead.
Aggregated from hourly to daily ETo calculations, as shown in (Figure 5) according to the simplified FAO–Penman–Monteith equation [2], the accumulative seasonal ETo was 692.1 mm for the period from 25 November 2020 to 18 May 2021, analyzing the trend of ETo during the crop phase (Winter to Spring to Summer), which increased from 2.5 mm/day on 25 November to 4.4 mm/day on 25 March up to its maximum of 8.3 mm/day on 18 May. The obtained data showed realistic trends with an increasing atmospheric demand for evaporative flux from the land surface.

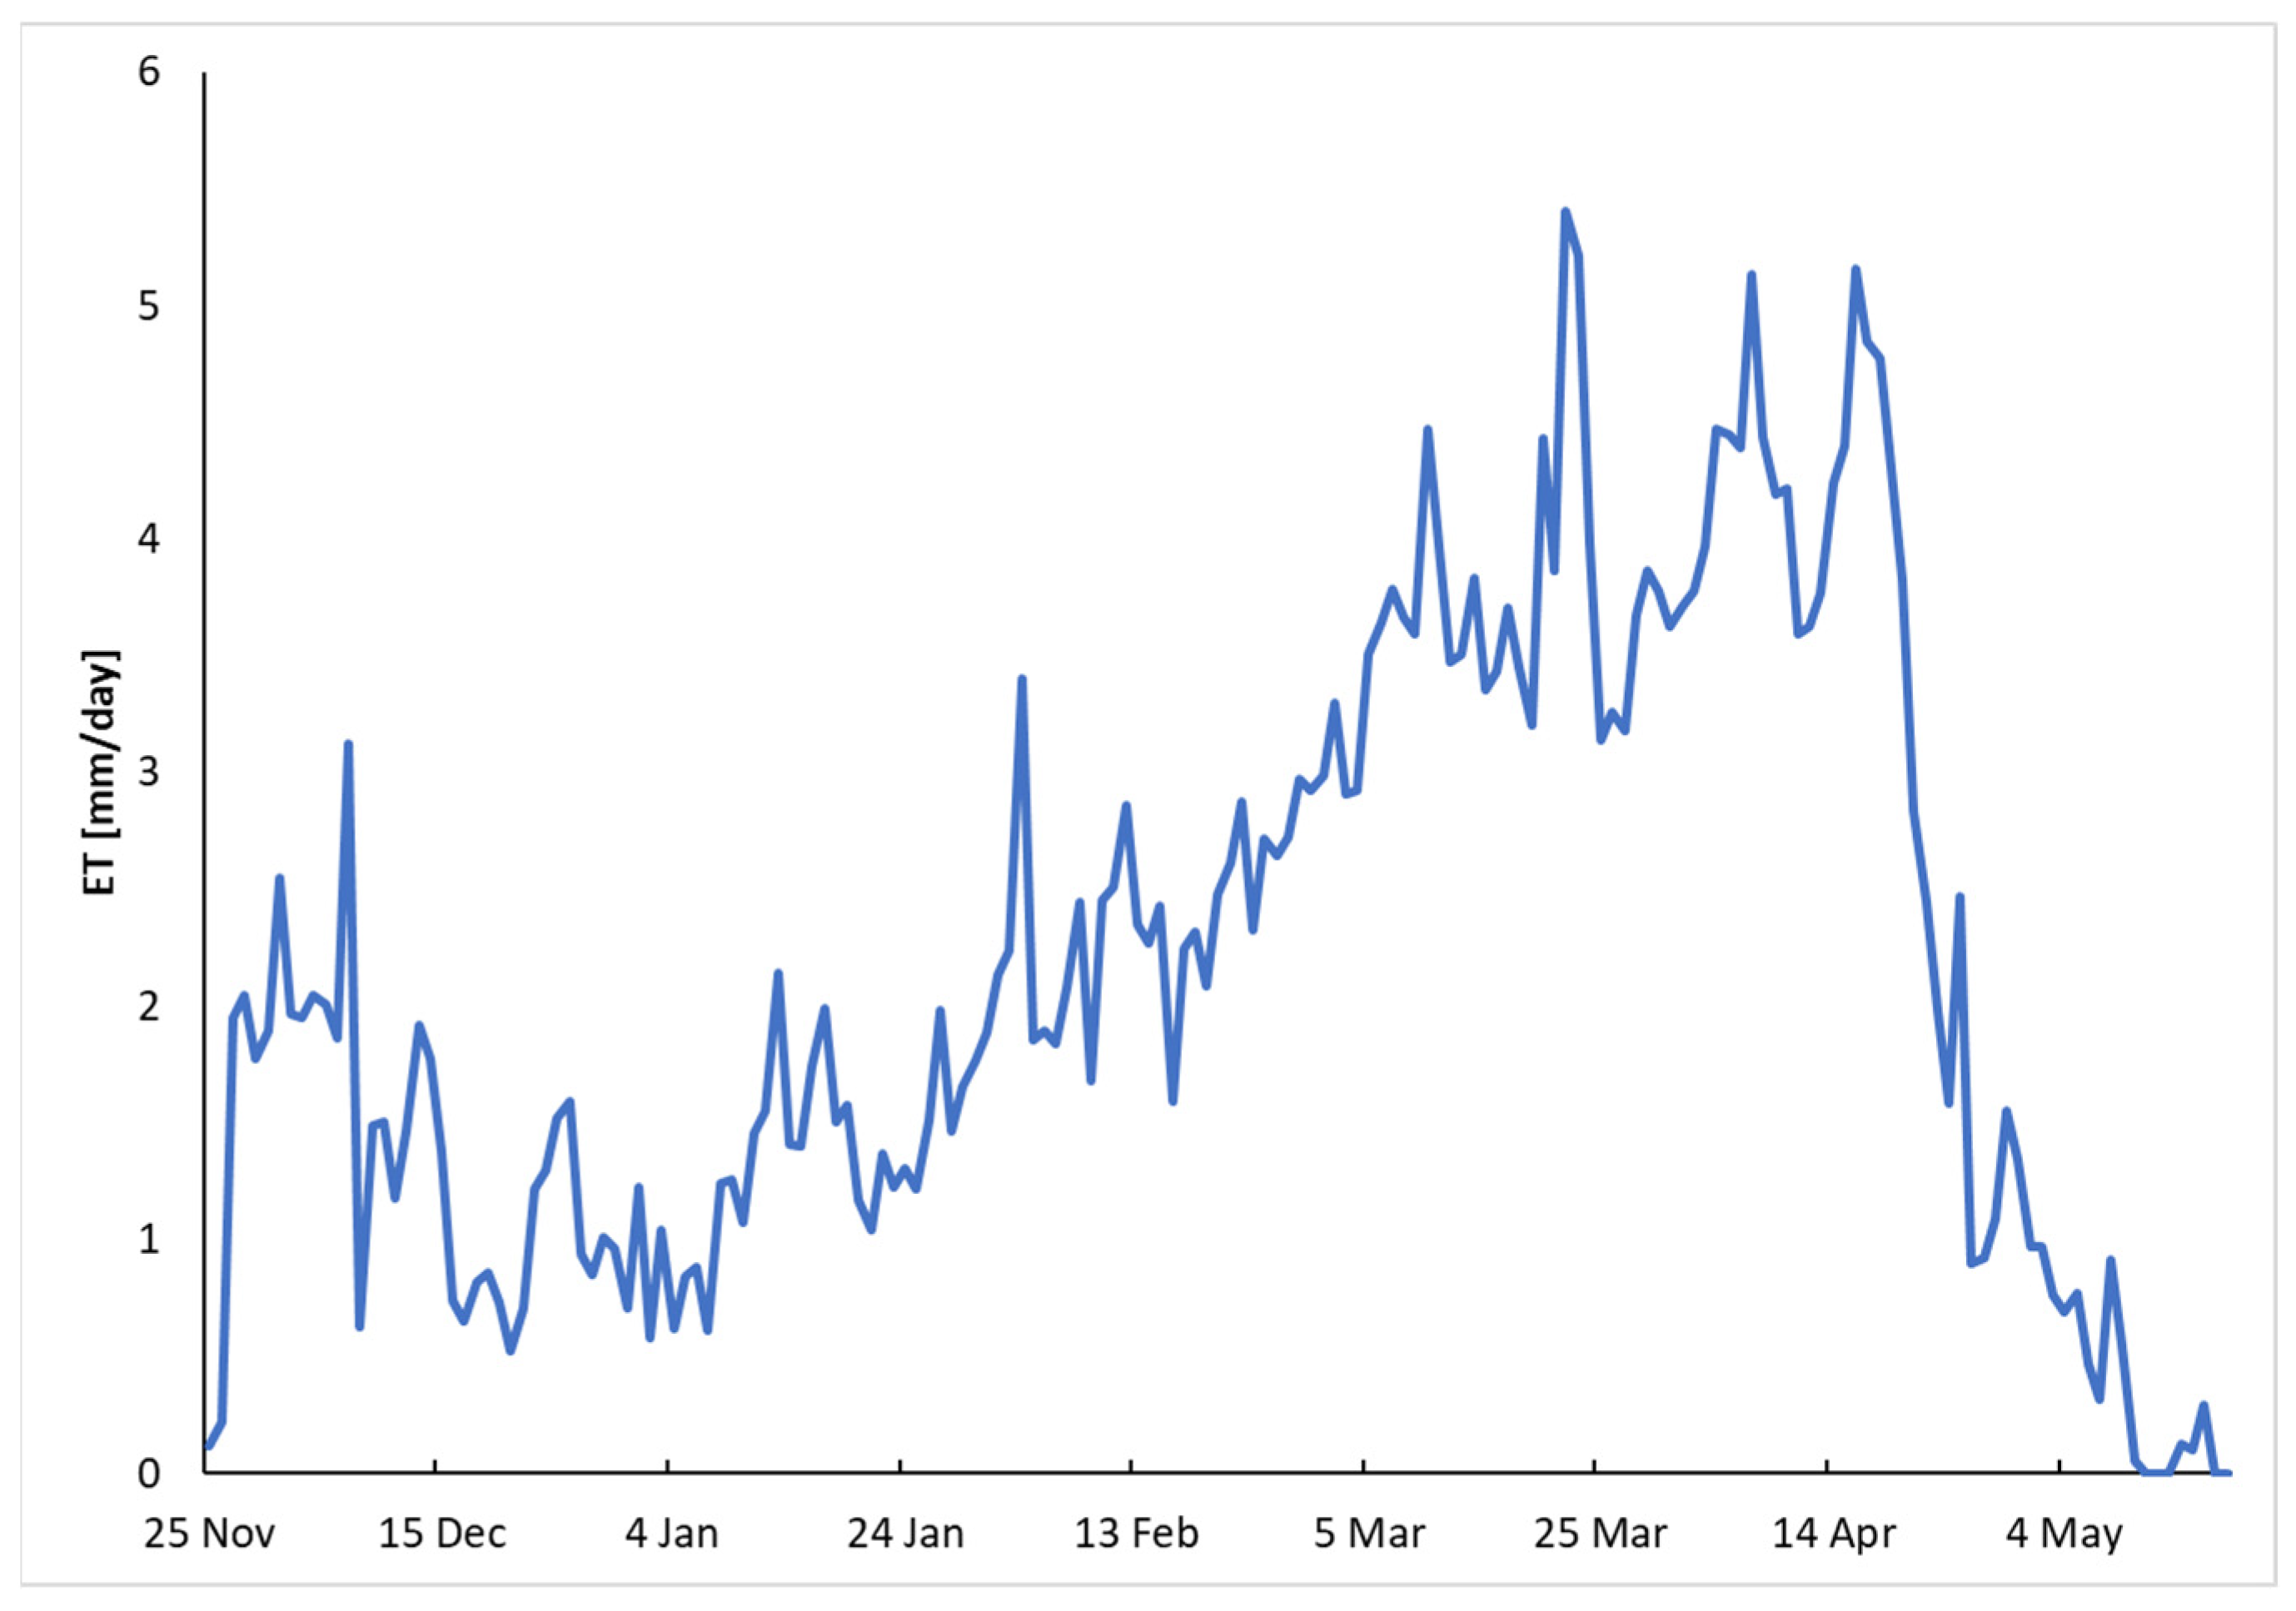
3.1.2. Actual Evapotranspiration (ET)

Contrary to ETo, the ET follows the growth pattern of crops, which gradually increases following the evolution of the crop growth, reaching its peak on 22 March (when the ET was approximately 5.4 mm/day) during the height of vegetative abundance. Meanwhile, on 21 December 2020, the lowest ET value of 0.5 mm/day was observed. It was observed that during the season, from 25 November 2020 (planting day) to 18 May 2021 (harvest day), the total ET was 382.3 mm. The pattern continued as forecast until harvest day, since the latest irrigation event occurred in March, with the most significant values decreasing until harvest without irrigation, as shown in Figure 6.

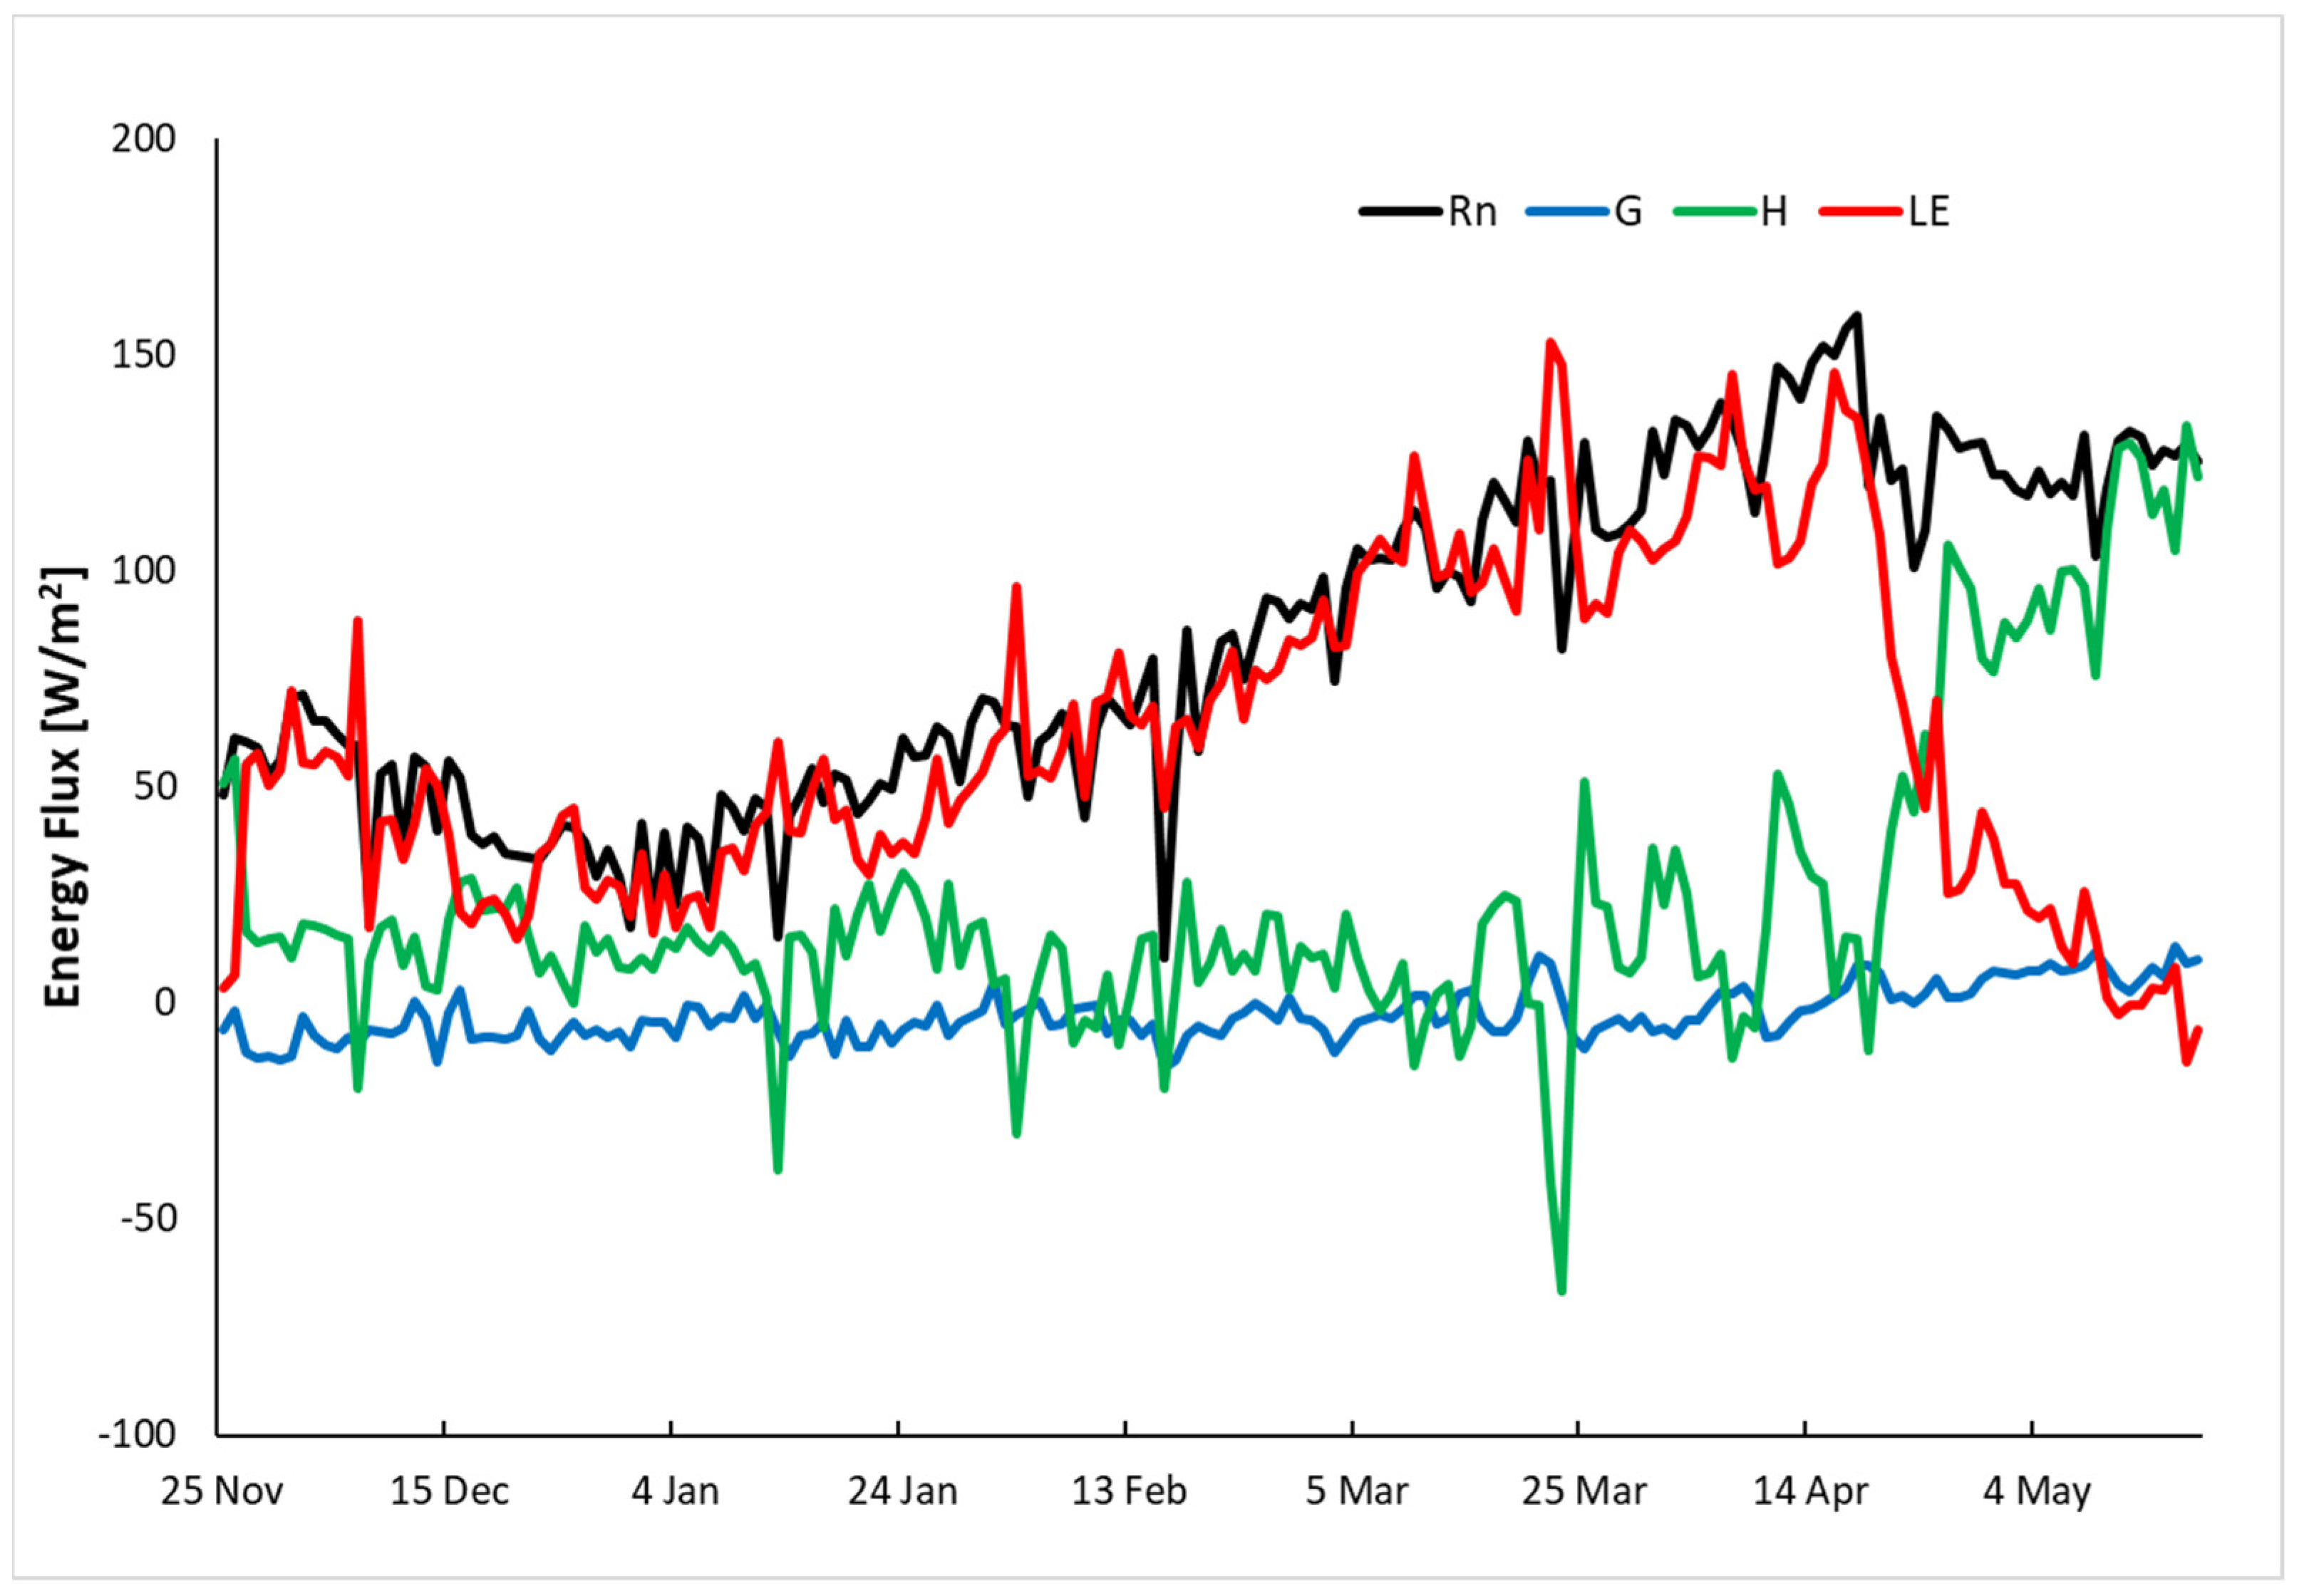
3.1.3. Energy Balance Components

Analysis of the various surface energy balance components measured at the site reflects the fact that the net radiation (Rn) is predominantly fluxed as latent heat flux (LE) rather than sensible heat flux (H) in the Sids site. This trend of LE is similar to the (ET_EB) data (as expected). As the crop season progressed from Winter-Spring to Summer, it seems there is an increasing trend in seasonal Rn and LE, likely because of the increased crop growth, which increased evapotranspiration attributed to the crop growth. Furthermore, because of irrigation events that occurred during the cropping season, it is clear from the data that whenever LE increases (due to higher ET), there were days when the latent heat flux was as high as ~(145–148) W/m2. However, towards the end of crop growth, it started to increase dramatically when the LE fluxes declined, as shown in Figure 7. The G also shows a significant energy flux (−15 to 11 W/m2). This is true on the days that overlapped with the irrigation events.

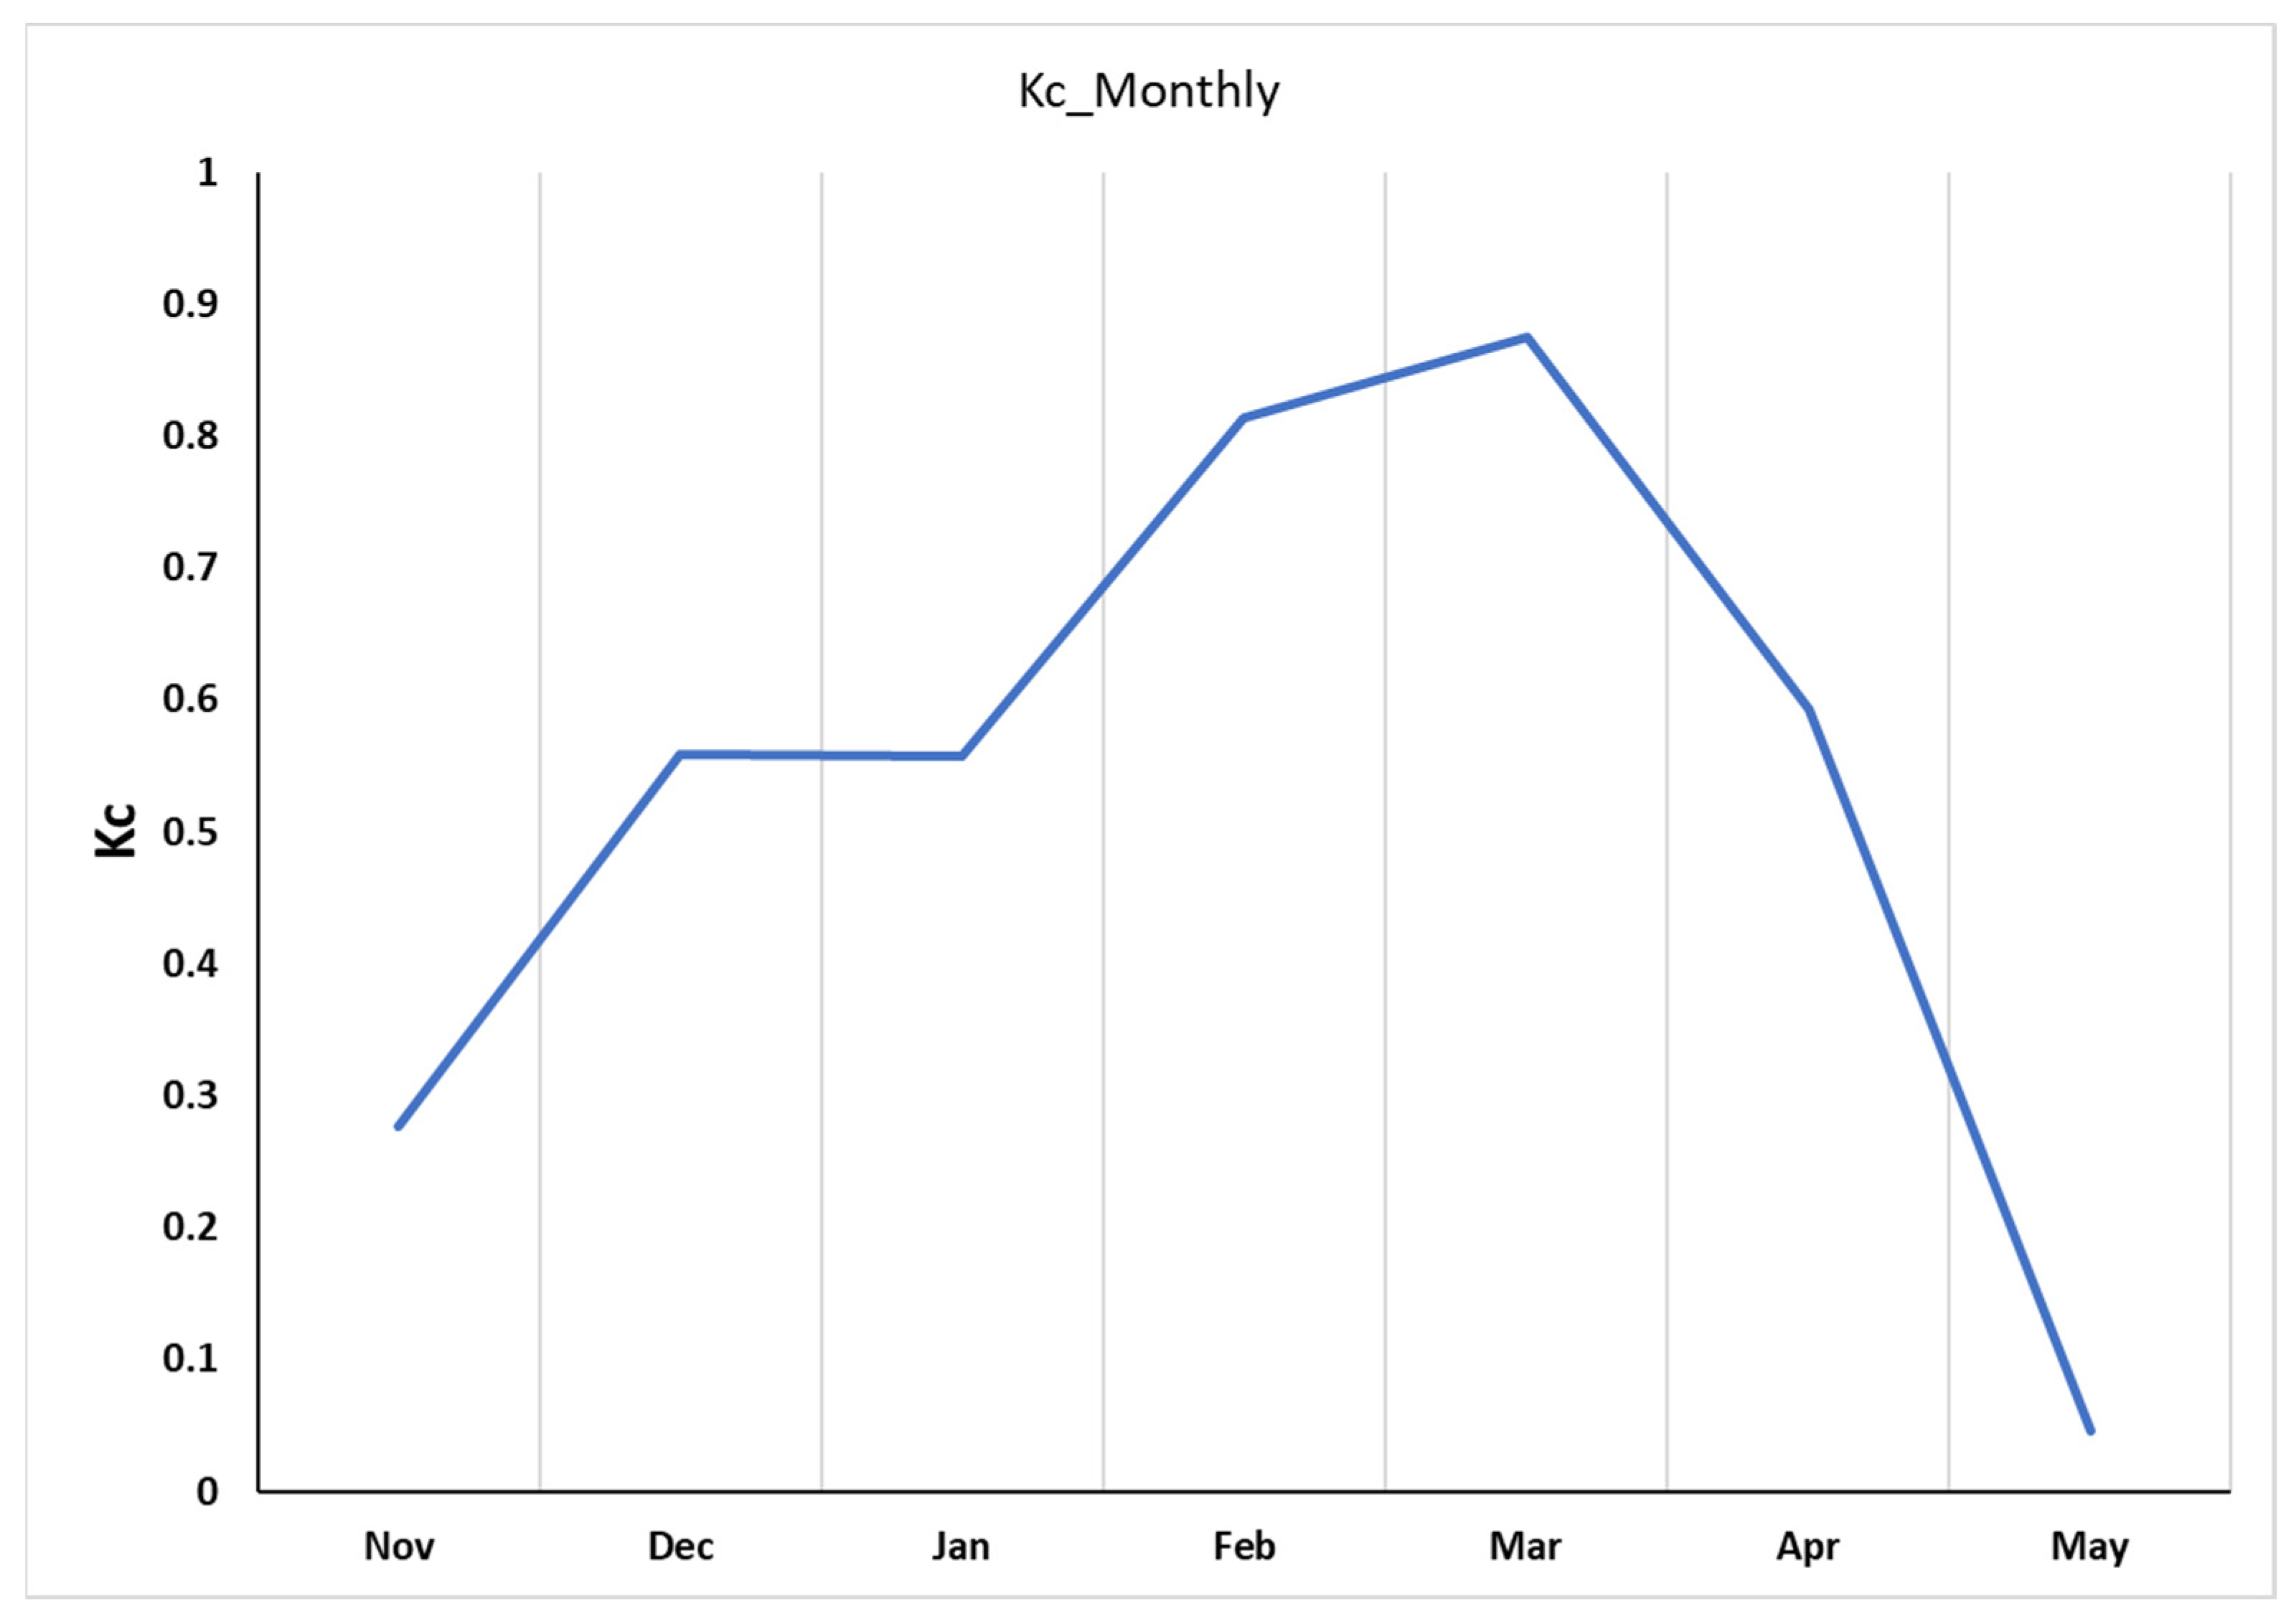
3.1.4. Crop Coefficient (Kc)

The Kc values in Figure 8 are aligned with the ET trend. The Kc values increase with crop development from the initial stage to the maturity stage and decline after maturity to the harvesting stage. The highest Kc value (0.88) was observed during the mid-season, and the lowest value was approximately (0.2) and occurred at the end of the season.

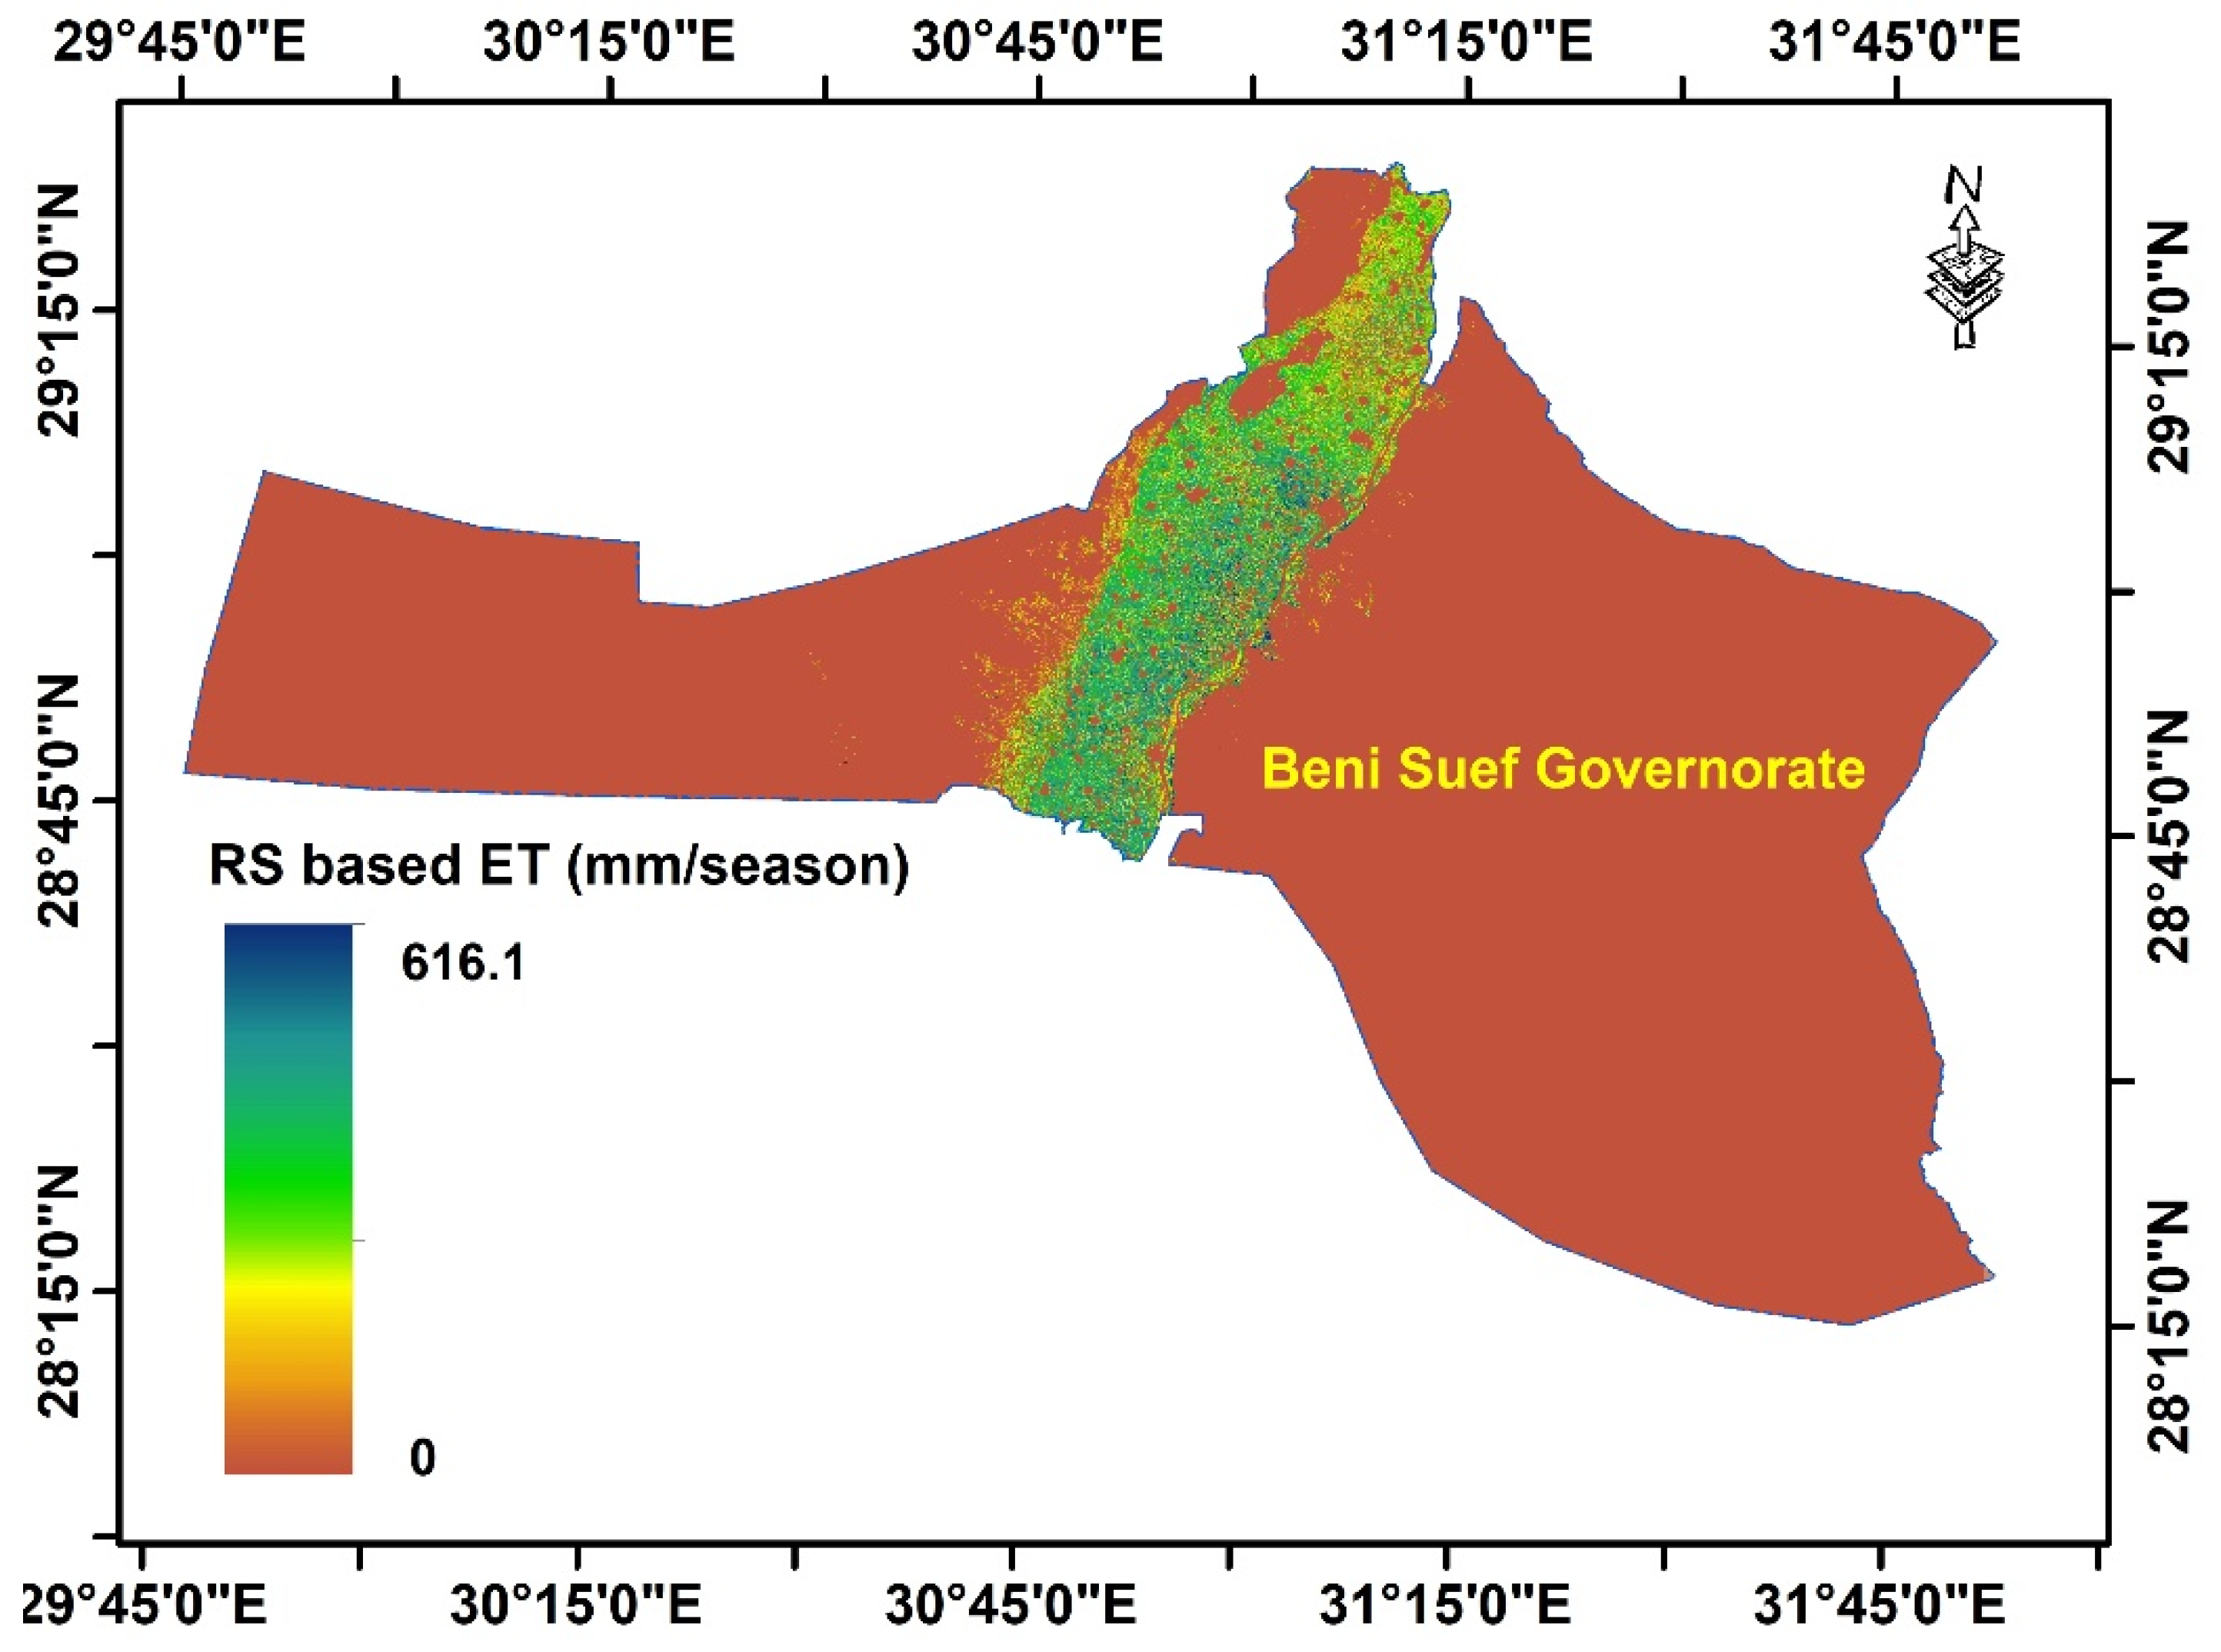
3.2. Remote Sensing-Based ET

The combination of MODIS terra and Sentinel-2 is used to cover the thermal and vegetation conditions, which affect ET from agricultural crop activities. The TCF and VCF are used at Beni Suef Governorate during the winter season from 25 November 2020 to 30 April 2021. The accumulation of ET during the season is represented in Figure 9.
The RS-based ET model depends on two parts. The first part is TCF, which reflects high LST in desert regions, urban, and bare soil, while it reflects lower LST in water streams and cultivated areas. At the same time, the second portion indicates vegetative conditions: Vegetation density, phenological stage, health, or stress.
The vegetation indices reflect the vegetation density up to full coverage, and biotic and abiotic stress conditions [31] reflect the vegetation health conditions. At the same time, the surface temperature reflects the crop and soil water conditions [32] besides weather conditions.
The vegetated surface generally has values that fluctuate from low in the desert regions to high in heavy equatorial monsoon forests. Although the rainfall manipulates variations in vegetation cover in arid and semi-arid zones [33,34], the precipitation rate could be neglected in Egypt (less than 50 mm/year except for narrow regions in the northern coastal zone, which reaches 200 mm/year), and the Nile valley and delta depend on irrigation systems. The vegetation indices could be related to weather and water parameters such as ET. The method of previous authors [35] who studied VI-ET indicated results of R2 = 0.77 and RMSE = 1.22 mm/day in 2011 and R2 = 0.67 and RMSE = 0.81 mm/day in 2013.

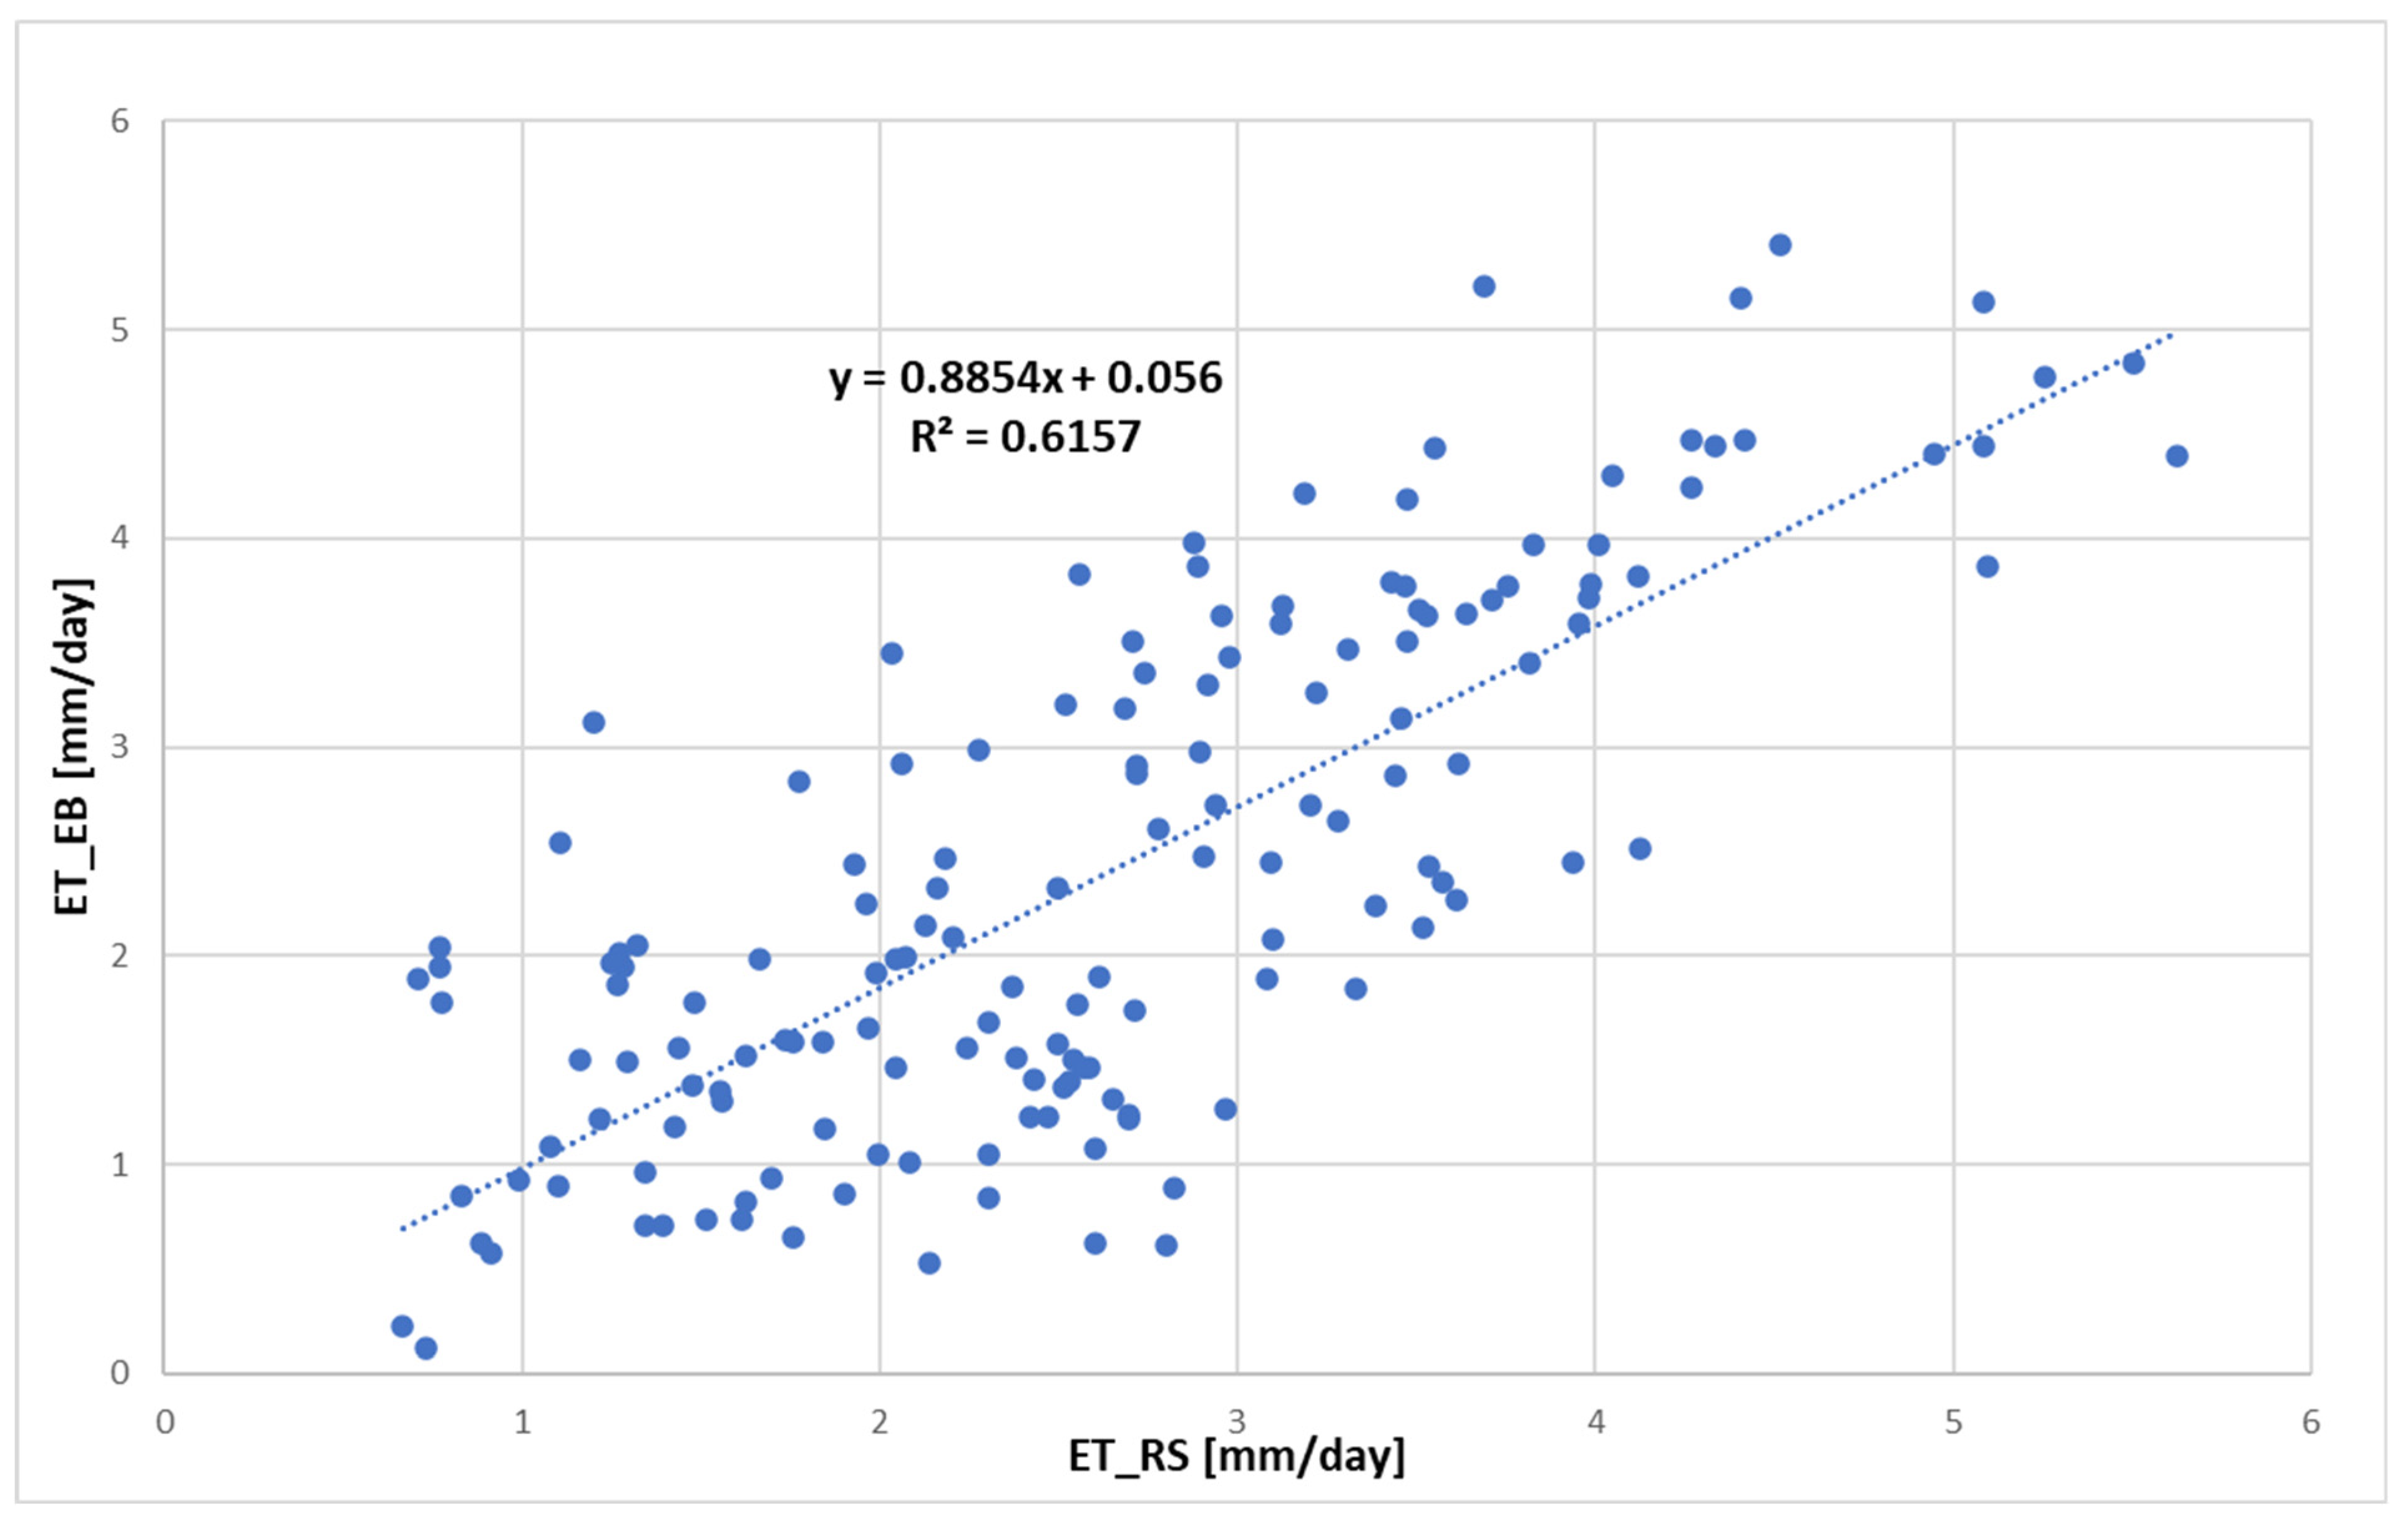
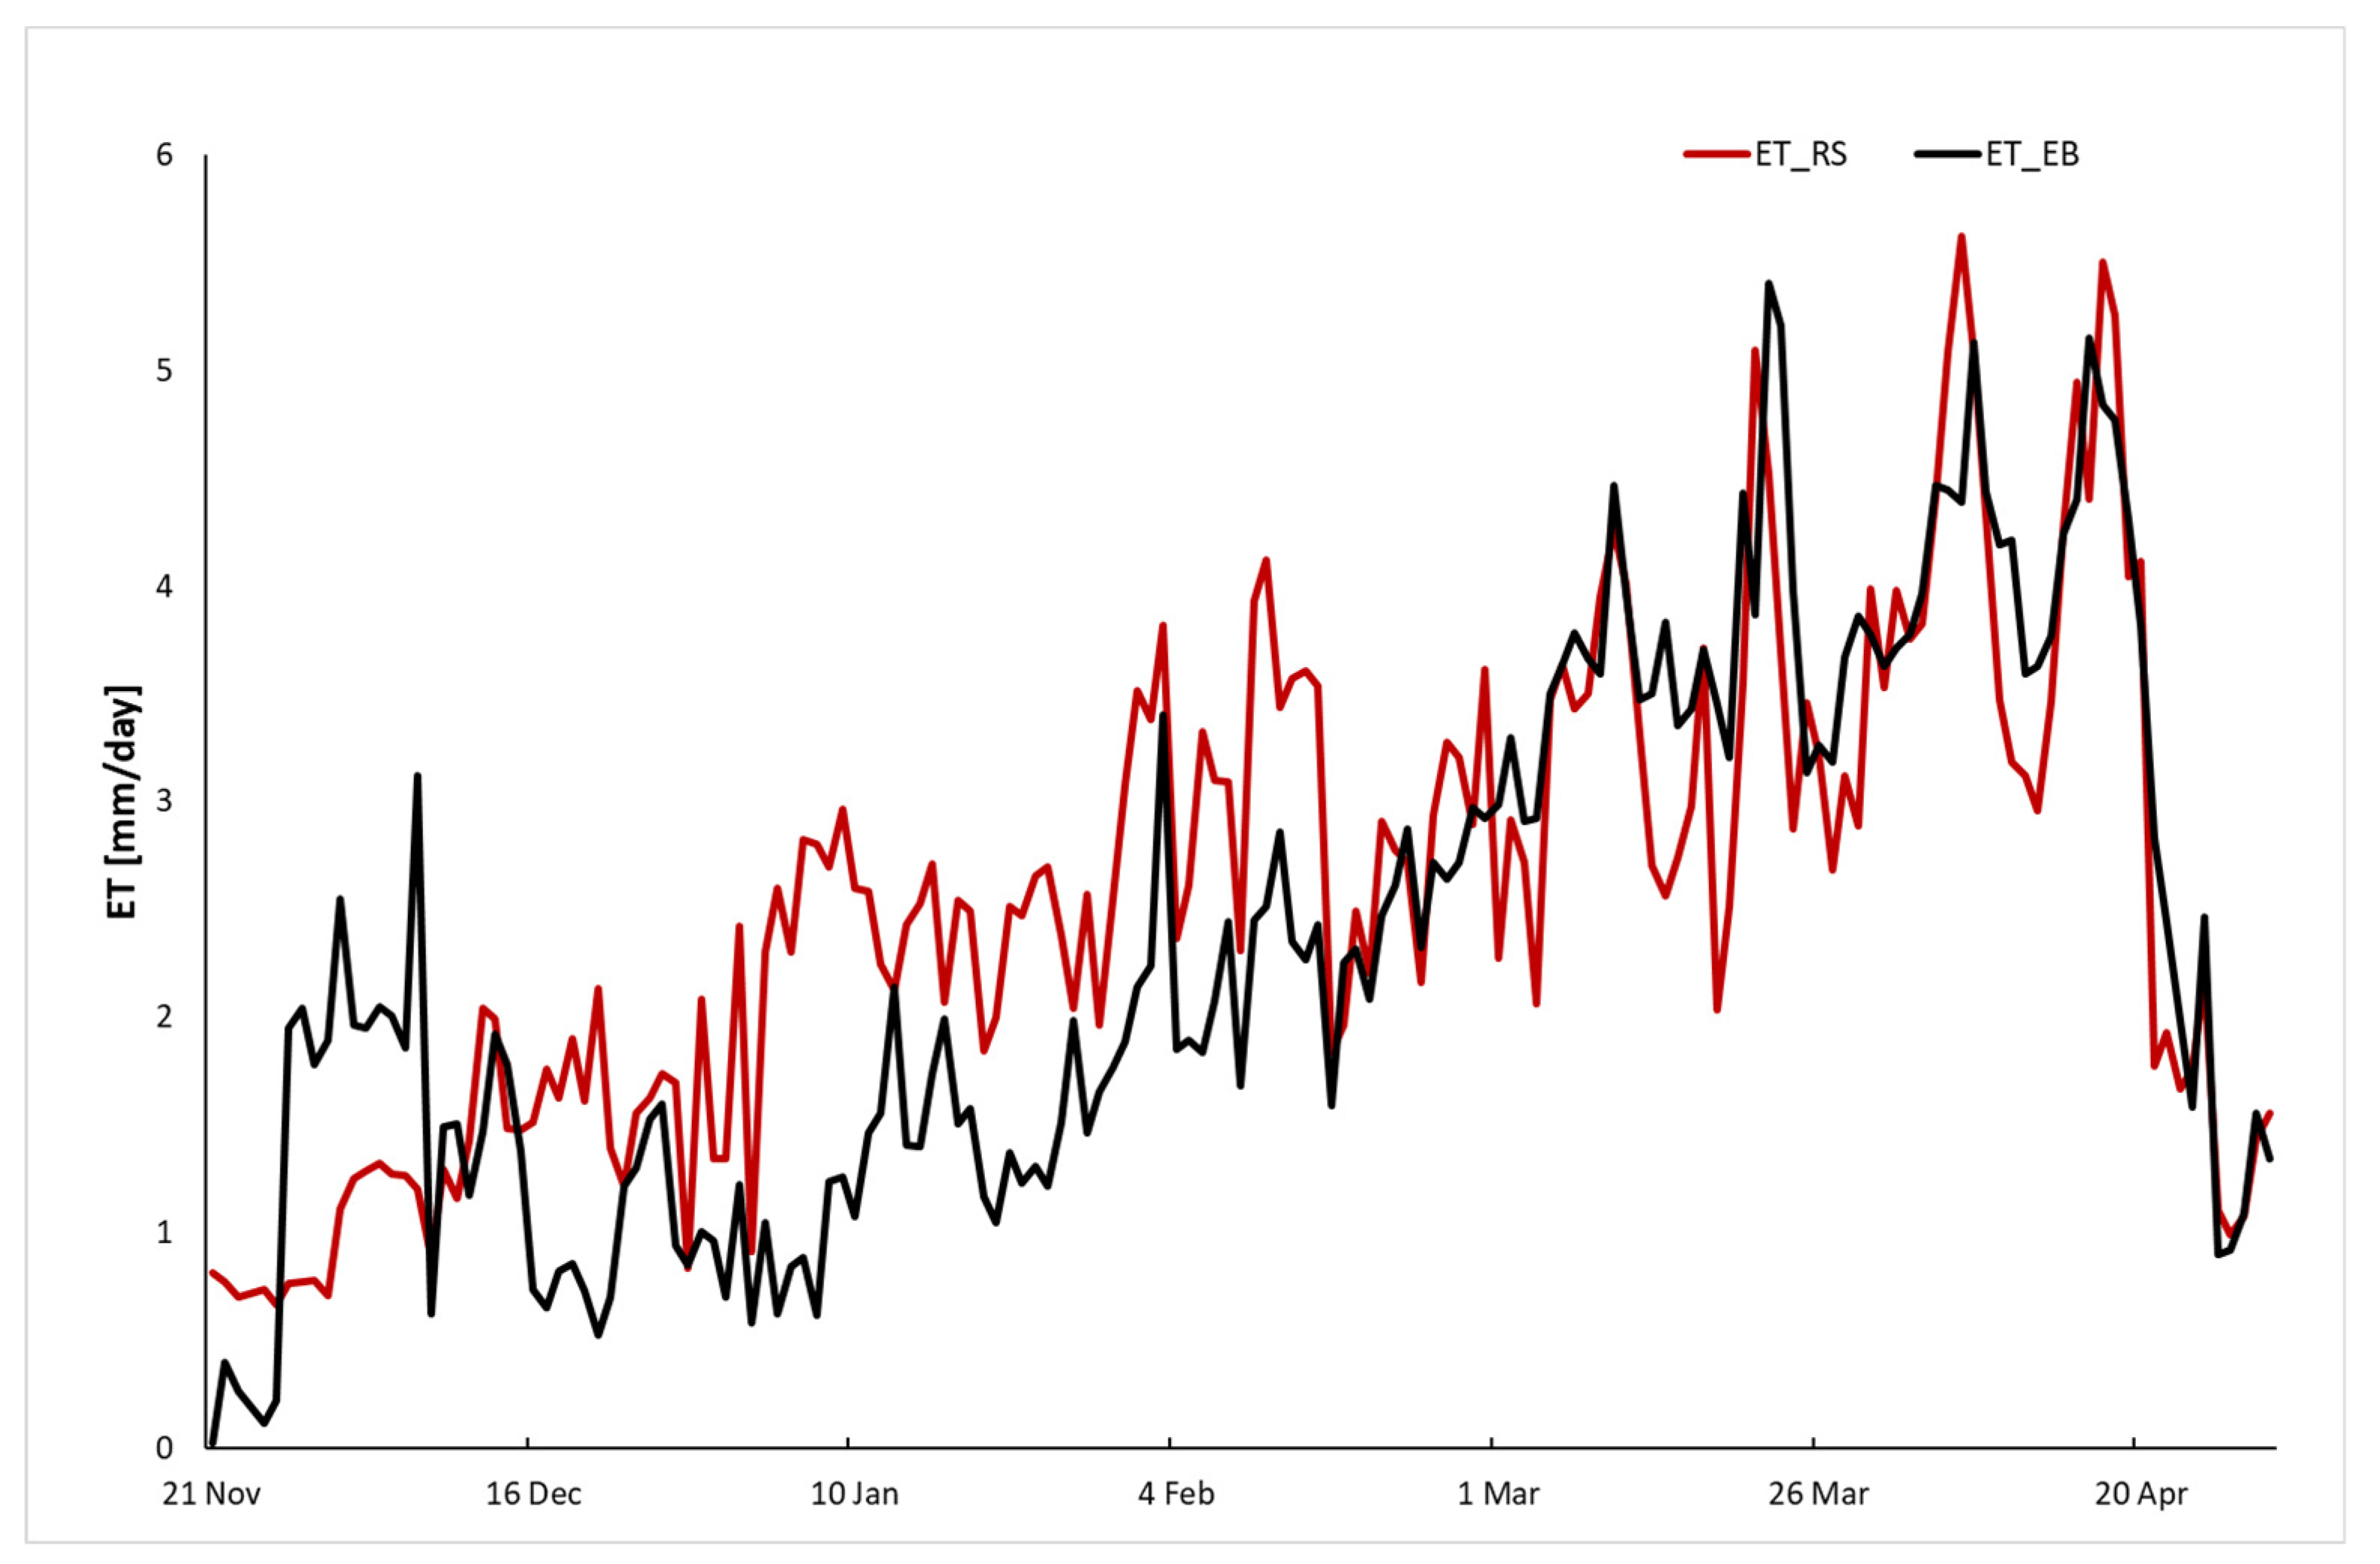
3.3. Remote Sensing-Based ET Validation

The coefficient of determination (R2) was reported as 0.61. The linear link between measured ET based on energy balance and remote sensing-based ET at the daily level from 21 November 2020 to 30 April 2021 was examined. The slope of the equation reported a value of 0.885, while the intercept recorded a value of 0.06. Figure 10 demonstrates the association between measured ET data and the remote sensing-based ET findings; the fit of the records’ distributions was acceptable as a line equation. The contrast between reference results (daily measured ET) and estimated results (daily remotely sensed ET) for the period from 21 November 2020 to 30 April 2021 is illustrated in Figure 11.
The variation of validation indices in previous publications makes judging more complicated, so we used several indices to overcome this problem in the current study. The most common validation method is RMSE. RMSE can reflect samples’ estimated sensitivity and extreme effects, whereby a smaller value means higher accuracy.
Three statistical indices (RMSE, r, and d) were calculated to determine the accuracy of the remote sensing-based ET model used. These statistical indices were calculated for measured ET and RS-based ET daily. When the RMSE is close to zero, it expresses precise and reliable estimated results [36]. The validation factors indicated good indices for RS-based ET results compared to field-measured ET. The RMSE was recorded at 0.84 mm/day. The ‘r’ and ’d’ indicated good results, where ‘r’ indicated a result of 0.785, meaning the correlation is good between predicted results and reference results. The result analysis of d values showed high agreement between anticipated results (RS-based ET) and reference results (measured ET). The d value was recorded at 0.872.

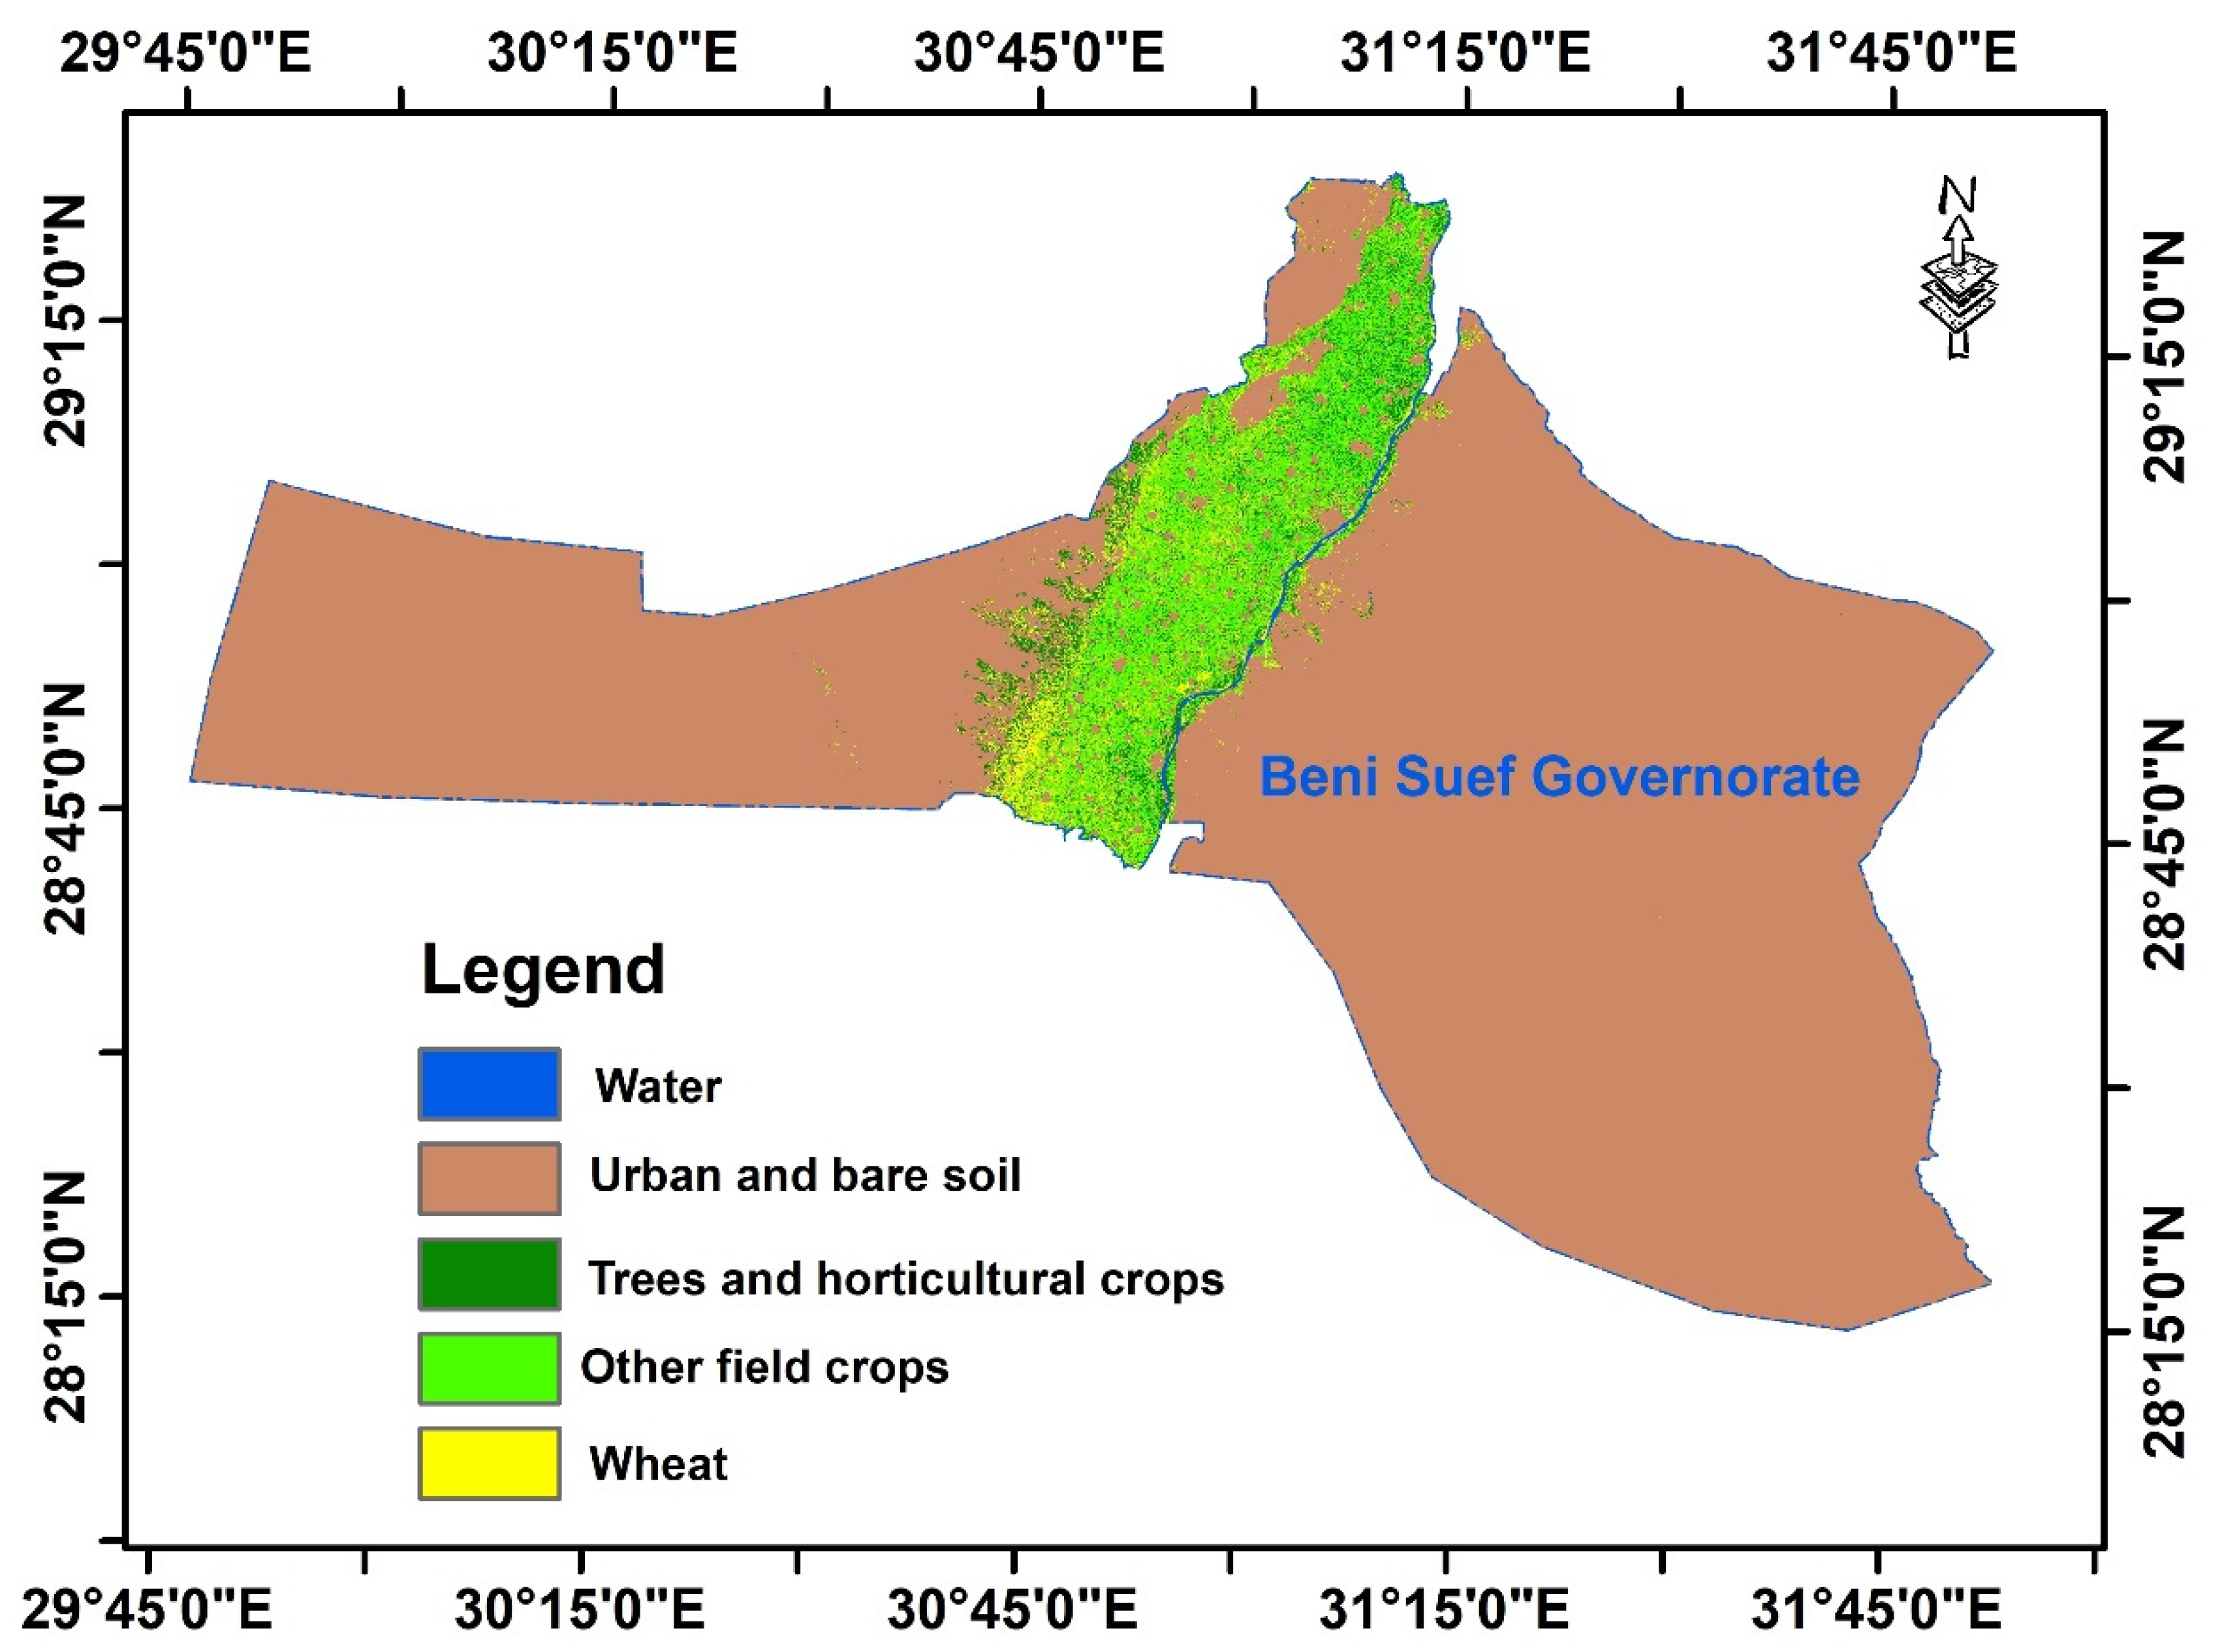
3.4. Land Use and Cover Map

The land use and land cover map interpret the water consumption in the study area. Five classes were used to classify the study area’s land use and cover map: Water streams, urban areas and bare soil, trees and horticultural crops, other winter crops, and wheat. Wheat and clover are the major winter crops in Egypt for both areas and distribution. Clover is planted from September to the first half of October, with full vegetation cover from November to May. The clover is cut four to five times during the season, and it has a unique growth curve. Wheat is cultivated in November in most areas and has full canopy cover in February, while harvesting occurs in late April to early May for late cultivated lands. Wheat and fava beans are cultivated and harvested in the same period, while potato has another growth period cultivated in January and February while harvesting occurs in April and May. The results of the classified major field crops are represented in Figure 12. The classes are detected based on cover regions more considerably than the pixel size. The small size appears to be a combination of two crops and two phenological phases; therefore, the pixel signature has various possibilities depending on the proportion of crops in the pixel.
The overall accuracy was 91%. The confusion matrix of the classified winter season of Beni Suef Governorate is represented in Table 2.
The land use/cover map identified various classes that indicated water consumption rates based on their water use behavior [6,7,37,38,39,40,41]. Winter crops consume less water than summer crops; for example, rice consumes more water than wheat, reflecting weather parameters and cultivation activities [29,42,43]. The variation of land use/cover classes controls the actual water consumption, which is the limiting factor for calculated weather parameters such as evaporation and reference evapotranspiration [44,45,46,47,48], in addition to soil and water quality, which control water availability [49,50].

4. Conclusions

Remote sensing data and techniques monitor the earth’s resources on a regional or global scale. However, remote sensing data are still being assessed. Farmland spatial and temporal dynamics must be mapped for regular crop status monitoring, land and water resource management, crop yield, and tracing and comprehending agricultural and environmental consequences. Combining ground and remote sensing data to obtain large-scale physical parameters is common. Most countries lack the required accurate ground data on ET. Therefore, remote sensing data, as a stand-alone data source, are not appropriate unless they are accurately validated by field measurements. Remote sensing data can be used as a stand-alone ET data source with high accuracy once a good calibration and validation process has been established. Our new remote sensing-based ET model was built on two parties: The thermal condition factor (TCF) and the vegetation condition fraction (VCF). The remote sensing-based ET estimation model was tested using Energy Balance flux tower ET measurements. The RMSE was 0.84 mm/day. The r and d values indicated satisfactory results, where r = 0.785. The predicted and reference results were strongly correlated. Based on d values, the expected (RS-based ET) and reference results were highly congruent (measured ET). The d value was 0.872. Between 21 November 2020 and 30 April 2021, RS-based ET accumulated 418 mm, while measured ET accumulated 376 mm. The new RS-based ET model gave good daily and seasonal results. The statistical indices were acceptable. RMSE is not a good indicator of average model performance and may be misleading [51,52]. Two more indices (r and d) were calculated to assess the RS-based ET model’s accuracy. The original RS-based ET model results showed promising results but overestimated the winter season. Winter months saw the most overestimation.

Author Contributions

All authors substantially contributed to this article. R.G. and M.E.-S., conceptualized the study. M.E.-S., developed the methodology. The remote sensing data were collected, analyzed, and modeled by M.E.-S., while the meteorological and energy balance data were collected and analyzed by R.G. While R.G., M.E.-S. and A.S. collaborated on data analysis and discussion, field equipment installations by A.S. and R.G.; A.S., A.A.-H., Y.A., A.-G.E.-G. and V.N. contributed to reviewing and editing the manuscript. All authors have read and agreed to the published version of the manuscript.

Funding

The authors would like to declare that the funding of the study was financially supported by the International Center for Agricultural Research in the Dry Areas (ICARDA).

Acknowledgments

The authors would like to thank ICARDA and ARC colleagues who technically supported this work, from conducting field experiments to data analysis. The authors also would like to express their gratitude and thanks to Eng. Hany Hussein, the representative of Campbell Scientific Company in Egypt, for his great efforts in the installation and programming of the instruments of the Energy Balance flux tower station, and also for his efforts in continuous and on-time maintenance of the sensors and equipment that assured collecting accurate data during the season.

Conflicts of Interest

The authors would like to certify hereby that no conflicts of interest exist in the data collection, processing of the data, the writing of the manuscript, and the decision to publish the results.

References

  1. Ministry of Water Resources and Irrigation. Water Scarcity in Egypt. 2014. In: Ministry of Water Resources and Irrigation. Available online: https://www.mfa.gov.eg/SiteCollectionDocuments/Egypt%20Water%20Resources%20Paper_2014.pdf (accessed on 7 April 2019).
  2. Allen, R.G.; Pereira, L.S.; Raes, D.; Smith, M. Crop Evapotranspiration: Guidelines for Computing Crop Water Requirements; United Nations Food and Agriculture Organization, Irrigation and Drain: Rome, Italy, 1998; p. 56. [Google Scholar]
  3. Häusler, M.; Conceição, N.; Tezza, L.; Sánchez, J.M.; Campagnolo, M.L.; Häusler, A.J.; Silva, J.M.; Warneke, T.; Heygster, G.; Ferreira, M.I. Estimation and partitioning of actual daily evapotranspiration at an intensive olive grove using the STSEB model based on remote sensing. Agric. Water Manag. 2018, 201, 188–198. [Google Scholar] [CrossRef]
  4. Xiang, K.; Li, Y.; Horton, R.; Feng, H. Similarity and difference of potential evapotranspiration and reference crop evapotranspiration—A review. Agric. Water Manag. 2020, 232, 106043. [Google Scholar] [CrossRef]
  5. Abdelkhalik, A.; Pascual, B.; Nájera, I.; Domene, M.A.; Baixauli, C.; Pascual-Seva, N. Effects of deficit irrigation on the yield and irrigation water use efficiency of drip-irrigated sweet pepper (Capsicum annuum L.) under Mediterranean conditions. Irrig. Sci. 2020, 38, 89–104. [Google Scholar] [CrossRef]
  6. El-Shirbeny, M.A.; Ali, A.M.; Savin, I.; Poddubskiy, A.; Dokukin, P. Agricultural Water Monitoring for Water Management Under Pivot Irrigation System Using Spatial Techniques. Earth Syst. Environ. 2021, 5, 341–351. [Google Scholar] [CrossRef]
  7. El-Shirbeny, M.A.; Saleh, S.M. Actual evapotranspiration evaluation based on multi-sensed data. J. Arid. Agric. 2021, 7, 95–102. [Google Scholar] [CrossRef]
  8. El-Shirbeny, M.A.; Ali, A.M.; Khdery, G.A.; Saleh, N.H.; Afify, N.M.; Badr, M.A.; Bauomy, E.M. Monitoring agricultural water in the desert environment of New Valley Governorate for sustainable agricultural development: A case study of Kharga. Euro-Mediterr. J. Environ. Integr. 2021, 6, 1–15. [Google Scholar] [CrossRef]
  9. El-Shirbeny, M.A.; Mohamed, E.S.; Negm, A. Estimation of Crops Water Consumptions Using Remote Sensing with Case Studies from Egypt. In Conventional Water Resources and Agriculture in Egypt; Springer: Cham, Switzerland, 2019; pp. 161–186. [Google Scholar] [CrossRef]
  10. Bastiaanssen, W.G.M.; Menenti, M.; Feddes, R.A.; Holtslag, A.A.M. A remote sensing surface energy balance algorithm for land (SEBAL). 1. Formulation. J. Hydrol. 1998, 212–213, 198–212. [Google Scholar] [CrossRef]
  11. Wilson, K.B.; Hanson, P.J.; Mulholland, P.J.; Baldocchi, D.D.; Wullschleger, S.D. A comparison of methods for determining forest evapotranspiration and its components: Sap-flow, soil water budget, eddy covariance and catchment water balance. Agric. For. Meteorol. 2001, 106, 153–168. [Google Scholar] [CrossRef]
  12. Law, B.E.; Falge, E.; Gu, L.; Baldocchi, D.D.; Bakwin, P.; Berbigier, P.; Davis, K.; Dolman, A.J.; Falk, M.; Fuentes, J.; et al. Environmental controls over carbon dioxide and water vapor exchange of terrestrial vegetation. Agric. For. Meteorol. 2002, 113, 97–120. [Google Scholar] [CrossRef] [Green Version]
  13. Farg, E.; Arafat, S.M.; Abd El-Wahed, M.S.; El-Gindy, A.M. Estimation of evapotran-spiration ETc and crop coefficient K c of wheat, in south nile delta of Egypt using integrat-ed FAO-56 approach and remote sensing data. Egypt. J. Remote Sens. Space Sci. 2012, 15, 83–89. [Google Scholar]
  14. Smaliychuk, A.; Müller, D.; Prishchepov, A.V.; Levers, C.; Kruhlov, I.; Kuemmerle, T. Recultivation of abandoned agricultural lands in Ukraine: Patterns and drivers. Glob. Environ. Chang. 2016, 38, 70–81. [Google Scholar] [CrossRef]
  15. Hao, P.; Löw, F.; Biradar, C. Annual Cropland Mapping Using Reference Landsat Time Series—A Case Study in Central Asia. Remote Sens. 2018, 10, 2057. [Google Scholar] [CrossRef]
  16. Roy, D.P.; Wulder, M.A.; Loveland, T.R.; Woodcock, C.E.; Allen, R.G.; Anderson, M.C.; Helder, D.; Irons, J.R.; Johnson, D.M.; Kennedy, R.; et al. Landsat-8: Science and product vision for terrestrial global change research. Remote Sens. Environ. 2014, 145, 154–172. [Google Scholar] [CrossRef]
  17. Wulder, M.A.; White, J.C.; Loveland, T.R.; Woodcock, C.E.; Belward, A.S.; Cohen, W.B.; Fosnight, E.A.; Shaw, J.; Masek, J.G.; Roy, D.P. The global Landsat archive: Status, consolidation and direction. Remote Sens. Environ. 2016, 185, 271–283. [Google Scholar] [CrossRef]
  18. Li, C.; Gong, P.; Wang, J.; Zhu, Z.; Biging, G.S.; Yuan, C.; Hu, T.; Zhang, H.; Wang, Q.; Li, X.; et al. The first all-season sample set for mapping global land cover with Landsat-8 data. Sci. Bull. 2017, 62, 508–515. [Google Scholar] [CrossRef]
  19. Gorelick, N.; Hancher, M.; Dixon, M.; Ilyushchenko, S.; Thau, D.; Moore, R. Google Earth Engine: Planetary-scale geospatial analysis for everyone. Remote Sens. Environ. 2017, 202, 18–27. [Google Scholar] [CrossRef]
  20. Carrasco, L.; O’Neil, A.W.; Morton, R.D.; Rowland, C.S. Evaluating Combinations of Temporally Aggregated Sentinel-1, Sentinel-2 and Landsat 8 for Land Cover Mapping with Google Earth Engine. Remote Sens. 2019, 11, 288. [Google Scholar] [CrossRef]
  21. Tamiminia, H.; Salehi, B.; Mahdianpari, M.; Quackenbush, L.; Adeli, S.; Brisco, B. Google Earth Engine for geo-big data applications: A meta-analysis and systematic re-view. ISPRS J. Photogramm. Remote Sens. 2020, 164, 152–170. [Google Scholar] [CrossRef]
  22. Irmak, S.; Odhiambo, O.; Specht, J.E.; Djaman, K. Hourly and daily single and basal evapotranspiration crop coefficients as a function of growing degree days, days after emergence, leaf area index, fractional green canopy cover, and plant phenology for soybean. Trans. ASABE 2013, 56, 1785–1803. [Google Scholar]
  23. Tesfaye, A.A.; Awoke, B.G. Evaluation of the saturation property of vegetation indices derived from sentinel-2 in mixed crop-forest ecosystem. Spat. Inf. Res. 2021, 29, 109–121. [Google Scholar] [CrossRef]
  24. Mcfeeters, S.K. The use of normalized difference water index (NDWI) in thedelineation of open water features. Int. J. Remote Sens. 1996, 17, 1425–1432. [Google Scholar] [CrossRef]
  25. Zhan, Q.; Meng, F.; Xiao, Y. Exploring the Relationships between Land Surface Temperature, Ground Coverage Ratio and Building Volume Density in an Urbanized Environment; The International Archives of the Photogrammetry, Remote Sensing and Spatial Information Sciences: Hannover, Germany, 2015; Volume XL-7/W3. [Google Scholar]
  26. Mohamed, E.S.; Ali, A.; El-Shirbeny, M.; Abutaleb, K.; Shaddad, S.M. Mapping soil moisture and their correlation with crop pattern using remotely sensed data in arid re-gion. Egypt. J. Remote Sens. Space Sci. 2020, 23, 347–353. [Google Scholar]
  27. Norman, J.M.; Divakarla, M.; Goel, N.S. Algorithms for extracting information from remote thermal-IR observations of the earth’s surface. Remote Sens. Env. 1995, 51, 157–168. [Google Scholar] [CrossRef]
  28. Kogan, F.N. Application of vegetation index and brightness temperature for drought detection. Adv. Space Res. 1995, 15, 91–100. [Google Scholar] [CrossRef]
  29. Tolba, R.A.; El-Shirbeny, M.A.; Abou-Shleel, S.M.; El-Mohandes, M.A. Rice Acreage Delineation in the Nile Delta Based on Thermal Signature. Earth Syst. Environ. 2020, 4, 287–296. [Google Scholar] [CrossRef]
  30. van den Bergh, T.; Inauen, N.; Hiltbrunner, E.; Körner, C. Climate and plant cover co-determine the elevational reduction in evapotranspiration in the Swiss Alps. J. Hydrol. 2013, 500, 75–83. [Google Scholar] [CrossRef]
  31. Alghory, A.; Yazar, A. Evaluation of crop water stress index and leaf water potential for deficit irrigation management of sprinkler-irrigated wheat. Irrig. Sci. 2019, 37, 61–77. [Google Scholar] [CrossRef]
  32. Xue, J.; Su, B. Significant remote sensing vegetation indices: A review of developments and applications. J. Sens. 2017, 2017, 1353691. [Google Scholar] [CrossRef]
  33. Holzman, M.E.; Carmona, F.; Rivas, R.; Niclòs, R. Early assessment of crop yield from remotely sensed water stress and solar radiation data. ISPRS J. Photogramm. Remote Sens. 2018, 145, 297–308. [Google Scholar] [CrossRef]
  34. Li, H.D.; Li, Y.K.; Gao, Y.Y.; Zou, C.X.; Yan, S.G.; Gao, J.X. Human impact on vegetation dynamics around Lhasa, Southern Tibetan Plateau, China. Sustainability 2016, 8, 1146. [Google Scholar] [CrossRef]
  35. Tang, Z.G.; Ma, J.H.; Peng, H.H.; Wang, S.H.; Wei, J.F. Spatiotemporal changes of vegetation and their responses to temperature and precipitation in upper Shiyang River Basin. Adv. Space Res. 2017, 60, 969–979. [Google Scholar] [CrossRef]
  36. Jin, X.; Yang, G.; Xue, X.; Xu, X.; Li, Z.; Feng, H. Validation of two Huanjing-1A/B satellite-based FAO-56 models for estimating winter wheat crop evapotranspiration during mid-season. Agric. Water Manag. 2017, 189, 27–38. [Google Scholar] [CrossRef]
  37. Wang, J.; Li, X.; Lu, L.; Fang, F. Estimating near future regional maize yields by integrating multi-source observations into a crop growth model. Eur. J. Agron. 2013, 49, 126–140. [Google Scholar] [CrossRef]
  38. Aboelghar, M.; Arafat, S.; Saleh, A.; Naeem, S.; El-Shirbeny, M.; Belal, A. Retrieving leaf area index from SPOT4 satellite data. Egypt. J. Remote Sens. Space Sci. 2010, 13, 121–127. [Google Scholar] [CrossRef]
  39. Aboelghar, M.; Arafat, S.; Yousef, M.A.; El-Shirbeny, M.; Naeem, S.; Massoud, A.; Saleh, N. Using SPOT data and leaf area index for rice yield estimation in Egyptian Nile delta. Egypt. J. Remote Sens. Space Sci. 2011, 14, 81–89. [Google Scholar] [CrossRef]
  40. El-Shirbeny, M.A.; Alsersy, M.A.M.; Saleh, N.H.; Abutaleb, K.A. Changes in irrigation water consumption in the Nile Delta of Egypt assessed by remote sensing. Arab. J. Geosci. 2015, 8, 10509–10519. [Google Scholar] [CrossRef]
  41. Mohamed, E.S.; Belal, A.A.; Abd-Elmabod, S.K.; El-Shirbeny, M.A.; Gad, A.; Zahran, M.B. Smart farming for improving agricultural management. Egypt. J. Remote Sens. Space Sci. 2021, 24, 971–981. [Google Scholar] [CrossRef]
  42. El Baroudy, A.A.; Ali, A.M.; Mohamed, E.S.; Moghanm, F.S.; Shokr, M.S.; Savin, I.; Poddubsky, A.; Ding, Z.; Kheir, A.M.; Aldosari, A.A.; et al. Modeling Land Suitability for Rice Crop Using Remote Sensing and Soil Quality Indicators: The Case Study of the Nile Delta. Sustainability 2020, 12, 9653. [Google Scholar] [CrossRef]
  43. Abd-Elmabod, S.K.; Mansour, H.; Hussein, A.A.E.F.; Mohamed, E.S.; Zhang, Z.; Anaya-Romero, M.; Jordán, A. Influence of irrigation water quantity on the land capability classification. Plant Arch. 2019, 2, 2253–2561. [Google Scholar]
  44. El-Shirbeny, M.A.; Abutaleb, K.A. Monitoring of water-level fluctuation of Lake Nasser using altimetry satellite data. Earth Syst. Environ. 2018, 2, 367–375. [Google Scholar] [CrossRef]
  45. El-Shirbeny, M.A.; Aboelghar, M.A.; Arafat, S.M.; El-Gindy, A.M. Assessment of the mutual impact between climate and vegetation cover using NOAA-AVHRR and Landsat data in Egypt. Arab. J. Geosci. 2014, 7, 1287–1296. [Google Scholar] [CrossRef]
  46. El-Shirbeny, M.A.; Abdellatif, B.; Ali, A.M.; Saleh, N.H. Evaluation of Hargreaves based on remote sensing method to estimate potential crop evapotranspiration. GEOMATE J. 2016, 11, 2143–2149. [Google Scholar] [CrossRef]
  47. El-Shirbeny, M.A.; Abdellatif, B. Reference evapotranspiration borders maps of Egypt based on kriging spatial statistics method. GEOMATE J. 2017, 13, 1–8. [Google Scholar] [CrossRef]
  48. El-Shirbeny, M.A.; Biradar, C.; Amer, K.; Paul, S. Evapotranspiration and Vegetation Cover Classifications Maps Based on Cloud Computing at the Arab Countries Scale. Earth Syst. Environ. 2022; in press. [Google Scholar] [CrossRef]
  49. Abdel-Fattah, M.K.; Abd-Elmabod, S.K.; Aldosari, A.A.; Elrys, A.S.; Mohamed, E.S. Multivariate Analysis for Assessing Irrigation Water Quality: A Case Study of the Bahr Mouise Canal, Eastern Nile Delta. Water 2020, 12, 2537. [Google Scholar] [CrossRef]
  50. Mohamed, E.S.; Ali, A.M.; El-Shirbeny, M.A.; Abd El Razek Afaf, A.; Savin, I.Y. Near in-frared spectroscopy techniques for soil contamination assessment in the Nile Delta. Eurasian Soil Sci. 2016, 49, 632–639. [Google Scholar] [CrossRef]
  51. Willmott, C.J.; Matsuura, K. Advantages of the mean absolute error (MAE) over the root mean square error (RMSE) in assessing average model performance. Clim. Res. 2005, 30, 79–82. [Google Scholar] [CrossRef]
  52. Willmott, C.J.; Matsuura, K.; Robeson, S.M. Ambiguities inherent in sums-of-squares-based error statistics. Atmos. Environ. 2009, 43, 749–752. [Google Scholar] [CrossRef]
Figure 1. Location of the investigated study area in Sids Agricultural Research Station, Egypt.
Agronomy 12 02143 g001
Figure 2. The energy balance tower in Sids Station.
Agronomy 12 02143 g002
Figure 3. Spatial distribution of the ground-truthing of the winter field crops and non-field crops (urban, bare soil, water, horticultural crops, and natural vegetation).
Agronomy 12 02143 g003
Figure 4. A simple diagram representing steps of the methodology applied by GEE to classify the major field crops for seasons in the Beni Suef governorate.
Agronomy 12 02143 g004
Figure 5. Daily Reference Evapotranspiration (ETo) calculated based on meteorological parameters at Sids Station.
Agronomy 12 02143 g005
Figure 6. Daily actual evapotranspiration (ET) for wheat at Sids Research Station.
Agronomy 12 02143 g006
Figure 7. Components of the Surface Energy Fluxes (H—Sensible Heat Flux, LE—Latent Heat Flux, G—Ground Heat Flux, and Net Radiation Flux) at Sids Site Egypt for the winter wheat crop.
Agronomy 12 02143 g007
Figure 8. Monthly average crop coefficient (Kc) based on ground measurements of meteorological and energy balance stations.
Agronomy 12 02143 g008
Figure 9. Accumulated remote sensing-based ET during the winter season from 21 November 2020 to 30 April 2021.
Agronomy 12 02143 g009
Figure 10. The correlation between ground-measured ET based on energy balance station (ET_EB) and remote-sensed ET (ET_RS).
Agronomy 12 02143 g010
Figure 11. Comparison between daily measured and remote-sensed ET for the period from 21 November 2020 to 30 April 2021.
Agronomy 12 02143 g011
Figure 12. The classified land use and cover classes include major field crops, water streams, urban areas, bare soil, trees, horticultural crops, other winter crops, and wheat.
Agronomy 12 02143 g012
Table 1. The mean values of meteorological parameters at Sids station.
Growing MonthTemperature (°C)Wind Speed (m/s)Relative Humidity (%)Solar Radiation (MJ/m/Day)ETo (mm/Day)
Max.Min.
November22.6711.051.9653.9514.442.44
December22.8010.102.2353.4813.252.38
January21.787.702.2650.7214.622.41
February22.378.072.4647.9917.192.94
March25.7810.143.0839.8821.674.23
April31.6813.203.2927.4824.556.04
Table 2. The confusion matrix for winter major field crops at a seasonal scale.
Water StreamsUrban AreasTreesWheatOther CropsTotal
Water93000093
Urban0252000252
Trees0091013104
Wheat00620736249
Other crops00255197227
Total93252122212246925
Publisher’s Note: MDPI stays neutral with regard to jurisdictional claims in published maps and institutional affiliations.

