Article

Unlocking the Genetic Diversity within A Middle-East Panel of Durum Wheat Landraces for Adaptation to Semi-arid Climate

1
Biodiversity & Environmental Research Center (BERC), Til 458, Palestine
2
The Institute of Plant Sciences, Agriculture Research Organization (ARO)–Volcani Center, 68 HaMaccabim Road, P.O.B 15159, Rishon LeZion 7505101, Israel
3
The Robert H. Smith Faculty of Agriculture, Food and Environment, The Hebrew University of Jerusalem, P.O.B 12, Rehovot 7610001, Israel
4
School of Plant Sciences and Food Security, Tel Aviv University, Tel Aviv 6997801, Israel
5
Field Crop Department, National Agricultural Research Center (NARC), P.O.B 639, Baqa’ 19381, Jordan
*
Authors to whom correspondence should be addressed.
Submission received: 26 September 2018 / Revised: 15 October 2018 / Accepted: 17 October 2018 / Published: 21 October 2018

Abstract

:
Drought is the major environmental factor limiting wheat production worldwide. Developing novel cultivars with greater drought tolerance is the most viable solution to ensure sustainable agricultural production and alleviating threats to food-security. Here we established a core-collection of landraces and modern durum wheat cultivars (WheatME, n = 36), from the Middle East region (Jordan, Palestine and Israel) aiming at unlocking the genetic and morpho-physiological adaptation to semi-arid environment conditions. Interestingly, genetic analysis of the WheatME core-collection could not distinguish the landraces according to their country of origin. Field-based evaluation of the core-collection conducted across range of contrasting environmental conditions: Til-Palestine, Bet-Dagan-Israel and Irbid-Jordan with annual precipitation of 500 mm, 360 mm and 315 mm, respectively. The Til environment showed highest grain yield while the Irbid environment showed the lowest values. Analysis of variance showed a significant Genotype × Environment interaction for plant phenology traits (plant height and heading date) and productivity traits (1000-kernel weight, and grain yield). Principal component analysis showed three main cultivar groups: High yielding lines (modern durum cultivars, and landraces), tall late flowering landraces, and landraces with high grain weight. This knowledge could serve as basis for future breeding efforts to develop new elite cultivars adapted to the Mediterranean Basin’s semi-arid conditions.

Graphical Abstract

1. Introduction

Durum wheat (Triticum turgidum ssp. durum (Desf.) MacKey; 2n = 4× = 28, genome BBAA) is an important grain-crop, occupying ~10% of the wheat growing area worldwide. The Mediterranean Basin is the largest production area, and it is also grown across North and East Africa, Europe, North America, India and Australia [1]. Durum wheat has a long history as part of the Mediterranean Basin diet with an array of products, such as pasta, bourghul couscous, and unleavened breads [2]. In the Mediterranean Basin, durum wheat is mainly cultivated under rain-fed conditions and yields are thus highly affected by year-to-year and within year precipitation fluctuations.
Drought is the major and most prevalent environmental constraint in the Mediterranean Basin’s climate, limiting wheat productivity and causing devastating economic and sociological impacts. The ever-growing human population, loss of agricultural lands to urbanization, diminishing resource availability associated with climate change, all pose serious challenges to wheat breeding programs. Under the projected climatic conditions, plant growth is expected to be impaired, subsequently leading to yield reduction. To increase yields, there is an urgent need for further genetic improvement of wheat varieties by introducing new genes or alleles that confer tolerance to environmental stress [3].
Durum wheat evolution involved two major genetic bottlenecks. The first is associated with the initial domestication of wheat ~10,500 years ago from wild emmer wheat (T. turgidum ssp. dicoccoides (Körn.) Thell.), to domesticated emmer [T. turgidum ssp. dicoccum (Schrank)]. Evolution under domestication resulted in free threshing durum wheat. More recently, since the beginning of the 20th century the genetic diversity of durum wheat has been eroded by continual selection for high yields, and industry demands for standardized qualities [4]. This process was intensified during the ‘Green Revolution’ through the incorporation of Reduced height (Rht) alleles in the early 1970s [5] to produce semi-dwarf cultivars [6]. The genetic shift observed in these improved wheats could have desirable allelic compositions for traits like grain yield and quality. However, they may not possess durable resistance to biotic and abiotic stresses and might lack resilience to changing climate.
One approach to increase the genetic diversity in modern crops is to use the rich allelic repertoire present in landraces and wild wheat progenitors [3,7]. Natural and anthropogenic selection pressures during durum wheat evolution and domestication in the Mediterranean Basin have resulted in the establishment of locally adapted landraces [8]. Due to these evolutionary dynamics, landraces strongly represent the diversity of semi-arid agro-ecological conditions [9] and are an important source for species biodiversity [10]. These landraces carry beneficial genes that were not introduced into elite durum cultivars [11].
Durum landraces cultivated across the Southern Fertile Crescent (i.e., Israel, Palestine and Jordan) accumulated adaptive imprints to semi-arid conditions and are still used in traditional rain-fed farming areas of the Mediterranean Basin. Here we analyzed a new set of durum wheat landraces and cultivars from the Middle East (Jordan, Palestine and Israel), designated as the “WheatME core-collection” [12]. The aims of the study were to characterize (i) the allelic diversity of the WheatME core-collection, (ii) its morpho-physiological features, and (iii) to compare the adaptive signature of durum wheat landraces compared to modern cultivars. Better knowledge of the allelic diversity and physiological traits which confer resilience and adaptation to semi-arid environments, could promote introgression of new alleles from locally adapted landraces into modern durum breeding programs.

2. Materials and Methods

2.1. Plant Material

The WheatME core-collection includes 21 durum wheat landraces and, 13 modern durum cultivars (MDC). Additionally, we included two bread wheat landraces (T. aestivum L.) as a reference (Table S1). Seeds were obtained from Palestine, Jordan and Israel, and the “WheatME core-collection” were deposited in seed banks at Biodiversity and Environmental Research Centre (BERC), Israel Plant Gene Bank (IGB) and National Agricultural Research Centre (NARC).

2.2. Core-Collection Genotyping

The Durum Wheat Reference Collection Kompetitive allele specific PCR (KASP) 96 markers (DWRC; [13] was used for genotyping the WheatME core-collection. Sampling was conducted on single plant-bases according to the LGC kit protocol (five leaf discs/plant sample). Leaf samples were collected into 96 well LGC collections plates and were sent to LGC (Teddington, Middlesex, UK) for DNA extraction and KASP analysis. The raw genotyping data was filtered to remove the low quality and missing data. The florescent intensity results of each marker were visualized using LGC SNPViewer software (LGC Teddington, Middlesex, UK) to exclude Single nucleotide polymorphisms (SNPs) with ambiguous clusters, and genotypes that did not cluster well. SNPs with more than 20% missing data or with a minor allele frequency of less than 5% were removed. After this stage, 83 informative markers were used to assess the genetic diversity of the WheatME core-collection.

2.3. Experimental Design and Growth Conditions

The study was carried out at three contrasting rain-fed environments during the 2015–2016 growing season: Open field in Til, Palestine (32°11’41.53” N, 35°12’00.81” E, 500 mm annual precipitation), net house in Bet-Dagan, Israel (31°59’38” N 34°49’09” E, 360 mm), and open field in Irbid, Jordan (32°60’35.90” N, 315 mm). The 2015–2016 climate data of these sites are given in Table S2. A complete randomized design was implemented with three replicates per line (n = 3) in the three experimental sites. Each plot (in the size of 0.25 m2) included three rows 0.5 m long and 25 cm apart, in which five grams of seeds were sown (targeting 250 seeds per m2). The fields were treated with fungicides and pesticides periodically to prevent the development of fungal pathogens or insect pests and were manually weeded monthly.

2.4. Plant Characterization

Plants were characterized by the following traits:
Phenology traits: Days to heading (DH, recorded when 50% of the spikes have emerged; Zadoks [14]) and culm length (CL, excluding spike, measured before harvest). Physiological traits: canopy temperature at heading (CT-H), maturation (i.e., grain filling; CT-M) using an IR Thermometer (IR-200, Extech instrument, FLIR Systems, Nashua, NH, USA) and chlorophyll content at heading (Chl) using Chlorophyll Meter (Minolta SPAD-502, Tokyo, Japan), as described in [15]. Productivity traits: Plots were harvested manually and for each plot total dry matter (TDM), grain yield (GY) (taken from the middle row), thousand kernels weight (TKW), and the harvest index (HI) were determined by dividing the grain yield by the total dry matter.

2.5. Data Analysis

Discriminant analysis of principal components (DAPC) was used to find the genetic clusters of the collection based on the 83 informative markers. The “find.clusters” and DAPC functions from the adegenet ver 2.1.1 R package [16] were used to group the accessions into three clusters as determined by the minimum value of the Bayesian information criterion (BIC). A principal coordinate analysis was conducted using the dudi.pco function in adegenet. The genetic distances were calculated using the dist.gene function in the Ape R package ver. 5.2 [17].
The JMP® ver. 14.0 pro statistical package (SAS Institute, Cary, NC, USA) was used for all statistical analyses. Descriptive statistics were performed on the full dataset to illustrate variable distribution and to calculate coefficient of variation (CV). An Analysis of Variance (ANOVA) test was used to assess the possible effect of genotype (G), environment (E), and G × E interactions on the agronomic performance of the WheatME core-collection lines. Principle Component Analysis (PCA) was performed based on a correlation matrix. Initially, highly auto-correlated variables were removed from the analysis.
Superiority index was calculated for TDM and GY traits according to [18] the following equation:
P i = ( j = 1 n ( X i j M j ) ) 2 2 n
where n represents the number of environments, j represents a specific environment, Xij represents the mean of a specific wheat line in an environment, and Mj represent the maximum value that was achieved in that environment for the target trait.

3. Results

3.1. Morphological Characterization of the WheatME Core Collection

In general, the durum landraces within the WheatME core collection presented wide morphological diversity. This is visible by their spike morphology (e.g., spike color, awn length, ear density and length; Figure 1). Notably, several lines exhibited intra accession variability as a consequence of the heterogeneous nature of landraces (Figure 1j). The two reference bread wheat lines (Dickinson 485 and Palestine 1) phenotypic values were distributed randomly within the durum phenotypic range, therefore were incorporated into the durum landraces group.

3.2. Genotypic Characterization of the WheatME Core-Collection

Principal Coordinate Analysis (PCoA) showed a wide genetic diversity among the landraces compared with the modern cultivars (Figure 2). Implementing the DWRC panel (84 markers; Table S3), we were able to dissect the WheatME core-collection into three major genetic clusters using DAPC. All modern cultivars (n = 13) with two exceptions, were tagged into cluster 1 (blue). This was the largest cluster consisting of an additional nine landraces and covered a wider PCoA space compared to the other two clusters. Cluster 2 (green) consisted of three landraces out of which two were bread wheat and two modern cultivars (Figure 2). Cluster 3 (brown) contained nine durum landraces. Notably, the country of origin (i.e., Jordan, Palestine and Israel) did not have any effect on clustering (Figure 2).

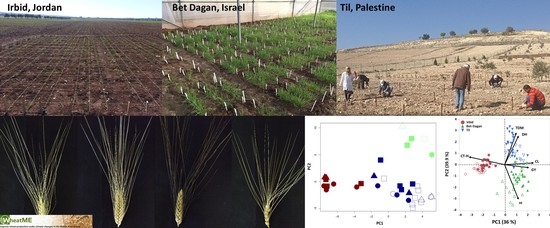
3.3. Multi-Site Agronomic Performance of the WheatME Core-Collection

The WheatME core-collection was characterized for agronomic traits in three contrasting environments along an environmental gradient. Til (Palestine) represents optimal Mediterranean conditions, high elevation, heavy soil, and relatively high precipitation (500 mm). Bet-Dagan (Israel) represents moderate environment stress with low elevation, light soil, and relatively moderate precipitations (360 mm). Irbid (Jordan) represents a stressful environment with high elevation, and low precipitation (315 mm) (Table S2). Principal Component Analysis (PCA) resulted in a clear separation between the three environments based on trait combinations (Figure 3). PCA analysis extracted two major principal components (Eigen values > 1), accounting collectively for 75.9% of the phenotypic variance among the core-collection. PC1 explained 36% of the dataset variation and was positively loaded with GY and CL and negatively with CT-H. PC2 explained 33.9% of the dataset variation and was loaded positively with TDM and DH and negatively with HI. In general, Til favorable conditions contributed to high GY and biomass production, especially for wheat lines with late heading date (Table 1 and Figure 3). This is contrasted by much lower productivity in both Bet-Dagan and Irbid (e.g., landrace group average of 178.8, 81.2 and 96.9 gr/0.5 m TDM, for Til, Beit-Dagan and Irbid, respectively; Table 1). Plants grown under the most stressful environment (Irbid) exhibited high canopy temperature around heading time (CT-H) and early flowering compared to Til grown plants (Table 1). The overall site phenotypic variability (CV) was found smaller compared to the two favorable environments which both show high variability along PC2 and in yield related traits (GY, TKW and HI, Table 1 and Figure 3).
In all environments, durum landraces expressed higher levels of phenotypic variability as compared with the modern durum elite cultivars, which occupied a smaller phenotypic space within each environment (Figure 3). For most traits, modern lines exhibited smaller ranges and narrow CVs (Table 1). The landraces flowered later and had higher plant biomass (TDM) compared to modern semi-dwarf varieties, which also expressed a lower HI (Table 1 and Figure 3). In terms of GY, modern cultivars were superior under favorable conditions (i.e., Til). Moreover, the landraces exhibited higher GY both in moderate and favorable environments than in stressful environment (Table 1).

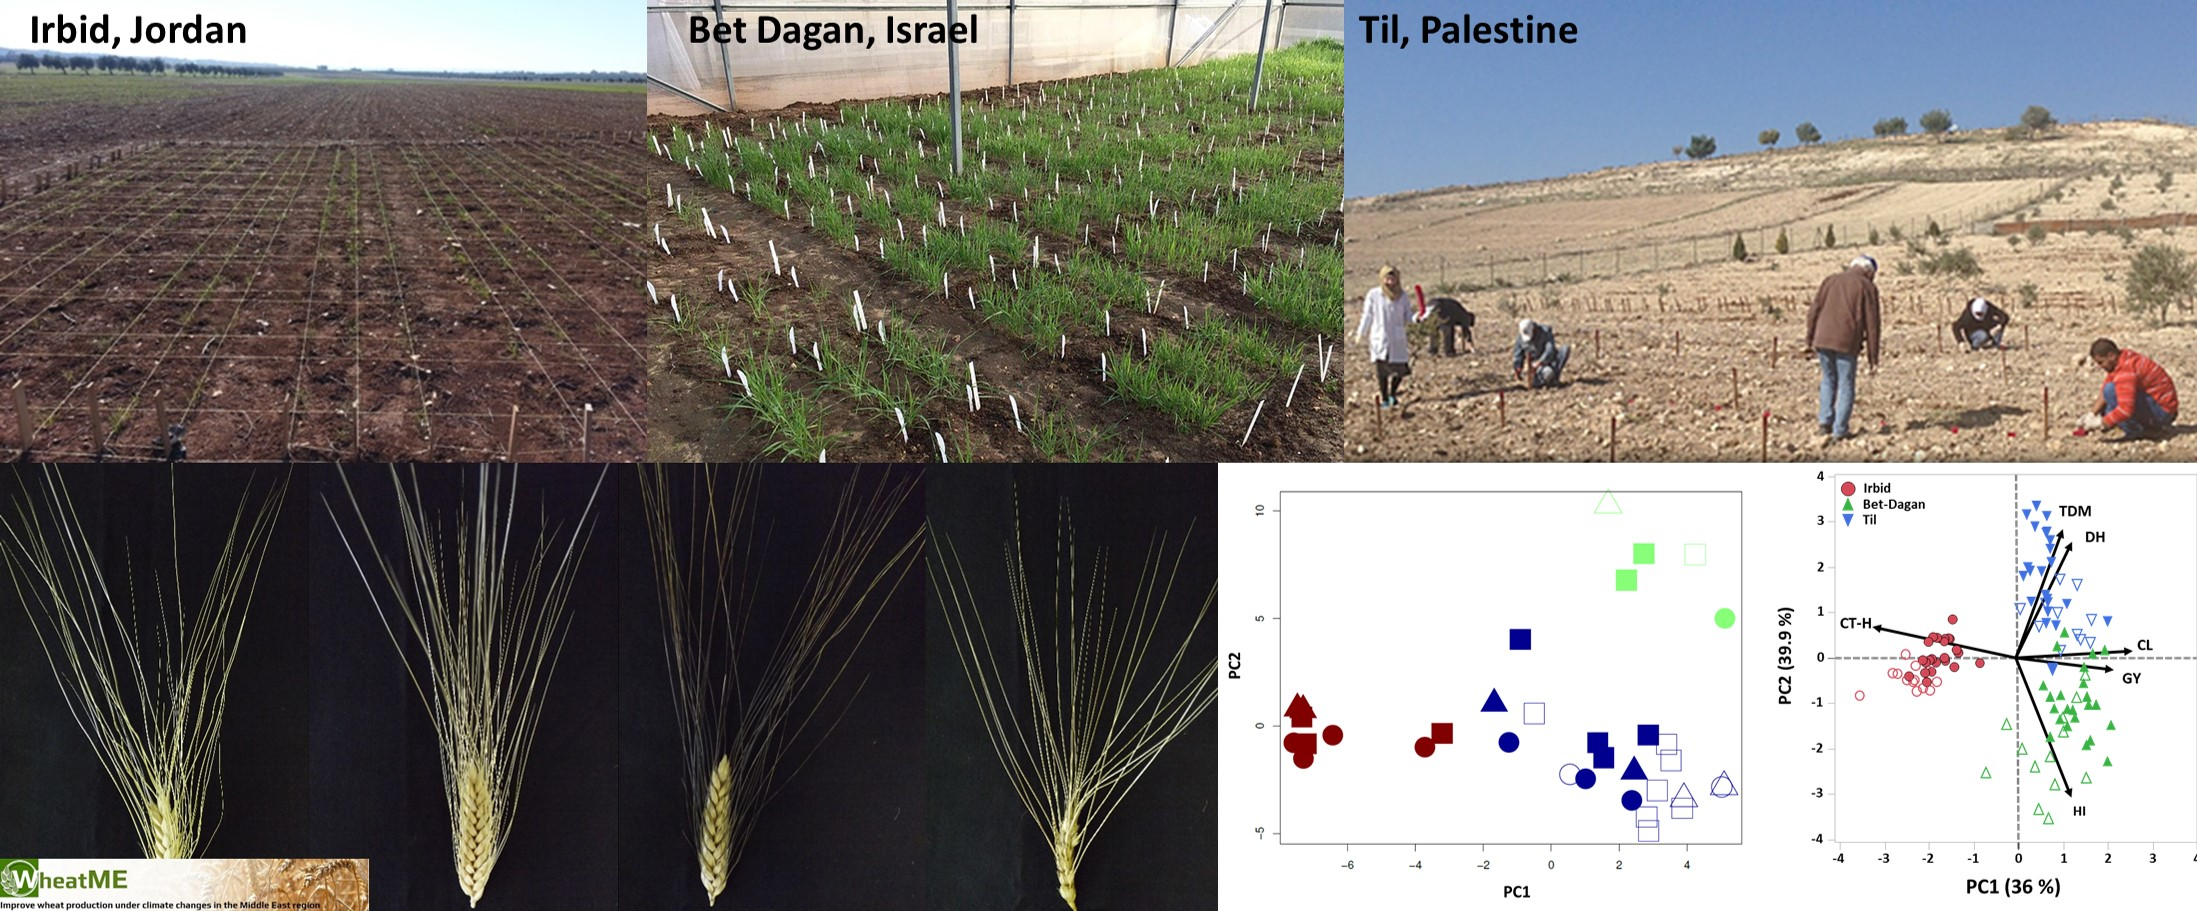
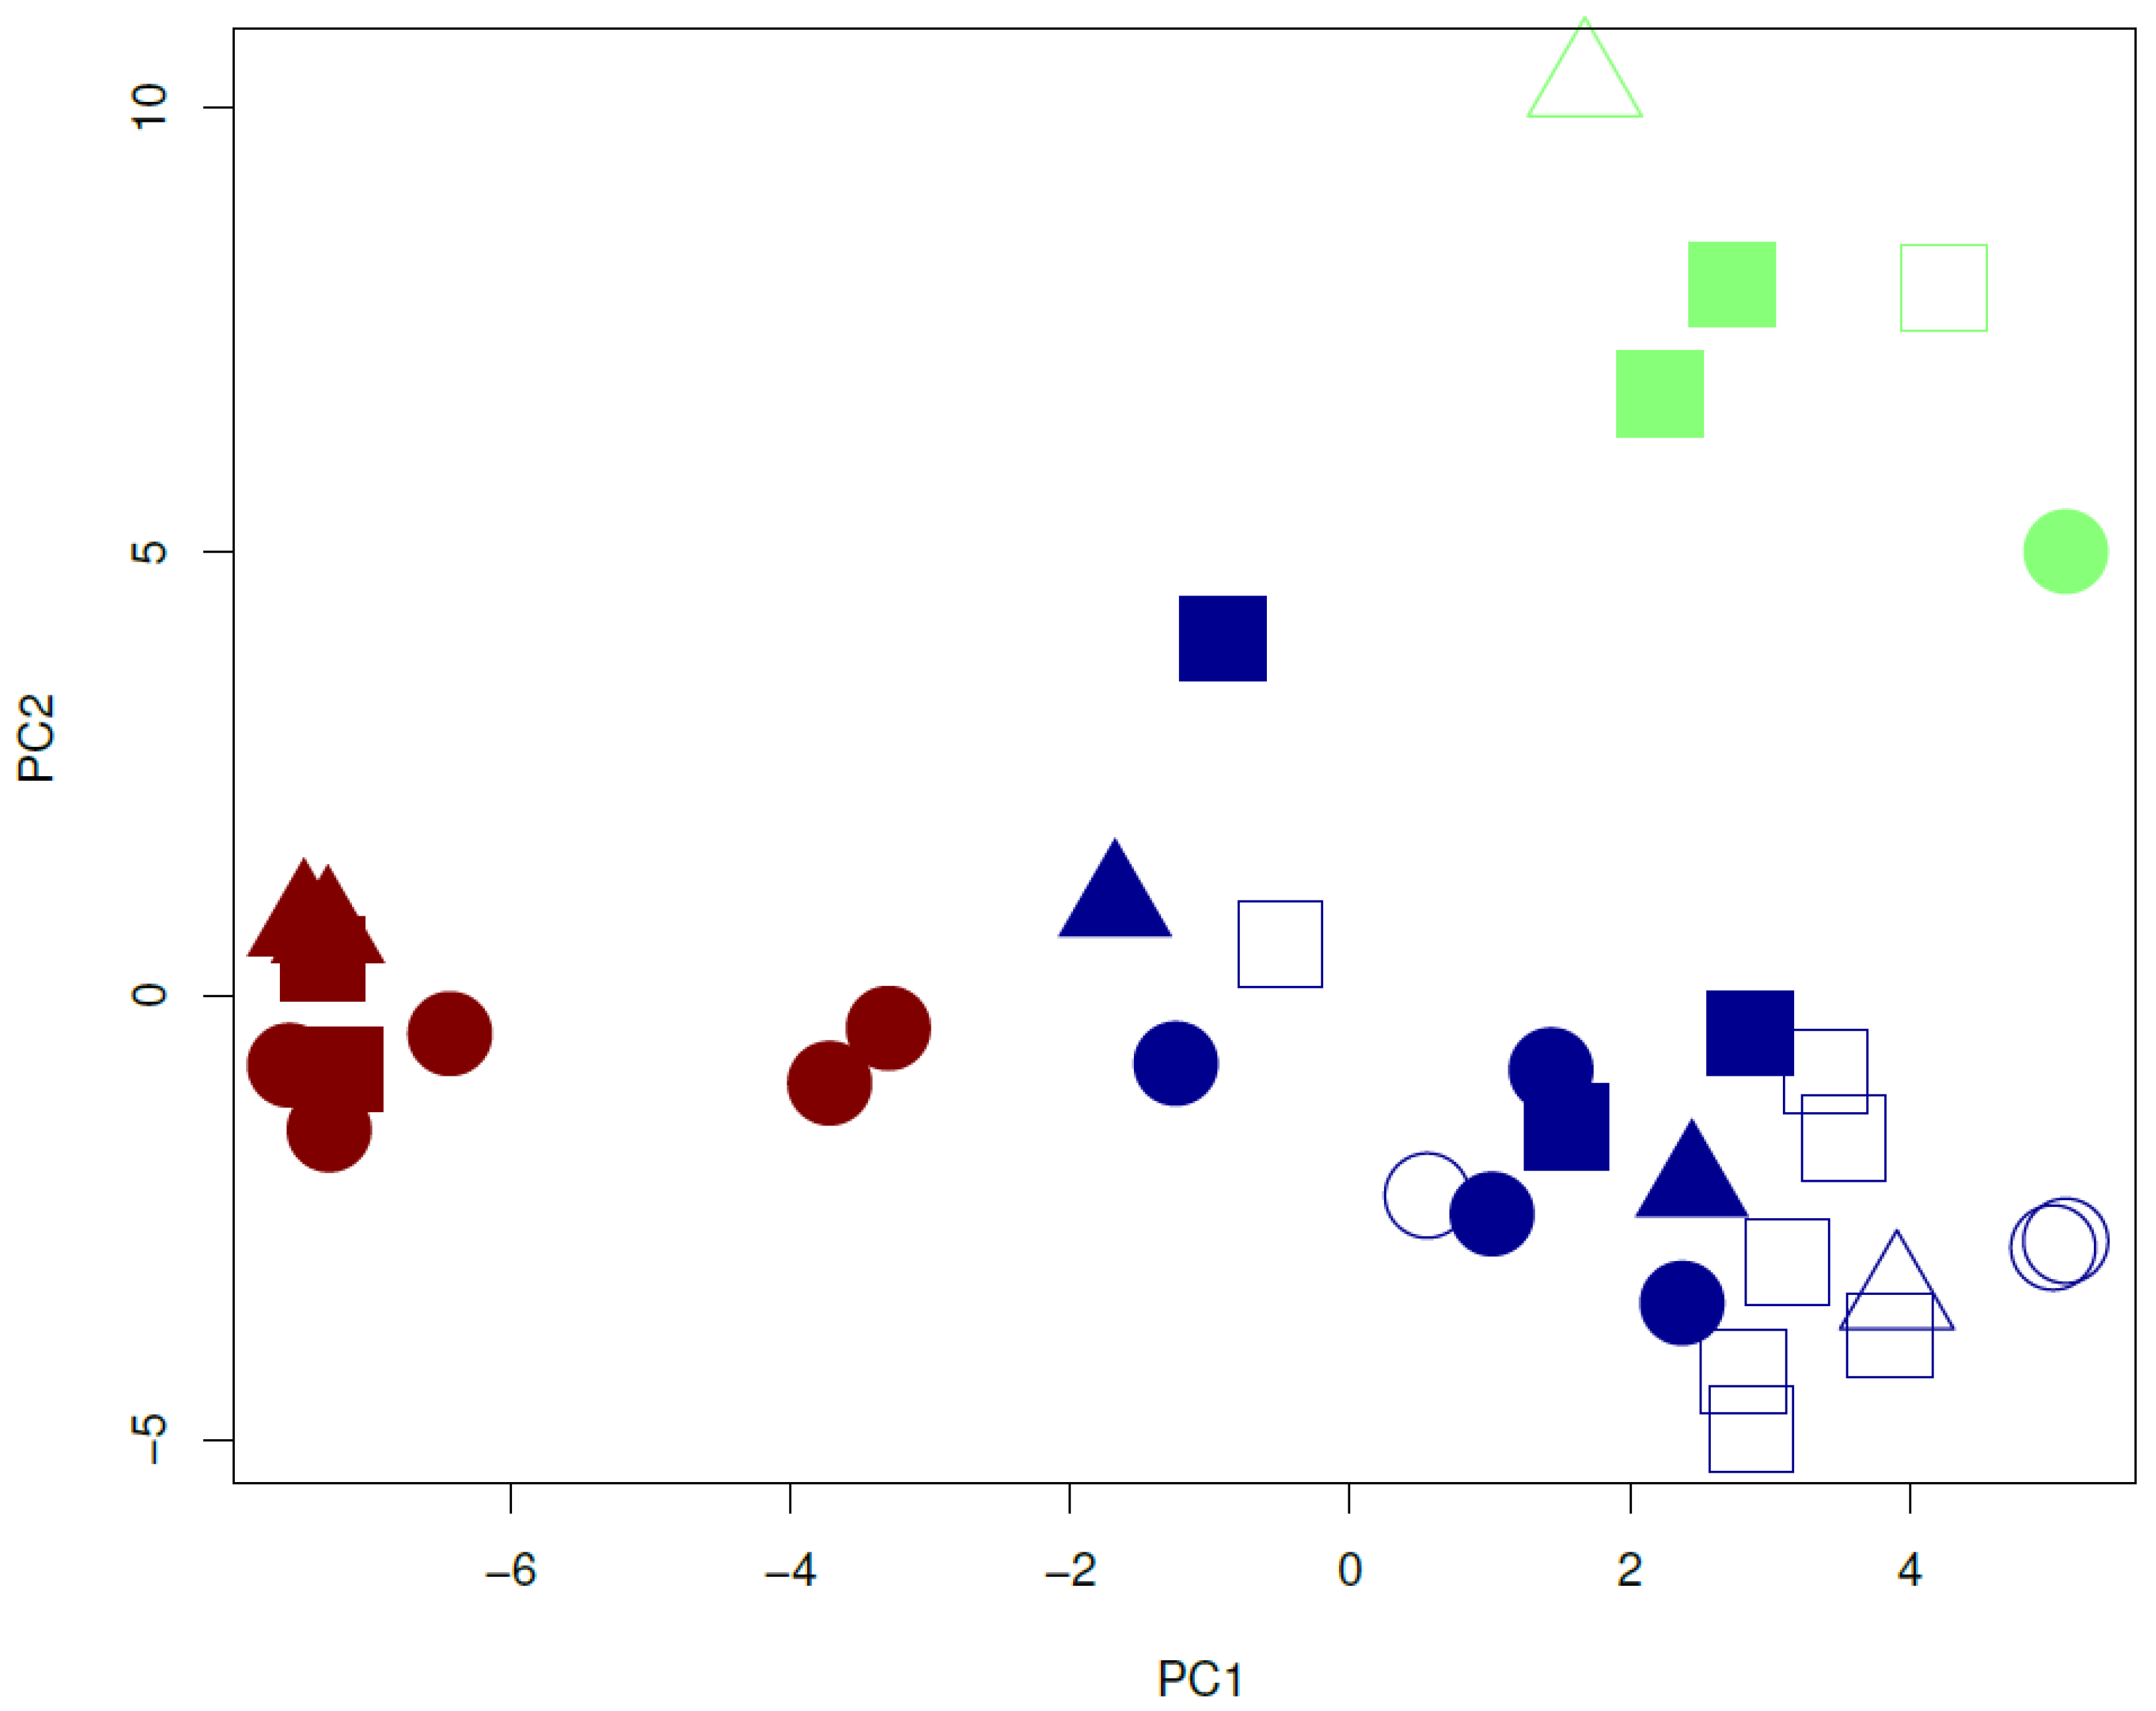
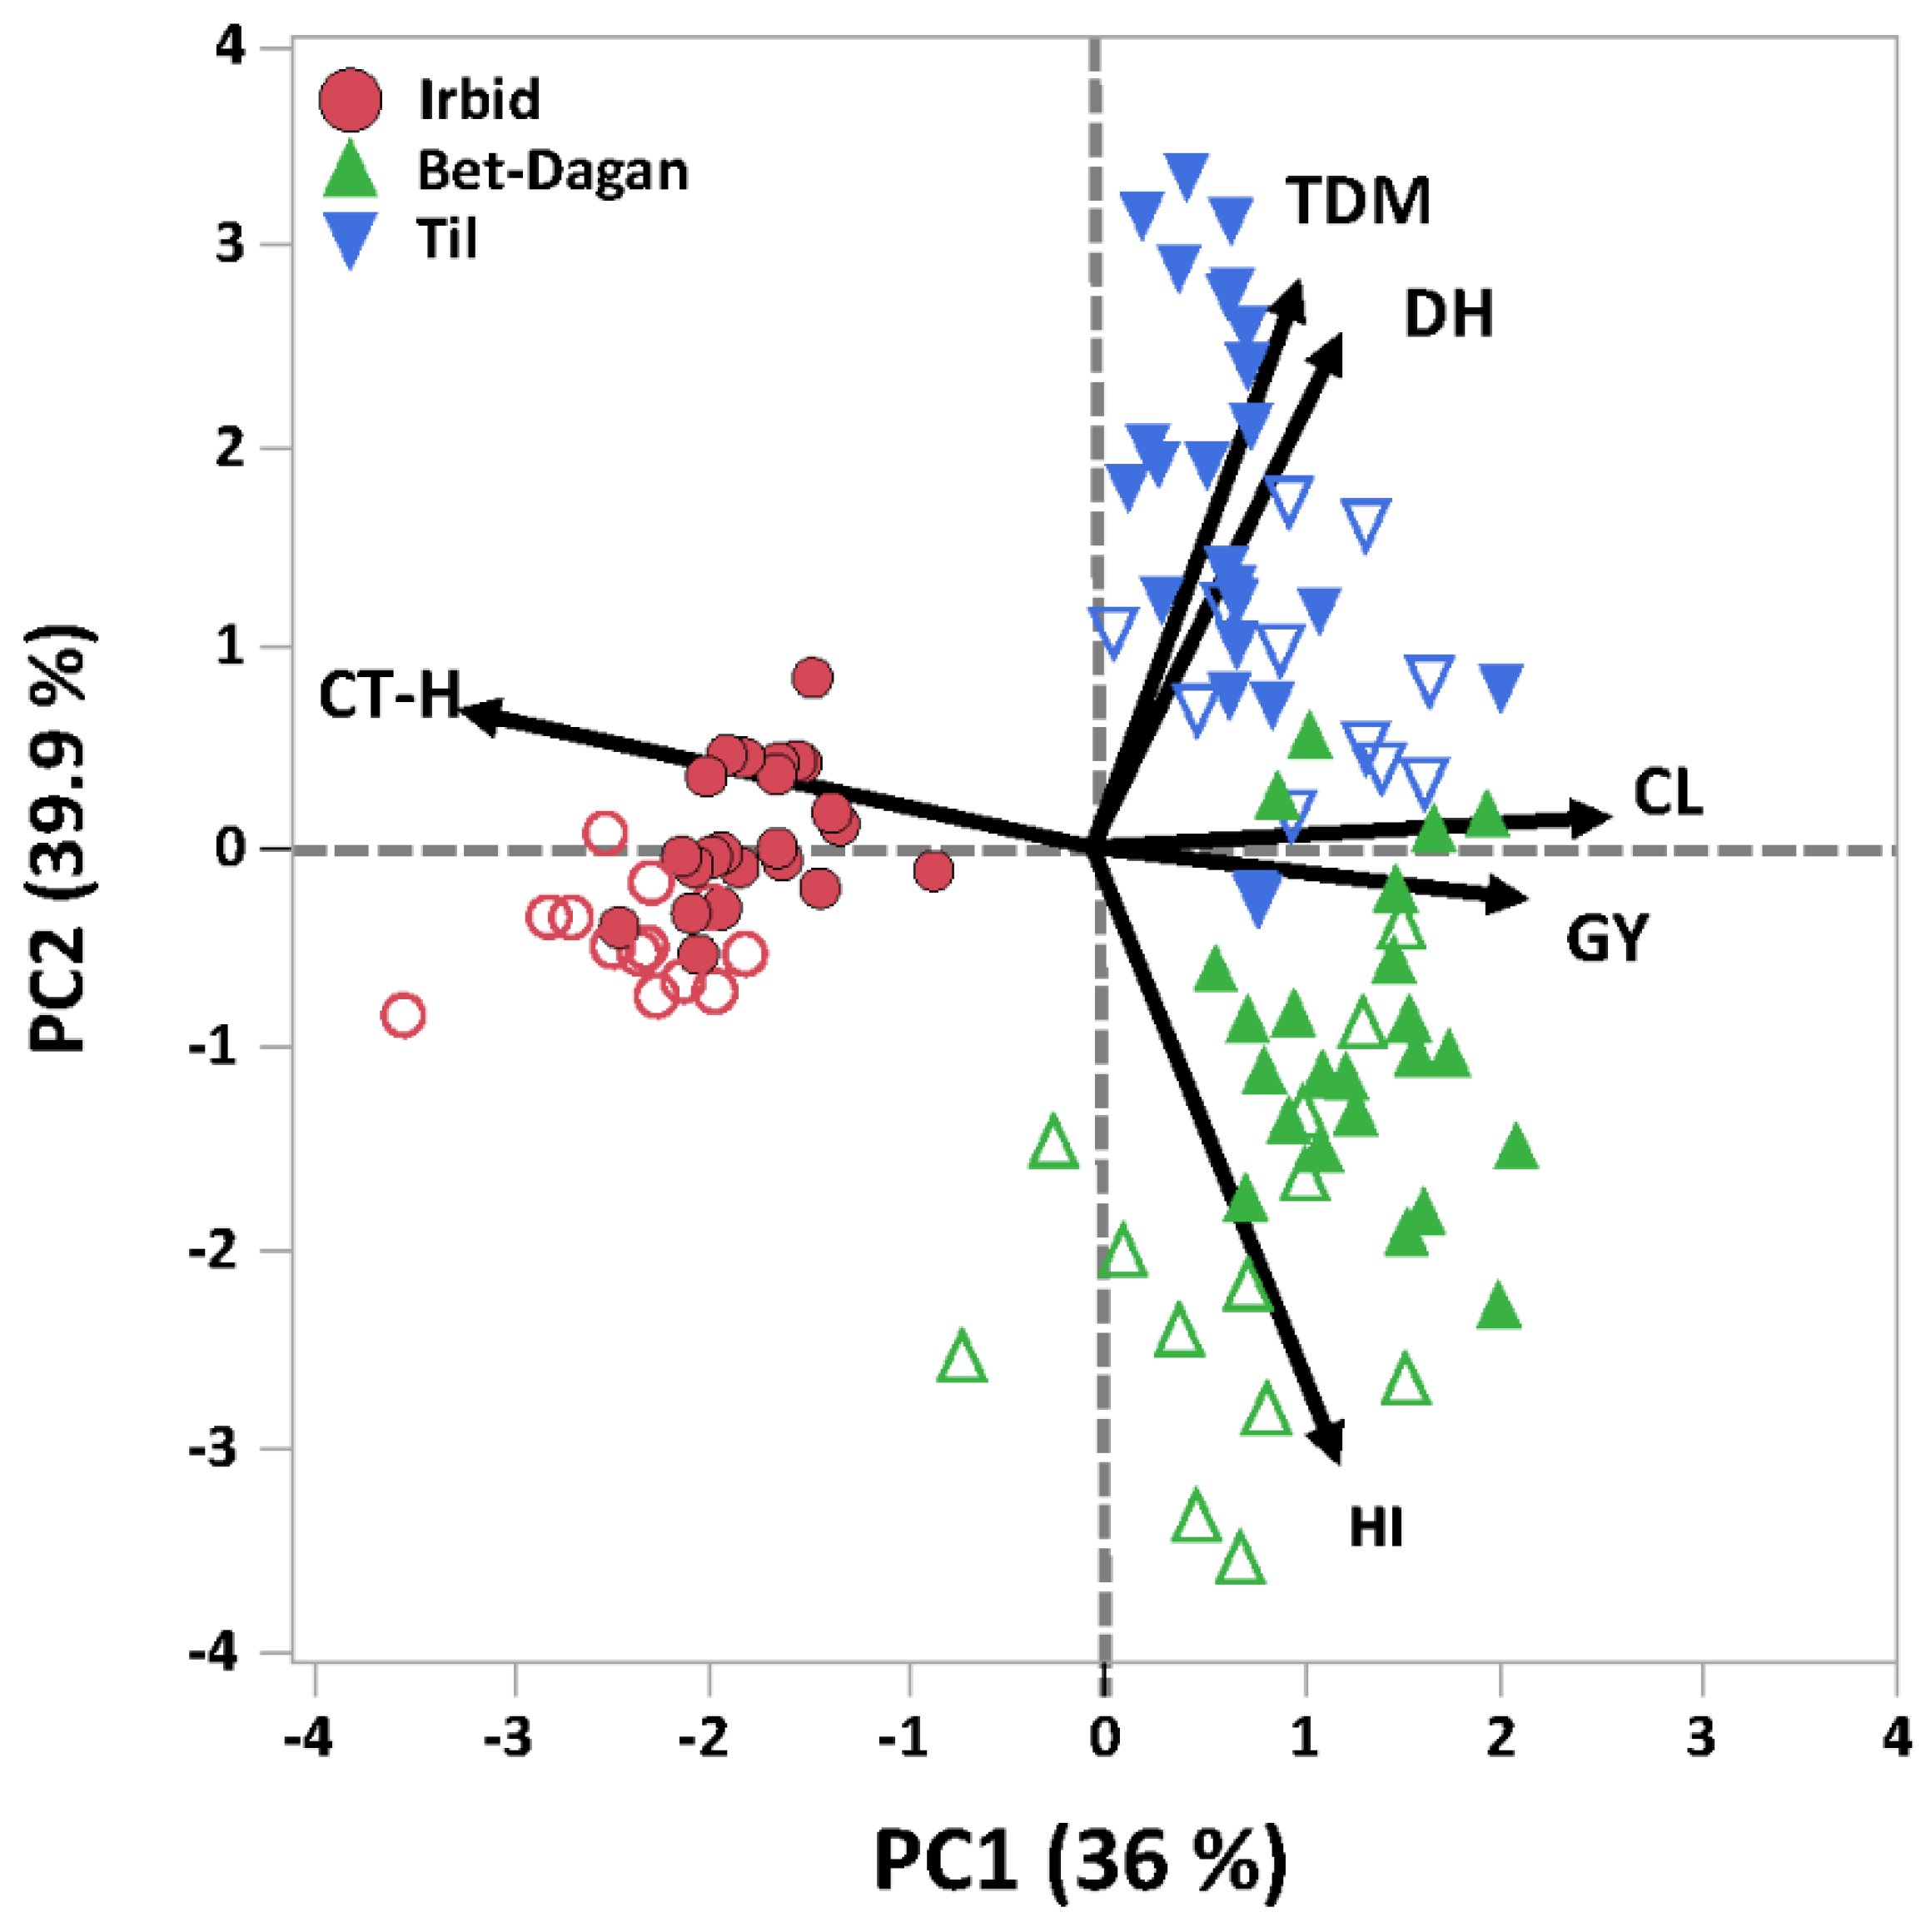
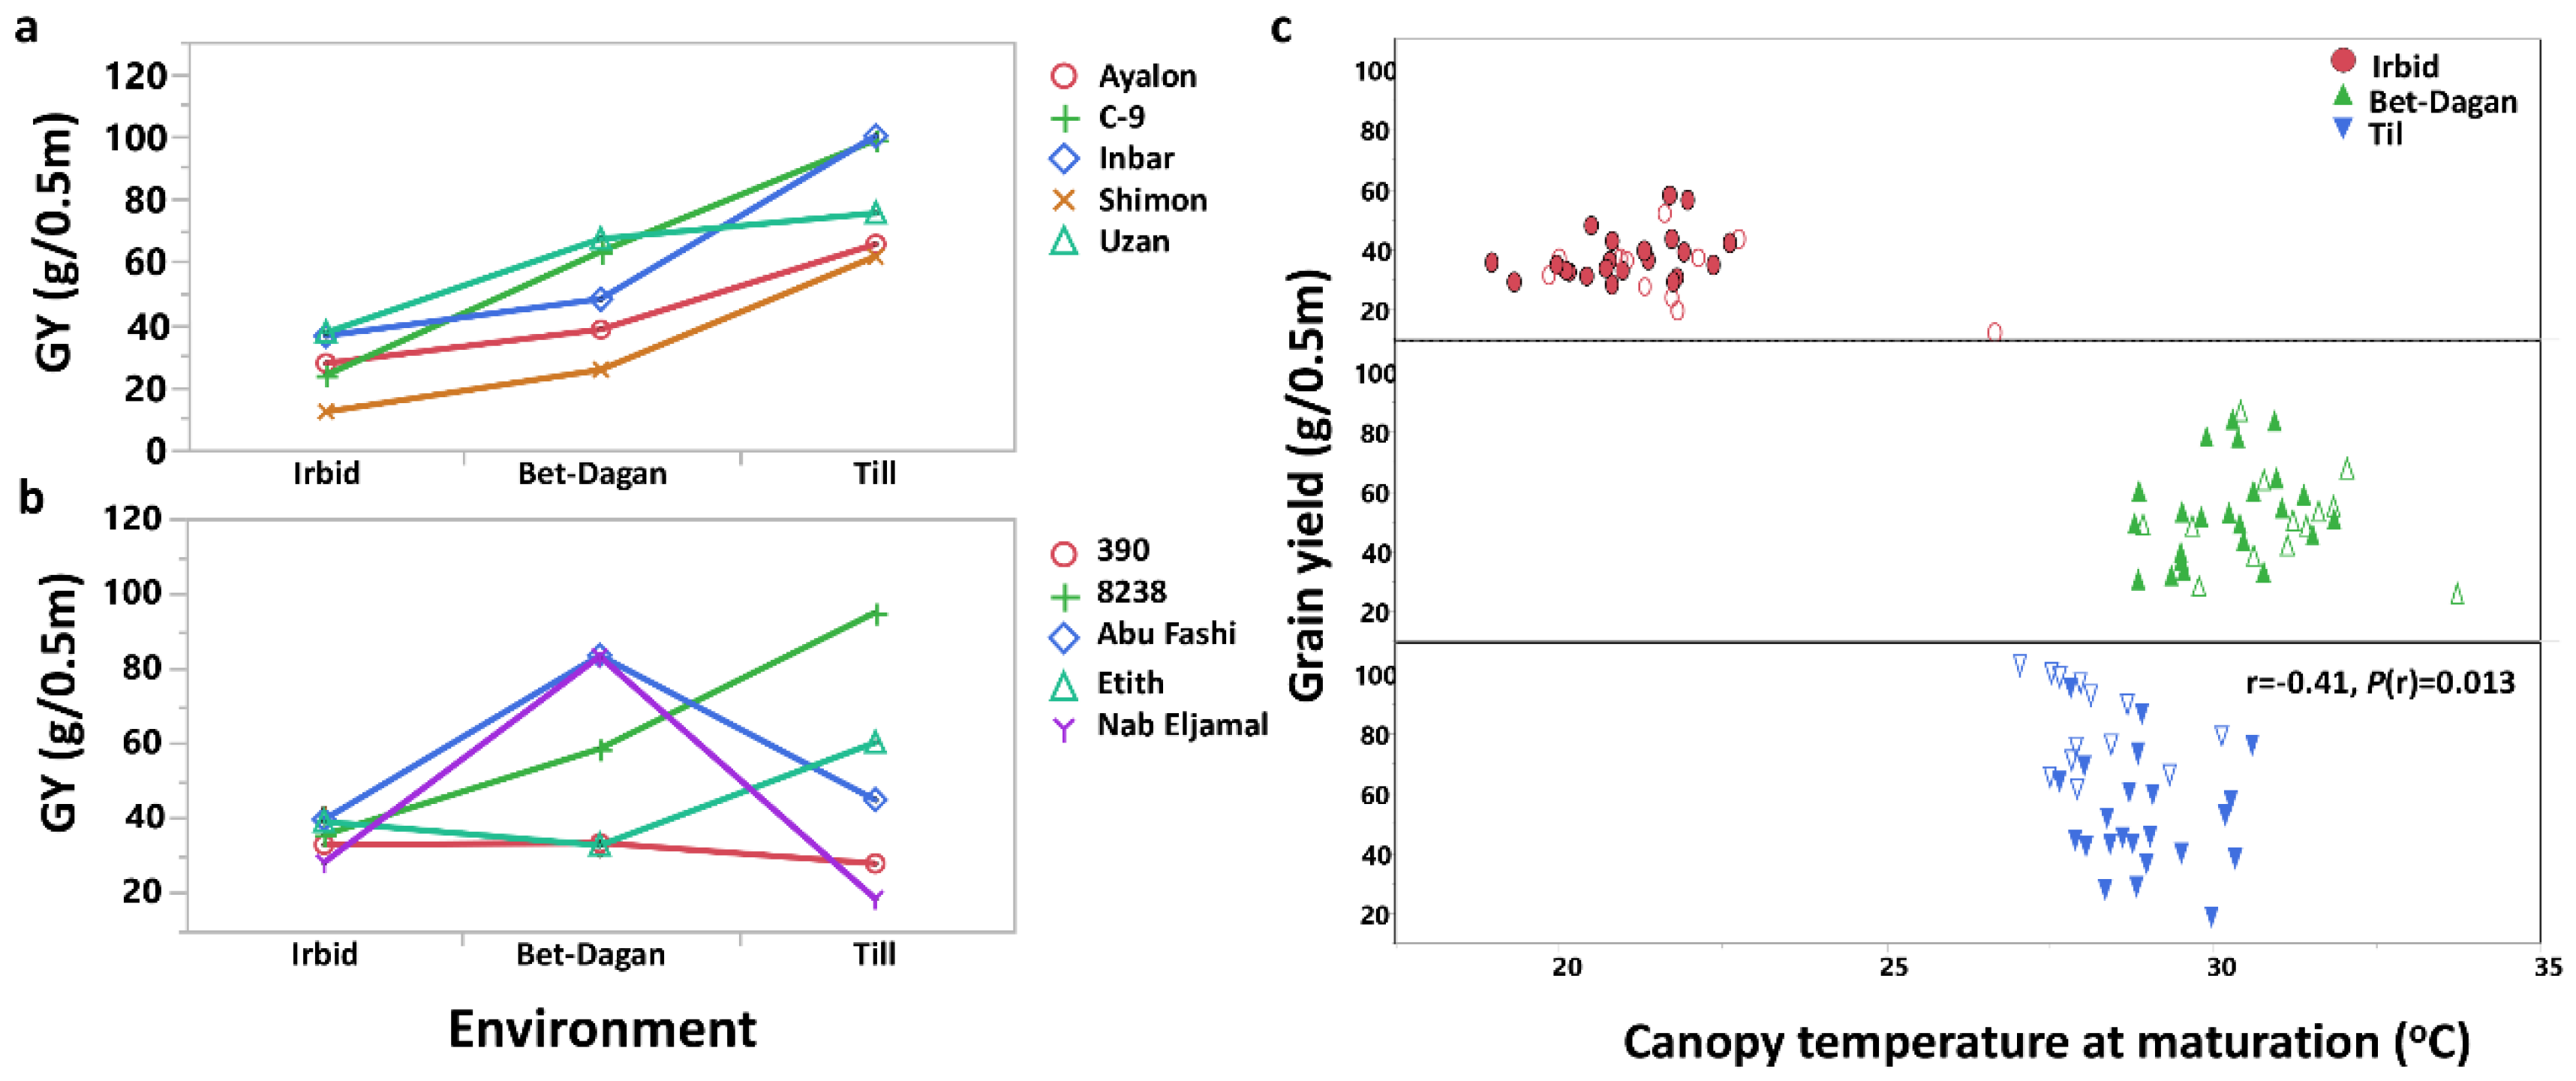
3.4. Dissection of Genotype × Environment Interactions

Analysis of variance showed significant interactions between the genotypes and environments for all traits, except CT-H and HI (Table 2). The linear model was able to explain most of the phenotypic variability (R2 ranging from 0.63 to 0.96; Table 2). The variability in yield-related traits of the landraces is expressed with GY (Figure 4). Five randomly selected durum lines from each group (landraces vs. modern) are presented in a GY Least square mean plot (Figure 4). While clear G × E is visible in both sets, the modern cultivar showed a uniform pattern with higher to lower GY in Til, Bet-Dagan and Irbid, respectively (Figure 4a). On the other hand, the durum landraces set showed a heterotic pattern, line 390 was stable across the three environments with low yield, lines 8238 and Etith showed a similar GY pattern as the modern cultivars exhibiting high GY in the favorable environment compared to the other two environments (Figure 4a,b); Abu Fashi and Nab Eljamal exhibited higher GY in the intermediate environment of Bet-Dagan compared to the other two more extreme environments (Figure 4b).
Genotype × Environment interactions were found for the WheatME lines between yield related traits. For example, a negative correlation was found between canopy temperature at maturation (CT-M) and GY under favorable conditions in Til. Modern cultivars led this trend with lower CT-M and higher GY. No such association was found between the two traits under more stressful conditions at Irbid and Bet-Dagan (Figure 4c). In both environments the modern cultivars were inferior in GY compared to the landraces. The superiority index (SI) trait was calculated for productivity traits (TDM and GY) from all environments. The SI index is used to assess cultivar general superiority for cultivars in multi environmental setups [15]. While SI-GY mean value was significantly higher for the landraces group compared with the modern cultivar group (1965 vs. 1268, respectively), the SI-TDM showed an opposite trend, although was less significant (2728 vs. 4766, respectively; Figure 5).

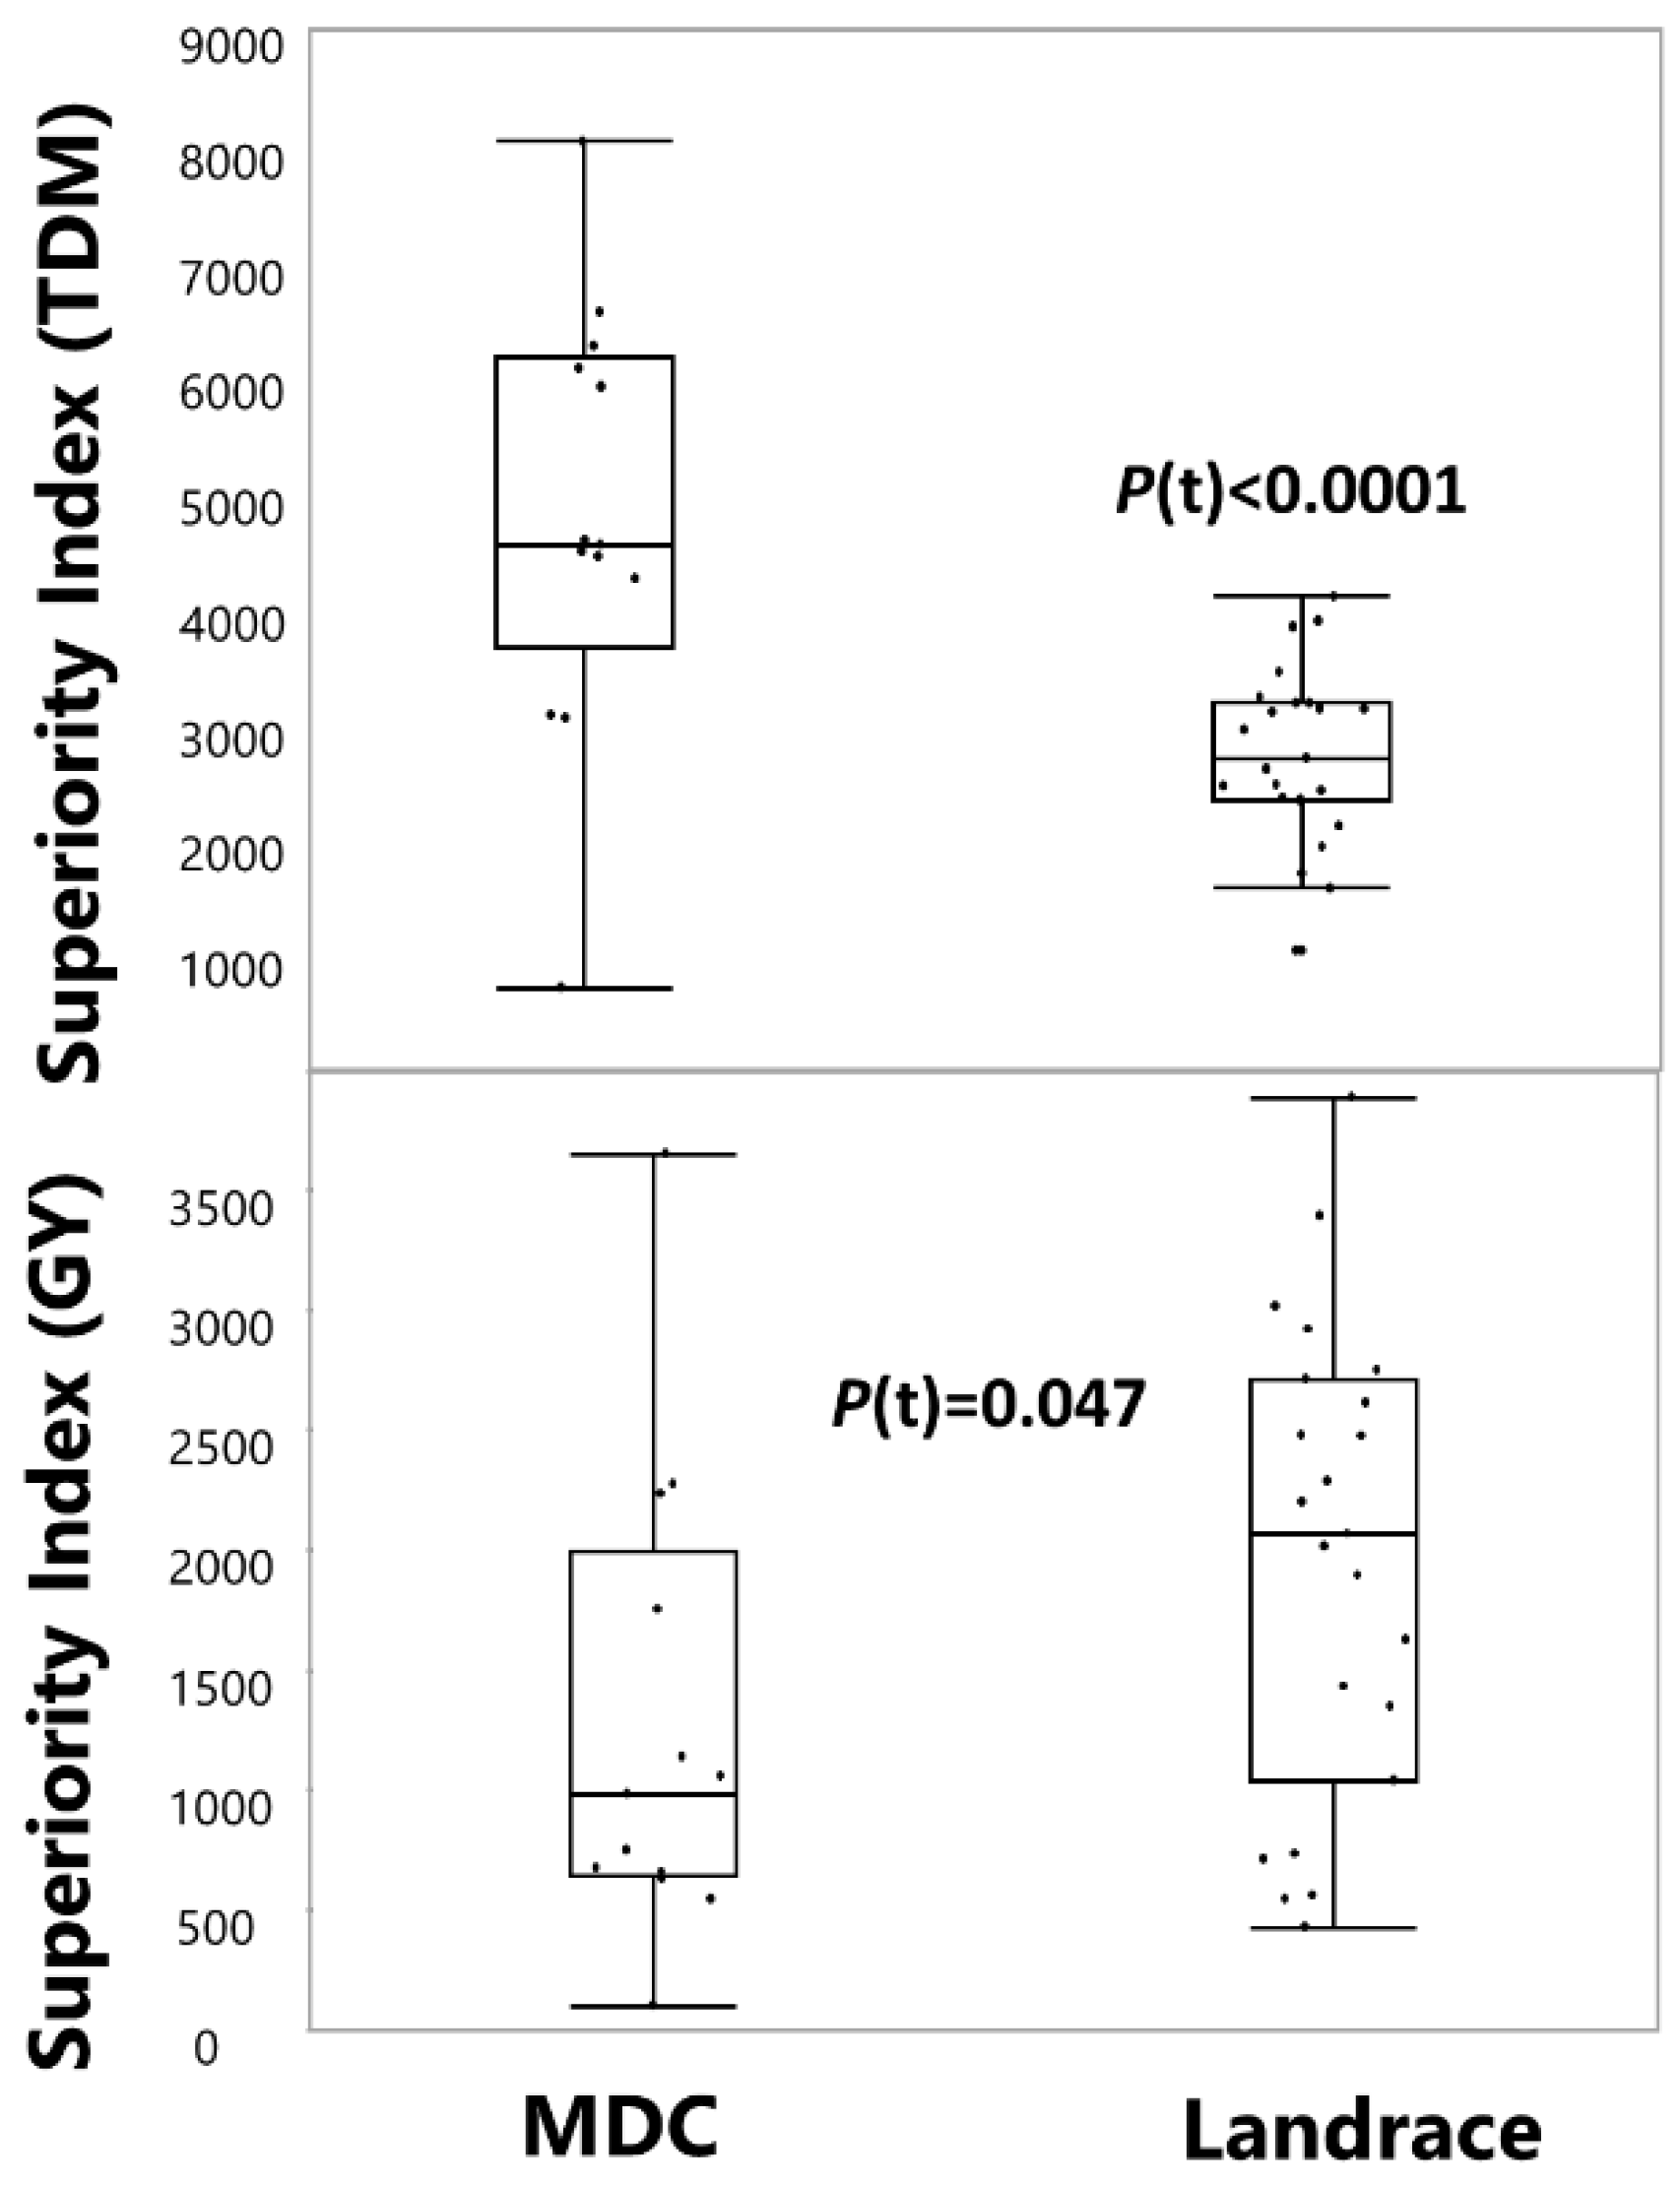
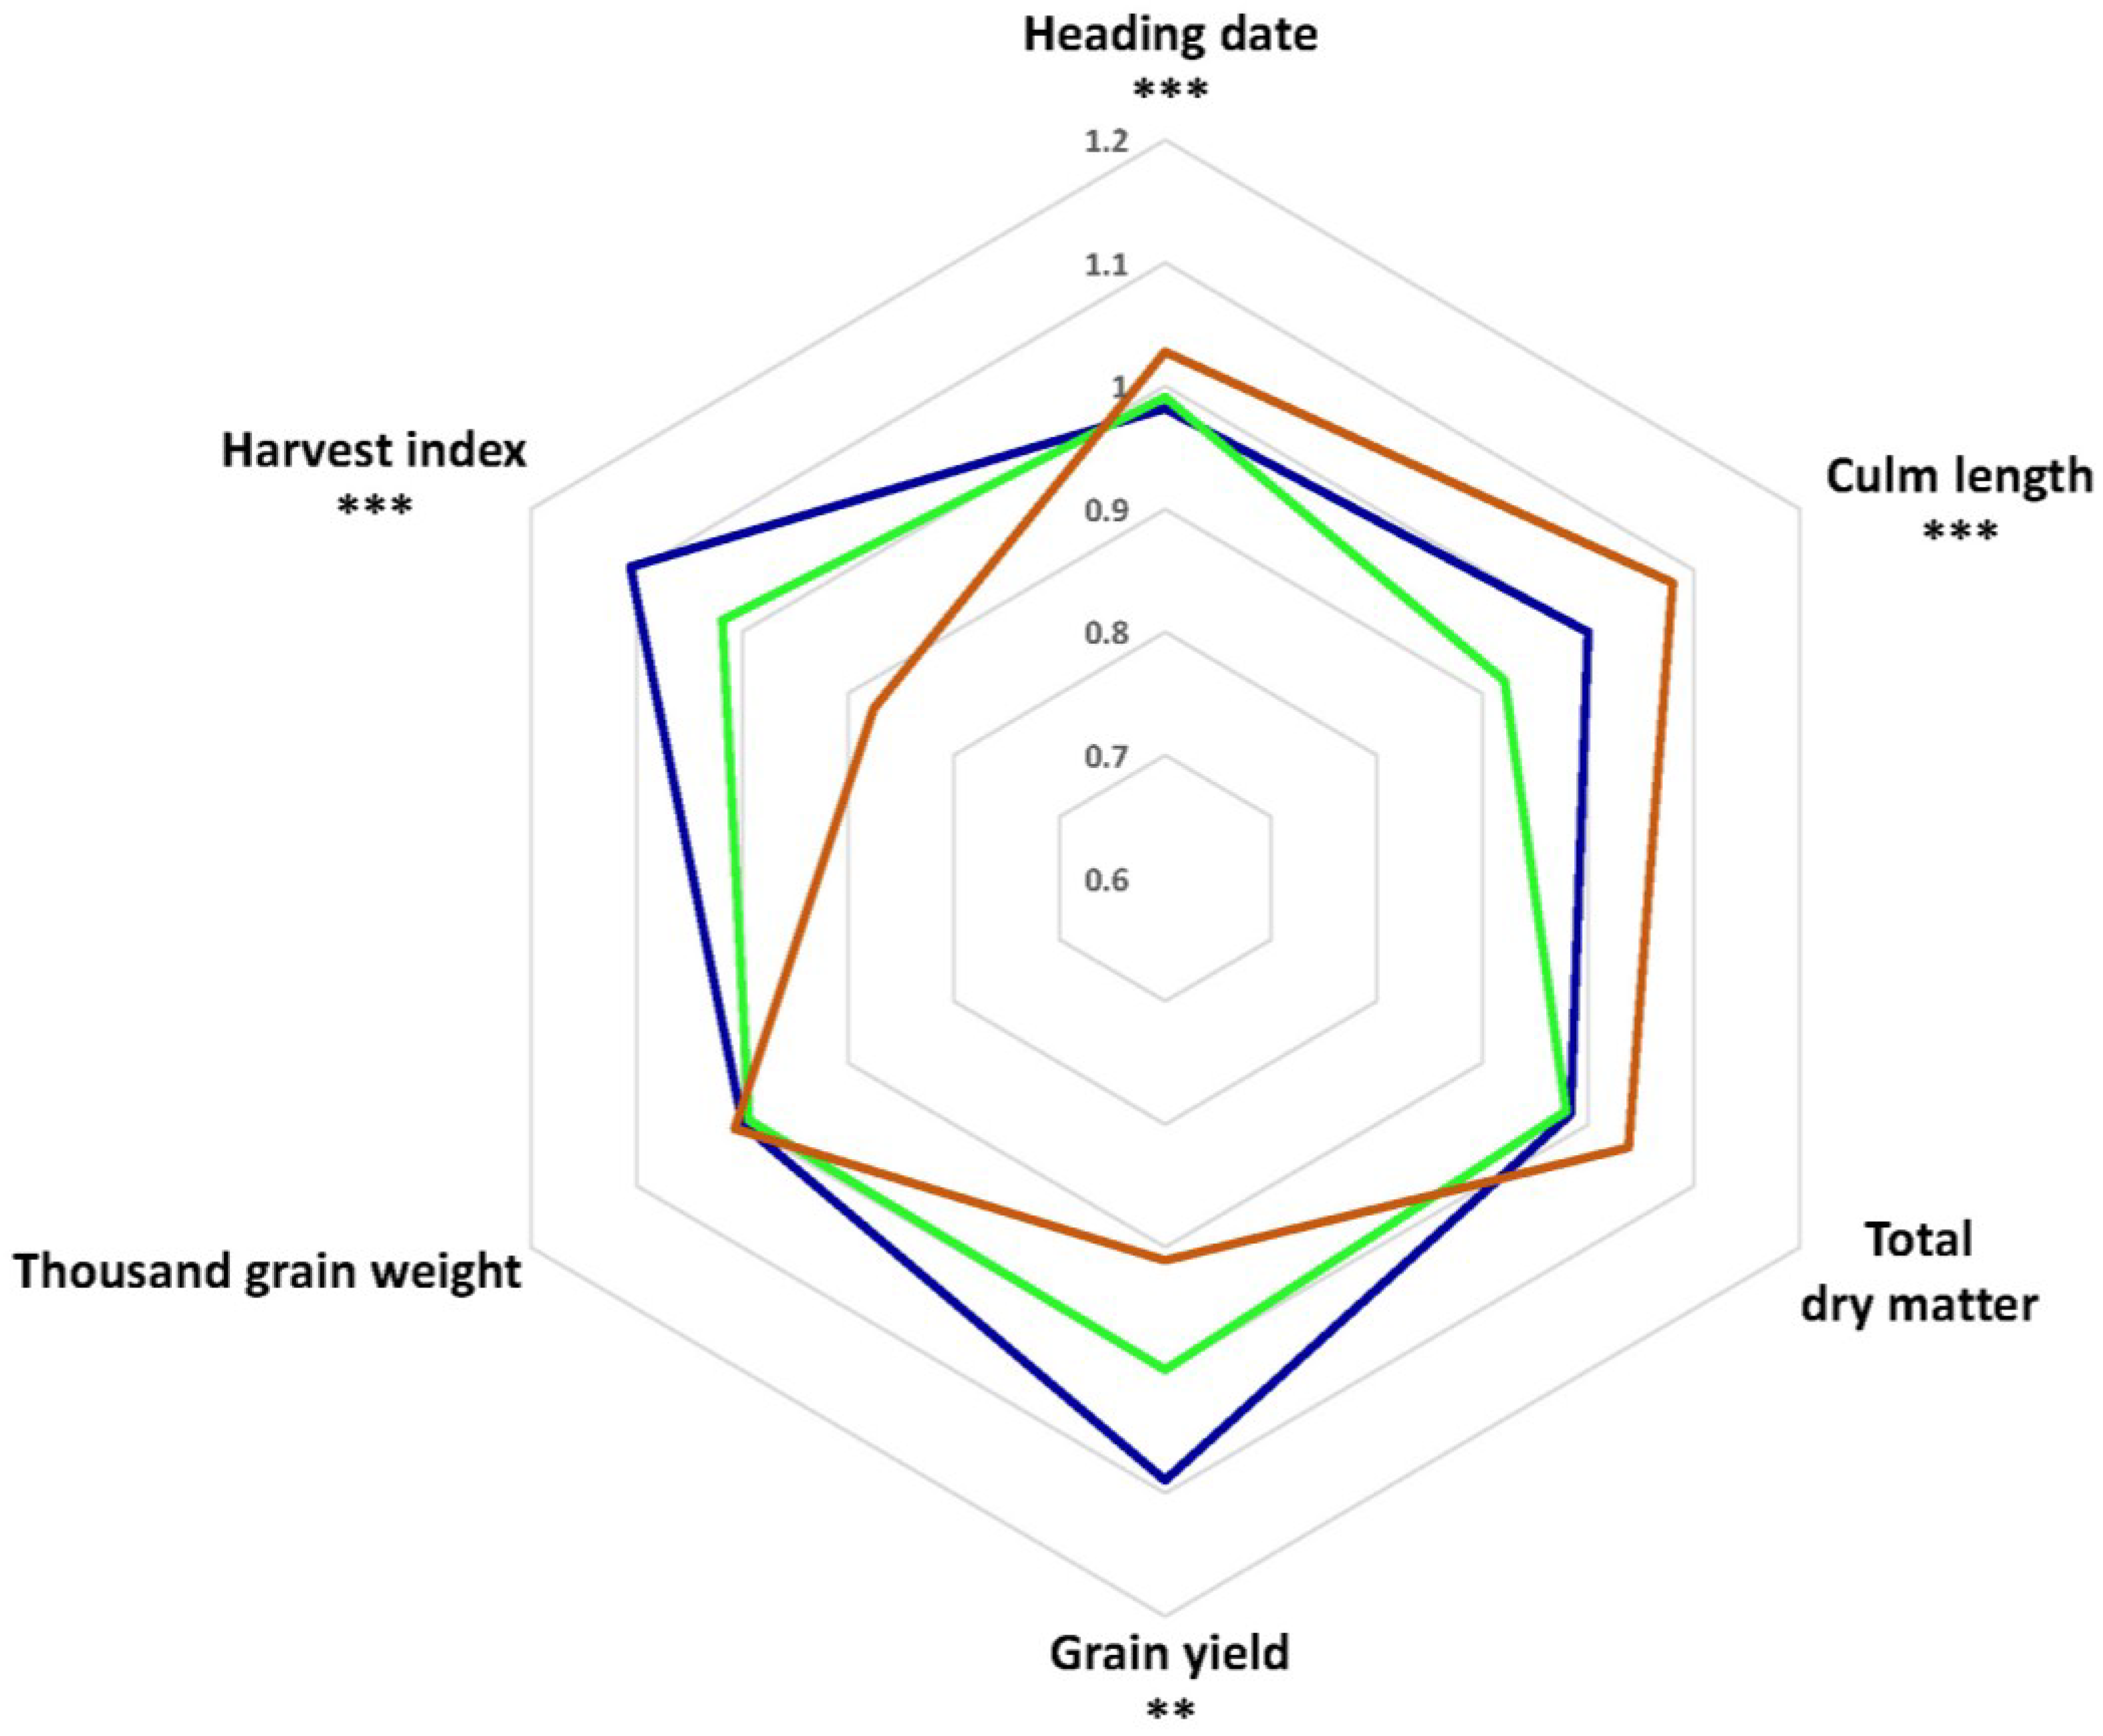
3.5. Phenotypic Variation between Genetic Clusters

The three genetic clusters of the WheatME core-collection (Figure 2), were analyzed for their phenotypic differences. Notably, clusters 1 and 2 significantly differed from cluster 3 in several major traits such as DH, CL, GY and HI (brown line; Figure 6). Cluster 3 had significantly late heading dates and higher plant height, which were expressed in TDM, although unlike the first two traits, they were not statistically significant. Similarly, it was significantly inferior in GY and was expectedly characterized by low HI. It is worth noting that while there were significant differences in yield components between clusters, grain size (TKW) was similar across all clusters.

4. Discussion

To face the challenges of increasing wheat production under projected climate change, wheat breeding requires a comprehensive exploration of potential genetic resources and an in-depth understanding of their underlying environmental adaptations. The landrace gene pool harbors a wide genetic diversity that could be used to enrich the modern wheat genetic repertoire [2,11,19,20,21]. In this study, field-based evaluations and molecular assays were integrated to evaluate and characterize yield-related traits in the core collection of durum wheat landraces from Southern Mediterranean semi-arid climates. The WheatME core-collection showed vast phenotypic and genotypic diversity and agronomic potential of individual lines.

4.1. Characterizing the Genetic Space of the WheatME Core-Collection

Traditionally, most wheat landraces were dynamic, genetically diverse populations containing multiple genotypes, which evolved in equilibrium with environmental stresses, and harbored high phenotypic plasticity, lowering risk of failure and minimized yield fluctuation [22]. In the 20th century, wheat landraces were collected for ex-situ conservation in gene banks, preserving vital biodiversity, but imposing genetic bottlenecks on collected samples. The germplasm used for the current study had a long history of ex-situ conservation, which might explain the high homogeneity of the landraces. In general, only minor phenotypic or morphological variation within samples was noted (Figure 1j).
The WheatME core collection was assembled in an area that was a historical socio-political barrier during the last 70 years. Surprisingly, the genetic analysis showed that the country of origin (i.e., Jordan, Palestine and Israel) did not have any genetic footprint (Figure 2). Thus, we suggest that the results reflect either germplasm, gene transfer, or that the adaptations to similar semi-arid conditions reflect no separation between neighboring countries. The genetic characterization of the “Green-Revolution” genes as markers for modern cultivars revealed that some of the reported landraces carry the RhtB1b gene [23]. This finding suggests that they are modern cultivars which were introduced into the traditional durum fields in Jordan and Palestine. Following Frankin et al. [24], we used the RhtB1b dwarf/null allele which was included in the DWRC KASP panel as a diagnostic tool to separate landraces from modern durum wheat cultivars respectively (Table S1), over the provider’s / genebank data. Remarkably, these landraces carrying the null RhtB1b allele had significantly higher stature compared to the modern cultivars in all three environments (16 cm higher in Irbid and Til and 22 cm higher in Bet-Dagan).
The genetic space of the WheatME core-collection (defined by SNP natural markers) could be separated into three clear genetic clusters. Two of these clusters presented an admixture of landraces and modern cultivars, while only cluster 3 consisted of landraces (Figure 2). Unlike the landraces in the other two clusters, cluster 3 showed low genetic relatedness with modern cultivars and were also characterized by a distinct phenotypic signature (Figure 6). The landraces in cluster 3 were characterized by late phenology and high vegetative productivity and showed a tradeoff with yield-related traits, which was opposite to the other two clusters.

4.2. Multi-Site Agronomic Setup Results in a Stress Gradient and Expose Landraces Agronomic Variability

Our multi-site rain-fed set up enabled us to test the WheatME core-collection across an environmental gradient, which was dominated by water availability. Irbid (Jordan) represents the most drought-prone environment, Bet-Dagan was more moderate in terms of precipitation, Til with higher daily temperatures compared to the other two environments, represents a relatively favorable Mediterranean environment with high precipitations (Table S2). This environmental gradient was also evident in the profound and significant environmental factor in all morpho-physiological and productivity traits (except TKW, Table 1). The stressful sites in Irbid yielded lower GY but had surprisingly higher biomass and resulted in lower HI. This might be explained by the terminal drought effect, which reduces GY after the TDM production has reached its peak.
Phenotypic variability between lines played a major role resulting in dominant G×E interactions. Only two traits were not subjected to a significant G×E interaction (CT-H, CT-M; Table 2). In terms of GY, modern cultivars were superior under favorable conditions, which was accompanied by low canopy temperature at maturation (Figure 4c). Landraces in comparison exhibited higher relative GY both in moderate and stressful environments (Table 1 and Figure 2). However, using the SI-GY we could conclude that modern cultivars represented higher GY stability across all environments. Biomass production is also an important agronomic trait regardless of grain yield. In this region, a large portion of the cereals production is harvested as a forage crop (hay, silage or straw) for the dairy industry. Due to their CL and late DH, the landraces were able to maintain higher biomass production across all sites compared to the MDC (Figure 2). This may open new breeding opportunities to improve biomass production under climate change projections in the Mediterranean Basin.

5. Conclusions and Application for Breeding

Projected climate changes will greatly influence the Middle East region [25,26]. If climate change continues at its current pace, the region is expected to witness a 1–2 °C increase in temperatures by 2030–2050. In terms of water availability, a 4–8% reduction in precipitation expected in the Middle East region in the next 100 years. Together with regional population growth, it is expected to push the Middle East into a water crisis by 2050, with per capita water availability shrinking by half in the most affected regions. Meanwhile, populations in these areas are expected to grow by at least 50%—and possibly double—by 2050 [27]. Water availability in Jordan specifically is set to shrink from 108 m3 to 56 m3 per person per year by 2050 [28].
The genetic bottleneck imposed on wheat throughout early domestication and modern plant breeding has severely eroded their allelic variation, making the modern cultivars increasingly susceptible to environmental stresses. The WheatME core-collection of landraces presented here is a promising source of new genes for improvement of durum and bread wheats to be more resilient to changing environments. Landraces showed higher CV values in 75% of trait × environment combinations (Table 1). While modern cultivars showed higher grain yields in favorable environments and superior SI-GY, they all follow GY reduction gradient as stresses increase (Figure 4a and Figure 5). Landraces on the other hand showed a wider repertoire of phenotypic responses to stress. Some lines followed the dominant pattern of GY reduction, however, some lines showed stable GY production across all conditions, or even higher GY under moderate stress. These selected lines could be easily integrated into regional and local breeding programs by crossing the elite durum cultivars evaluated in this study. This will promote new germplasm that is adapted to rain-fed Mediterranean environments. In addition, a zoom-in approach, which will combine genetics and physiology, could help us better understand identified stress tolerance mechanisms. Moreover, it will provide local breeders new and promising genetic resources in their efforts to enhance durum wheat adaptability to the changing Mediterranean climate.

Supplementary Materials

The following are available online at https://0-www-mdpi-com.brum.beds.ac.uk/2073-4395/8/10/233/s1, Table S1: The WheatME core-collection lines, Table S2: Location, Elevation and climatic data of the three locations in 2015-2016 season, Table S3: List of KASP markers used for genotyping in this study.

Author Contributions

M.S.A.-S., N.A., Z.P., and R.B.-D. designed the experiments; S.Y.A.-Z., O.B.M., M.J.S., S.A., K.N., and N.A. conducted the experiment; S.Y.A.-Z., M.S.A.-S., R.M.J., K.C., R.B.-D., H.S., N.A., and Z.P. analysed data and wrote the paper. All authors read and approved the manuscript.

Funding

This research was funded by the U.S. Agency for International Development Middle East Research and Cooperation (grant #SIS70017GR34037), and Yad-Hanadiv (grant #8435).

Acknowledgments

The authors would like to thank M. Ababnah, Y. Bani Kalf, A. Al-Batainah and R. Hayouka for their excellent technical assistance with the experiments. We also thank M. Gurevitch for proof reading of the manuscript.

Conflicts of Interest

The authors declare no conflict of interest. The funders had no role in the design of the study; in the collection, analyses, or interpretation of data; in the writing of the manuscript, and in the decision to publish the results.

References

  1. Cantrell, R.G. Breeding and genetics of durum wheat. Plant Breed. Rev. 1987, 5, 11–40. [Google Scholar]
  2. Soriano, J.M.; Villegas, D.; Sorrells, M.E.; Royo, C. Durum wheat landraces from east and west regions of the Mediterranean basin are genetically distinct for yield components and phenology. Front. Plant Sci. 2018, 9, 80. [Google Scholar] [CrossRef] [PubMed]
  3. Peleg, Z.; Fahima, T.; Krugman, T.; Abbo, S.; Yakir, D.; Korol, A.B.; Saranga, Y. Genomic dissection of drought resistance in durum wheat x wild emmer wheat recombinant inbreed line population. Plant Cell Environ. 2009, 32, 758–779. [Google Scholar] [CrossRef] [PubMed]
  4. Pecetti, L.; Annicchiarico, P.; Damania, A.B. Biodiversity in a germplasm collection of durum wheat. Euphytica 1992, 60, 229–238. [Google Scholar]
  5. Gale, M.D.; Youssefien, S. Dwarfing genes in wheat. In Progress in Plant Breeding; Russell, G.E., Ed.; Butterworths and Co.: London, UK, 1985; pp. 1–35. [Google Scholar]
  6. Flintham, J.E.; Börner, A.; Worland, A.J.; Gale, M.D. Optimizing wheat grain yield: Effects of Rht (gibberellin-insensitive) dwarfing genes. J. Agric. Sci. 1997, 128, 11–25. [Google Scholar] [CrossRef]
  7. Reynolds, M.; Dreccer, F.; Trethowan, R. Drought-adaptive traits derived from wheat wild relatives and landraces. J. Exp. Bot. 2007, 58, 177–186. [Google Scholar] [CrossRef] [PubMed]
  8. Zeven, A.C. Landraces: A review of definitions and classifications. Euphytica 1998, 104, 127–139. [Google Scholar] [CrossRef]
  9. Mercer, K.L.; Perales, H.R. Evolutionary response of landraces to climate change in centers of crop diversity. Evol. Appl. 2010, 3, 480–493. [Google Scholar] [CrossRef] [PubMed] [Green Version]
  10. Nazco, R.; Villegas, D.; Ammar, K.; Peña, R.J.; Moragues, M.; Royo, C. Can Mediterranean durum wheat landraces contribute to improved grain quality attributes in modern cultivars? Euphytica 2012, 185, 1–17. [Google Scholar] [CrossRef]
  11. Kabbaj, H.; Sall, A.T.; Al-Abdallat, A.; Geleta, M.; Amri, A.; Filali-Maltouf, A.; Belkadi, B.; Ortiz, R.; Bassi, F.M. Genetic diversity within a global panel of durum wheat (Triticum durum) landraces and modern germplasm reveals the history of alleles exchange. Front. Plant Sci. 2017, 8, 1277. [Google Scholar] [CrossRef] [PubMed]
  12. WheatME: Improve Wheat Production under Climate Changes in the Middle East Region. Available online: http://wheatme.wixsite.com/wheatme (accessed on 19 October 2018).
  13. The Durum Wheat Reference Collection KASP Markers (DWRC). Available online: http://www.cerealsdb.uk.net/cerealgenomics/CerealsDB/wheat_durum_ref.php (accessed on 19 October 2018).
  14. Zadoks, J.C.; Chang, T.T.; Konzak, C.F. A decimal code for the growth stages of cereals. Weed Res. 1974, 14, 415–421. [Google Scholar] [CrossRef]
  15. Pask, A.J.D.; Pietragalla, J.; Mullan, D.M.; Reynolds, M.P. Physiological Breeding II: A Field Guide to Wheat Phenotyping; Cimmyt: Edo Mex, Mexico, 2012. [Google Scholar]
  16. Jombart, T. Adegenet: An R package for the multivariate analysis of genetic markers. Bioinformatics 2008, 24, 1403–1405. [Google Scholar] [CrossRef] [PubMed]
  17. Paradis, E.; Claude, J.; Strimmer, K. Ape: Analyses of phylogenetics and evolution in R language. Bioinformatics 2004, 20, 289–290. [Google Scholar] [CrossRef] [PubMed]
  18. Lin, C.S.; Binns, M.R. A superiority measure of cultivar performance for cultivar × location data. Can. J. Plant Sci. 1988, 68, 193–198. [Google Scholar] [CrossRef]
  19. Ben-David, R.; Amram, A.; Nashef, K. Genetic improvement of durum wheat establishment under fluctuating environmental conditions. In Proceedings of the International Symposium on Genetics and Breeding of Durum Wheat; Porceddu, E., Qualset, C.O., Damania, A.B., Eds.; CIHEAM: Bari, Italy, 2014; Volume 110, pp. 147–149. [Google Scholar]
  20. Blum, A.; Golan, G.; Mayer, J.; Sinmena, B.; Shpiler, L.; Burra, J. The drought response of landraces of wheat from the northern Negev desert in Israel. Euphytica 1989, 43, 87–96. [Google Scholar] [CrossRef]
  21. Dotlačil, L.; Hermuth, J.; Stehno, Z.; Dvořáček, V.; Bradová, J.; Leišová, L. How can wheat landraces contribute to present breeding? Czech J. Genet. Plant Breed. 2010, 46, S70–S74. [Google Scholar] [CrossRef] [Green Version]
  22. Ceccarelli, S. Landraces: Importance and use in breeding and environmentally friendly agronomic system. In Agrobiodiversity Conservation: Securing the Diversity of Crop Wild Relatives and Landraces; Maxted, N., Ehsan Dulloo, M., Ford-Lloyd, B.V., Frese, L., Iriondo, J.M., Pinheiro de Carvalho, M.A.A., Eds.; CABI: Wallingford, UK, 2012. [Google Scholar]
  23. Austin, R.B.; Bingham, J.; Blackwell, R.D.; Evans, L.T.; Ford, M.A.; Morgan, C.L.; Taylor, M. Genetic improvements in winter wheat yields since 1900 and associated physiological changes. J. Agric. Sci. 1980, 94, 675–689. [Google Scholar] [CrossRef]
  24. Franking, S.; Srinivas, K.; Sela, S.; Goldberg, B.Z.; Mayzlish-Gati, E.; Ben-David, R. What’s in a landrace? A case study on the impact of conservation on intra-accession diversity and retention of genetic and phenotypic traits. In Proceedings of the 1st International Conference of Wheat Landraces for Healthy Food Systems, Bologna, Italy, 13–15 June 2018. [Google Scholar]
  25. Nelson, G.C.; Rosegrant, M.W.; Koo, J.; Robertson, R.; Sulser, T.; Zhu, T.; Ringler, C.; Msangi, S.; Palazzo, A.; Batka, M.; et al. Climate Change: Impact on Agriculture and Costs of Adaptation; International Food Policy Research Institute: Washington, DC, USA, 2009. [Google Scholar]
  26. IPPC. Impacts, Adaptation and Vulnerability. Contribution of Working Group II to the Fourth Assessment Report of the IPCC; IPPC: Geneva, Switzerland, 2007; p. 104. [Google Scholar]
  27. Perkins, S. Middle East faces a thirstier future. Nat. Clim. Chang. 2011, 1, 236. [Google Scholar] [CrossRef]
  28. Chenoweth, J.; Hadjinicolaou, P.; Bruggeman, A.; Lelieveld, J.; Levin, Z.; Lange, M.A.; Xoplaki, E.; Hadjikakou, M. Impact of climate change on the water resources of the eastern Mediterranean and Middle East region: Modeled 21st century changes and implications. Water Resour. Res. 2011, 47, W06506. [Google Scholar] [CrossRef]
Figure 1. Spike morphological diversity among the WheatME core-collection. (a) Hittia Bida, (b) Hittia Safra, (c) Palestine 3, (d) 391, (e) Nab Eljamal, (f) 8, (g) Um Qais, (h) Zenati Bouteille, (i) Gaza, and (j) Hittia Soada. Plants were grown at the Bet-Dagan site.
Agronomy 08 00233 g001
Figure 2. PCoA analysis of the 34 Jordanian (triangle), Israeli (square) and Palestinian (circle) wheatME core-collection, based on 84 KASP marker SNP data (DWRC assay). Modern wheat cultivars (open symbols) and landraces (solid symbols). Clusters 1, 2 and 3 are marked with blue, green and brown, respectively.
Agronomy 08 00233 g002
Figure 3. Principal components analysis (based on correlation matrix) of agronomic traits in 36 WheatME core-collection lines under three environments: Bet-Dagan, Irbid and Til. Modern wheat cultivars (open symbols) and landraces (solid symbols). Biplot vectors are trait factor loadings for PC1 and PC2. Canopy temperature at heading (CT-H), heading date (DH), culm length (CL), total dry matter (TDM), grain yield (GY), and harvest index (HI).
Agronomy 08 00233 g003
Figure 4. Grain yield (GY) of five randomly selected (a) modern durum wheat cultivars and (b) landraces, under three environments: Irbid, Bet-Dagan and Til. (c) Correlation between canopy temperature at maturation and Grain yield under three environments Irbid (red circles), Bet-Dagan (green upraise triangle), and Til (blue triangles). Correlation coefficient and its probability is indicated in case of significance. Modern durum wheat cultivars (open symbols) and the landraces (solid symbols) are marked.
Agronomy 08 00233 g004
Figure 5. Box plot of superiority index for (a) total dry matter (TDM), and (b) grain yield (GY) under three environments (Irbid, Bet-Dagan and Til). Comparison between the landrace group (n = 23) and the modern durum cultivars (MDC) group (n = 13) within the WheatME core-collection using Student’s t-test.
Agronomy 08 00233 g005
Figure 6. Radar charts comparing the phenotypic and yield component traits of the three genetic clusters: 1 (blue), 2 (green), and 3 (brown). Data was analyzed using one-way ANOVA. **, and *** indicate significance at P < 0.01, and 0.001, respectively.
Agronomy 08 00233 g006
Table 1. Summary of the mean performance and coefficient of variation (CV) for the agronomic traits: chlorophyll content at heading (Chl), canopy temperature at heading (CT-H) and during maturation (CT-M), heading date (DH), culm length (CL), total dry matter (TDM), grain yield (GY), thousand kernel weight (TKW) and harvest index (HI), for both modern durum cultivars (MDC) and landraces WheatME core-collection lines.
TraitTypeIrbidBet-DaganTil
Mean ± SERangeCVMean ± SERangeCVMean ± SERangeCV
Chl (SPAD units)MDC52.6 ± 0.49.14.948.6 ± 1.024.912.553.1 ± 0.821.99.8
Landraces49.8 ± 0.620.29.646.3 ± 0.828.714.049.5 ± 0.831.413.0
CT-H (°C)MDC29.3 ± 0.25.14.317.7 ± 0.24.88.220.8 ± 0.25.96.7
Landraces29.3 ± 0.27.35.117.3 ± 0.15.06.321.5 ± 0.14.55.2
CT-M (°C)MDC21.7 ± 0.38.79.431.0 ± 0.49.67.628.2 ± 0.37.65.6
Landraces21.0 ± 0.26.37.030.2 ± 0.27.76.328.9 ± 0.29.36.3
DH (days)MDC77.1 ± 0.513.03.879.2 ± 1.665.012.484.8 ± 1.129.08.2
Landraces81.0 ± 0.523.05.483.5 ± 0.935.09.192.0 ± 0.921.08.3
CL (cm)MDC53.1 ± 1.444.016.787.1 ± 3.277.022.775.4 ± 1.031.38.6
Landraces69.0 ± 1.448.016.6109.8 ± 2.788.020.491.8 ± 1.467.713.0
TDM (g)MDC78.8 ± 3.3111.826.457.6 ± 4.2107.038.3182.9 ± 4.8215.716.4
Landraces96.9 ± 2.2104.219.181.2 ± 3.196.027.7178.8 ± 1.9107.68.8
GY (g)MDC32.6 ± 1.849.634.548.9 ± 3.6112.945.082.6 ± 2.967.922.1
Landraces37.5 ± 1.148.124.252.3 ± 2.6128.341.051.9 ± 2.6100.441.2
TKW (g)MDC36.2 ± 1.231.021.336.3 ± 1.353.322.940.1 ± 1.131.816.2
Landraces39.8 ± 0.832.415.939.4 ± 0.830.617.240.1 ± 1.040.820.3
HIMDC0.3 ± 00.111.80.5 ± 00.525.50.3 ± 00.317.0
Landraces0.3 ± 00.110.70.4 ± 00.425.60.2 ± 00.434.2
Table 2. Analyses of variance for the effects of genotype and environments, as well as their interactions on the WheatME core-collection for the agronomic traits: chlorophyll content at heading (Chl), canopy temperature at heading (CT-H) and during maturation (CT-M), heading date (DH), culm length (CL), total dry matter (TDM), grain yield (GY), thousand kernel weight (TKW) and harvest index (HI).
Source of Varianced.f. 1Mean Square
ChlCT-HCT-MDHCLTDMGYTKWHI
Environment (E)2490.5
***
3982.4
***
2586.1
***
2845.2
***
40233.1
***
33,0092.0
***
20,340.5
***
96.4
***
0.722
***
Genotype (G)35103.2
***
1.9
4.1
223.2
***
1636.2
***
918.9
***
1007.3
***
128.4
***
0.010
***
G × E7037.4
***
1.5
n.s.
3.3
n.s.
75.7
***
262.7
***
649.6
**
742.4
***
99.9
***
0.008
***
R2 0.630.960.880.820.880.910.770.720.82
1 degree of freedom. **, *** and n.s. indicate significance at P < 0.01, 0.001 or non-significant effect, respectively.

