Article

Genome Resequencing Reveals Genetic Variation between the Parents of An Elite Hybrid Upland Cotton

1
College of Agriculture, Yangtze University, Jingzhou 434025, China
2
State Key Laboratory of Cotton Biology, Institute of Cotton Research of Chinese Academy of Agricultural Sciences, Anyang 455000, China
*
Authors to whom correspondence should be addressed.
These authors contributed equally to this work.
Submission received: 23 November 2018 / Revised: 14 December 2018 / Accepted: 14 December 2018 / Published: 17 December 2018
(This article belongs to the Special Issue Cotton Breeding, Genetics and Genomics)

Abstract

:
Cotton is one of the most important economic crops worldwide. As the global demands rising, cotton yield improvement is the most important goal of cotton breeding. Hybrids have great potential for increasing yield, however, the genetic mechanism of hybrids is still not clear. To investigate the genetic basis of cotton hybrids, we resequenced 9053 and sGK9708 with 62.13x coverage depth, the parents of the elite hybrid cotton CCRI63 that has obvious heterosis in lint percentage (LP) and boll weight (BW). Based on the cotton reference genome (TM-1), 1,287,661 single nucleotide polymorphisms (SNPs) and 152,479 insertions/deletions (InDels) were identified in 9053, and 1,482,784 SNPs and 152,985 InDels in sGK9708. Among them, 8649 SNPs and 629 InDels in the gene coding regions showed polymorphism between parents. Moreover, these variations involved 5092 genes, and 3835 of these genes were divided into 10 clusters based on the gene expression profiles. The genes in Cluster 3 and 7 were specifically expressed in the ovule and fiber development stage, suggesting that they might relate to LP and BW. We further co-localized the polymorphic SNPs and InDels with the reported quantitative trait loci (QTLs) of LP and BW, and identified 68 genes containing the polymorphic SNPs or InDels within these QTL intervals and as being related to fiber development. This suggested that the outstanding traits of CCRI63 such as LP and BW might be generated by accumulating the favorable variations from the parents. The results generated herein provide a genetic basis for cotton hybrids and genetic markers for marker-assisted selection breeding of cotton.

1. Introduction

Cotton is an important economic crop worldwide and cotton fiber is an important natural textile fiber [1]. The cultivated species, Gossypium hirsutum L., which is also known as upland cotton, has high yield, excellent quality, and wide adaptability characteristics, and therefore constitutes about 95% of global cotton production [2]. Improving cotton yield and fiber quality concurrently is the primary goal in cotton breeding, and the utilization of heterosis is an effective way to improve the yield trait of cotton [3,4].
Hybrid vigor or heterosis describes the superior performance of F1 hybrids compared with their parents in term of biomass, yield, plant height, stress tolerance, etc. [5,6] Hybrids have been widely used in crop breeding programs in rice [7], maize [8], rapeseed [9], etc. Based on the proposed hypotheses, several models have been reported in some plants. In tomato, the overdominance model was proven, and revealed that heterozygous mutations perform better than homozygous ones [10]. In cotton, the researchers investigated the distribution of heterozygous loci among 12 commercial cotton hybrids, and suggested that heterozygous loci-enrichment may be responsible for the hybrid high yield performance and cotton heterosis was driven, in part, by these heterozygous sites [11].
Genetic variation is an important source of genetic and phenotypic diversity, and it is also the basis of biological evolution. Genetic variation is mainly divided into sequence variation and structural variation. Sequence variation consists of single nucleotide polymorphisms (SNPs) and small insertions/deletions (InDels), while structural variation includes presence/absence variations (PAVs) and copy number variations (CNVs). Many genetic variations have been identified in animals [12] and plants [13,14], and have been used to study gene function, domestication, and evolution [15,16]. The completion of the whole genome sequence for cotton [17,18,19,20,21], regular updates of the sequencing platform, and increasingly sophisticated analytical tools allow us to more rapidly and easily discover genetic variation at the whole-genome level. To date, a large number of SNPs and InDels in cotton have been identified through gene arrays or genome sequencing. For instance, the CottonSNP63K array with 63,058 SNP markers was developed and used as a high-throughput genotyping tool [22]. The researchers performed a genome-wide association study (GWAS) and found 19 promising potential cotton fiber genes by using the high-throughput CotttonSNP63K array [23]. Using the genome sequencing method, many SNPs and InDels have been identified associated with important traits in cotton [24,25], and some artificial domestication selection regions also were identified using this method [26,27]. These studies provide a new direction for the identification of molecular markers in cotton. Simultaneously, these novel molecular markers become effective tools for studying the mechanism of heterosis.
CCRI63 is an elite hybrid upland cotton line that was bred from two cotton lines, 9053 and sGK9708. CCRI63 possesses high yield, disease resistance, stability, and adaptability features and is planted on a large scale in the Yangtze River area of China. The male parent, sGK9708, is an insect-resistant cotton with Bt insect-resistant gene, and is suitable for planting in the Yellow River Region of China. The female parent, 9053, is a common upland cotton line, and is suitable for planting in the Yangtze River Region of China. Many conventional cotton varieties have been generated from 9053 because of its broad genetic base. sGK9708 and 9053 have played an important role in the breeding of hybrid cotton, and a series of hybrid cotton varieties have been produced from their derivatives. However, the genetic mechanism underlying the phenomenon of heterosis was still unclear. In this study, we resequenced the parental lines, 9053 and sGK9708, and identified a large number of variations between them. Moreover, we examined these variations in relation to previously identified QTLs associated with lint percentage and boll weight. Co-location and gene expression pattern analyses were conducted for the genes containing variations. In summary, the discovery of these genetic variations provides important clues for revealing the genetic basis of hybrid heterosis and is useful for cotton breeding.

2. Materials and Methods

2.1. Plant Materials

In this study, we used three upland cotton lines, 9053, sGK9708, and CCRI63, as experimental materials. The three lines were planted with three replications at Jingzhou (JZ), Hubei Province, China in 2016 and 2017 (designated 16JZ and 17JZ, respectively), and field trials followed an arrangement-order design. Each line was planted in a single-row plot (6.0 m long and 0.8 m between rows) with 20–25 plants per replication. The plots were irrigated by furrow. Moreover, other field managements, including watering, fertilization, insect and weed control was performed according to the usual local agronomic management during the growing period. At different fertility periods, a total of 12 different agronomic traits were investigated, including lint percentage (LP), boll weight (BW), seed cotton weight (SW), lint weight (LW), fruit branch number (FBN), boll number (BN), seed index (SI), upper half mean length (UHML), uniformity (UI), strength (STRG), micronaire (MIC), and elongation (ELG). The statistical analyses and one-way ANOVA analyses were conducted using R software (version 3.4.2, R Foundation for Statistical Computing, Vienna, Austria) [28]. According to the reported method, better-parent heterosis (BPH) was calculated as BPH = (F1 − BP)/BP, where F1 is the hybrid and BP is the better-performing parental line [29].

2.2. DNA Isolation and Sequencing

The genomic DNA of each plant was extracted from young leaves using a modified cetyltrimethylammonium bromide (CTAB) method [30]. Subsequently, the DNA concentration of samples was evaluated using a NanoDrop 2000C Spectrophotometer (Thermo Scientific, Waltham, MA, USA), and electrophoresis with a 1% agarose gel was used to check the quality of DNA samples. A total of 1.5 μg DNA of each sample was used to generate a DNA sequencing library by using the TruSeq Nano DNA HT Sample Prep Kit (Illumina, San Diego, CA, USA) according to the manufacturer’s protocol, and index codes were then added to key sequences for each sample. Paired-end sequencing libraries with insert sizes of 350 bp were constructed according to the manufacturer’s instructions (Illumina, San Diego, CA, USA). Finally, all libraries were sequenced using the Illumina HiSeq4000 sequencing platform at the Novogene Bioinformatics Institute, Beijing, China. All sequencing data have been deposited in the National Center for Biotechnology Information (NCBI) Sequence Read Archive (SRA, http://0-www-ncbi-nlm-nih-gov.brum.beds.ac.uk/Traces/sra) under accession number SRP145619 and SRP151723.

2.3. Variant Detection and Annotation

The reference genome sequence of upland cotton (TM-1) and its annotation file were downloaded from CottonGen database (https://www.cottongen.org/) [31]. First, we used the FastQC software to evaluate the quality of the raw reads. Then, to obtain clean reads, a series of quality control (QC) procedures were applied to the raw reads in FASTQ format to remove the low-quality reads. The clean reads were then mapped to the G. hirsutum TM-1 reference genome [21], using Burrows-Wheeler Aligner software (BWA, version 0.7.10, Wellcome Trust Sanger Institute, Cambridge, UK) with the command ‘mem -t 10 -k 32’ [32]. Potential PCR duplications were filtered by the Picard software (http://broadinstitute.github.io/picard/). The alignment results were converted to BAM files using SAMtools software (version 1.6, Wellcome Trust Sanger Institute, Cambridge, UK) [33] (settings: -bS -t). If multiple read pairs had identical external coordinates, only the pair with the highest mapping quality was retained. SNPs and InDels were identified by SAMtools mpileup (settings: mpileup -m 2 -F 0.002 -d 1000). We regarded the results with a coverage depth ≥4 and ≤1000, and root mean square (RMS) mapping quality ≥20 as potential variations. Based on reference genome of TM-1, all of the variations were annotated by the ANNOVAR software (http://www.openbioinformatics.org/annovar/) [34].

2.4. Identification of Variations between 9053 and sGK9708

Based on the TM-1 reference genome, the SNP/InDel variations in 9053 and sGK9708 were further compared with each other to identify the same and different mutation loci. Firstly, the unique mutation sites occurred in each sample were selected. Secondly, compared the variation type on the same position between two sample, the different variation type sites were selected. Finally, we chose the SNPs and InDels followed the above criterion as the polymorphism SNPs and InDels for the further analysis.

2.5. Co-localization with Previously Identified QTLs

We collected the QTLs associated with LP and BW from the publicly available CottonQTLdb (http://www2.cottonqtldb.org:8081/) [35] and gathered the GWAS loci for LP and BW from previous GWAS studies. The primer sequences of the markers were obtained from the CottonGen database (https://www.cottongen.org/) [31]. We then identified the physical location of the makers within the QTL regions based on the CottonGen database or by using blast against the G. hirsutum TM-1 reference genome with the primer sequences of the markers. QTLs with no specific location information were removed. Finally, based on the position information of the SNPs and InDels between the parents, we investigated the SNPs and InDels variations that overlapped the published QTL regions for LP and BW.

2.6. Functional Annotation and Gene Expression Analyses

First, we identified the genes with polymorphic SNPs or InDels between the two parental species, and then obtained the gene ontology (GO) numbers of those genes from the Cotton Functional Genomics Database (https://cottonfgd.org/) [36]. GO enrichment analysis was performed using the OmicShare tools (http://www.omicshare.com/tools). The transcriptome data of TM-1 was downloaded from the NCBI Sequence Read Archive (accession number: PRJNA248163), and the normalized fragments per kilobase million (FPKM) values were used to calculate the gene expression levels [37]. The gene expression data were further used to generate a heatmap using the Genesis (version 1.7.7, Graz University of Technology, Graz, Austria) program, and the cluster analysis was also performed in the Genesis program using the k-means clustering method [38].

2.7. Validation of SNPs and InDels

From the SNPs and InDels between 9053 and sGK9708 that were identified in the QTL regions for LP and BW, we randomly selected 15 SNPs and 15 InDels. Primers were designed to these SNPs and InDels using BatchPrimer3 based on their 300 bp flanking sequences [39], and then electronic PCR (e-PCR) software (National Center for Biotechnology Information, Bethesda, MD, USA) was used to check the specificity of the primers. Finally, the PCR products were sequenced using an ABI 3730 DNA Sequencer (Applied Biosystems, Foster City, CA, USA). Sequencing results were aligned by Clustal X software (version 1.8, University College Dublin, Dublin, Ireland) to confirm variation sites [40].

3. Results

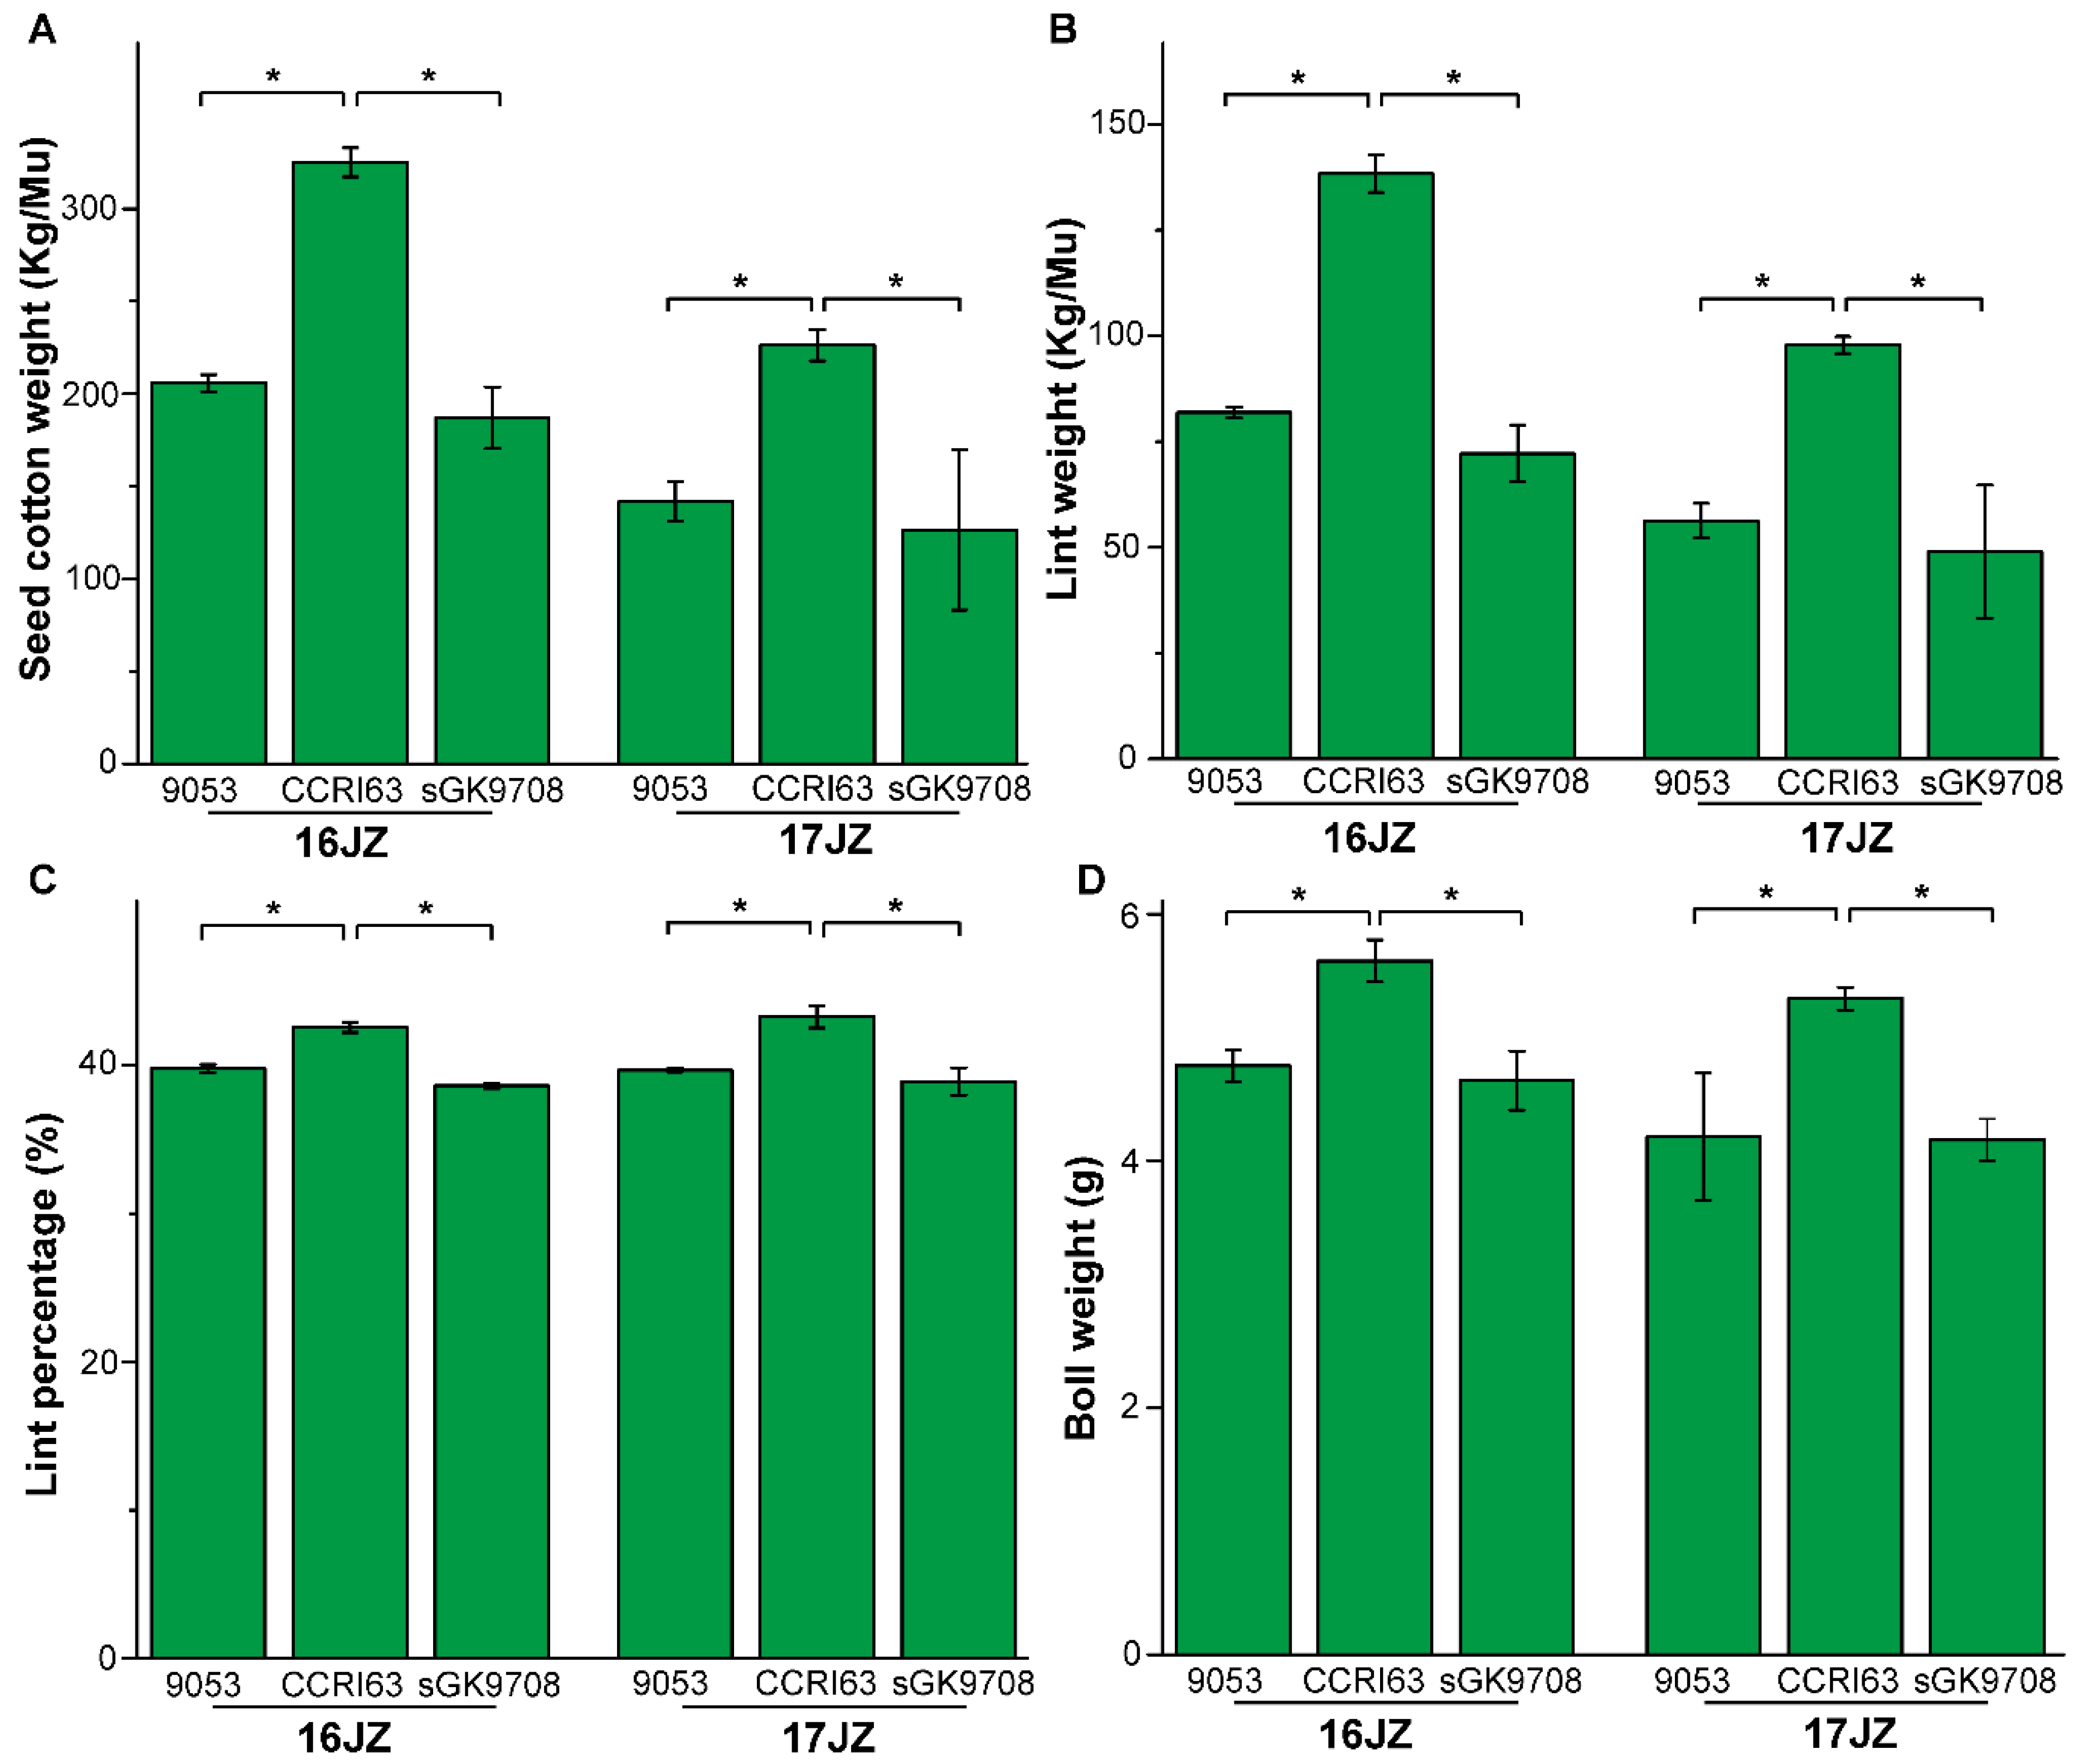
3.1. Agronomic Performance of Materials

In this study, we investigated 12 agronomic traits, including yield-related traits and fiber quality traits at Jingzhou, Hubei province, China in 2016 and 2017. The LSD’s test showed that the phenotype discrepancies of yield traits, including SW and LW, reach a significant level between the hybrid and parent lines, and no obvious differences were found in the fiber quality of the hybrid and parent lines in all locations. (Figure 1 and Table S1). The hybrid showed positive better-parent heterosis (BPH), and the mean BPH value of SW and LW traits was 58.69% and 71.40%, respectively. This indicated that the heterosis of CCRI63 at the yield level was significant. Furthermore, among the five yield components, a significant difference was found in the LP and BW traits of the hybrid and parent lines. The mean BPH value of LP and BW was 8.23% and 22.24%, respectively. Therefore, based on the phenotype performance of materials, we determined that yield heterosis of CCRI63 is mainly reflected by LP and BW traits.

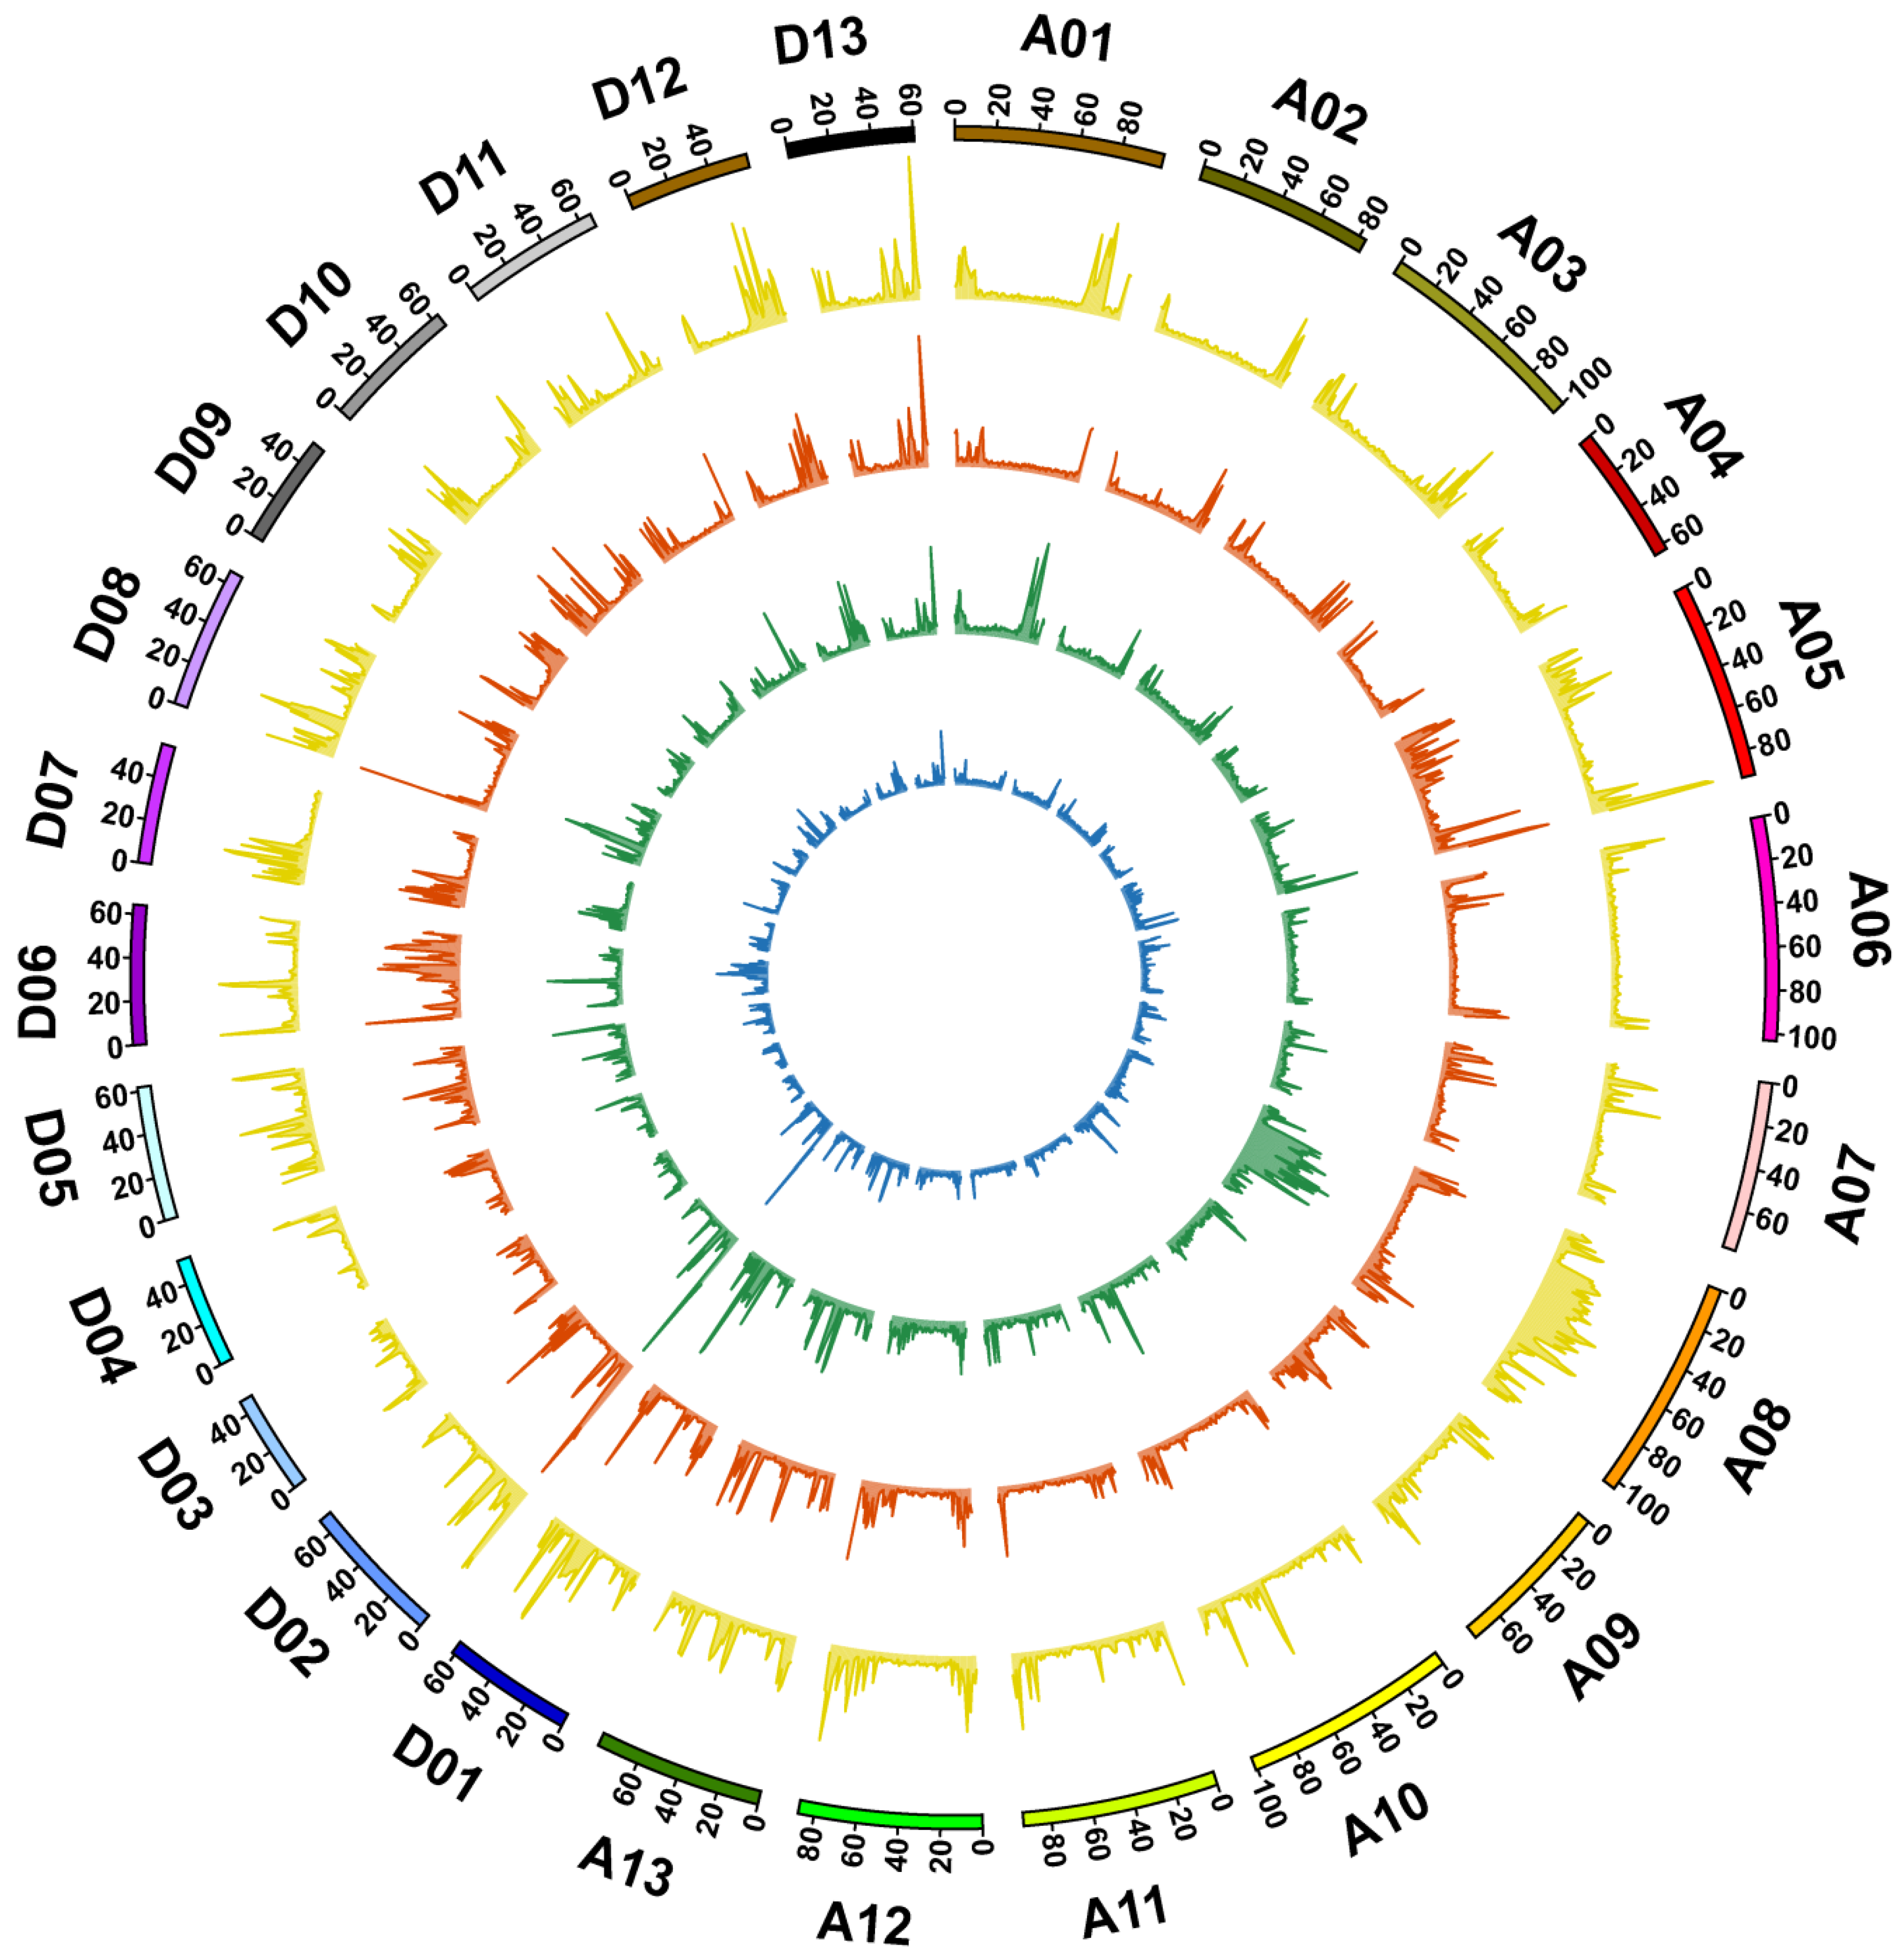
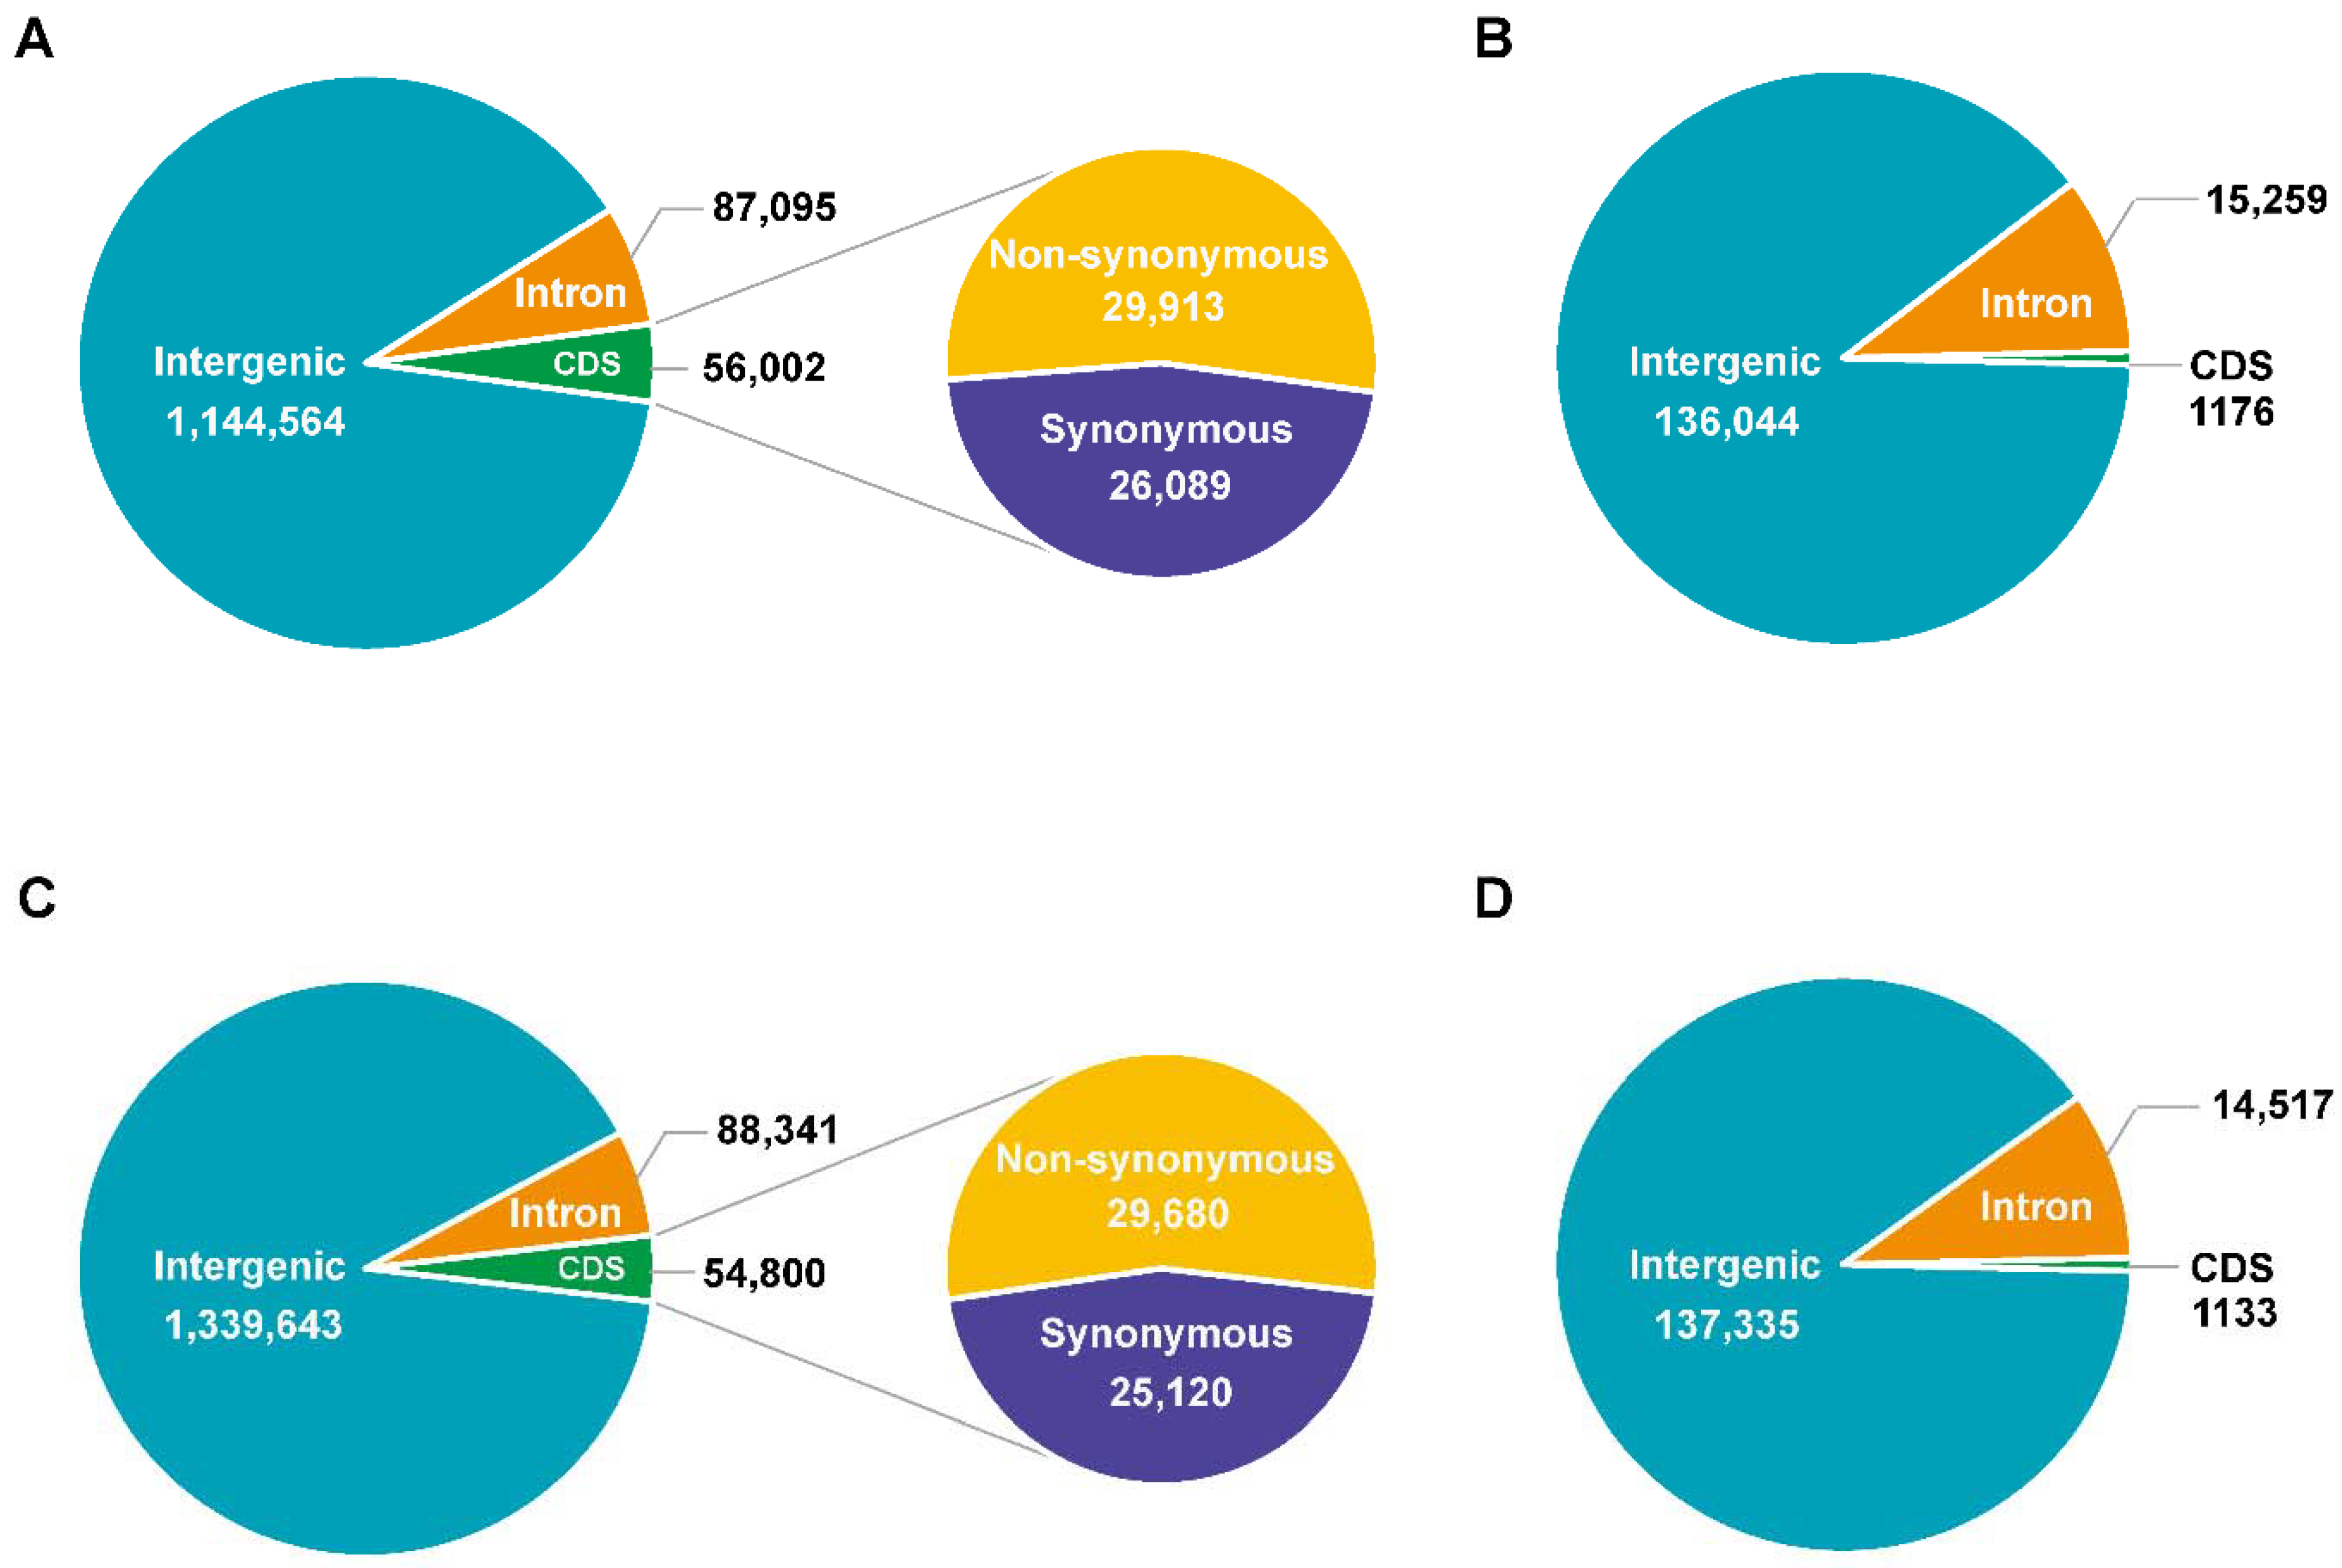
3.2. Genome Sequencing, Identification of Variation, and Annotation

A total of 2,295,417,826 150 bp pair-end reads were generated from 9053 and sGK9708, with an average depth of 59.9× and 64.37×. The sequence reads of each line were aligned to the reference genome, nearly 99.5% of the reads mapped to the reference genome resulting in coverage of at least 98.34% and 97.73% of the G. hirsutum TM-1 reference genome sequence for 9053 and sGK9708, respectively (Table 1). Finally, high-quality mapped reads were retained and used for calling variation.
After removal of the low-quality DNA polymorphisms, a total of 3,075,909 DNA polymorphisms were detected (Figure 2 and Table S2). Of those DNA polymorphisms, 318,323 sites were located within the gene regions and 2,757,586 sites were found in the intergenic regions (Figure 3). Considerably more SNPs were present than InDels, consistent with the previous study [41]. These variations were randomly distributed in different chromosomes and the density (number per 1 Mb) of the DNA polymorphisms has no obvious relationship with the chromosome length. Interestingly, we found that the A subgenome had more DNA polymorphisms than the D subgenome for both 9053 and sGK9708 (Table S2). We also investigated the genotype of variations, 1,060,323 homozygous variations were present in 9053, including 924,583 SNPs and 135,740 InDels, versus 911,971 SNPs and 117,784 InDels in sGK9708 (Figure S1A,B).
According to their nucleotide substitutions, the SNP variations were defined as transitions (A/G, C/T) or transversions (A/C, A/T, C/G, G/T). Analysis of transitions (Ts) and transversions (Tv) showed that the Ts/Tv ratio of 9053 and sGK9708 was 2.13 and 2.17, respectively. Additionally, the C/G was the rarest type of transversion (Figure S1C,D). We also analyzed the size distribution of InDels in 9053 and sGK9708. The length of the insertions ranged from 1–42 bp in both 9053 and sGK9708, and deletions ranged from 1-59 bp and 1-60 bp in 9053 and sGK9708, respectively. Single bp InDels were the most common, accounting for approximately 60% of all InDels detected. Moreover, depending on the type of amino acid change, SNP variations can be divided into non-synonymous SNPs and synonymous SNPs in the coding region. We analyzed the effect of SNPs in the coding region of the two species. The ratio of non-synonymous to synonymous SNPs was ~1.15 and ~1.18 for 9053 and sGK9708, respectively. Additionally, more unique synonymous and non-synonymous SNPs were discovered in 9053 than in sGK9708 (Table S3).

3.3. Genetic Variations between 9053 and sGK9708

Heterozygous sites in the F1 generation produced from the homozygous parents might relate to heterosis [42]. Thus, DNA polymorphisms between the two parents might explain the genetic basis of hybrid. In all, 696,017 SNPs and 125,081 InDels were identified between 9053 and sGK9708. They were distributed across all 26 chromosomes and unevenly distributed among the chromosomes, with more variations in A subgenome (444,363 SNPs and 71,005 InDels) than D subgenome (251,654 SNPs and 54,076 InDels) (Table S4). In addition, functional polymorphisms in the gene region that induce amino acid exchange are most likely a functional locus related to the target trait [43]. We, therefore, further investigated homozygous and non-synonymous SNPs and InDels between 9053 and sGK9708. In the coding region, three SNP types occurring at the same sites in the two lines was of particular interest. The first type was mutations resulting in non-synonymous SNPs compared with the reference sequence and different altered nucleotides between 9053 and sGK9708. The second type was non-synonymous SNP variants that were detected only in 9053, with sGK9708 remaining the same as the reference sequence. The third type was the opposite, differences in sGK9708 only. Likewise, InDels between the two samples were examined.
Follow the above principles, a total of 8649 polymorphic SNPs and 629 InDels in CDS regions were detected between 9053 and sGK9708 (Figure 4 and Table S4). Among these SNPs, the largest proportion of SNPs were type2 and type3 SNPs, and only three type1 SNPs were detected. We also investigated the distribution of those SNPs and InDels on chromosomes. The number and density of the SNPs and InDels varied across the different chromosomes (Figure 4 and Table S4). The most SNPs and InDels were detected on D05 (757) and A05 (57), respectively, and the least on A07 (88) and A04 (5), respectively. The maximum density of SNPs and InDels was located in D05 (9.93/Mb) and D02 (0.65/Mb), respectively, while the lowest density was found on A07 (1.12/Mb) and A04 (0.08/Mb), respectively (Table S4).

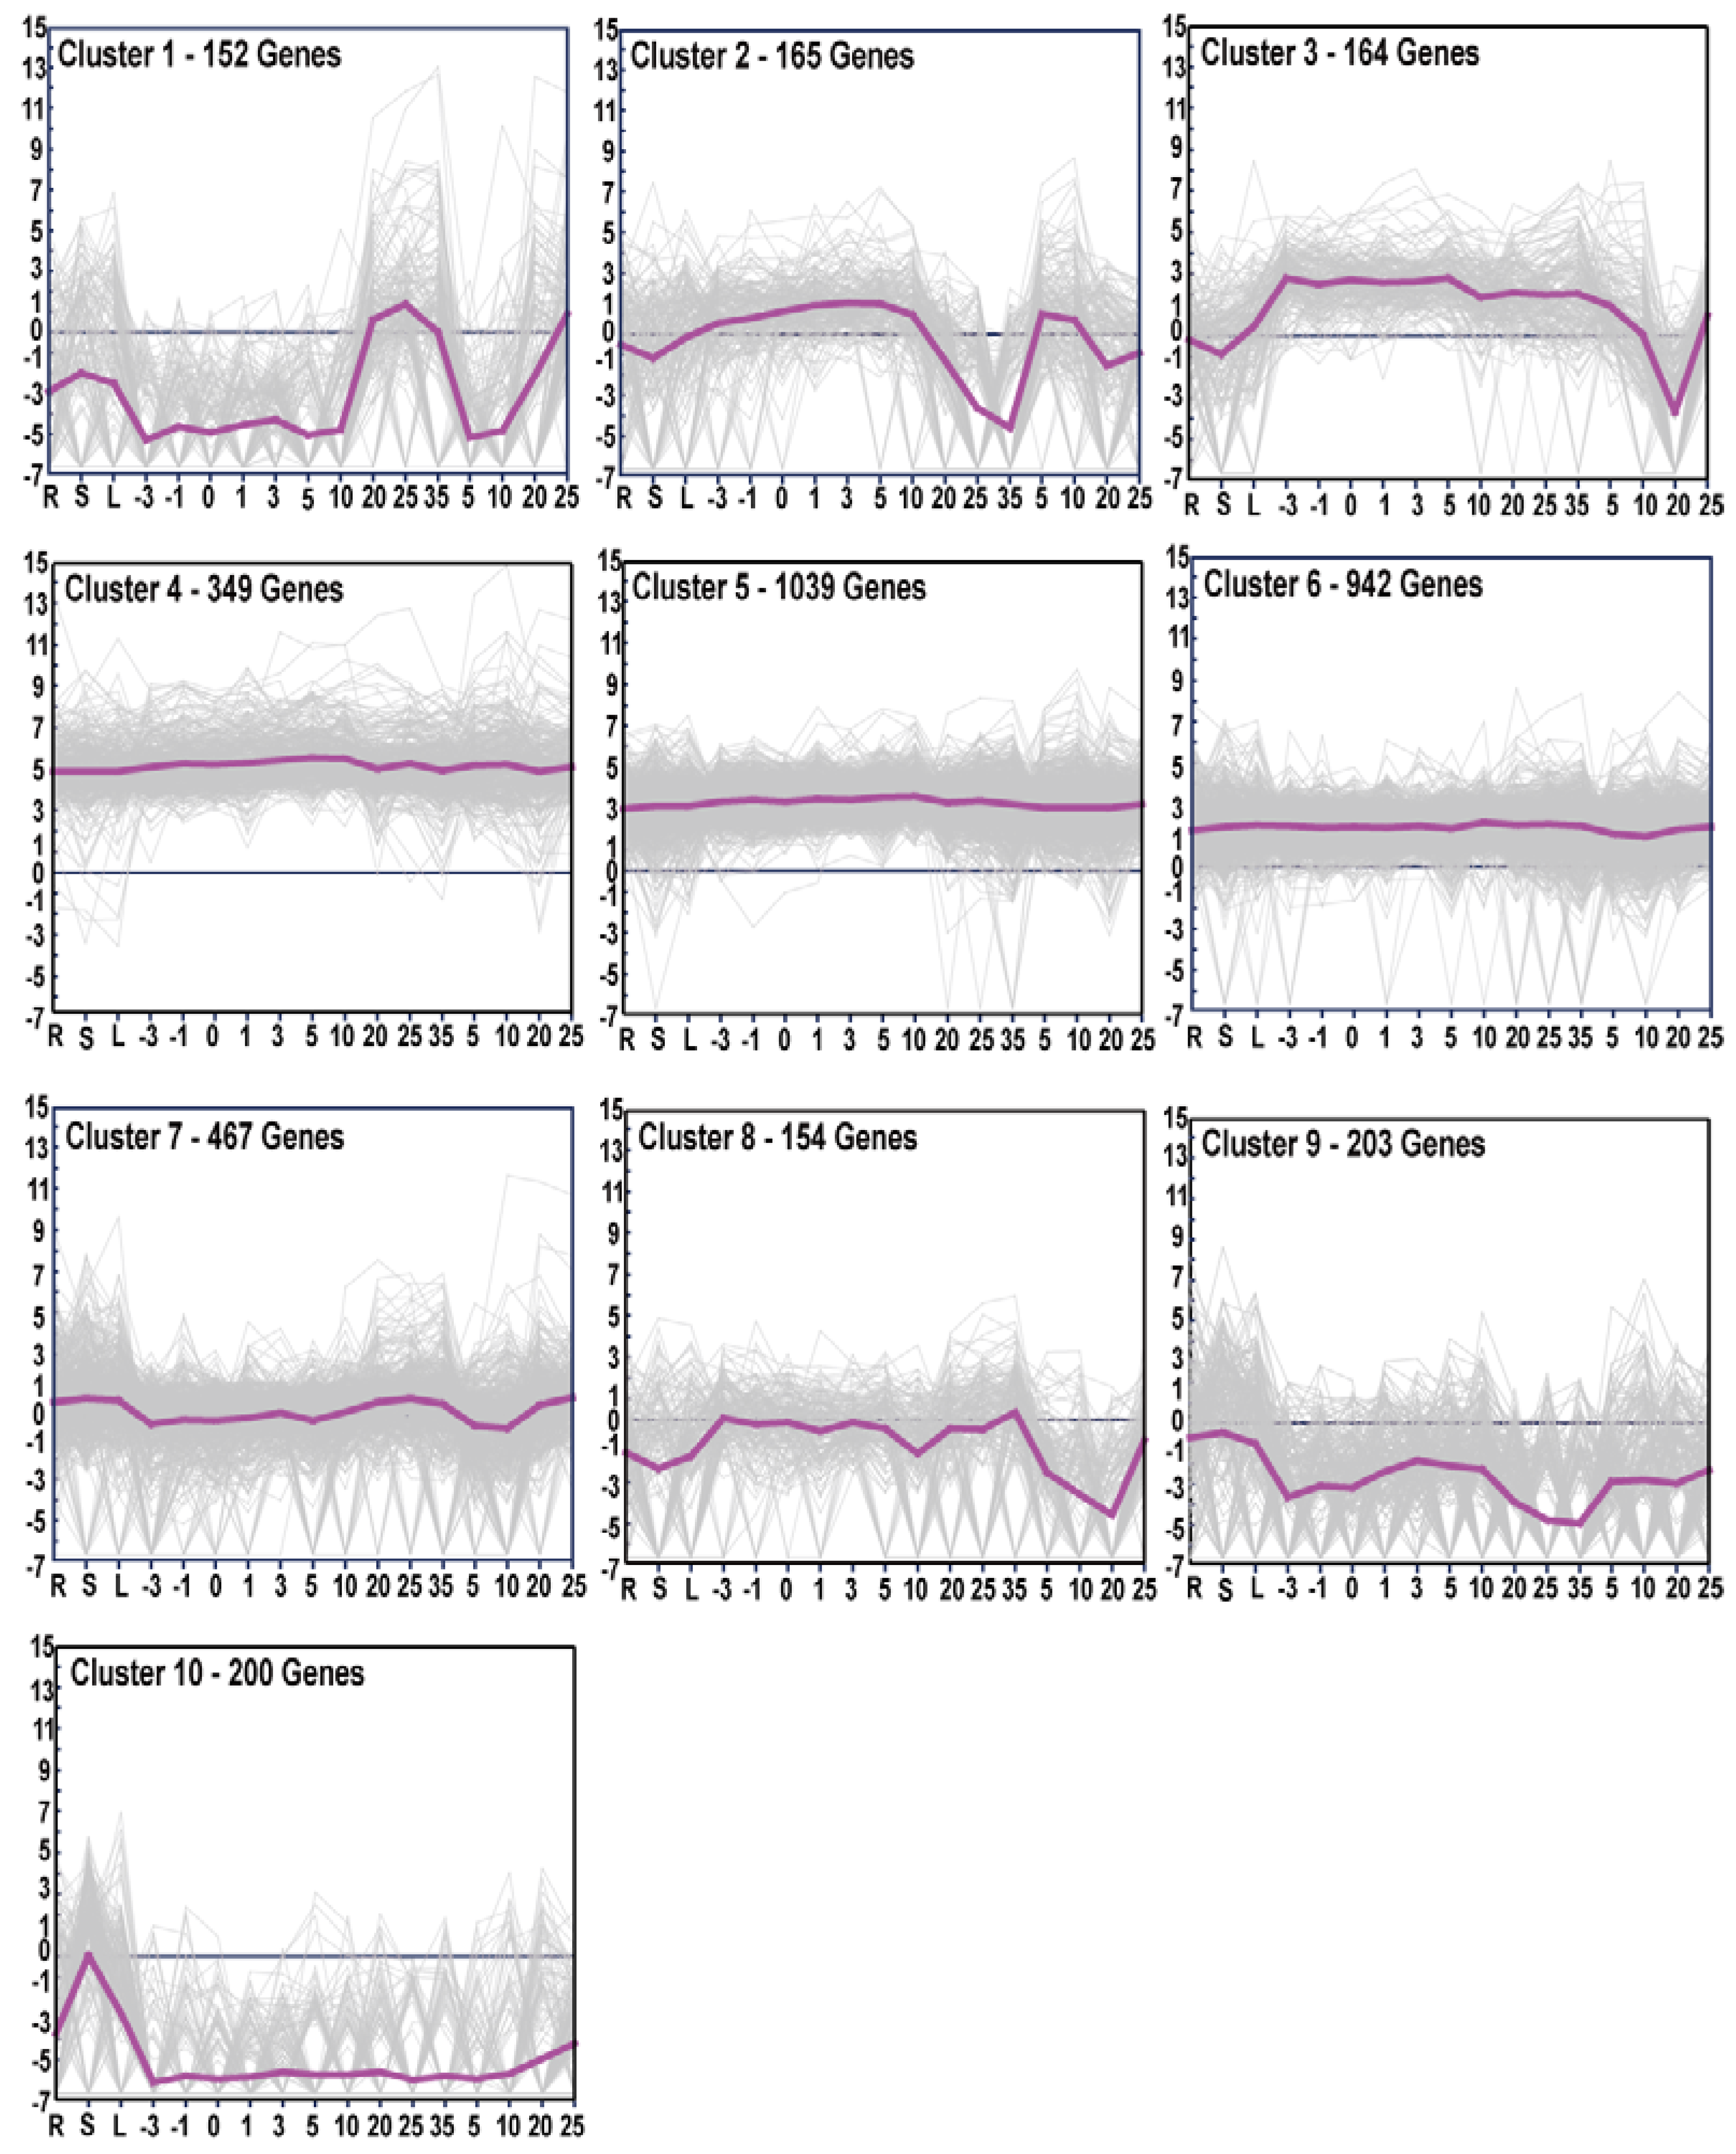
3.4. Gene Expression Patterns and GO Enrichment Analysis

Based on the annotation information for the polymorphic SNPs and InDels between 9053 and sGK9708, 4818 genes were detected harboring the polymorphic SNPs and 586 genes containing the polymorphic InDels. In total, 5092 genes were found with at least with one polymorphic DNA sequence (Figure S2). To understand the expression level of these genes in different organs and developmental stages, we used the RNA-seq transcriptome data of upland cotton (TM-1) to investigate the expression patterns of the 5092 genes via heatmap analysis. Among these 5092 genes, there were 1257 genes with zero FPKM or FPKM <1 in all 17 investigated organs and developmental stages (root, stem, leaf, and ovule and fiber developmental stages). The remaining 3835 genes were used for the gene expression profile and a cluster analysis.
The cluster analysis showed that 3835 genes were divided into 10 clusters (Cluster 1-10) based on the gene expression profiles (Figure 5, Figures S3–S5). A total of 2330 genes were present in Clusters 4, 5, and 6, these genes were highly expressed in all organs and developmental stages. There were 152 genes in Cluster 1 that were highly expressed in ovules 20–30 days post anthesis (DPA) and 25 DPA of fiber development stage. Clusters 2 contained 165 genes that were highly expressed in ovules from −3 to 20 DPA and fibers from 5 to 10 DPA. Additionally, 164 genes that were categorized into Cluster 3 exhibited highly expression in ovule developmental stages and 5 to 10 DPA of fiber development stages. Finally, the remaining 1024 genes from Cluster 7 to 10 were lowly expressed in all organs and developmental stages.
Gene ontology (GO) enrichment analyses can provide a rough understanding of gene enrichment in biological processes, molecular function, and cellular components and can illustrate the possible functions of genes [41]. We, therefore, used GO enrichment analysis to display the enrichment level of genes in the three main categories. The enrichment analyses revealed that the significant terms enriched in biological processes, cellular components, and molecular function were mainly involved in binding, catalytic activity, cellular processes, and developmental processes (Figure S6 and Table S5). These functions are all required for cotton fiber development.

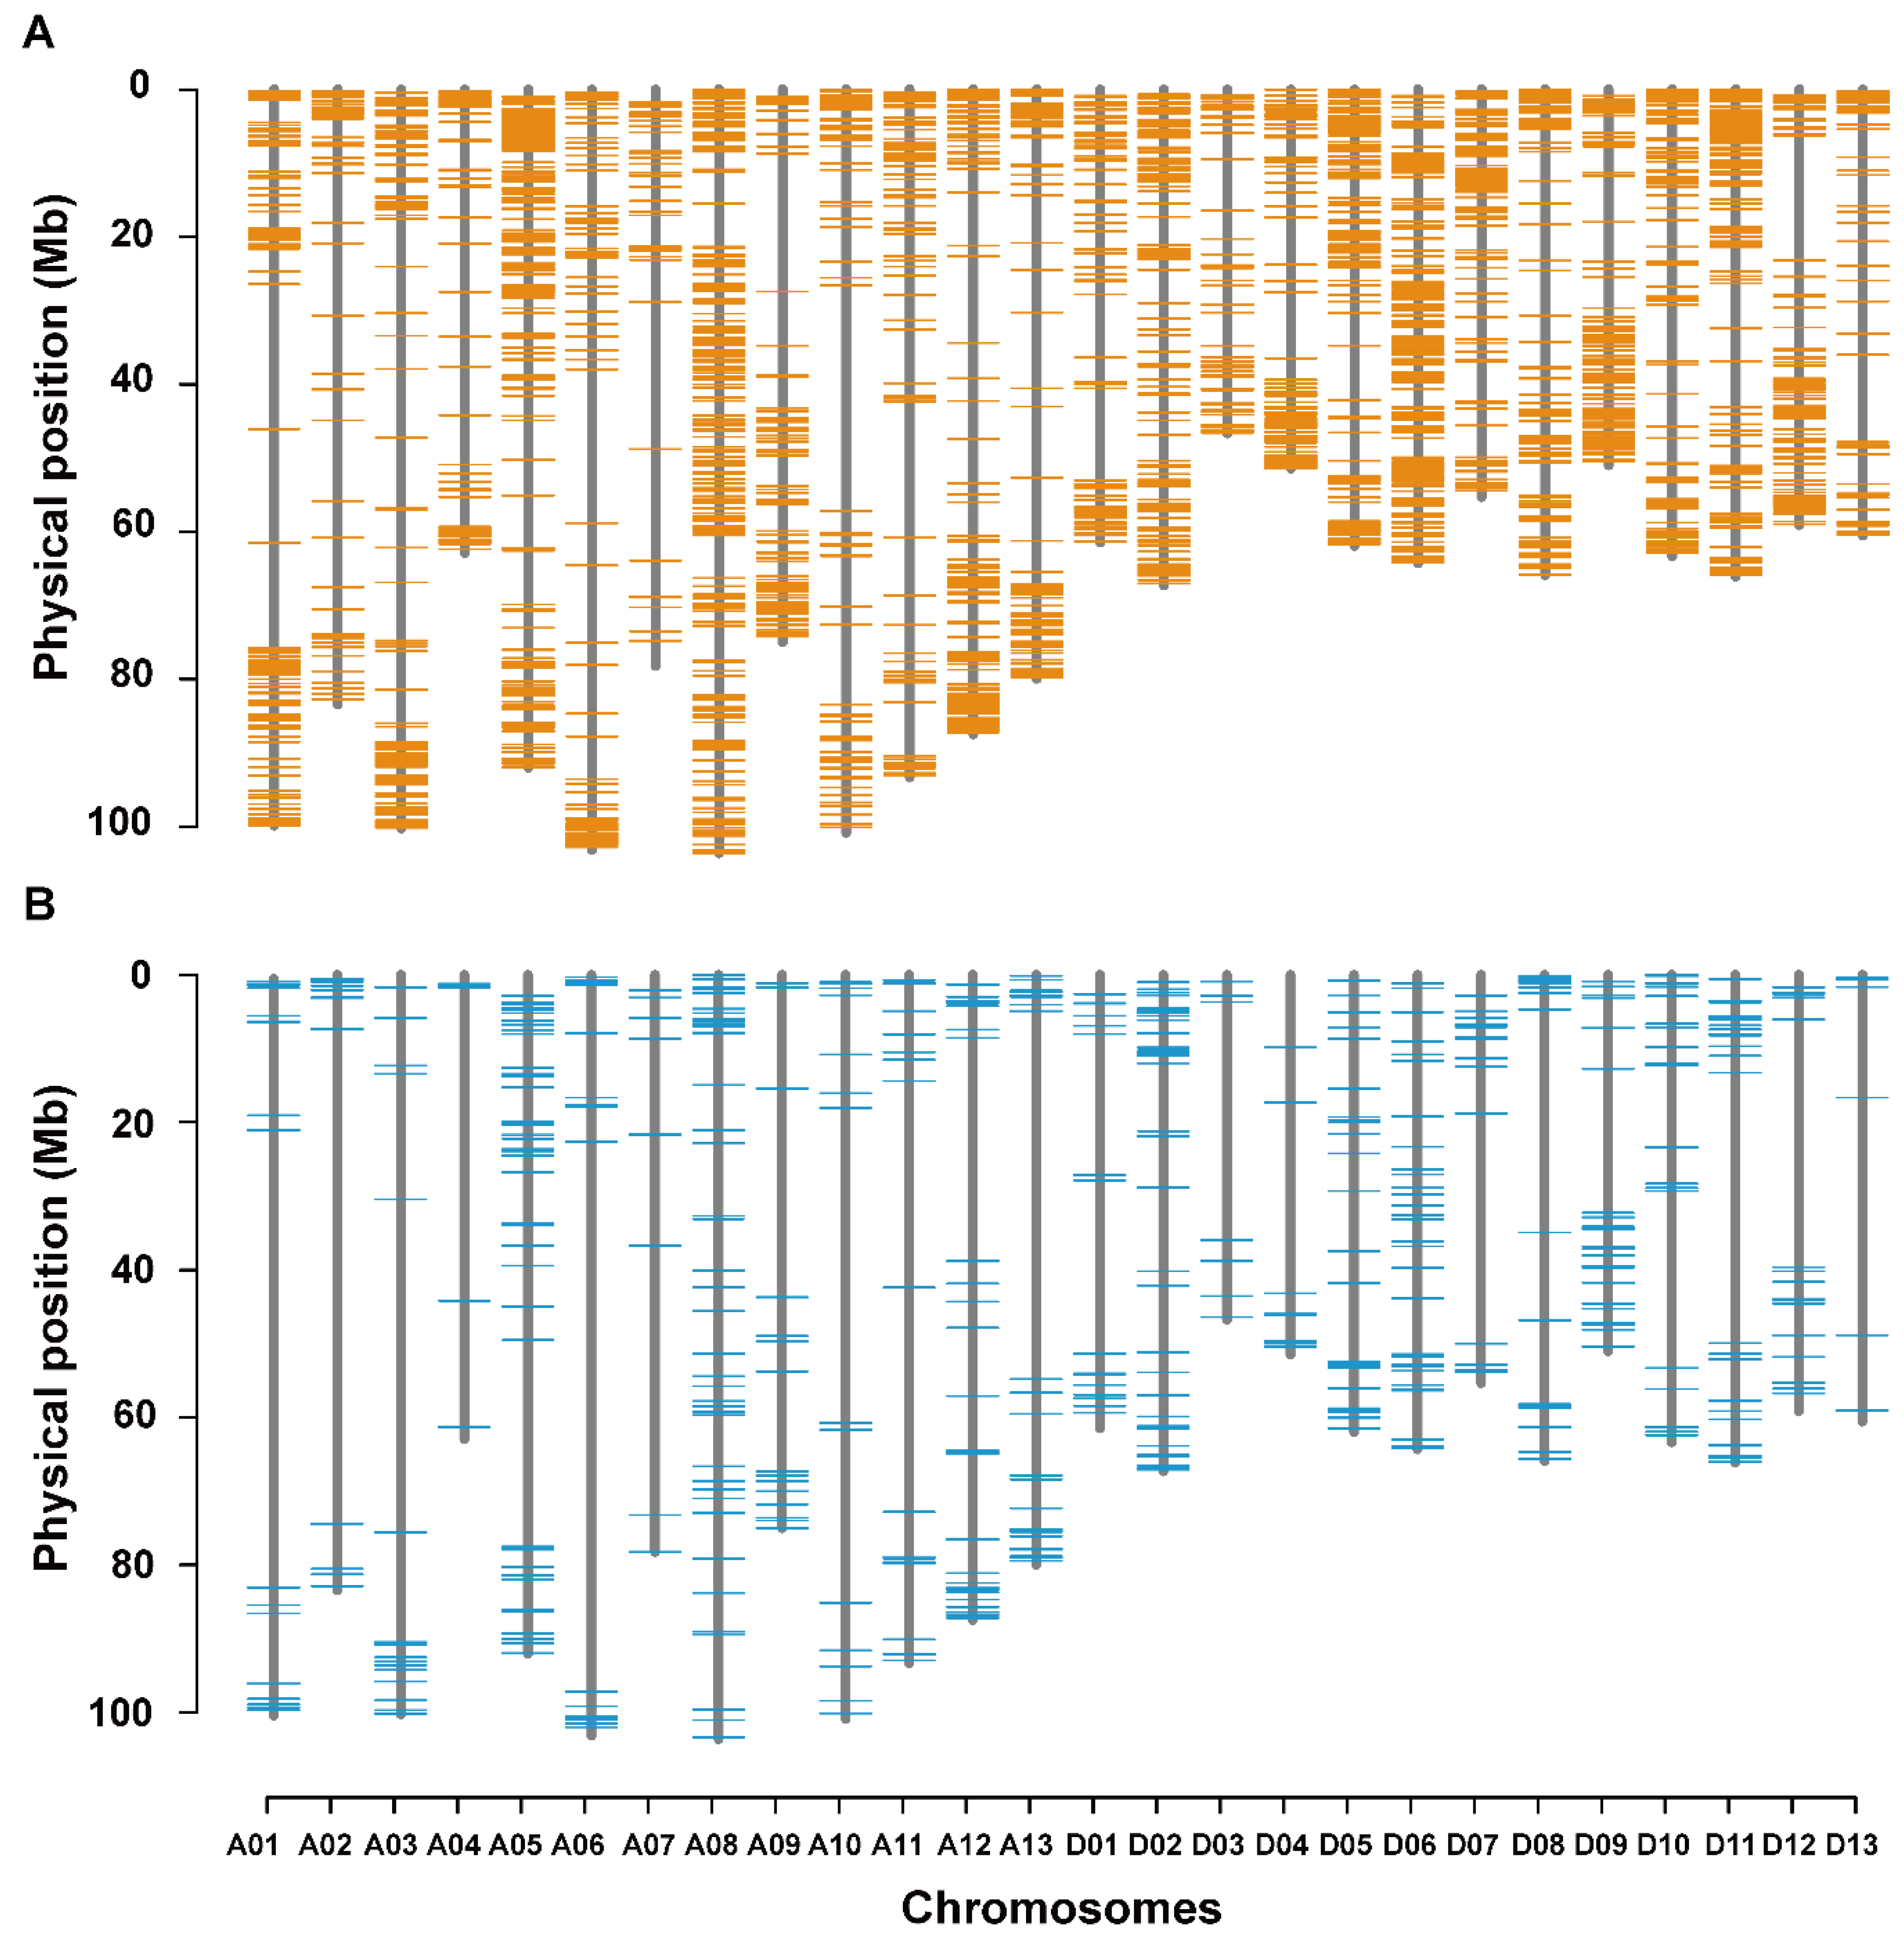
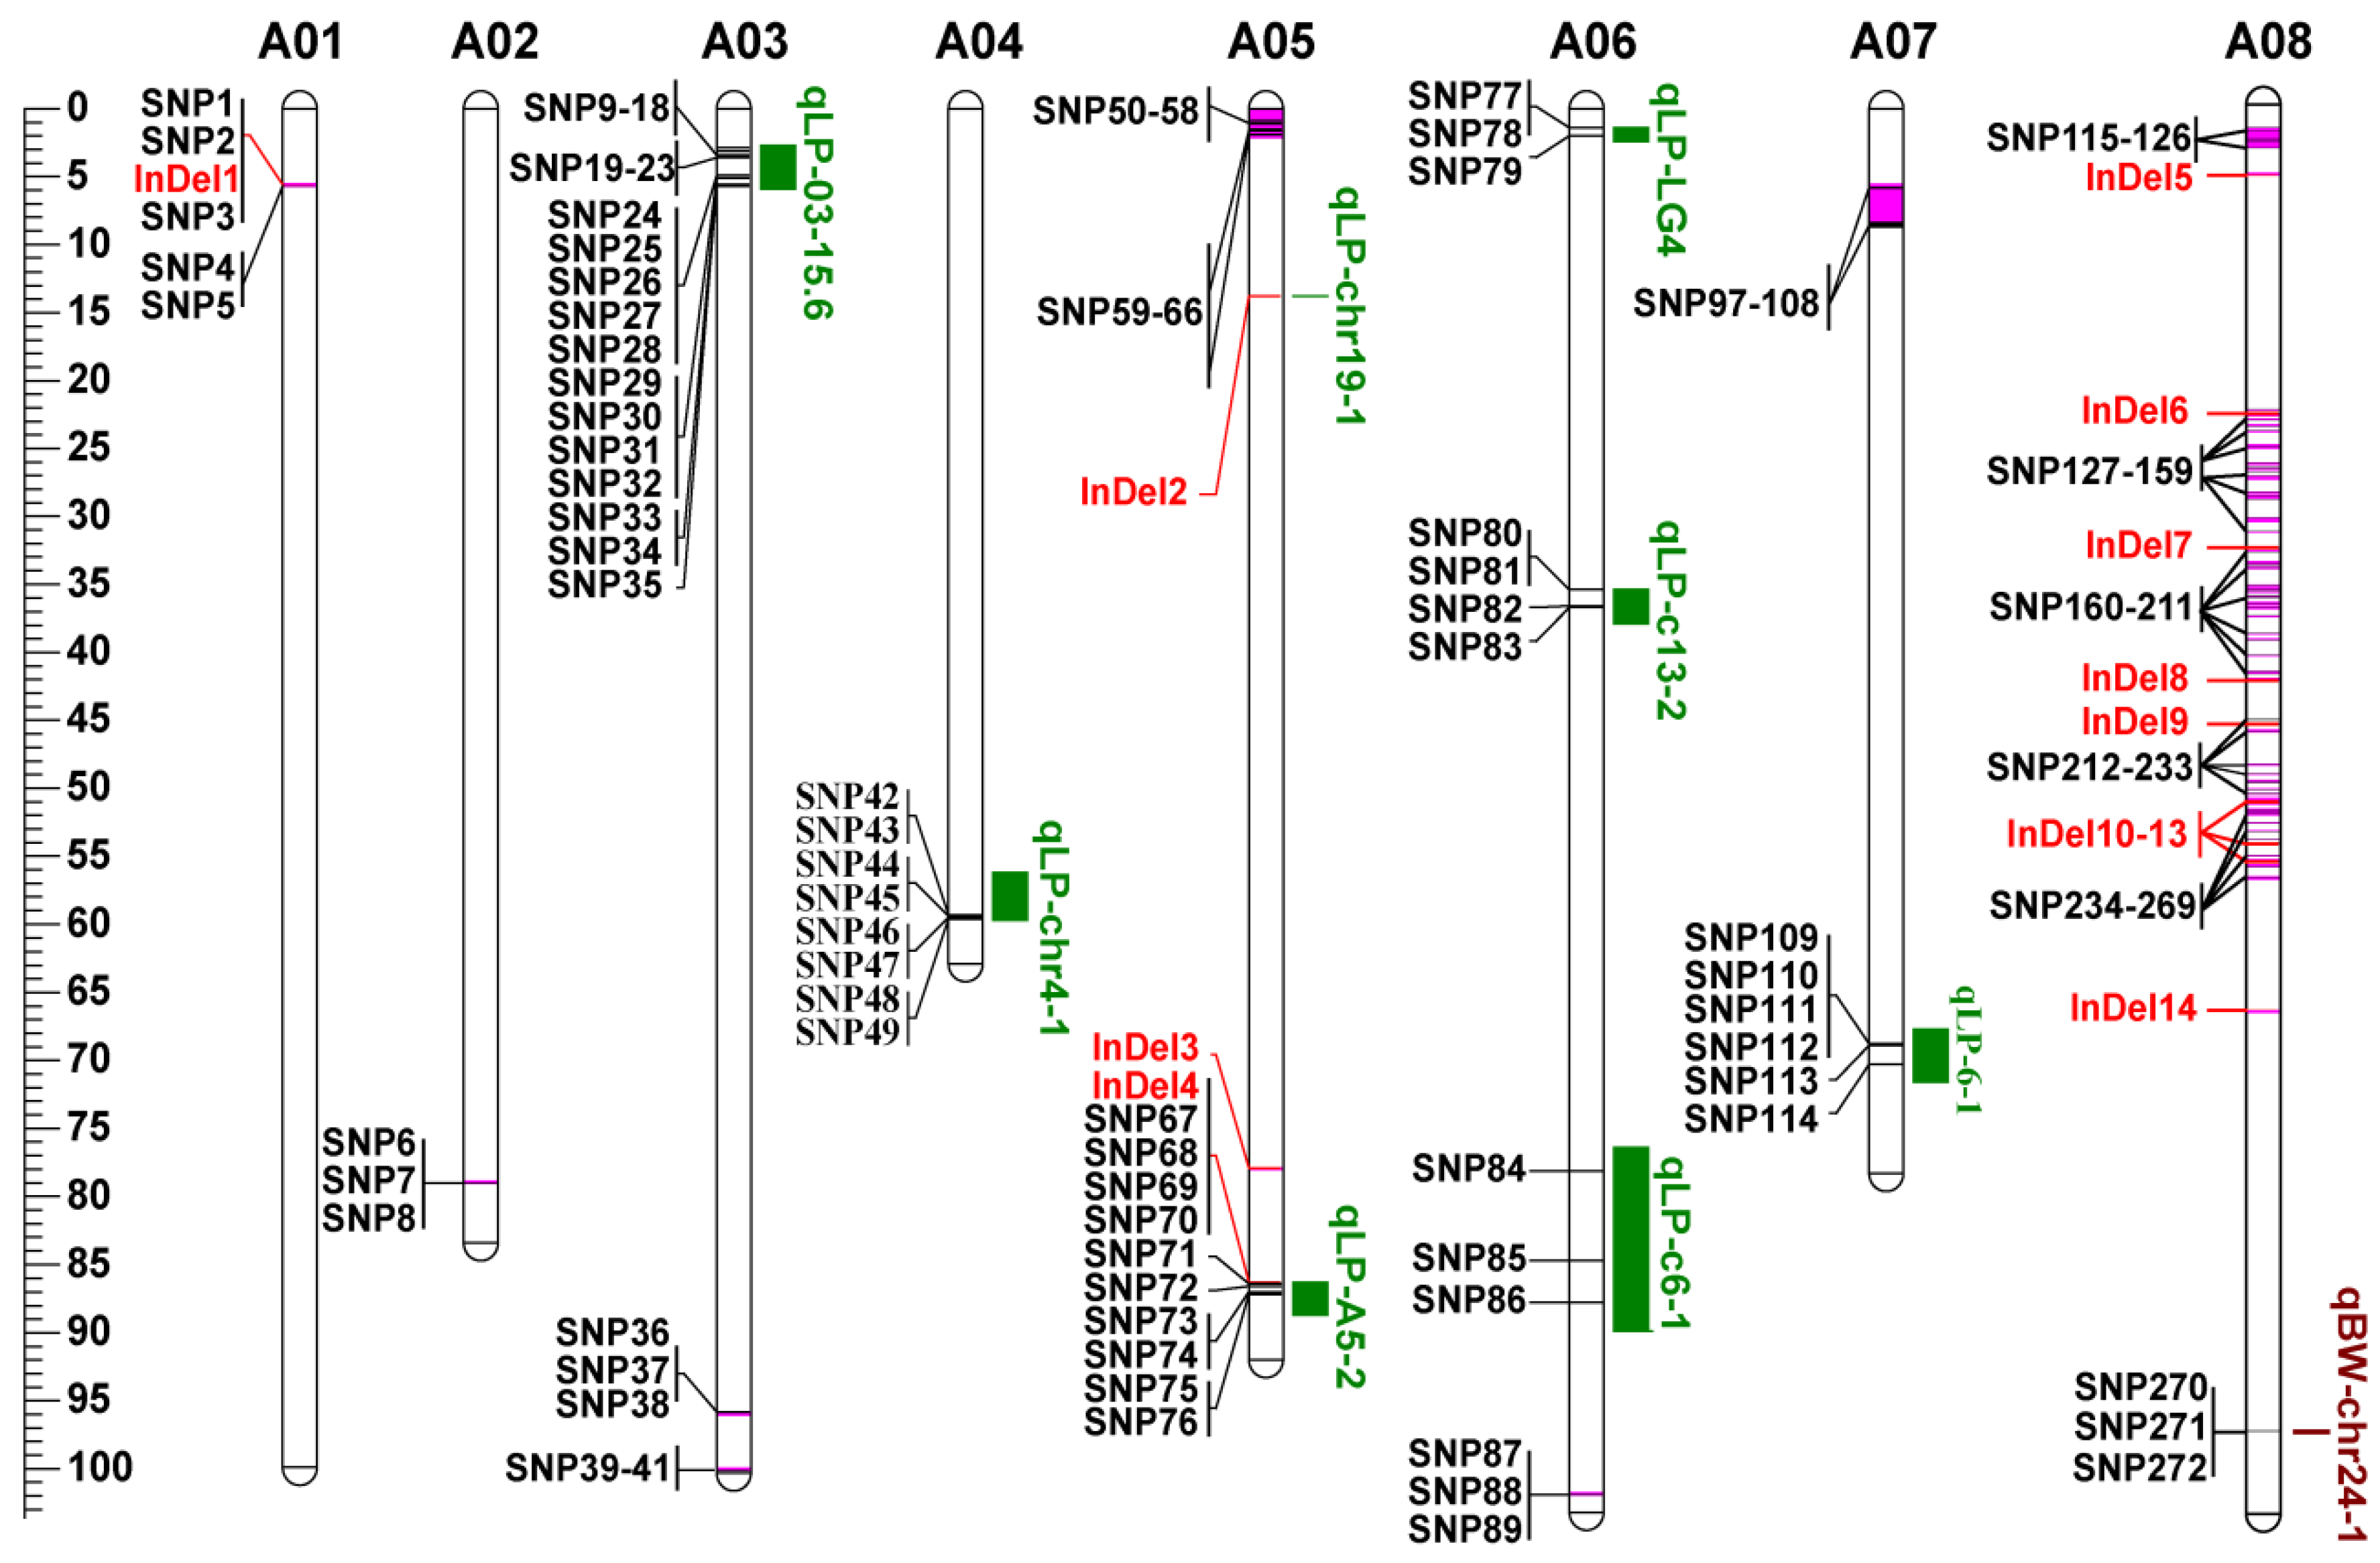
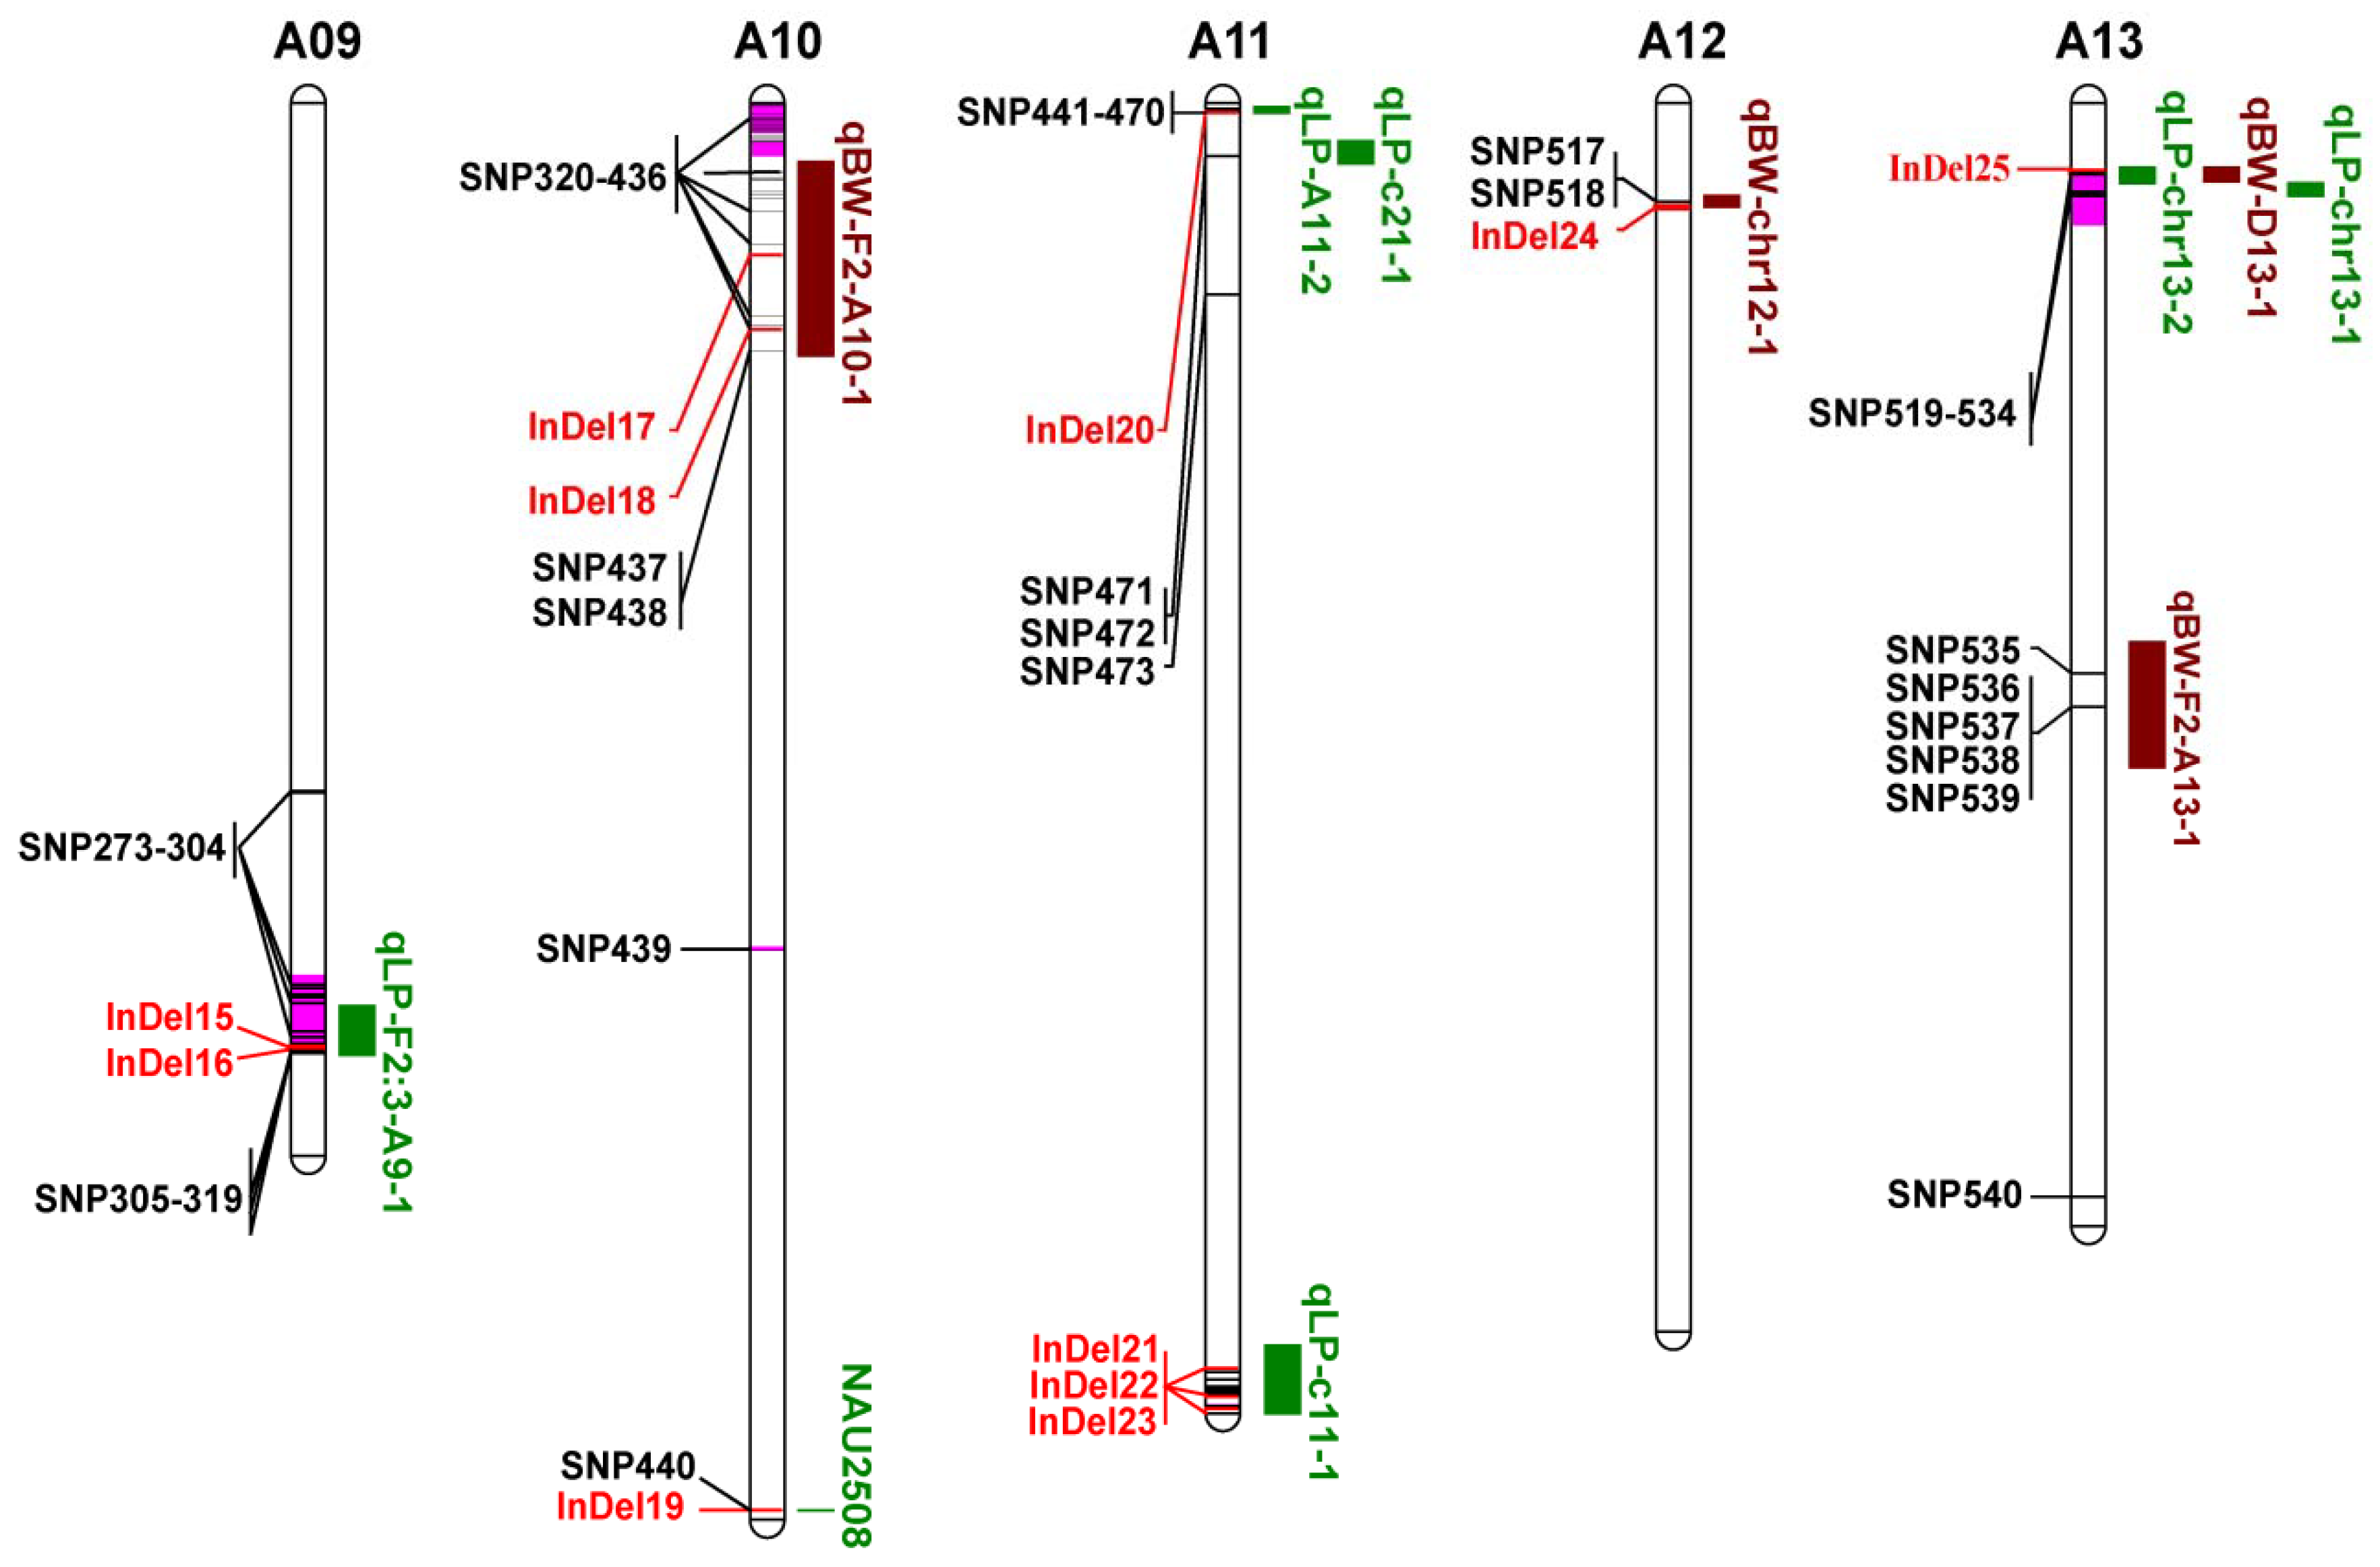
3.5. Co-localization of DNA Polymorphisms with QTLs for LP and BW

To understand the relationship between DNA polymorphisms and the performance of LP and BW, we co-localized the polymorphic SNPs and InDels with reported quantitative trait loci (QTLs) of LP and BW identified previously [35,44]. In all, we collected 560 QTLs from the previous QTL mapping and GWAS studies, including 392 QTLs of LP and 168 QTLs of BW. After filtered according to the physical location information of QTL intervals, 374 QTLs were reserved, including 290 LP QTLs and 84 BW QTLs. Furthermore, based on the positional information of SNPs and InDels, 1144 SNPs and 75 InDels were overlapped with 42 QTLs by linkage mapping and 91 QTLs via GWAS (Figure 6, Figure S7, Tables S6 and S7). On the basis of the annotation of the SNPs and InDels above, there were 663 genes containing polymorphic SNPs or InDels that overlapped with the QTL regions. We used BLASTP to identify their homologous genes in Arabidopsis thaliana (L.) Heynh. (Table S8). Of those 663 genes, 68 genes were highly expressed during ovule and fiber developments, and many have been proved to be related to fiber development in previous reports, such as GhMML3, GhSAUR33, and GhSAUR118 [45]. Additionally, we found that the closest Arabidopsis homolog of Gh_D02G2098, a cyclin-dependent kinase inhibitor 7, was AT1G49620, which increases cell number and results in larger organs and seeds by upregulating the E2F pathway and stimulating cell proliferation [46]. Accordingly, these genes might play important roles in cotton fiber development and their heterozygosity in the hybrid cotton might contribute greatly to heterosis performance.
The SNPs and InDels identified within the QTL regions associated with LP and BW may potentially become molecular markers for cotton breeding. Then, we randomly selected 15 SNPs and 15 InDels and validated their variations via PCR-based sequencing. The sequencing results confirmed 14 SNPs and 14 InDels of them, indicating the accuracy of the method. Those validated SNPs and InDels could be used as important genetic markers for marker-assisted breeding of cotton.

4. Discussion

With the completion of whole genome sequencing and the rapid development of bioinformatics, many studies have revealed genetic variations within species at the whole genome level, including Arabidopsis [47], maize [15], rice [48], and cotton [49]. In the present study, by resequencing two upland cotton lines, 9053 and sGK9708, the parental lines of an elite hybrid upland cotton, CCRI63, 1,287,661 SNPs and 152,479 InDels were detected in 9053, while 1,482,784 SNPs and 152,985 InDels were found in sGK9708. They were randomly distributed among 26 chromosomes, however, with more SNPs or InDels detected in the A subgenome than the D subgenome (Table S2), similar to the previous report [49]. This phenomenon may be because of A subgenome being approximately twice the size of D subgenome. In addition, homozygous SNPs and InDels accounted for a large proportion of these variations (Figure S1A,B), which was consistent with a previous report in cotton [50].
The commonly existed phenomenon of the variation type is that the proportion of transitions was significantly higher than transversions, which was called the transition bias. This may be associated with the greater tolerance of transitions to natural selection because of their conformational advantage relative to transversions that may better maintain protein structures [51]. In our study, the Ts/Tv ratio of 9053 and sGK9708 was 2.13 and 2.17, respectively, slightly lower than in rice (2.34) [41] and cotton (2.315) [50] identified previously. Additionally, the number of A/G transitions was slightly higher than C/T transitions while A/T transversions were the most common transversion. Similar results were detected in maize [52], wheat [53], and cotton [54]. Furthermore, the ratio of non-synonymous to synonymous SNPs for 9053 and sGK9708 was 1.15 and 1.18, respectively, similar to the ratio found previously in rice (1.15) [41] and soybean (1.10) [55], and lower than previously reported for cotton (1.42–1.91) [50]. For InDels, in this study, the length of InDels ranged from 1 to 60 bp, which was longer than for rice [41] and sorghum [16] and was similar to soybean [55]. Single bp InDels were the most commonly detected InDels, similar to rice [41] and sorghum [16]. Moreover, based on the annotation information of SNPs and InDels, a large number of SNPs and InDels were detected in noncoding regions (intergenic and intron regions). This might be associated with the low conservation of sequences in the non-coding region, which have been reported in animals and plants [56,57,58].
Heterosis is that a hybrid is superior to two parents in one or more traits, and it is a common genetic phenomenon in nature [11]. Compared with the parental lines, CCRI63 showed superior performances in terms of lint percentage and boll weight. The genotype of a hybrid is obtained by combining its parental genotypes, and the overdominance hypothesis presumes that heterozygosity of individual loci results in the superior performance [59]. In Arabidopsis, the study of the genomic architecture of biomass heterosis suggested that heterosis is strongly correlated with the accumulation of associated SNPs in the paternal accessions, and the combination of heterozygous loci within the associated SNPs might contribute to biomass heterosis [29]. Additionally, the previous report found that the pyramid of rare superior alleles in the hybrid could lead to the heterotic phenomenon in rice, by analyzing the genetic effects of heterozygous alleles [42]. In this study, 8649 polymorphic SNPs and 629 InDels were identified in the CDS region between 9053 and sGK9708. We also found 663 genes with polymorphic SNPs or InDels that overlapped with these previously reported QTLs. Among those 663 genes, 68 genes were highly expressed during ovule and fiber development, and some genes have been previous reported involved in fiber development. For instance, a GhMYB25-like protein, GhMML3_A12, is related to fuzz fiber production [60]. GhMML4 occurs in tandem with GhMML3, indicating that they might regulate the same metabolic processes in fuzz fiber development [61]. GhSAUR33 was similar to AtSAUR61-AtSAUR68, and might regulate cell expansion, thereby influencing cotton fiber development [45]. Simultaneously, the GO enrichment analysis revealed that the significant terms were related to binding, catalytic activity, glycoprotein metabolic processes, and developmental processes (Table S5), all of which play an important role in fiber development [23,62,63]. Therefore, we speculated that the outstanding performance of CCRI63 in terms of lint percentage and boll weight might be generated by accumulating the favorable variations from the parents. Furthermore, some selected polymorphic SNPs and InDels from the parents were confirmed by PCR-based sequencing, which suggested that these favorable variations have the potential to be developed as genetic markers and will facilitate the marker-assisted selection breeding of cotton.

5. Conclusions

In the present study, we comprehensively analyzed the DNA polymorphisms between 9053 and sGK9708 and found a large number of SNPs and InDels between them in the coding region of genes. Moreover, gene expression pattern analysis revealed that many genes containing polymorphic DNAs were expressed highly in ovule or fiber development. The co-location analysis revealed that some genes containing variations overlapped with previously reported QTLs for LP and BW. The GO enrichment analysis showed that many genes might participate in the important period of cotton development. Therefore, the heterotic loci of the hybrid, which were produced by combining the parent polymorphic homozygous loci, might contribute to heterosis and contribute molecular markers that could be exploited for cotton breeding. Taken together, these results might provide a basis for explaining heterosis of CCRI63 and the comprehensive data herein might provide a basis for hybrid breeding and pyramid breeding in cotton.

Supplementary Materials

The following are available online at https://0-www-mdpi-com.brum.beds.ac.uk/2073-4395/8/12/305/s1, Figure S1: Percentage of homozygous SNP, InDel and nucleotide substitution in 9053 and sGK9708. (A) The distribution of homozygous SNPs in 9053 and sGK9708. (B) The distribution of homozygous InDels in 9053 and sGK9708. (C) The percentage of transition and transversion in 9053 and sGK9708. (D) The percentage of different substitution types in 9053 and sGK9708. Figure S2: Numbers of genes contained the polymorphic SNPs and InDels. Blue circle indicated genes including SNPs, and orange circle represented genes containing InDels. Figure S3: The heatmap of gene expression for Cluster 1–3. The expression levels of genes were calculated by log2 (FPKM) values and the color bar denoted the gene transcript abundance. Red indicated high expression level, and green indicated low expression level. Figure S4: The heatmap of gene expression for Cluster 4–6. The expression levels of genes were calculated by log2 (FPKM) values, and the color bar denoted the gene transcript abundance. Red indicated high expression level, and green indicated low expression level. Figure S5: The heatmap of gene expression for Clusters 7–10. The expression levels of genes were calculated by log2 (FPKM) values and the color bar denoted the gene transcript abundance. Red indicated high expression level, and green indicated low expression level. Figure S6: Gene ontology classification of genes containing polymorphic DNA between 9053 and sGK9708. Different color represents different ontology, cellular component, molecular function and biological process. The mainly results of gene ontology analysis were shown. Figure S7: Physical map of SNPs and InDels which overlapped with the previous reported QTLs about LP and BW in D subgenome. The red line indicated the InDels, the QTL intervals of GWAS study were replaced by the pink color on the chromosomes and the green and brown bar indicated the LP QTLs and BW QTLs producing by QTL mapping study. Table S1: Comparison of agronomic traits among three accessions. Table S2: Summary variation information of each accession. Table S3: SNPs variants in gene region of 9053 and sGK9708. Table S4: Variations detected between 9053 and sGK9708. Table S5: The significant enriched GO terms of genes (p-value = 0.05). Table S6: The QTLs of LP and BW overlapped with the genes containing SNPs/InDels in previous linkage mapping study. Table S7: The QTLs of LP and BW overlapped with the genes containing SNPs/InDels in previous GWAS study. Table S8: The homologous annotation of the genes overlapped with the QTLs.

Author Contributions

D.Y., X.M. and W.L. conceived and designed the research. C.S., Z.W., Z.R., F.Z., K.S. and X.Z. performed the experiments. X.P., Y.L. and K.H. prepared the materials. C.S., W.L. and Z.W. analyzed the data. C.S. and W.L. wrote the paper. D.Y., X.M. and Z.W. revised the manuscript. All authors read and approved the final manuscript.

Funding

This research was sponsored by the National Key R&D Program for Crop Breeding (2016YFD0100306), the Key Project of Science and Technology of Henan Province of China (182102110306), and the Natural Science Foundation of Henan Province of China (152300410010).

Acknowledgments

We acknowledge Peng Huo (Zhengzhou Research Center, Institute of Cotton Research of CAAS, Zhengzhou, China) for technical assistance.

Conflicts of Interest

The authors declare no conflicts of interest.

References

  1. Chen, Z.J.; Scheffler, B.E.; Dennis, E.; Triplett, B.A.; Zhang, T.; Guo, W.; Chen, X.; Stelly, D.M.; Rabinowicz, P.D.; Town, C.D.; et al. Toward sequencing cotton (Gossypium) genomes. Plant Physiol. 2007, 145, 1303–1310. [Google Scholar] [CrossRef] [PubMed]
  2. Zhang, H.B.; Li, Y.; Wang, B.; Chee, P.W. Recent advances in cotton genomics. Int. J. Plant Genom. 2008, 2008, 742304. [Google Scholar] [CrossRef] [PubMed]
  3. Liu, R.; Wang, B.; Guo, W.; Qin, Y.; Wang, L.; Zhang, Y.; Zhang, T. Quantitative trait loci mapping for yield and its components by using two immortalized populations of a heterotic hybrid in Gossypium Hirsutum L. Mol. Breed. 2012, 29, 297–311. [Google Scholar] [CrossRef]
  4. Liang, Q.; Shang, L.; Wang, Y.; Hua, J. Partial dominance, overdominance and epistasis as the genetic basis of heterosis in upland cotton (Gossypium hirsutum L.). PLoS ONE 2015, 10, e0143548. [Google Scholar] [CrossRef] [PubMed]
  5. Shull, G.H. The Composition of a Field of Maize. J. Hered. 1908, os-4, 296–301. [Google Scholar] [CrossRef]
  6. Schnable, P.S.; Springer, N.M. Progress toward understanding heterosis in crop plants. Annu. Rev. Plant Boil. 2013, 64, 71–88. [Google Scholar] [CrossRef]
  7. Cheng, S.H.; Zhuang, J.Y.; Fan, Y.Y.; Du, J.H.; Cao, L.Y. Progress in research and development on hybrid rice: A super-domesticate in China. Ann. Bot. 2007, 100, 959–966. [Google Scholar] [CrossRef]
  8. Lai, J.; Li, R.; Xu, X.; Jin, W.; Xu, M.; Zhao, H.; Xiang, Z.; Song, W.; Ying, K.; Zhang, M.; et al. Genome-wide patterns of genetic variation among elite maize inbred lines. Nat. Genet. 2010, 42, 1027–1030. [Google Scholar] [CrossRef]
  9. Basunanda, P.; Radoev, M.; Ecke, W.; Friedt, W.; Becker, H.C.; Snowdon, R.J. Comparative mapping of quantitative trait loci involved in heterosis for seedling and yield traits in oilseed rape (Brassica napus L.). TAG. Theor. Appl. Genet. 2010, 120, 271–281. [Google Scholar] [CrossRef]
  10. Krieger, U.; Lippman, Z.B.; Zamir, D. The flowering gene SINGLE FLOWER TRUSS drives heterosis for yield in tomato. Nat. Genet. 2010, 42, 459–463. [Google Scholar] [CrossRef]
  11. He, S.; Sun, G.; Huang, L.; Yang, D.; Dai, P.; Zhou, D.; Wu, Y.; Ma, X.; Du, X.; Wei, S.; et al. Genomic divergence in cotton germplasm related to maturity and heterosis. J. Integr. Plant Boil. 2018. [CrossRef] [PubMed]
  12. Chen, R.; Davydov, E.V.; Sirota, M.; Butte, A.J. Non-synonymous and synonymous coding SNPs show similar likelihood and effect size of human disease association. PLoS ONE 2010, 5, e13574. [Google Scholar] [CrossRef] [PubMed]
  13. Han, B.; Xue, Y.; Li, J.; Deng, X.-W.; Zhang, Q. Rice functional genomics research in China. Philos. Trans. R. Soc. B Boil. Sci. 2007, 362, 1009–1021. [Google Scholar] [CrossRef] [PubMed] [Green Version]
  14. Lu, L.; Yan, W.; Xue, W.; Shao, D.; Xing, Y. Evolution and association analysis of Ghd7 in rice. PLoS ONE 2012, 7, e34021. [Google Scholar] [CrossRef] [PubMed]
  15. Jiao, Y.; Zhao, H.; Ren, L.; Song, W.; Zeng, B.; Guo, J.; Wang, B.; Liu, Z.; Chen, J.; Li, W.; et al. Genome-wide genetic changes during modern breeding of maize. Nat. Genet. 2012, 44, 812–815. [Google Scholar] [CrossRef]
  16. Zheng, L.Y.; Guo, X.S.; He, B.; Sun, L.J.; Peng, Y.; Dong, S.S.; Liu, T.F.; Jiang, S.; Ramachandran, S.; Liu, C.M.; et al. Genome-wide patterns of genetic variation in sweet and grain sorghum (Sorghum bicolor). Genome Boil. 2011, 12, R114. [Google Scholar] [CrossRef]
  17. Paterson, A.H.; Wendel, J.F.; Gundlach, H.; Guo, H.; Jenkins, J.; Jin, D.; Llewellyn, D.; Showmaker, K.C.; Shu, S.; Udall, J.; et al. Repeated polyploidization of Gossypium genomes and the evolution of spinnable cotton fibres. Nature 2012, 492, 423–427. [Google Scholar] [CrossRef] [PubMed]
  18. Wang, K.; Wang, Z.; Li, F.; Ye, W.; Wang, J.; Song, G.; Yue, Z.; Cong, L.; Shang, H.; Zhu, S. The draft genome of a diploid cotton Gossypium raimondii. Nat. Genet. 2012, 44, 1098–1103. [Google Scholar] [CrossRef] [PubMed]
  19. Li, F.; Fan, G.; Wang, K.; Sun, F.; Yuan, Y.; Song, G.; Li, Q.; Ma, Z.; Lu, C.; Zou, C.; et al. Genome sequence of the cultivated cotton Gossypium arboreum. Nat. Genet. 2014, 46, 567–572. [Google Scholar] [CrossRef]
  20. Li, F.; Fan, G.; Lu, C.; Xiao, G.; Zou, C.; Kohel, R.J.; Ma, Z.; Shang, H.; Ma, X.; Wu, J.; et al. Genome sequence of cultivated Upland cotton (Gossypium hirsutum TM-1) provides insights into genome evolution. Nat. Biotechnol. 2015, 33, 524–530. [Google Scholar] [CrossRef]
  21. Zhang, T.; Hu, Y.; Jiang, W.; Fang, L.; Guan, X.; Chen, J.; Zhang, J.; Saski, C.A.; Scheffler, B.E.; Stelly, D.M.; et al. Sequencing of allotetraploid cotton (Gossypium hirsutum L. acc. TM-1) provides a resource for fiber improvement. Nat. Biotechnol. 2015, 33, 531–537. [Google Scholar] [CrossRef] [PubMed]
  22. Hulse-Kemp, A.M.; Lemm, J.; Plieske, J.; Ashrafi, H.; Buyyarapu, R.; Fang, D.D.; Frelichowski, J.; Giband, M.; Hague, S.; Hinze, L.L.; et al. Development of a 63K SNP Array for Cotton and High-Density Mapping of Intraspecific and Interspecific Populations of Gossypium spp. G3 2015, 5, 1187–1209. [Google Scholar] [CrossRef] [PubMed]
  23. Sun, Z.; Wang, X.; Liu, Z.; Gu, Q.; Zhang, Y.; Li, Z.; Ke, H.; Yang, J.; Wu, J.; Wu, L.; et al. Genome-wide association study discovered genetic variation and candidate genes of fibre quality traits in Gossypium hirsutum L. Plant Biotechnol. J. 2017, 15, 982–996. [Google Scholar] [CrossRef] [PubMed]
  24. Page, J.T.; Liechty, Z.S.; Alexander, R.H.; Clemons, K.; Hulse-Kemp, A.M.; Ashrafi, H.; Van Deynze, A.; Stelly, D.M.; Udall, J.A. DNA sequence evolution and rare homoeologous conversion in tetraploid cotton. PLoS Genet. 2016, 12, e1006012. [Google Scholar] [CrossRef]
  25. Su, J.; Li, L.; Zhang, C.; Wang, C.; Gu, L.; Wang, H.; Wei, H.; Liu, Q.; Huang, L.; Yu, S. Genome-wide association study identified genetic variations and candidate genes for plant architecture component traits in Chinese upland cotton. TAG Theor. Appl. Genet. 2018, 131, 1299–1314. [Google Scholar] [CrossRef] [PubMed]
  26. Wang, M.; Tu, L.; Lin, M.; Lin, Z.; Wang, P.; Yang, Q.; Ye, Z.; Shen, C.; Li, J.; Zhang, L.; et al. Asymmetric subgenome selection and cis-regulatory divergence during cotton domestication. Nat. Genet. 2017, 49, 579–587. [Google Scholar] [CrossRef] [Green Version]
  27. Fang, L.; Wang, Q.; Hu, Y.; Jia, Y.; Chen, J.; Liu, B.; Zhang, Z.; Guan, X.; Chen, S.; Zhou, B.; et al. Genomic analyses in cotton identify signatures of selection and loci associated with fiber quality and yield traits. Nat. Genet. 2017, 49, 1089–1098. [Google Scholar] [CrossRef]
  28. Team, R.D.C. R: A language and environment for statistical computing. R Foundation for Statistical Computing, Vienna, Austria. Computing 2016, 14, 12–21. [Google Scholar]
  29. Yang, M.; Wang, X.; Ren, D.; Huang, H.; Xu, M.; He, G.; Deng, X.W. Genomic architecture of biomass heterosis in Arabidopsis. Proc. Natl. Acad. Sci. USA 2017, 114, 8101–8106. [Google Scholar] [CrossRef]
  30. Paterson, A.H.; Brubaker, C.L.; Wendel, J.F. A rapid method for extraction of cotton (Gossypium spp.) genomic DNA suitable for RFLP or PCR analysis. Plant Mol. Boil. Report. 1993, 11, 122–127. [Google Scholar] [CrossRef]
  31. Yu, J.; Jung, S.; Cheng, C.H.; Ficklin, S.P.; Lee, T.; Zheng, P.; Jones, D.; Percy, R.G.; Main, D. CottonGen: A genomics, genetics and breeding database for cotton research. Nucleic Acids Res. 2014, 42, D1229–D1236. [Google Scholar] [CrossRef] [PubMed]
  32. Li, H.; Durbin, R. Fast and accurate short read alignment with Burrows-Wheeler transform. Bioinformatics 2009, 25, 1754–1760. [Google Scholar] [CrossRef] [PubMed] [Green Version]
  33. Li, H.; Handsaker, B.; Wysoker, A.; Fennell, T.; Ruan, J.; Homer, N.; Marth, G.; Abecasis, G.; Durbin, R. The Sequence Alignment/Map format and SAMtools. Bioinformatics 2009, 25, 2078–2079. [Google Scholar] [CrossRef] [PubMed] [Green Version]
  34. Wang, K.; Li, M.; Hakonarson, H. ANNOVAR: Functional annotation of genetic variants from high-throughput sequencing data. Nucleic Acids Res. 2010, 38, e164. [Google Scholar] [CrossRef] [PubMed]
  35. Said, J.I.; Knapka, J.A.; Song, M.; Zhang, J. Cotton QTLdb: A cotton QTL database for QTL analysis, visualization, and comparison between Gossypium hirsutum and G. hirsutum × G. barbadense populations. Mol. Genet. Genom. 2015, 290, 1615–1625. [Google Scholar] [CrossRef] [PubMed]
  36. Zhu, T.; Liang, C.; Meng, Z.; Sun, G.; Meng, Z.; Guo, S.; Zhang, R. CottonFGD: An integrated functional genomics database for cotton. BMC Plant Boil. 2017, 17, 101. [Google Scholar] [CrossRef] [PubMed]
  37. Yang, Z.; Gong, Q.; Wang, L.; Jin, Y.; Xi, J.; Li, Z.; Qin, W.; Yang, Z.; Lu, L.; Chen, Q.; et al. Genome-wide study of YABBY genes in upland cotton and their expression patterns under different stresses. Front. Genet. 2018, 9, 33. [Google Scholar] [CrossRef]
  38. Sturn, A.; Quackenbush, J.; Trajanoski, Z. Genesis: Cluster analysis of microarray data. Bioinformatics 2002, 18, 207–208. [Google Scholar] [CrossRef]
  39. You, F.M.; Huo, N.; Yong, Q.G.; Luo, M.C.; Ma, Y.; Hane, D.; Lazo, G.R.; Dvorak, J.; Anderson, O.D. BATCHPRIMER3: A high throughput web application for PCR and sequencing primer design. BMC Bioinform. 2008, 9, 253. [Google Scholar] [CrossRef]
  40. Jeanmougin, F.; Thompson, J.D.; Gouy, M.; Higgins, D.G.; Gibson, T.J. Multiple sequence alignment with Clustal X. Trends Biochem. Sci. 1998, 23, 403–405. [Google Scholar] [CrossRef]
  41. Jain, M.; Moharana, K.C.; Shankar, R.; Kumari, R.; Garg, R. Genomewide discovery of DNA polymorphisms in rice cultivars with contrasting drought and salinity stress response and their functional relevance. Plant Biotechnol. J. 2014, 12, 253–264. [Google Scholar] [CrossRef] [PubMed]
  42. Huang, X.; Yang, S.; Gong, J.; Zhao, Y.; Feng, Q.; Gong, H.; Li, W.; Zhan, Q.; Cheng, B.; Xia, J.; et al. Genomic analysis of hybrid rice varieties reveals numerous superior alleles that contribute to heterosis. Nat. Commun. 2015, 6, 6258. [Google Scholar] [CrossRef] [PubMed] [Green Version]
  43. Zhao, Y.; Zhao, W.; Jiang, C.; Wang, X.; Xiong, H.; Todorovska, E.G.; Yin, Z.; Chen, Y.; Wang, X.; Xie, J.; et al. Genetic architecture and candidate genes for deep-sowing tolerance in rice revealed by non-syn GWAS. Front. Plant Sci. 2018, 9, 332. [Google Scholar] [CrossRef] [PubMed]
  44. Said, J.I.; Song, M.; Wang, H.; Lin, Z.; Zhang, X.; Fang, D.D.; Zhang, J. A comparative meta-analysis of QTL between intraspecific Gossypium hirsutum and interspecific G. hirsutum × G. barbadense populations. Mol. Genet. Genom. 2015, 290, 1003–1025. [Google Scholar] [CrossRef] [PubMed]
  45. Huang, C.; Nie, X.; Shen, C.; You, C.; Li, W.; Zhao, W.; Zhang, X.; Lin, Z. Population structure and genetic basis of the agronomic traits of upland cotton in China revealed by a genome-wide association study using high-density SNPs. Plant Biotechnol. J. 2017, 15, 1374–1386. [Google Scholar] [CrossRef] [PubMed] [Green Version]
  46. Cheng, Y.; Cao, L.; Wang, S.; Li, Y.; Shi, X.; Liu, H.; Li, L.; Zhang, Z.; Fowke, L.C.; Wang, H.; et al. Downregulation of multiple CDK inhibitor ICK/KRP genes upregulates the E2F pathway and increases cell proliferation, and organ and seed sizes in Arabidopsis. Plant J. Cell Mol. Boil. 2013, 75, 642–655. [Google Scholar] [CrossRef] [PubMed]
  47. Meijon, M.; Satbhai, S.B.; Tsuchimatsu, T.; Busch, W. Genome-wide association study using cellular traits identifies a new regulator of root development in Arabidopsis. Nat. Genet. 2014, 46, 77–81. [Google Scholar] [CrossRef]
  48. Wang, W.; Mauleon, R.; Hu, Z.; Chebotarov, D.; Tai, S.; Wu, Z.; Li, M.; Zheng, T.; Fuentes, R.R.; Zhang, F.; et al. Genomic variation in 3,010 diverse accessions of Asian cultivated rice. Nature 2018, 557, 43–49. [Google Scholar] [CrossRef]
  49. Ma, Z.; He, S.; Wang, X.; Sun, J.; Zhang, Y.; Zhang, G.; Wu, L.; Li, Z.; Liu, Z.; Sun, G.; et al. Resequencing a core collection of upland cotton identifies genomic variation and loci influencing fiber quality and yield. Nat. Genet. 2018, 50, 803–813. [Google Scholar] [CrossRef] [PubMed]
  50. Shen, C.; Jin, X.; Zhu, D.; Lin, Z. Uncovering SNP and indel variations of tetraploid cottons by SLAF-seq. BMC Genom. 2017, 18, 247. [Google Scholar] [CrossRef]
  51. Subbaiyan, G.K.; Waters, D.L.; Katiyar, S.K.; Sadananda, A.R.; Vaddadi, S.; Henry, R.J. Genome-wide DNA polymorphisms in elite indica rice inbreds discovered by whole-genome sequencing. Plant Biotechnol. J. 2012, 10, 623–634. [Google Scholar] [CrossRef] [PubMed]
  52. Batley, J.; Barker, G.; O’Sullivan, H.; Edwards, K.J.; Edwards, D. Mining for single nucleotide polymorphisms and insertions/deletions in maize expressed sequence tag data. Plant Physiol. 2003, 132, 84–91. [Google Scholar] [CrossRef] [PubMed]
  53. Chen, F.; Zhu, Z.; Zhou, X.; Yan, Y.; Dong, Z.; Cui, D. High-throughput sequencing reveals single nucleotide variants in longer-kernel bread wheat. Front. Plant Sci. 2016, 7, 1193. [Google Scholar] [CrossRef] [PubMed]
  54. Wang, H.; Jin, X.; Zhang, B.; Shen, C.; Lin, Z. Enrichment of an intraspecific genetic map of upland cotton by developing markers using parental RAD sequencing. DNA Res. Int. J. Rapid Publ. Rep. Genes Genomes 2015, 22, 147–160. [Google Scholar] [CrossRef] [PubMed] [Green Version]
  55. Yadav, C.B.; Bhareti, P.; Muthamilarasan, M.; Mukherjee, M.; Khan, Y.; Rathi, P.; Prasad, M. Genome-wide SNP identification and characterization in two soybean cultivars with contrasting Mungbean Yellow Mosaic India Virus disease resistance traits. PLoS ONE 2015, 10, e0123897. [Google Scholar] [CrossRef] [PubMed]
  56. Landry, C.R.; Lemos, B.; Rifkin, S.A.; Dickinson, W.J.; Hartl, D.L. Genetic properties influencing the evolvability of gene expression. Science 2007, 317, 118–121. [Google Scholar] [CrossRef] [PubMed]
  57. Wray, G.A. The evolutionary significance of cis-regulatory mutations. Nat. Rev. Genet. 2007, 8, 206–216. [Google Scholar] [CrossRef]
  58. Keurentjes, J.J.; Fu, J.; Terpstra, I.R.; Garcia, J.M.; van den Ackerveken, G.; Snoek, L.B.; Peeters, A.J.; Vreugdenhil, D.; Koornneef, M.; Jansen, R.C. Regulatory network construction in Arabidopsis by using genome-wide gene expression quantitative trait loci. Proc. Natl. Acad. Sci. USA 2007, 104, 1708–1713. [Google Scholar] [CrossRef]
  59. Jiang, Y.; Schmidt, R.H.; Zhao, Y.; Reif, J.C. A quantitative genetic framework highlights the role of epistatic effects for grain-yield heterosis in bread wheat. Nat. Genet. 2017, 49, 1741–1746. [Google Scholar] [CrossRef]
  60. Wan, Q.; Guan, X.; Yang, N.; Wu, H.; Pan, M.; Liu, B.; Fang, L.; Yang, S.; Hu, Y.; Ye, W.; et al. Small interfering RNAs from bidirectional transcripts of GhMML3_A12 regulate cotton fiber development. New Phytol. 2016, 210, 1298–1310. [Google Scholar] [CrossRef] [Green Version]
  61. Wu, H.; Tian, Y.; Wan, Q.; Fang, L.; Guan, X.; Chen, J.; Hu, Y.; Ye, W.; Zhang, H.; Guo, W.; et al. Genetics and evolution of MIXTA genes regulating cotton lint fiber development. New Phytol. 2018, 217, 883–895. [Google Scholar] [CrossRef] [PubMed]
  62. Yang, Z.; Zhang, C.; Yang, X.; Liu, K.; Wu, Z.; Zhang, X.; Zheng, W.; Xun, Q.; Liu, C.; Lu, L.; et al. PAG1, a cotton brassinosteroid catabolism gene, modulates fiber elongation. New Phytol. 2014, 203, 437–448. [Google Scholar] [CrossRef] [PubMed]
  63. Qin, L.X.; Chen, Y.; Zeng, W.; Li, Y.; Gao, L.; Li, D.D.; Bacic, A.; Xu, W.L.; Li, X.B. The cotton beta-galactosyltransferase 1 (GalT1) that galactosylates arabinogalactan proteins participates in controlling fiber development. Plant J. Cell Mol. Biol. 2017, 89, 957–971. [Google Scholar] [CrossRef] [PubMed]
Figure 1. Traits performance of three accessions. (A) Seed cotton weight. (B) Lint weight. (C) Lint percentage. (D) Boll weight. Data are represented as average values. The asterisk symbol (*) indicated reaching a significant level at 5%.
Agronomy 08 00305 g001
Figure 2. Genome-wide landscape of genetic variation in 9053 and sGK9708. From outside to inside: chromosomes, the single nucleotide polymorphisms (SNP) density of 9053, the SNP density of sGK9708, the insertions/deletions (InDel) density of 9053, and the InDel density of sGK9708, respectively. The density of DNA polymorphisms was calculated among all 26 chromosomes of cotton with a 1-Mb window size.
Agronomy 08 00305 g002
Figure 3. Annotation information of SNPs and InDels. The distributions of SNPs (A) and InDels (B) in the intergenic and genic regions of 9053. The distributions of SNPs (C) and InDels (D) in the intergenic and genic regions of sGK9708.
Agronomy 08 00305 g003
Figure 4. The distribution of DNA polymorphisms detected between 9053 and sGK9708. The color of orange and blue represented SNPs (A) and InDels (B), respectively.
Agronomy 08 00305 g004
Figure 5. Expression clusters of genes containing polymorphic SNPs or InDels. The cluster analysis was generated by using the K-mean method on the expression profiles of 3835 genes. The ordinate indicated the values of log2 (FPKM), and the abscissa represented different tissues of cotton, such as root, stem, leaf, −3–35 DPA of ovule development stages and 5–25 DPA of fiber development stages.
Agronomy 08 00305 g005
Figure 6. Physical map of SNPs and InDels which overlapped with the previous reported QTLs about LP and BW in A subgenome. The red line indicated the InDels, the QTL intervals of GWAS study were replaced by the pink color on the chromosomes and the green and brown bar indicated the LP QTLs and BW QTLs producing by QTL mapping study.
Agronomy 08 00305 g006aAgronomy 08 00305 g006b
Table 1. Summary of sequence data and mapping statistics on the reference genome.
SampleTotal ReadsMapped ReadsAverage DepthQ30Coverage (%)
90531,197,221,4881,191,826,52359.988.8998.34
sGK97081,098,196,3381,092,627,18864.3790.8497.73

