Article

Development of Chlorophyll-Meter-Index-Based Dynamic Models for Evaluation of High-Yield Japonica Rice Production in Yangtze River Reaches

1
National Engineering and Technology Center for Information Agriculture, Key Laboratory for Crop System Analysis and Decision Making, Ministry of Agriculture, 1 Weigang Road, Nanjing 210095, China
2
Key Laboratory for Information Agriculture, Jiangsu, Collaborative Innovation Center for Modern Crop Production, Nanjing Agricultural University, 1 Weigang Road, Nanjing 210095, China
3
Key Laboratory of Soil Environment and Pollution Remediation, Institute of Soil Science, Chinese Academy of Science, Nanjing 210008, China
4
Department of Agronomy and Horticulture, University of Nebraska-Lincoln, Lincoln, NE 68583, USA
*
Author to whom correspondence should be addressed.
Submission received: 28 January 2019 / Revised: 15 February 2019 / Accepted: 20 February 2019 / Published: 22 February 2019
(This article belongs to the Special Issue Remote Sensing Applications for Agriculture and Crop Modelling)

Abstract

:
Accurate estimation of the nitrogen (N) spatial distribution of rice (Oryza sativa L.) is imperative when it is sought to maintain regional and global carbon balances. We systematically evaluated the normalized differences of the soil and plant analysis development (SPAD) index (the normalized difference SPAD indexes, NDSIs) between the upper (the first and second leaves from the top), and lower (the third and fourth leaves from the top) leaves of Japonica rice. Four multi-location, multi-N rate (0–390 kg ha−1) field experiments were conducted using seven Japonica rice cultivars (9915, 27123, Wuxiangjing14, Wunyunjing19, Wunyunjing24, Liangyou9, and Yongyou8). Growth analyses were performed at different growth stages ranging from tillering (TI) to the ripening period (RP). We measured leaf N concentration (LNC), the N nutrition index (NNI), the NDSI, and rice grain yield at maturity. The relationships among the NDSI, LNC, and NNI at different growth stages showed that the NDSI values of the third and fourth fully expanded leaves more reliably reflected the N nutritional status than those of the first and second fully expanded leaves (LNC: NDSIL3,4, R2 > 0.81; NDSIothers, 0.77 > R2 > 0.06; NNI: NDSIL3,4, R2 > 0.83; NDSIothers, 0.76 > R2 > 0.07; all p < 0.01). Two new diagnostic models based on the NDSIL3,4 (from the tillering to the ripening period) can be used for effective diagnosis of the LNC and NNI, which exhibited reasonable distributions of residuals (LNC: relative root mean square error (RRMSE) = 0.0683; NNI: RRMSE = 0.0688; p < 0.01). The relationship between grain yield, predicted yield, and NDSIL3,4 were established during critical growth stages (from the stem elongation to the heading stages; R2 = 0.53, p < 0.01, RRMSE = 0.106). An NDSIL3,4 high-yield change curve was drawn to describe critical NDSIL3,4 values for a high-yield target (10.28 t ha−1). Furthermore, dynamic-critical curve models based on the NDSIL3,4 allowed a precise description of rice N status, facilitating the timing of fertilization decisions to optimize yields in the intensive rice cropping systems of eastern China.

1. Introduction

Nitrogen (N) is one of the most important yield-limiting factors [1]. Appropriate N management is essential to achieve relatively high yields with low N input, particularly to ensure maximum rice yield and quality [2,3]. Yield-target-based N fertilization plays an important role when developing profitable and environmentally friendly rice production systems (which is good in environment protection during field production) [4,5]. Accurate and remote in-season estimation of crop N status and its site-specific applications in intensive rice cropping systems is challenging [6]. Rapid, non-destructive, and cost-effective N diagnostic tools are imperative for accurate and timely diagnosis of rice N status at critical growth stages—it is imperative to match N requirements to soil N supply [2,3].
Non-destructive diagnostic strategies use various devices to monitor crop growth and N status [7,8]. A chlorophyll meter (Soil Plant Analysis Development, SPAD-502, Minolta Camera Co., Osaka, Japan) has been widely used for simple, rapid, and non-destructive assessment of leaf chlorophyll concentrations [9], however, the readings are significantly influenced by growth stage, plant leaf position, leaf measurement location, leaf thickness, leaf weight, the cultivar, solar radiation, and environmental stress [1,10,11].
Previous studies sought to correlate specific leaf weight (SLW) with SPAD values and leaf N concentrations (LNC) [12,13], which range from 2–3.2% [4]; multiplying upper leaf SPAD values by the leaf area index (LAI) [14,15], or linking sensor data to the product of SPAD and height [16]. Many researchers have developed SPAD indices [17], including SPAD positional difference sufficiency index [18], a relative SPAD index [19], and a normalized SPAD index [20]. Chlorophyll meter readings have also been linked with digital still canopy color images to improve chlorophyll meter data [13]. However, linking SPAD values to tissue N concentrations remains challenging due to controversies in their reliability [4].
During the plant growth cycle, N and carbon (C) levels are in dynamic balance in crops; this is particularly significant when paddy rice leaves turn from green to yellow [21]. Either an N deficit or excess will retard crop growth. Cropping duration is controlled principally by genotype and N nutritional status. Various rice canopy leaves reflect N status, the color difference between 4LFT (the fourth fully expanded leaf from the top) and 3LFT (the third fully expanded leaf from the top) can be used to diagnose the critical N concentration at the booting stage; this is 27 g kg−1 dry matter weight (DW) for Japonica rice and 25 g kg−1 DW for Indica rice [22]. However, other indices, such as the relative SPAD index (RSI) [23], the difference SPAD index (DSI) [24], the relative difference SPAD index (RDSI) [22,25], and the normalized difference SPAD index [24], have been developed using the SPAD readings of 1LFT (the first fully expanded leaf from the top), 2LFT (the second fully expanded leaf from the top), and 3LFT to assess in-season crop N status. Recently, Yuan et al. reported that the 2LFT, 3LFT, and 4LFT SPAD values were related to various N indicators (e.g., the N nutrition index (NNI) and leaf N accumulation (LNA); the LNC index). The cited authors concluded that the normalized SPAD index of 4LFT (the NSI4) could be used to increase grain yield and nitrogen efficiency [10]. Therefore, SPAD indices of lower leaves are better than those of upper leaves regarding diagnosing rice N status.
Several attempts have been made to establish quantitative relationships between SPAD indicators and the NNIs of C3 and C4 crops [26], such as wheat [24], rice [27], corn [28], barley [29], etc. Given the differences among environmental conditions and genotypes, the relationships between NNI and SPAD values vary greatly. However, the relative SPAD values are not notably influenced by the cultivar, growing season, or growth stage. Calculating relative SPAD values requires the use of a non-N-limiting treatment as a control, reducing the utility of the method regarding on-farm N diagnosis [30]. SPAD value differences among varieties, and variations in production levels, can be eliminated by normalizing experimental data before modeling [31]. Therefore, some studies have used different normalized SPAD index (NDSI) values to reduce the effects of variation. LNCs of lower leaves were more sensitive to increases in N application rate, and SPAD readings of lower leaves were closely related to tissue N concentrations [28,32]. Thus, LNC of lower leaves may better reflect crop N status when N application rates vary. Although efforts have been made to link crop N status to NDSI, no attempt has yet been made to associate NDSI values with the NNI or grain yield of rice, or to establish the relationships between the NNIs and NDSIs of the four topmost fully expanded leaves, on the one hand, and grain yield, on the other.
In recent years, many authors have sought to simulate the crop tiller number (LAI) and other dynamic indicators [31]. Dynamic models of crop growth indices should ideally be universal [33], but labor- and time-consuming due to destructive sampling required for obtaining the LAI, dry matter (DM), tissue N concentration, and other growth parameters. As the LNC correlates strongly with chlorophyll content, SPAD meters have been used as real-time, portable, non-destructive devices for estimating N levels by assessing transmittance [7]. A previous study found that SPAD readings of flag leaves correlated strongly with grain yields at different wheat growth stages, and multiple regression implied that maintenance of optimal leaf chlorophyll content over the interval of 50–75 days after sowing was essential to obtain high yields [34]. To date, few dynamic models based on spectral indices are available. In 2017, Liu et al. reported a double logistic NDVI dynamic model for high-yield production in rice, which can be used to accurately predict canopy NDVI dynamic changes during the entire growth period [35]. Further studies on SPAD index variation regarding the establishment of a SPAD index-based dynamic model are essential for monitoring and diagnosing crop nutritional status in-season.
Therefore, we defined the relationships between NDSI, LNC, and NNI during different growth periods: (1) to accurately access N nutrition status using SPAD-based index, and (2) to draw a dynamic-critical curve showing when yields were lower than required by the NDSI target to guide N fertilizer topdressing, thus aiding rice production in eastern China.

2. Materials and Methods

2.1. Sites and Experimental Design

Yangtze River Reaches is the main rice production region of China, which has a great influence on China’s food security (Huang RH et al., 2002). Yangtze River Reaches is not only the major agricultural regions of China, but also the oldest niche of rice cultivation [36]. China contributes 29% of global rice production, and Yangtze River Reaches alone contributes more than 65% of the national rice production in China [37]. Thus, four field experiments using multi-N rates (0–390 kg N ha−1; N0, N1, N2, N3, N4, N5, N6, and N7 were 0, 130, 150, 225, 260, 300, 375, and 390 kg N ha−1, respectively) were conducted at Jiangning (E 118.98°, N 31.93°) and Wujiang (E 121.28°, N 31.33°) in eastern China from 2007 to 2009, and in 2013. Seven Japonica rice cultivars (9915, 27123, Wuxiangjing14, Wuyunjing19, Yongyou8, Wuyunjing24, Wuxiangjing19) used were the most widely cultivated cultivars in Jiangsu Province; with distinct subspecies and yield potentials. All experiments were conducted using a randomized complete block design with different N treatments and three replications. Details of the cultivars and N application rates are shown in Table 1.
Rice seedlings with three to four fully expanded leaves were transplanted on the 20 June 2007, 25 June 2008, and 26 June 2013, which were raised alone. The hill spacing was 0.30 m × 0.15 m (about 22 hills m−2), with three seedlings per hill in all experiments. Each plot was of 3 m × 6 m in size. N treatment featured 30% N application at the pre-planting stage, and the remaining N was top dressed three times at the tillering (TI, 20%), booting (BT, 30%), and heading (HD, 20%) stages, as urea. In each experiment, 59 kg ha−1 phosphorus as P2O5 and 158 kg ha−1 potassium as K2O were incorporated into each plot before transplantation following local standard rice production practices. Crop management practices at each site followed local recommendations to maximize grain yield (the only limiting factor was N fertilizer). Weeds, diseases, and insects were intensively controlled, as in conventional cultivation, throughout the growing period. Data from Exp. 1, Exp. 2, and Exp. 4 were used for model calibrating, while data of Exp. 3 were used to validate the models.

2.2. Plant Sampling and Measurement; Shoot Biomass, Nitrogen Concentration, and the NNI

Plants collected by randomly clipping 1 m2 from the TI to the ripening period (RP) stages were separated into green leaf blades (leaves) and culm-plus-sheath (stems), oven-dried for 30 min at 105 °C to halt metabolic processes, and then dried at 80 °C in a forced-draft oven until constant weight was attained. Each component was then ground to powder, passed through a 1-mm-diameter sieve in a Wiley mill, and stored at room temperature. Samples (0.2 g) were digested with H2O2 and H2SO4. N concentrations were determined using a continuous-flow auto-analyzer AA3 (Bran + Luebbe; Norderstedt, Germany). Grain yield was measured at maturity by harvesting 1 m2 of crop and drying to a moisture content of 14%. Leaf dry matter levels were measured using this material.

2.3. SPAD Measurements

The chlorophyll meter is a spectral instrument, it measures the difference between the transmittance of a red (650 nm) and an infrared (940 nm) light through the leaf, generating a 3-digit SPAD value, which was used to take SPAD readings from the four uppermost fully expanded leaves of 10 randomly selected plants from each plot. Three SPAD values per leaf, including one value around the midpoint of the leaf blade and two values 3 cm apart from the midpoint, were averaged to give the mean SPAD value of the leaf avoiding the midribs. These measurements were taken at each growth stage and averaged [10]. Chlorophyll meter (SPAD) readings were obtained at six growth stages: TI, stem elongation (SE), panicle initiation (PI), BT, HD, flowering (FL), grain filling (GF), and RP, using a SPAD-502 meter (Minolta Camera Co., Osaka, Japan). SPAD readings were obtained from the four, uppermost fully expanded leaves of 10 randomly selected plants in each plot. The normalized difference SPAD index (NDSI) between LFTi and LFTj used to evaluate N nutritional status was that for wheat developed by Zhao et al. [29], and the equation for other SPAD-based indices is described in Table 2.
NDSILi,j = (SPADi − SPADj)/(SPADi + SPADj)
where SPADi and SPADj are the SPAD readings of leaf positions i and j; i and j vary from 1 to 4, and i < j.

2.4. Data Analysis

2.4.1. Nitrogen Nutrition Index

The NNIs of various rice cultivars at different vegetative growth stages were calculated using the critical N concentration (Nc) values obtained from the Nc dilution curve of rice developed by Ata-Ul-Karim et al. [36], using the following equation:
Nc = 3.53 × W−0.28 (12.37 ≥ W ≥ 1.55 t ha−1; W < 1.55 t ha−1, Nc = 3.05%)
N N I = N a N c
where Nc is the critical rice N, W is the weight of the crop, and Na is the crop N concentration [36].

2.4.2. Calibration of Dynamic-Critical Curve Models

The critical NDSIL3,4 curve of high-yield was in the shape of a sigmoid curve. Different equation models were used to fit the curve, and the Boltzmann model was selected to image the changes of NDSIL3,4, based on the R2 and the relative root mean square error (RRMSE):
y = A 2 + A 1 A 2 1 + e x x 0 d x ,   B o l t z m a n n   m o d e l
where A1 is the vegetative plateau, A2 the reproduction plateau, x0 the x value when NDSIL3,4 = 0, and dx is a time constant. Three high-yield NDSIL3,4 trends were similar as a sigmoid curve. In the NDSIL3,4-based high-yield critical curve, the A1, A2, x0, and dx values differed regarding the NDSIL3,4 trend.

2.4.3. Statistical Analysis

All SPAD data were normalized using the maximum conversion ratio method. Data from each sampling date and year were subjected to analysis of variance using SPSS ver.20.0 software (IBM, Armonk, New York, NY, USA); this software was also used to compare yields. The least significant difference (LSD) test was employed to compare differences between treatment means. GraphPad Prism 5 software (GraphPad Software, San Diego, CA, USA) was used to fit the critical NDSI curve to different grain yields and to compare the intercept and slope of the regression curve at different growth stages. The R2 value and the relative root mean square error (RRMSE, %) were used to explore the predictive accuracy of the model:
RRMSE = i = 1 n ( P i Q i ) 2 n × 100 Q i ¯
where n is the number of samples, Pi the measured values, Qi the predicted values, and the average of Qi. The RRMSE was used to explore agreement between model predictions and measured values.

3. Results

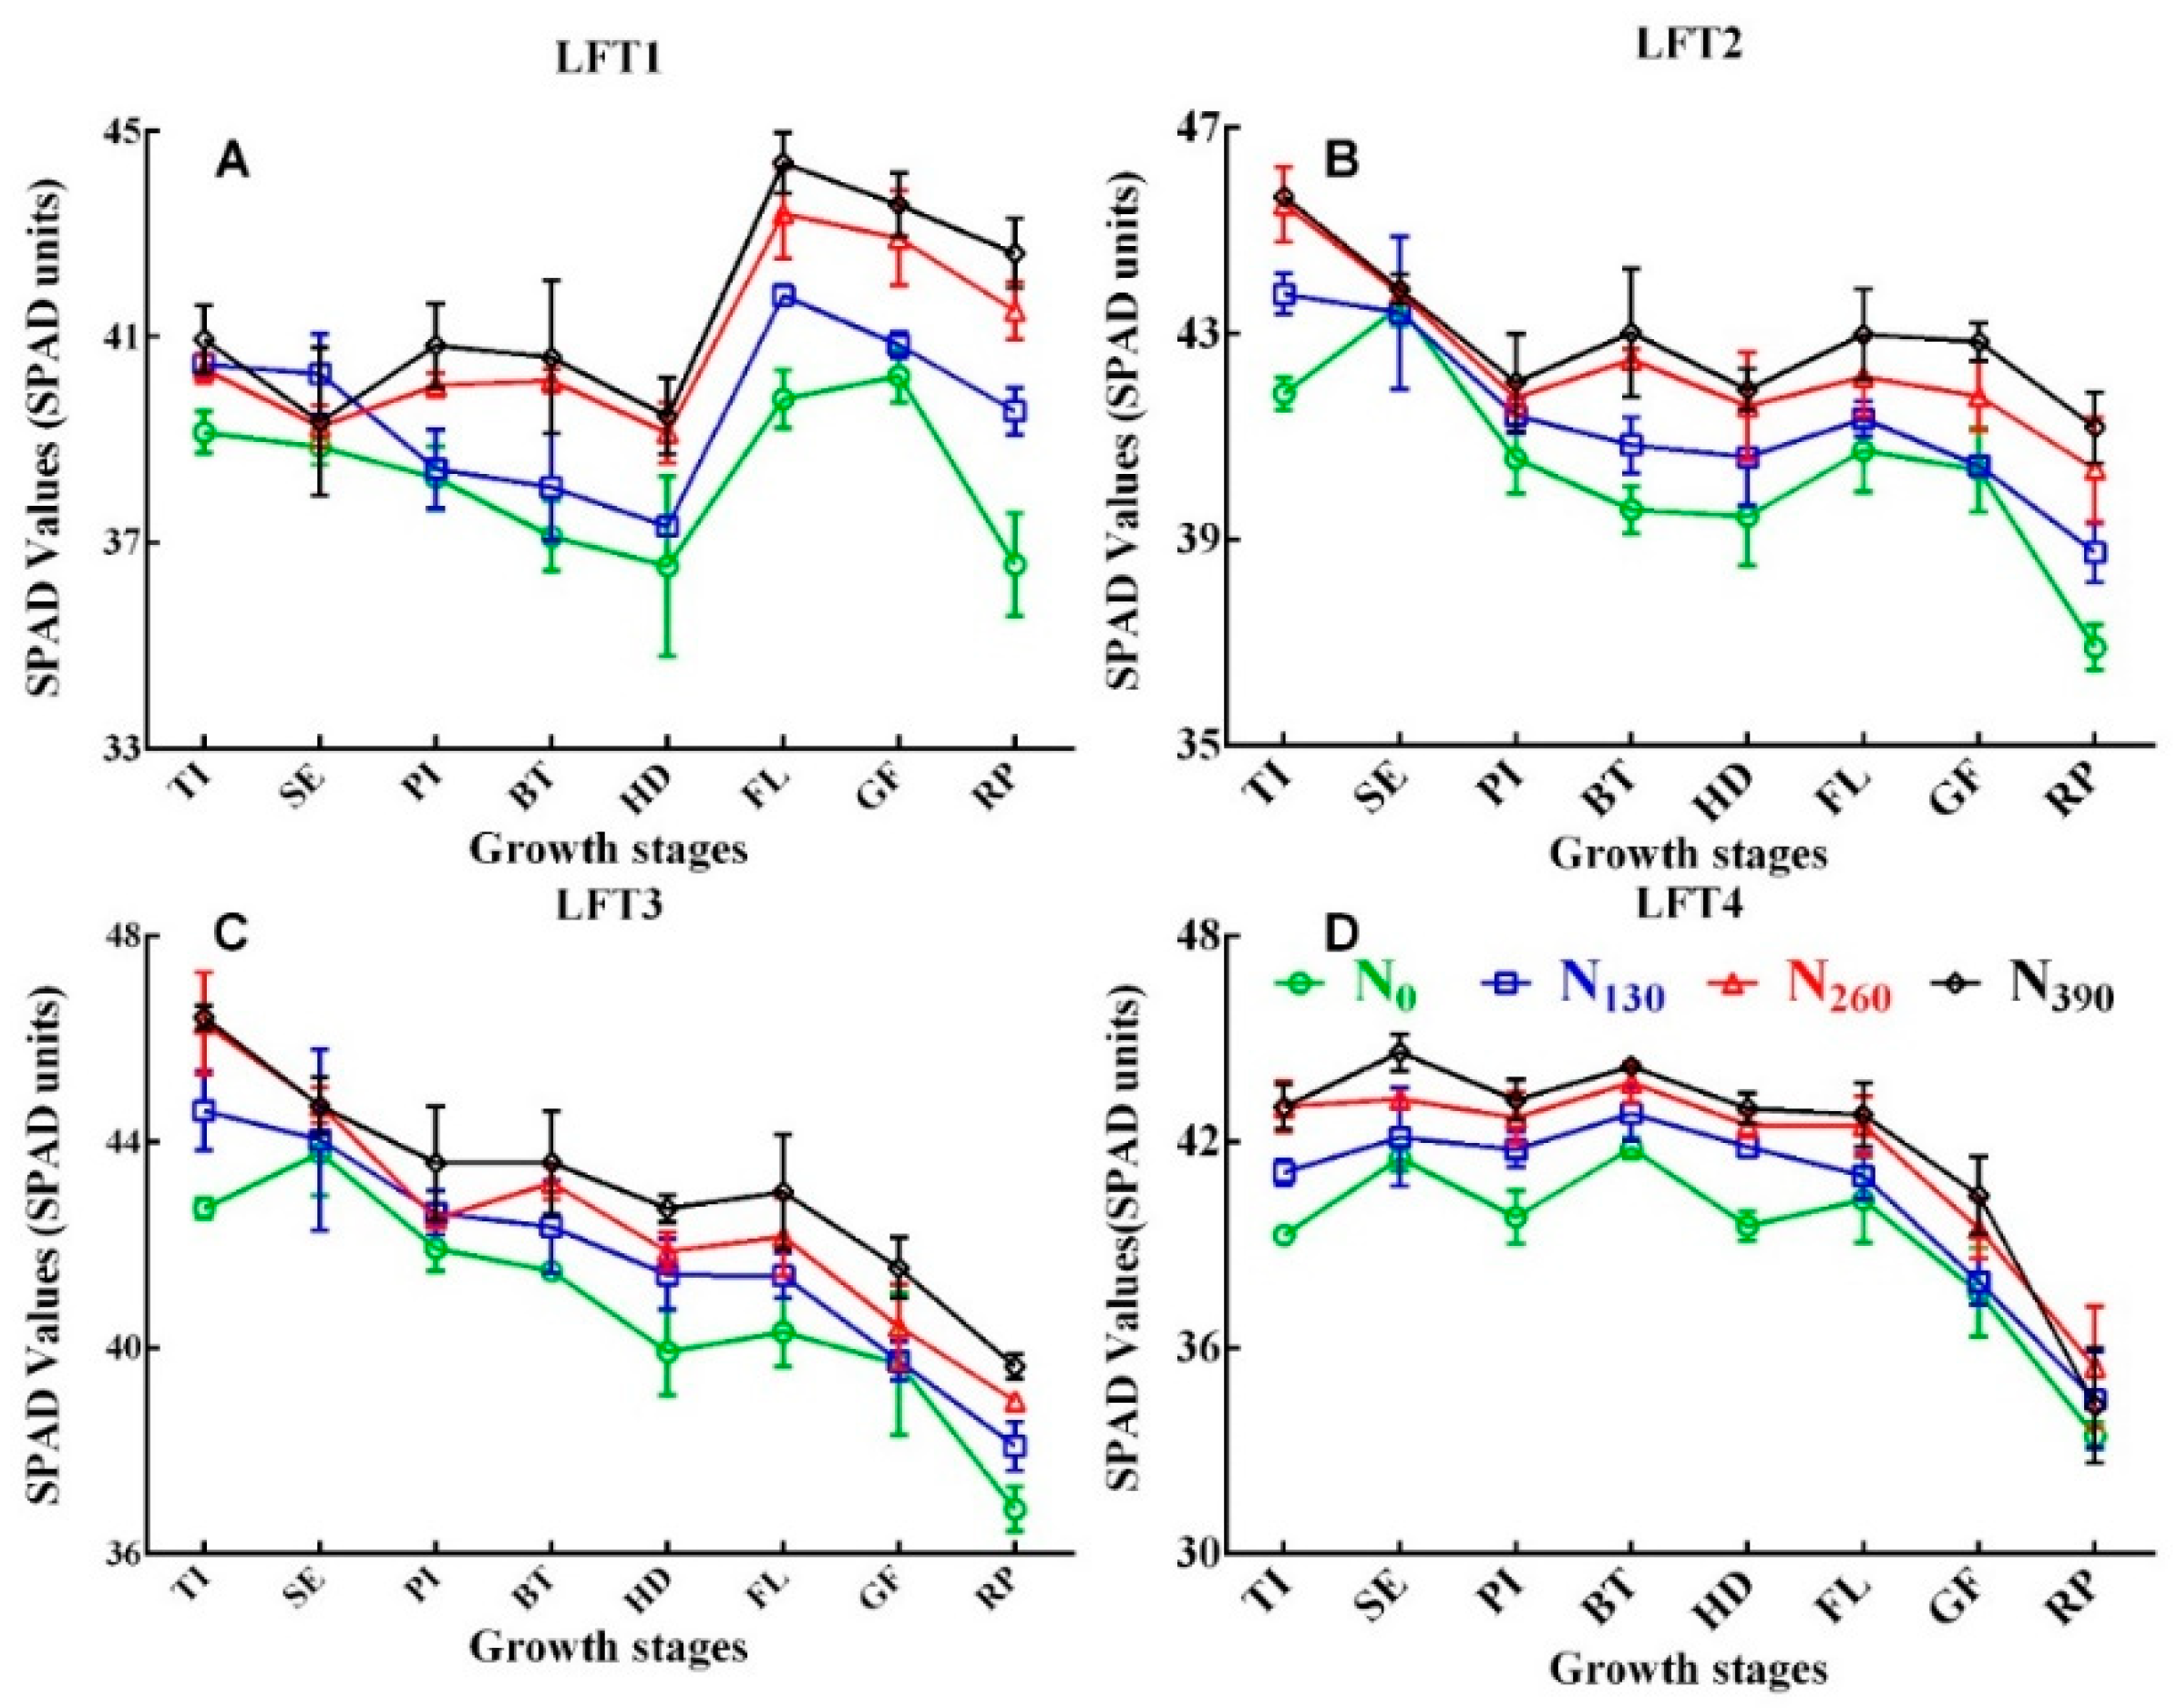
3.1. SPAD Readings of Different Leaves

SPAD readings were measured from the TI to the RP stages under different N treatments. The readings of Japonica rice (27123) increased with increasing N application, and ranged from 34–42 and 40–48 when low, or sufficient N, and excess N were applied, respectively (Figure 1). SPAD reading trends of 1LFT and 2LFT differed greatly from those of 3LFT and 4LFT. The N application rates had no significant effect on the SPAD values of 1LFT and 2LFT, but did affect SPAD values of 3LFT and 4LFT, especially 4LFT. However, a higher N fertilization rate did not significantly change SPAD readings. SPAD reading of 1LFT gradually increased from the TI to the BT and RP stages, in a deformed “S” manner. SPAD reading of 2LFT fell from the TI to the RP stage. SPAD readings of 3LFT and 4LFT were variable from the TI stage to the flowering stage (FL), but then decreased toward the RP stage. Regarding SPAD readings at different N rates, the N0 stage exhibited the lowest readings at every leaf, and the N3 stage the highest. N2 readings were not always greater than those for N1 prior to the 1–3LFT PI stages. Thus, N topdressing fertilizer increased SPAD values and enhanced the stability of the photosynthetic reaction.

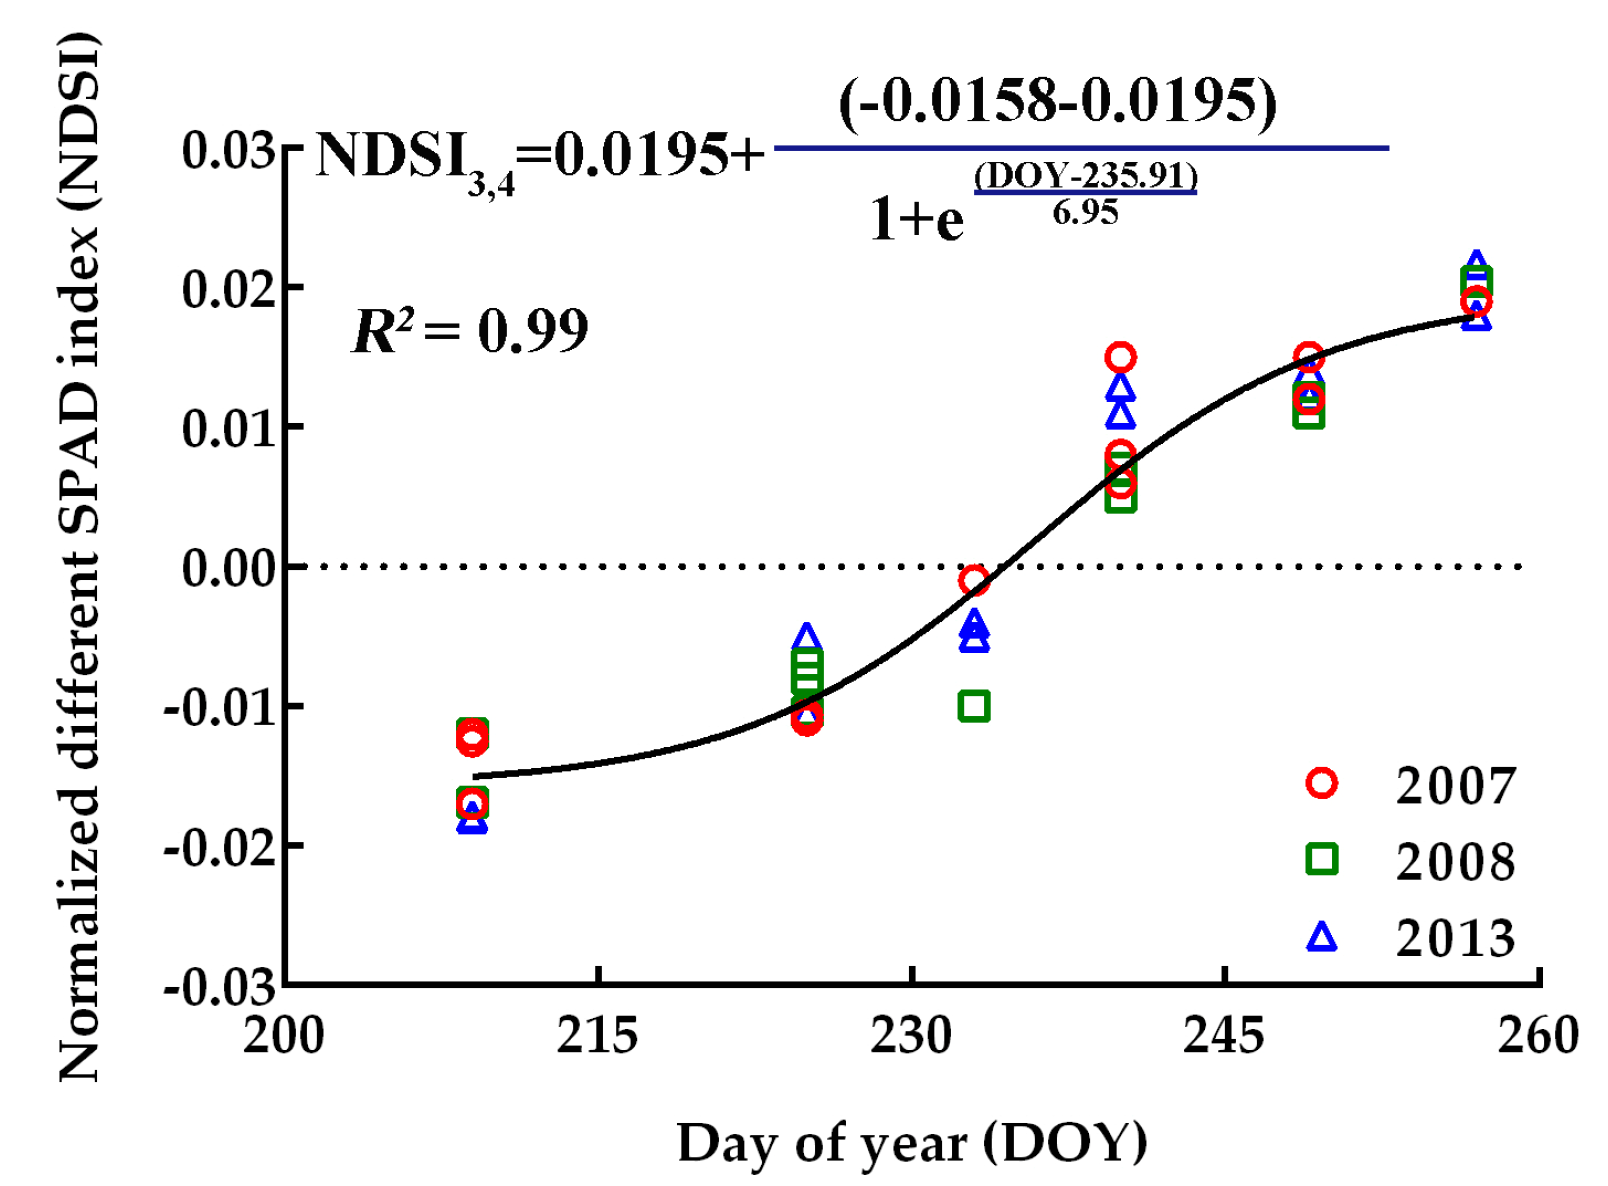
3.2. Differences in the Normalized SPAD Indices

SPAD values were significantly affected by cultivar, growing season, and growth stage. We calculated NDSI values to evaluate leaf performance. Table 3 shows that simple linear SPAD analysis revealed that NDSIL1,3, NDSIL1,4, and NDSIL3,4 did not differ significantly among the seven varieties, showing that SPAD readings were eliminated among variety differences. Furthermore, NDSIL1,3, NDSIL2,3, and NDSIL3,4 values did not differ between the years. Therefore, compared to other SPAD indicators, NDSIL3,4 better compared data from different years or varieties. Simple linear analysis of the seven N rates indicated that all the NDSIL1,3, NDSIL2,3, and NDSIL3,4 differed significantly at the 0.01 probability level. For the various growth stages, all the NDSIL1,3, NDSIL1,4, NDSIL2,3, and NDSIL3,4 differed significantly at the 0.05 or 0.01 probability levels. Thus, NDSIL1,3, NDSIL2,3, and NDSIL3,4 indices can be used to describe the time course of N nutritional status.

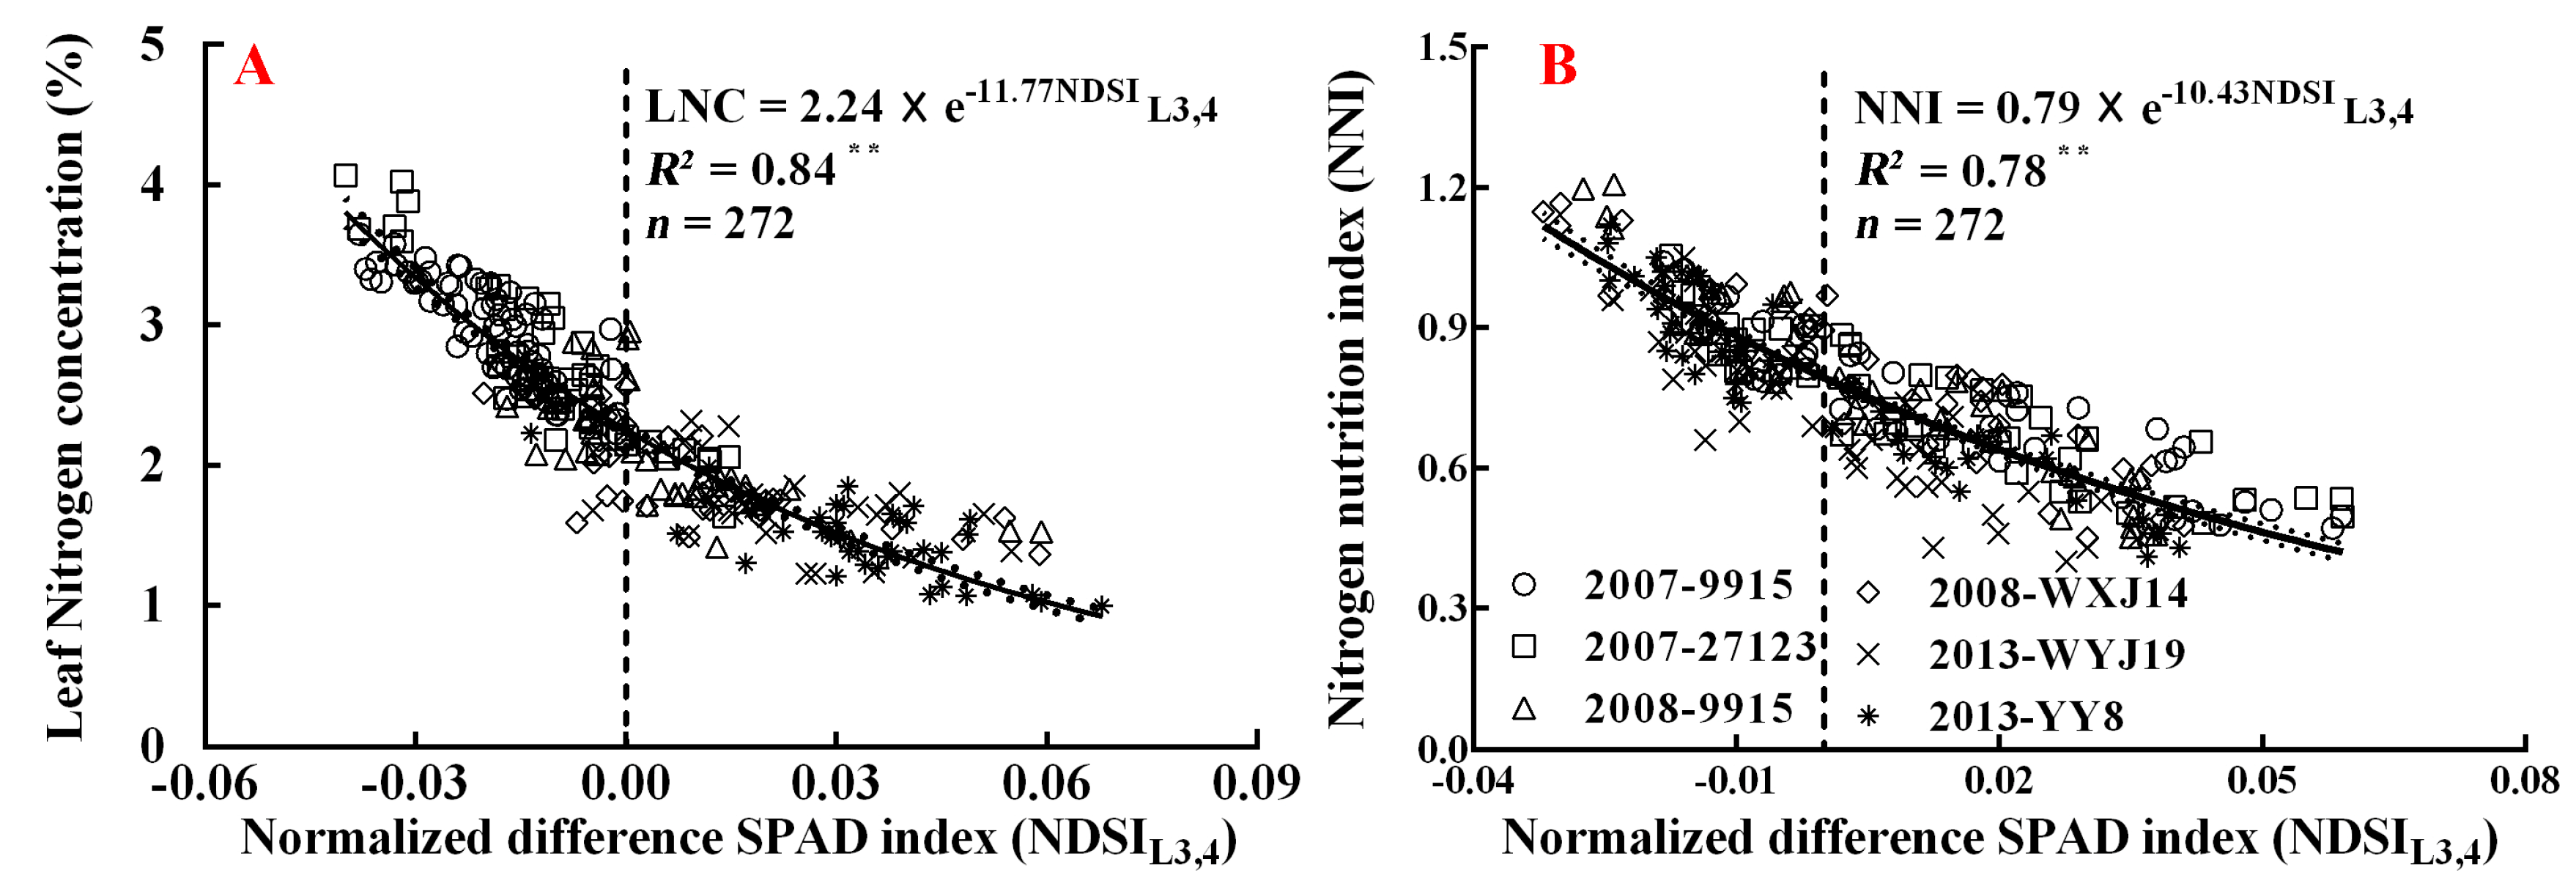
3.3. The Relationship between the NDSILi,j and Leaf N Concentration

Linear relationships were evident between NDSILi,j and LNC, irrespective of growth stage or year (2007, 2008, and 2013; Table 4). NDSIL3,4 exhibited less variability on regression analysis (R2 > 0.82, p < 0.01); lower coefficients of determination (R2) were apparent for the other leaves (0.77 > R2 > 0.06). The standard deviation (SD) ranged from 0.15–0.54; the lowest SD was that of the NDSIL3,4 and the highest were those of NDSIL1,4 and NDSIL2,3. NDSIL3,4 was thus an ideal index for diagnosis of LNC reliability. Thus, we developed an NDSIL3,4-based model to determine LNC (Figure 2A); the variability was 84%, proving that the model afforded good retrieval accuracy (RRMSE = 0.0683; Figure 3a).
In Table 5, using the model equation of NDSILi,j ( LNC = a × e b × NDSI Li , j ), the least significant difference (LSD) test was employed to measure differences in the “a” and “b” parameters among years or varieties. Regarding years, “a” differed significantly among the NDSIL1,2 values, and “b” differed significantly among the NDSIL2,4 values of the various varieties. In Table 5, “a” did not vary among varieties, and “b” did not change with the year. Thus, NDSIL3,4 was an optimal indicator of rice N status.

3.4. Relationships between the NDSILi,j and N Nutrition Index

The NNI is a widely used diagnostic indicator; when NNI = 1, N nutrition is optimal; NNI >1 and NNI <1 indicate excess and deficient N nutrition, respectively. We found a non-linear relationship between the NDSILi,j and the NNI. Table 6 shows that the relationships between NDSILi,j values of the differences among LFTL1,2, LFTL1,3, LFTL3,4, and NNI were more stable than those of differences in the other LFTLi,j values across both the growth stages and the cultivars (0.23 < R2 < 0.84 vs. 0.07 < R2 < 0.16). Regarding the SDs, these ranged from 0.15–0.54; the NDSIL3,4 value was the lowest except in 2013; those of the NDSIL1,4 or NDSIL2,3 were the highest. The SDs were little affected by the LNC model chosen. Compared to the other NDSILi,j values, the NDSIL3,4 was more closely related to the NNI in both of the earlier years. We created a diagnostic model using the NDSIL3,4 values (Figure 2B). The NDSIL3,4 explained 78% of the variability in the NNI; thus, the NDSIL3,4 predicted N status (RRMSE = 0.0688; Figure 3b).
Table 5 also shows a simple exponential function regression exercise, grouping the fitted curves between SPAD values at different positions and the rice NNI. The exponential regression equation is ( NNI = a × e b × NDSI Li , j ). N either “a” nor “b” was influenced by year or variety, except for the “a” of NDSIL1,4 (which varied by variety). The NDSIL3,4 residual was the smallest of all leaves. Thus, Table 5 shows that NDSIL3,4 was the optimal indicator of rice N status.

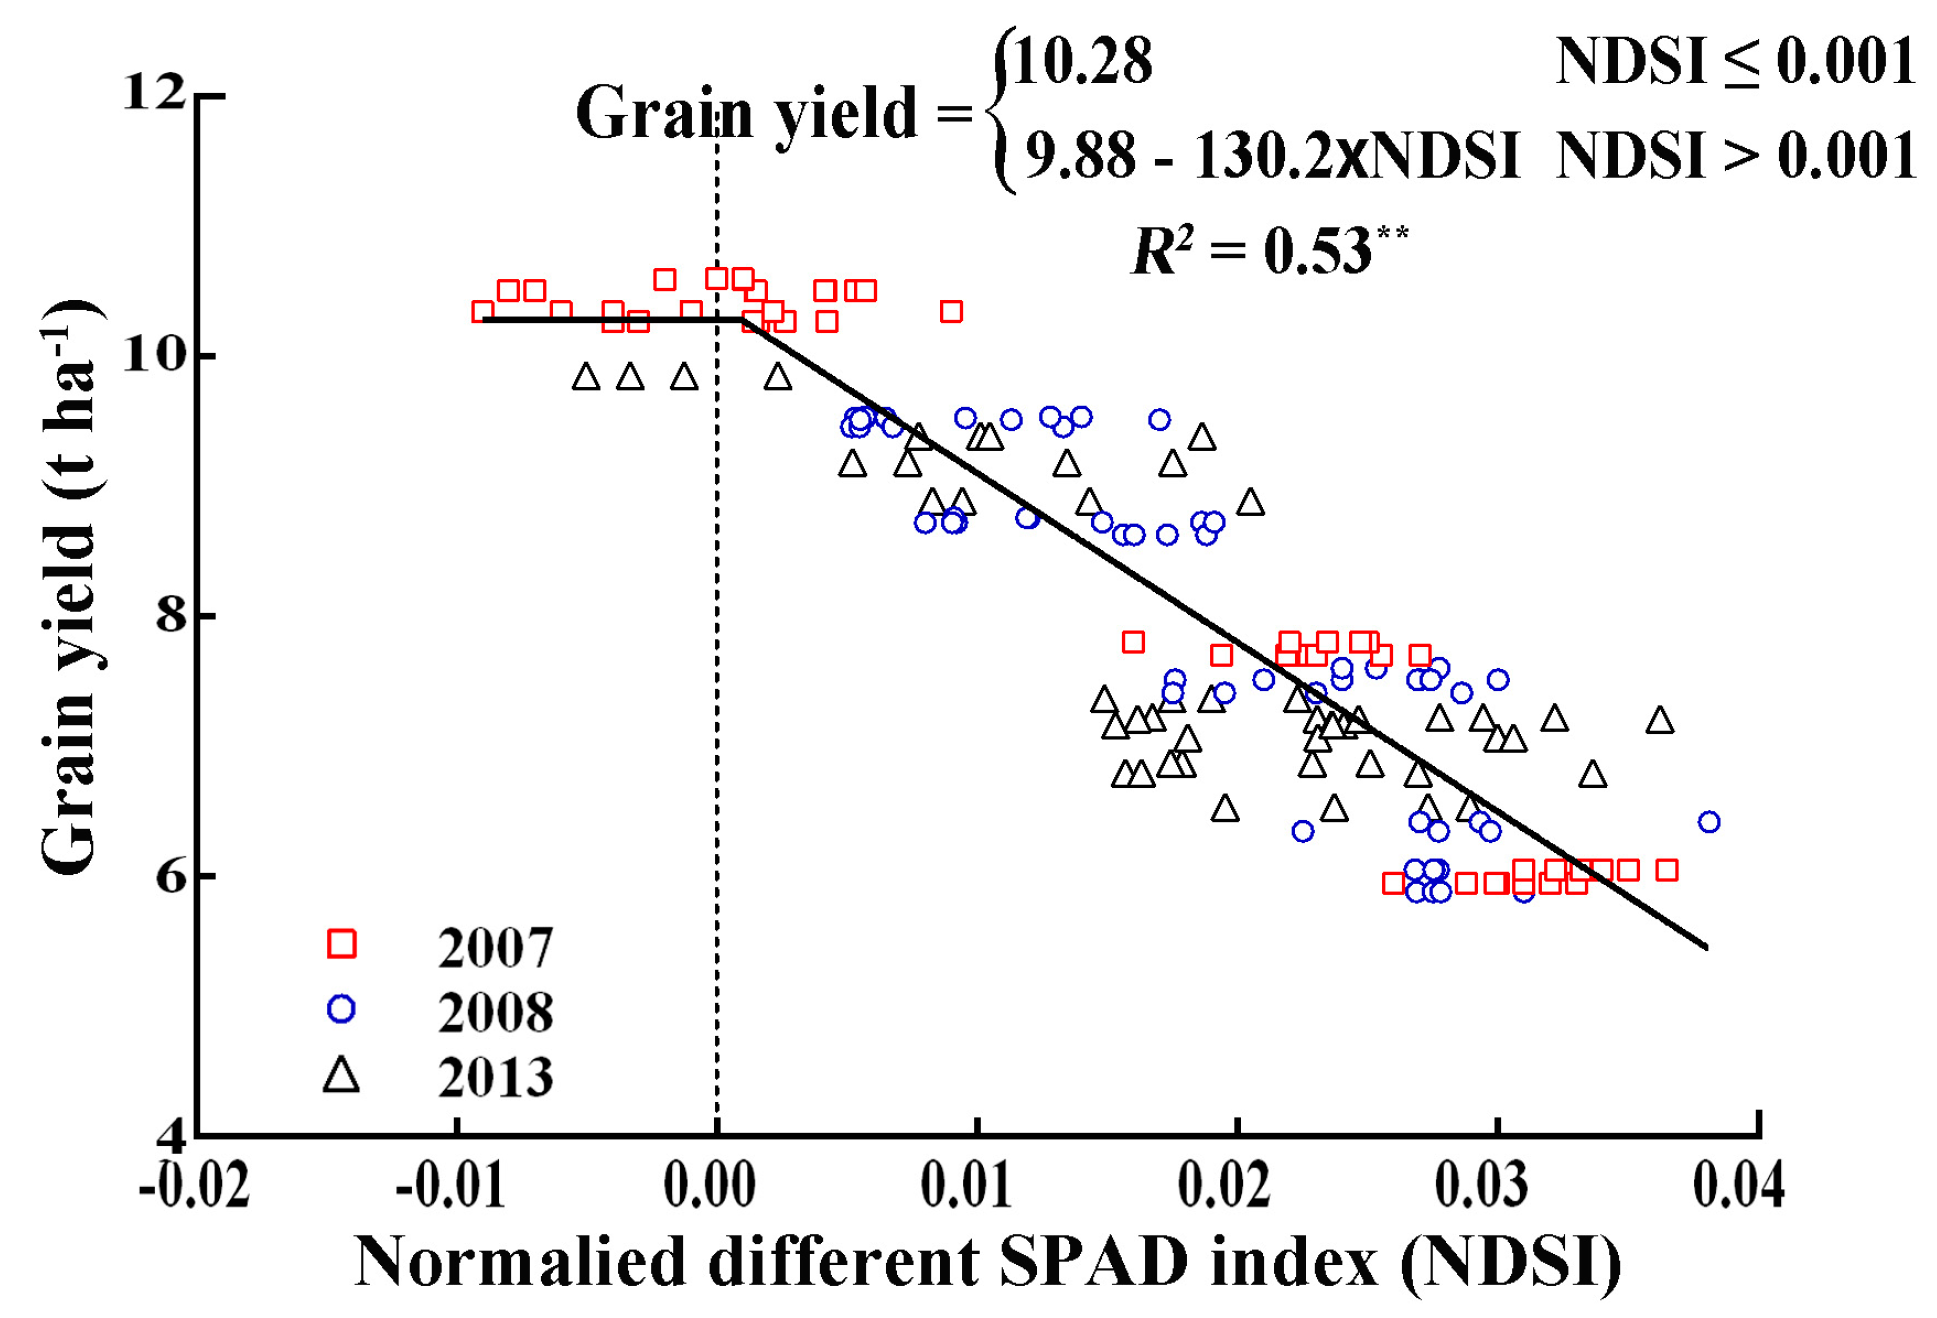
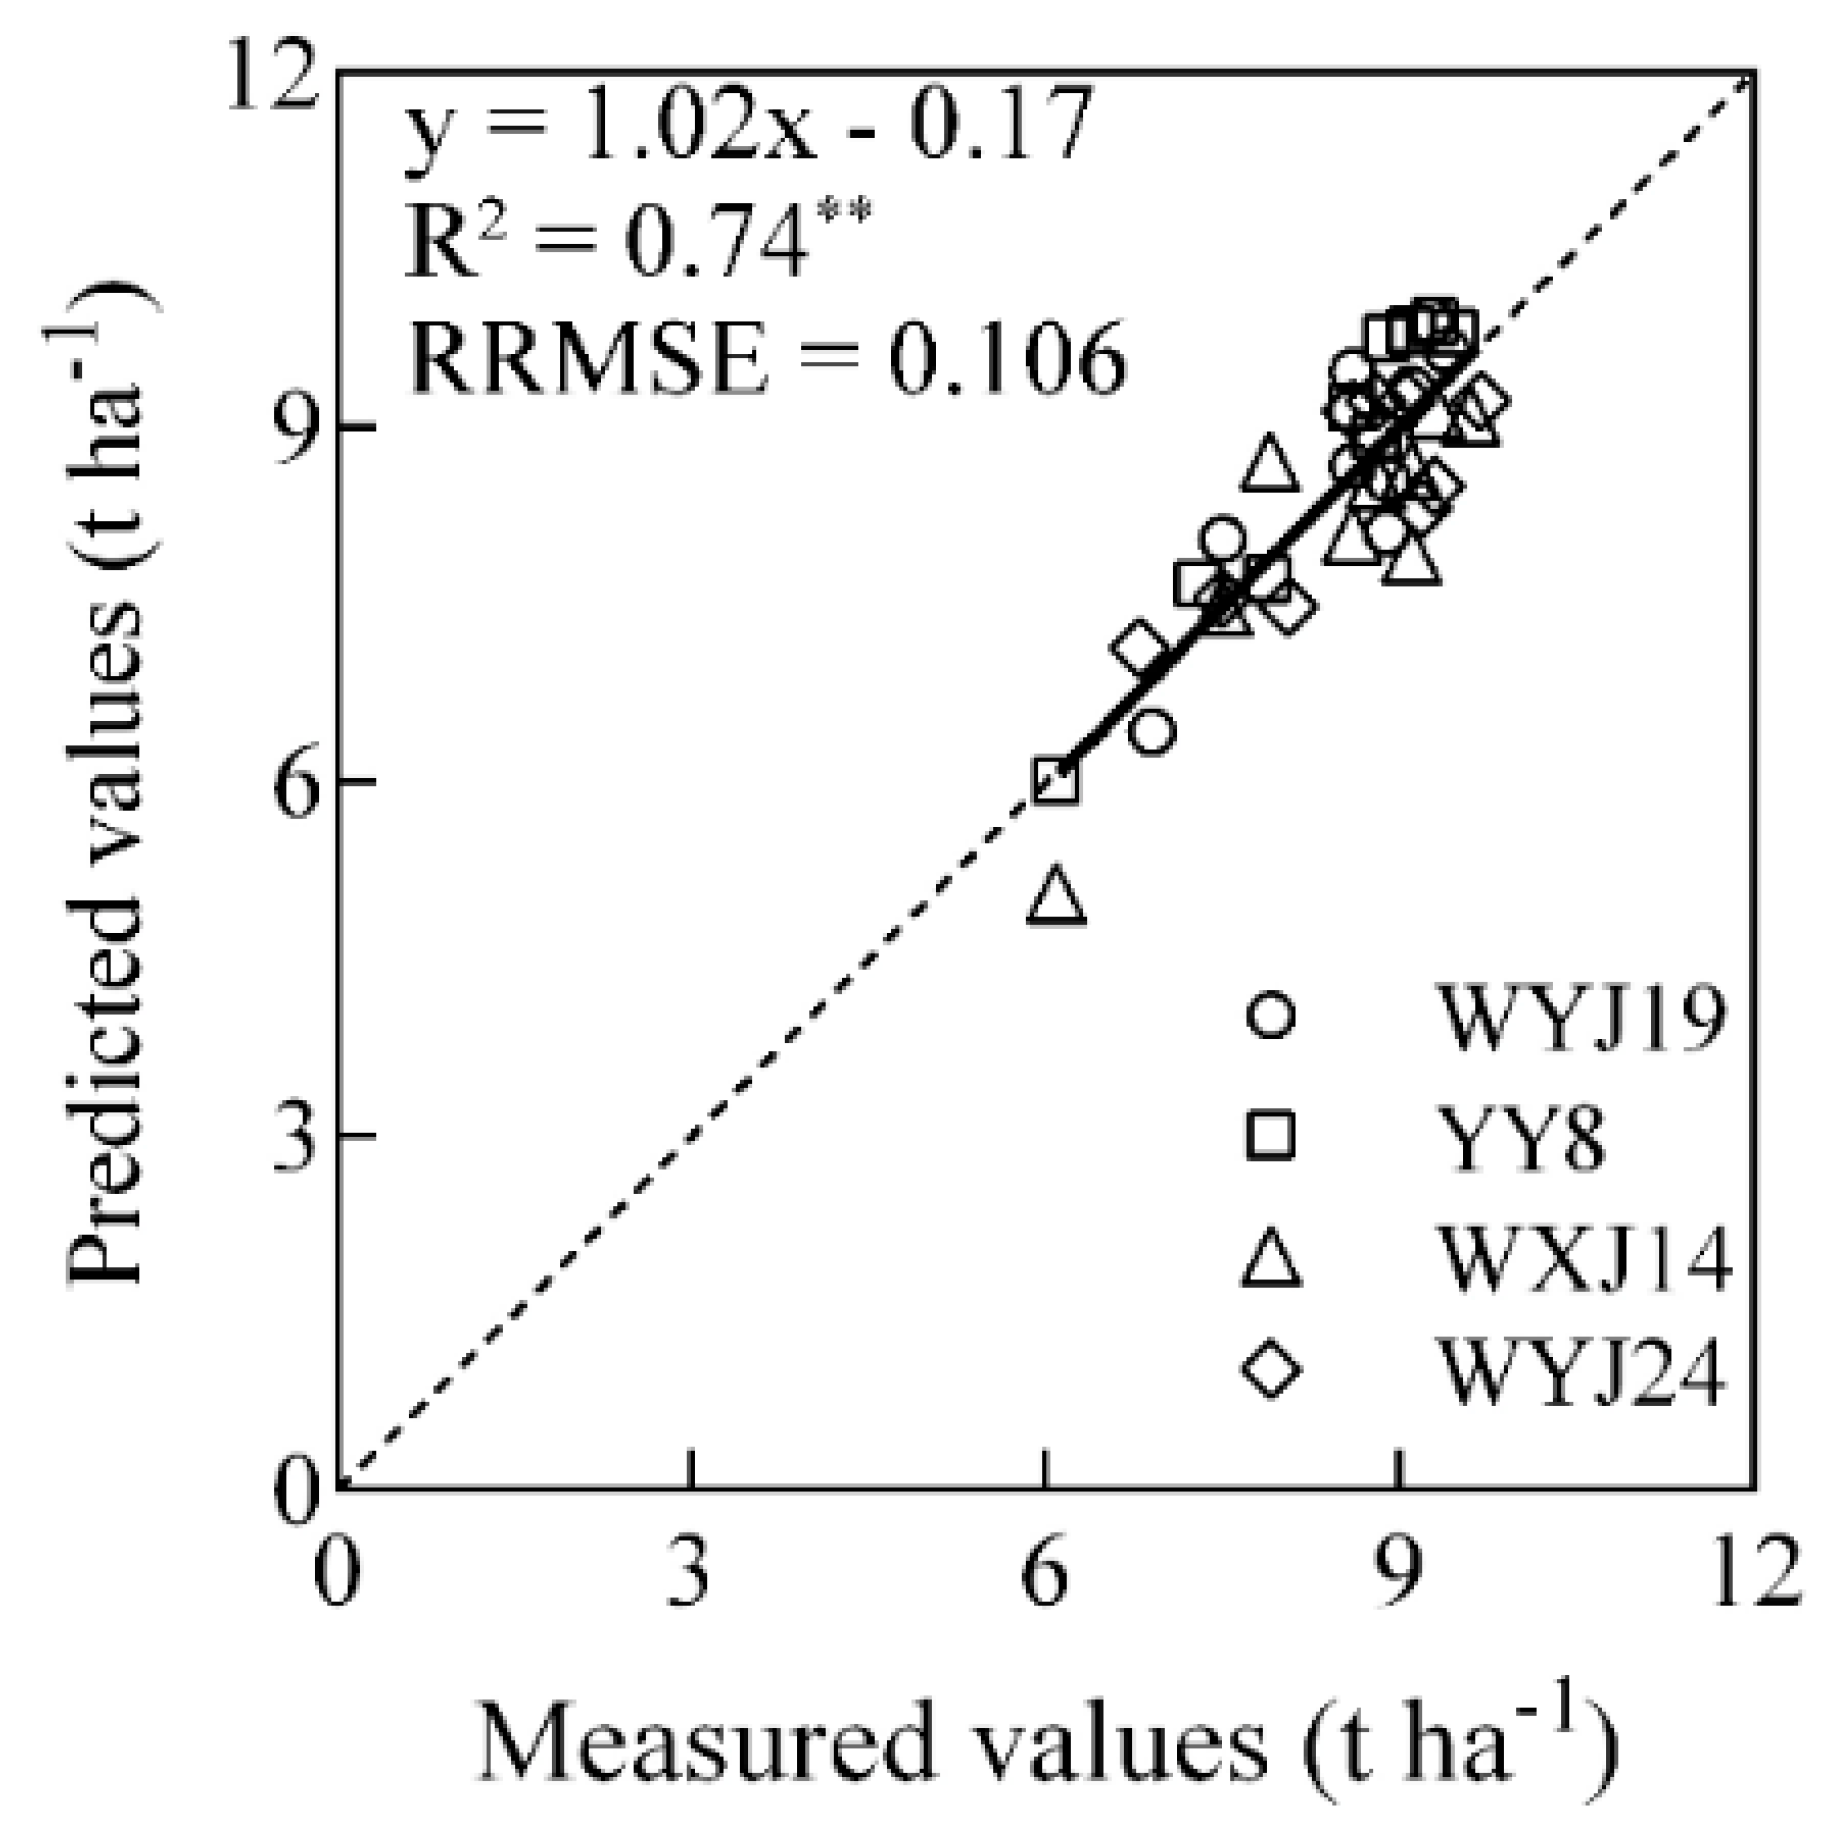
3.5. The Relationship between NDSIL3,4 and Grain Yield

Grain yield was positively associated with the NDSIL3,4 (Table 7), especially from the SE to HD stages. In Table 7, the linear regressions between grain yield and NDSIL3,4 values at varying N addition rates for all growth stages are plotted; we used data from Experiments 1, 2, and 4. The coefficients of determination of the SE-to-HD stages tended to be higher than those of the TI and FL stages. Thus, the NDSIL3,4 value was related to grain yield during the SE-to-BT stages, accounting for 53% of the variation (Figure 4). The plateau/linear relationship showed that grain yield decreased linearly with the NDSIL3,4 value when that value was >0.001 for paddy rice; at which time the yield approached 10.28 t·ha−1.
Table 8 shows results of the differential function models fitted. The results showed that most models had relatively high R2 (0.88 < R2 < 0.99), low RRMSE values (16% < RRMSE < 30%), and high F-value (113 < F < 266; the higher F-value means model fitting). The equation in the shape of the sigmoid curve obtained the higher R2 and low RRMSE values. The Boltzmann model performed the best among all regression models. Therefore, given y = A 1 + A 1 A 2 1 + e x x 0 d x (Boltzmann model) during SE-to-HD stages is critical in terms of high yield. We had many data points from SE to GF; we covered all the critical growth stages. Our studied varieties constitute distinct subspecies; all are high-yielding. Next, we created a dynamic model based on a high-yield (10.28 t·ha−1) NDSIL3,4 value (Figure 4). In the NDSIL3,4-based high-yield critical curve, the A1, A2, x0, and dx values differed in terms of the NDSIL3,4 trend. In the high-yield critical curve, the day of the year (DOY) 205 to 220 (SE) was the vegetative plateau; vegetative and reproductive growth was in describe from DOY220 to DOY250 (thus from PI to BT), and DOY250 was the start of the reproductive stage. When stress develops, N is the pivotal factor limiting grain filling; we found that the NDSIL3,4 reliably indicated rice N nutrition.

3.6. Use of the NDSIL3,4 Curve for N Management

Estimation of the in-season N requirement (NR) is essential for the management of N topdressing during paddy rice production. However, we found that topdressing at critical growth stages (the SE–HD stages) did not support N management at every growth stage. Therefore, we developed an NDSIL3,4 change curve for high-yield, topdressing N management at critical growth stages. We used this curve to first determine NDSIL3,4 values (Figure 4) for the in-season N nutritional status of Japonica rice and a high-yield target, and then calculated ΔNNI values by evaluating quantitative relationships between the NDSIL3,4 and NNI (Figure 2). Finally, the N fertilizer requirement for Japonica rice was modeled as suggested by Ata-Ul-Karim et al. [2]. This fertilization decision support method precisely estimates crop growth, grain yield, and the NR time-course (an N management strategy). However, the tool cannot be implemented in the early (active) TI stage. Moreover, our N fertilizer topdressing management strategy needs to be tested in other cultivars and rice growing regions to test its reliability for predicting grain yield and crop N status. This section may be divided by subheadings. It should provide a concise and precise description of the experimental results, their interpretation as well as the experimental conclusions that can be drawn.

4. Discussion

The present study analyzed the N nutrient status of rice leaves, determining SPAD values in four field experiments distributed in the Yangtze River Reaches. We examined N distribution by evaluating color differences between upper and lower leaves, and via differential diagnosis of rice N status. A previous study found that chlorophyll content reflected N nutritional status, but was significantly influenced by variety, site, and year of experimentation [31]. A previous study indicated that data normalization prior to modeling eliminated differences caused by variety, soil types, and management strategies, etc. [30]. Therefore, NDSILi,j indicators can be used to correct traditional SPAD indicators. Most previous studies used threshold SPAD indicators during critical growth periods to diagnose N nutritional status [18]. However, most of the monitoring methods such as saturation index (SI) or NNI were mainly based on the single test of each growth stage [38]. These methods were mostly related to accessing the relationship with poor mechanism, using indicators with the complex calculation methods [39]. In addition, the existence of deviation in the identification of growth stage, environmental factors, time selection also have a greater impact on the single test. However, the single measured value was treated as each stage in the calculation, which results in a greater deviation from the actual value [40]. This minimizes field management but does not consider cropping duration. Thus, a dynamic model incorporating cropping duration, not only the critical growth stages, is better. Such models optimally display nutritional status over time, best-supporting careful agriculture.
We found a better relationship between NDSIL3,4 and the N indicators (pooled data from five varieties in Exp. 1, 2, and 4) than between any other combination of NDSILi,j, and the N data, probably due to the non-linear regressions between NDSILi,j and the N indicators varied over three years at the different sites. We found considerable differences between the linear regression coefficients of SE, PI, and BT stages. When the 3-year data (2007, 2008, and 2013) were pooled, R2 decreased considerably because of significant regression slopes during different growth periods for the various varieties at different sites in different years. Such results showed that both the growth stage and leaf position significantly influenced NDSILi,j values. The relationships between 4LFT and NSI4 were a linear/plateau in nature, from the SE to the BT periods. Prost and Jeuffroy indicated that the 1LFT showed poor defined relationship with N indicators, this might be due to the time difference in maturity of the first expanded leaves, due to these differences and wide variation in 1LFT [41]. Wang et al. reported that the lower leaf (3,4LFT) responded more to nitrogen supply than upper leaf (1,2LFT), and also suggested that lower leaf (4LFT) could be the ideal sample leaf for diagnosis of plant nitrogen nutrition [18]. Yuan et al. also proved that lower leaves afforded more reliable estimations of crop N status [17].
At the same target yield, different varieties require very different N topdressing. A previous study revealed that rice grain yield was positively associated with the SPAD readings of 4LFT, but the intercepts of the response curves of grain yield (as a function of SPAD value) differed markedly for the two varieties studied (Xiushui 63 and Hang 43) [27]. It has been reported that use of the NSI4 increased grain yield and N use efficiency compared to 4LFT. This may vary by cultivar and site conditions [17]. The cited authors identified the most sensitive stages at which to measure N nutrition and grain yield, and then created optimal fertilization prescriptions. However, such methods cannot diagnose N status in real time. Attempts have been made to estimate grain yield based on dynamic LAI models [42]. The LAI had the highest, positive indirect effects on grain yield, as measured by kernel number per spike, but it was difficult to describe the physiological condition of the crop directly. Wang et al. reported that SPAD measured the difference between 4LFT and 3LFT [43]. Color differences between these leaves could be used to determine N concentrations [21]. However, all models used to diagnosis N nutrition status or grain yield operate only in the critical growth period of rice [15,17]. If crop parameters are to be monitored, nutritional status should be diagnosed and regulated by simulating the dynamic changes of SPAD indicators appropriate for paddy rice. To date, few studies have sought to establish dynamic models based on spectral indices [35].
Further research on variations in such indices and establishment of index-based dynamic models is necessary to monitor the nutrition of late crops and for dynamic diagnosis [31,44]. We attempted to solve this problem by establishing NDSIL3,4 change curves for a high-yield target, thus slightly higher than that of the high-yield rice cultivars grown Yangtze River Reaches [31]. In Figure 4 we established the relationship between NDSIL3,4 and grain yield, and comprehensive comparisons of the simulated and observed values at critical growth stages revealed that the slope was 1.02, the R2 = 0.74, and RRMSE = 0.106 (Figure 5).
We developed a dynamic NDSIL3,4 model based on a high-yield target (Figure 6) to display the critical change trends. Using the high-yield dynamic model, it is possible to guide N fertilizer rice topdressing efficiently during the critical N growth period (from the SE to the HD). Some authors have used a spectral index or a nitrogen indicator to manage N fertilizer topdressing at critical growth stages [2,45]. N-deficient fields subject to intensive N-regulation become N-sufficient fields after application of local agricultural practices, increasing potential production. Our model allows detection of not only deficient N nutrition, but also excess N nutrition; there is no requirement for N-saturation. However, more data are needed for assessing the reliability of the model in different rice production areas.

5. Conclusions

4LFT SPAD values measured using a chlorophyll meter correlated significantly with rice LNC and NNI values. The NDSIL3,4 difference between the third and fourth LFT [NDSIL3,4 = SPAD3 − SPAD4/(SPAD3 + SPAD4)] could be used to improve LNC and NNI estimations compared to those afforded by isolated SPAD readings and the differences between other leaf positions. We have developed two universal NDSIL3,4 based diagnostic models (from the TI to the RP). Both models can be used for effective diagnosis of the LNC (R2 > 0.81, p < 0.001) and NNI (R2 > 0.83, p < 0.01) with a reasonable distribution of residuals (LNC: RRMSE = 0.0683; NNI: RRMSE = 0.0688; p < 0.01). To optimize N topdressing for Japonica rice, we first established the relationship between the NDSIL3,4 and grain yield to predict the yield during the SE-to-HD stages. Secondly, a new, critically dynamic NDSIL3,4 model was developed based on the previous experiments. Thirdly, the ΔNNI was estimated using both a dynamic model and the NNI–NDSIL3,4 model. Finally, the N requirement was determined using the NNI model developed by Ata-Ul-Karim et al. [3]. However, parameters of the newly developed model may require adjustment under varied conditions caused by different climatic features, etc. The robustness and sensitivity of the model should be further tested using data from different rice production region.

Author Contributions

K.Z., Y.T., and X.L. conceived and designed the experiments, S.T.A.-U.-K., J.L., and S.L. performed experiments, Q.C., Y.Z., K.Z., and X.L. analyzed the data, K.Z., X.L., and Y.T. wrote the paper, W.C. and B.K. provided advice and edited the manuscript.

Funding

This work was financially supported by the National Key Research & Development Program of China (2018YFD0300805; 2016YFD0300604; 2016YFD0200602), the Science and Technology Support Program of Jiangsu [grant No.: BE2016375], the Fundamental Research Funds for the Central Universities (No.: 262201602) and the 111 project (B16026).

Acknowledgments

The authors also thank the anonymous reviews for their constructive comments and suggestions. The first author also thanks Xiaofang Duan for her support and love all the time.

Conflicts of Interest

The authors declare no competing financial interests.

Abbreviations

TITillering
RPRipening period
BTBooting
HDHeading
SEStem elongation
PIPanicle initiation
FLFlowering
GFGrain filling
SPADSoil and plant analysis development
NDSINormalized Different SPAD values
RSIRelative SPAD index
DSIDifference SPAD index
RDSIRelative difference SPAD index
NNINitrogen Nutrition Index
LNCLeaf Nitrogen concentration
LAILeaf Area Index
DWDry matter weight
SSNMSite-Specific Nitrogen Management
NUENitrogen Use Efficiency
DATDay after Transplanting
RRMSERelative root mean square error
LSDLeast significant difference
LFTThe position on upper fully expanded Leaf From the rice Top

References

  1. Zhao, B.; Ata-Ul-Karim, S.T.; Duan, A.; Liu, Z.; Wang, X.; Xiao, J.; Liu, Z.; Qin, A.; Ning, D.; Zhang, W. Determination of critical nitrogen concentration and dilution curve based on leaf area index for summer maize. Field Crop. Res. 2018, 228, 195–203. [Google Scholar] [CrossRef]
  2. Ata-Ul-Karim, S.T.; Liu, X.; Lu, Z.; Zheng, H.; Cao, W.; Zhu, Y. Estimation of nitrogen fertilizer requirement for rice crop using critical nitrogen dilution curve. Field Crop. Res. 2017, 201, 32–40. [Google Scholar] [CrossRef]
  3. Ata-Ul-Karim, S.T.; Zhu, Y.; Liu, X.; Cao, Q.; Tian, Y.; Cao, W. Comparison of different critical nitrogen dilution curves for nitrogen diagnosis in rice. Sci. Rep. 2017, 7, 42679. [Google Scholar] [CrossRef] [PubMed] [Green Version]
  4. Ataulkarim, S.T.; Liu, X.; Lu, Z.; Yuan, Z.; Yan, Z.; Cao, W. In-season estimation of rice grain yield using critical nitrogen dilution curve. Field Crop. Res. 2016, 195, 1–8. [Google Scholar]
  5. Ge, H.X.; Zhang, H.S.; Zhang, H.; Cai, X.H.; Song, Y.; Kang, L. The characteristics of methane flux from an irrigated rice farm in East China measured using the eddy covariance method. Agric. For. Meteorol. 2018, 249, 228–238. [Google Scholar] [CrossRef]
  6. Yousaf, M.; Li, X.; Zhang, Z.; Ren, T.; Cong, R.; Ata-Ul-Karim, S.T.; Shah, F.; Shah, A.N.; Lu, J. Nitrogen fertilizer management for enhancing crop productivity and nitrogen use efficiency in a rice-oilseed rape rotation system in China. Front. Plant Sci. 2016, 7, 1496. [Google Scholar] [CrossRef]
  7. Ata-Ul-Karim, S.T.; Cao, Q.; Zhu, Y.; Tang, L.; Rehmani, M.I.; Cao, W. Non-destructive assessment of plant nitrogen parameters using leaf chlorophyll measurements in rice. Front. Plant Sci. 2016, 7, 1829. [Google Scholar] [CrossRef]
  8. Wang, W.; Yao, X.; Yao, X.F.; Tian, Y.C.; Liu, X.J.; Ni, J.; Cao, W.X.; Zhu, Y. Estimating leaf nitrogen concentration with three-band vegetation indices in rice and wheat. Field Crop. Res. 2012, 129, 90–98. [Google Scholar] [CrossRef]
  9. Markwell, J.; Osterman, J.C.; Mitchell, J.L. Calibration of the Minolta SPAD-502 leaf chlorophyll meter. Photosynth. Res. 1995, 46, 467–472. [Google Scholar] [CrossRef]
  10. Yuan, Z.; Qiang, C.; Ke, Z.; Ata-Ul-Karim, S.T.; Tian, Y.; Yan, Z.; Cao, W.; Liu, X. Optimal leaf positions for spad meter measurement in rice. Front. Plant Sci. 2016, 7, 719. [Google Scholar] [CrossRef]
  11. Muñoz-Huerta, R.F.; Guevara-Gonzalez, R.G.; Contreras-Medina, L.M.; Torres-Pacheco, I.; Prado-Olivarez, J.; Ocampo-Velazquez, R.V. A review of methods for sensing the nitrogen status in plants: Advantages, disadvantages and recent advances. Sensors 2013, 13, 10823. [Google Scholar] [CrossRef] [PubMed]
  12. Peng, S.; García, F.V.; Laza, R.C.; Cassman, K.G. Adjustment for specific leaf weight improves chlorophyll meter’s estimate of rice leaf nitrogen concentration. Agron. J. 1993, 85, 987–990. [Google Scholar] [CrossRef]
  13. Wang, Y.; Wang, D.; Shi, P.; Omasa, K. Estimating rice chlorophyll content and leaf nitrogen concentration with a digital still color camera under natural light. Plant Methods 2014, 10, 36. [Google Scholar] [CrossRef] [PubMed] [Green Version]
  14. Gitelson, A.A.; Viña, A.; Ciganda, V.; Rundquist, D.C.; Arkebauer, T.J. Remote estimation of canopy chlorophyll content in crops. Geophys. Res. Lett. 2005, 32, 93–114. [Google Scholar] [CrossRef]
  15. Zhang, K.; Ge, X.; Liu, X.; Zhang, Z.; Liang, Y.; Tian, Y.; Cao, Q.; Cao, W.; Zhu, Y.; Liu, X. Evaluation of the chlorophyll meter and GreenSeeker for the assessment of rice nitrogen status. In Proceedings of the 11th European Conference on Precision Agriculture (ECPA 2017), Edinburgh, UK, 16–20 July 2017; Volume 8, pp. 359–363. [Google Scholar]
  16. Sudduth, K.A.; Kitchen, N.R.; Drummond, S.T. Nadir and oblique canopy reflectance sensing for n application in corn. Liccosec 2011, 7, 162–172. [Google Scholar]
  17. Yuan, Z.; Ata-Ul-Karim, S.T.; Cao, Q.; Lu, Z.; Cao, W.; Zhu, Y.; Liu, X. Indicators for diagnosing nitrogen status of rice based on chlorophyll meter readings. Field Crop. Res. 2016, 185, 12–20. [Google Scholar] [CrossRef]
  18. Wang, S.; Zhu, Y.; Jiang, H.; Cao, W. Positional differences in nitrogen and sugar concentrations of upper leaves relate to plant N status in rice under different N rates. Field Crop. Res. 2006, 96, 224–234. [Google Scholar] [CrossRef]
  19. Ziadi, N.; Bélanger, G.; Claessens, A.; Lefebvre, L.; Tremblay, N.; Cambouris, A.N.; Nolin, M.C.; Parent, L.É. Plant-based diagnostic tools for evaluating wheat nitrogen status. Crop Sci. 2010, 50, 2580–2590. [Google Scholar] [CrossRef]
  20. Hussain, F.; Bronson, K.F.; Singh, Y.; Singh, B.; Peng, S. Use of chlorophyll meter sufficiency indices for nitrogen management of irrigated rice in Asia. Agron. J. 2000, 92, 875–879. [Google Scholar]
  21. Zhao, Q.Z.; Ding, Y.F.; Wang, Q.S.; Huang, P.S.; Ling, Q.H. Relationship between leaf color and nitrogen uptake of rice. Sci. Agric. Sin. 2006, 39, 916–921. [Google Scholar]
  22. Wang, S.H.; Cao, W.X.; Wang, Q.S.; Ding, Y.F.; Huang, P.S.; Ling, Q.H. Positional distribution of leaf color and diagnosis of nitrogen nutrition in rice plant. Sci. Agric. Sin. 2002, 192, 45–51. [Google Scholar]
  23. Shen, Z.Q.; Wang, K.; Zhu, J.Y. Preliminary study on diagnosis of the nitrogen status of two rice varieties using the chlorophyll meter. Bull. Sci. Technol. 2002, 18, 174–176. [Google Scholar]
  24. Lin, F.F.; Qiu, L.F.; Deng, J.S.; Shi, Y.Y.; Chen, L.S.; Ke, W. Investigation of SPAD meter-based indices for estimating rice nitrogen status. Comput. Electron. Agric. 2010, 71, S60–S65. [Google Scholar] [CrossRef]
  25. Ata-Ul-Karim, S.T.; Cao, Q.; Zhu, Y.; Rehmani, M.I.A.; Cao, W.; Tang, L. In-season assessment of rice protein and amylose content using critical nitrogen dilution curve. Eur. J. Agron. 2017, 90, 139–151. [Google Scholar] [CrossRef]
  26. Greenwood, D.J.; Lemaire, G.; Gosse, G.; Cruz, P.; Draycott, A.; Neeteson, J.J. Decline in percentage n of c3 and c4 crops with increasing plant mass. Ann. Bot. 1990, 66, 425–436. [Google Scholar] [CrossRef]
  27. Hu, Y.; Yang, J.P.; Lv, Y.M.; He, J.J. SPAD values and nitrogen nutrition index for the evaluation of rice nitrogen status. Plant Prod. Sci. 2014, 17, 81–92. [Google Scholar]
  28. Noura, Z.; Marianne, B.; Gilles, B.; Annie, C.; Nicolas, T.; Athynan, C.; Michelc, N.; Léonétienne, P. Chlorophyll measurements and nitrogen nutrition index for the evaluation of corn nitrogen status. Agron. J. 2010, 100, 2275–2279. [Google Scholar]
  29. Zhao, B.; Liu, Z.; Ata-Ul-Karim, S.T.; Xiao, J.; Liu, Z.; Qi, A.; Ning, D.; Nan, J.; Duan, A. Rapid and nondestructive estimation of the nitrogen nutrition index in winter barley using chlorophyll measurements. Field Crop. Res. 2016, 185, 59–68. [Google Scholar] [CrossRef]
  30. Liu, X.; Zhang, K.; Zhang, Z.; Cao, Q.; Lv, Z.; Yuan, Z.; Tian, Y.; Cao, W.; Zhu, Y. Canopy chlorophyll density based index for estimating nitrogen status and predicting grain yield in rice. Front. Plant Sci. 2017, 8, 1829. [Google Scholar] [CrossRef]
  31. Liu, X.; Ferguson, R.B.; Zheng, H.; Cao, Q.; Tian, Y.; Cao, W.; Zhu, Y. Using an active-optical sensor to develop an optimal NDVI dynamic model for high-yield rice production (Yangtze, China). Sensors 2017, 17, 672. [Google Scholar] [CrossRef]
  32. Debaeke, P.; Rouet, P.; Justes, E. Relationship between the normalized spad index and the nitrogen nutrition index: Application to Durum Wheat. J. Plant Nutr. 2006, 29, 75–92. [Google Scholar] [CrossRef]
  33. Hou, Y.H.; Chen, C.Y.; Guo, Z.Q.; Hou, L.B.; Dong, Z.Q.; Zhao, M. Establishment of dry matter accumulation dymamic simulation model and analysis of growth charateristc for high-yielding population of spring maize. J. Maize Sci. 2008, 16, 90–95. [Google Scholar]
  34. Islam, M.R.; Haque, K.M.S.; Akter, N.; Karim, M.A. Leaf chlorophyll dynamics in wheat based on SPAD meter reading and its relationship with grain yield. Sci. Agric. 2014, 4, 13–18. [Google Scholar]
  35. Zheng, H.; Cheng, T.; Yao, X.; Deng, X.; Tian, Y.; Cao, W.; Zhu, Y. Detection of rice phenology through time series analysis of ground-based spectral index data. Field Crop. Res. 2016, 198, 131–139. [Google Scholar] [CrossRef]
  36. Ata-Ul-Karim, S.T.; Xia, Y.; Liu, X.; Cao, W.; Yan, Z. Development of critical nitrogen dilution curve of Japonica rice in Yangtze River Reaches. Field Crop. Res. 2013, 149, 149–158. [Google Scholar] [CrossRef]
  37. Ata-Ul-Karim, S.T.; Zhu, Y.; Yao, X.; Cao, W. Determination of critical nitrogen dilution curve based on leaf area index in rice. Field Crop. Res. 2014, 167, 76–85. [Google Scholar] [CrossRef]
  38. Bijay-Singh; Varinderpal-Singh; Yadvinder-Singh; Thind, H.S.; Kumar, A.; Gupta, R.K.; Kaul, A.; Vashistha, M. Fixed-time adjustable dose site-specific fertilizer nitrogen management in transplanted irrigated rice (Oryza sativa L.) in South Asia. Field Crop. Res. 2012, 126, 63–69. [Google Scholar] [CrossRef]
  39. Liu, K.; Yazhen, L.I.; Huiwen, H.U. Estimating the effect of urease inhibitor on rice yield based on NDVI at key growth stages. Front. Agric. Sci. Eng. 2014, 1, 150–157. [Google Scholar] [CrossRef]
  40. Beck, P.S.A.; Atzberger, C.; Høgda, K.A.; Johansen, B.; Skidmore, A.K. Improved monitoring of vegetation dynamics at very high latitudes: A new method using MODIS NDVI. Remote Sens. Environ. 2006, 100, 321–334. [Google Scholar] [CrossRef]
  41. Prost, L.; Jeuffroy, M.H. Replacing the nitrogen nutrition index by the chlorophyll meter to assess wheat N status. Agron. Sustain. Dev. 2007, 27, 321–330. [Google Scholar] [CrossRef] [Green Version]
  42. Dente, L.; Satalino, G.; Mattia, F.; Rinaldi, M. Assimilation of leaf area index derived from ASAR and MERIS data into CERES-Wheat model to map wheat yield. Remote Sens. Environ. 2008, 112, 1395–1407. [Google Scholar] [CrossRef]
  43. Wang, S.H.; Zhi-Jun, J.I.; Liu, S.H.; Ding, Y.F.; Cao, W.X. Relationships between balance of nitrogen supply-demand and nitrogen translocation and senescence of different position leaves on rice. J. Integr. Agric. 2003, 2, 747–751. [Google Scholar]
  44. Escobar-Gutiérrez, A.J.; Combe, L. Senescence in field-grown maize: From flowering to harvest. Field Crop. Res. 2012, 134, 47–58. [Google Scholar] [CrossRef]
  45. Xue, L.; Yang, L. Recommendations for nitrogen fertilizer topdressing rates in rice using canopy reflectance spectra. Biosyst. Eng. 2008, 100, 524–534. [Google Scholar] [CrossRef]
Figure 1. Changes over time in the soil and plant analysis development (SPAD) readings of different leaves (“LFT” represents the fully expanded leaf position form the top; “1-4 LFT” means one to four fully expanded leaf position form the top.; 1LFT, A; 2LFT, B; 3LFT, C; and 4LFT, D) of 27123 plants evaluated in 2007 and 2008 at N levels of 120 kg ha−1. The vertical bars are standard error (TI, tillering; SE, stem elongation; PI, panicle initiation; BT, booting; HD, heading; FL, flowering; GF, grain filling; and RP, ripening).
Agronomy 09 00106 g001
Figure 2. Regression fits between the leaf nitrogen concentration (LNC, A), nitrogen nutrition index (NNI, B), and NDSIL3,4. The experimental years are shown as 2007, 2008, or 2013; 9915, 27123, and WXJ14 are the Wuxiangjing 14, WYJ19 means Wuyunjing19, and YY8 is Yongyou8. “**” means significant difference at 0.01 probability level.
Agronomy 09 00106 g002
Figure 3. The relationship between measured and predicted leaf nitrogen concentration (LNC, a), nitrogen nutrition index (NNI, b) of four rice cultivars from the time of stem elongation (SE) to heading (HD) (WYJ19, Wuyungjing19; YY8, Yongyou8; WXJ14, Wuxiangjing14; and WYJ24, Wuyungjing 24; Japonica). The solid line is the linear regression line and the dotted line a line inclined at 45° to the axis. ** indicates significant difference at 0.01 probability level.
Agronomy 09 00106 g003
Figure 4. Correlations between NDSIL3,4 values and grain yields at critical growth stages (from stem elongation to heading; cultivars: 9915, 27123 (2007); wuxiangjing14, 27123; 2013: wuyunjing19, wuxiangjing19 (2008)).
Agronomy 09 00106 g004
Figure 5. Relationships between measured and predicted grain yields of four rice cultivars in 2009 (WYJ19, Wuyungjing19; YY8, Yongyou8; WXJ14, Wuxiangjing14; and WYJ24, Wuyungjing24; Japonica).‘x’ represents measured values, ‘y’ means predicted values. The solid line is the linear regression line and the dotted line a line inclined at 45° to the axis.
Agronomy 09 00106 g005
Figure 6. Critical NDSIL3,4 data points used to define the changes in the NDSIL3,4 curve when data of high-yield targets were pooled. The solid line is the critical NDSIL3,4 change curve ( N D S I 3 , 4 = 0.0195 + 0.0158 0.0195 1 + e D O Y 235.91 6.95 ; the A1, A2, x0, and dx values differ in terms of their effect on NDSIL3,4 trends) of high-yield target rice in the Yangtze river valley.
Agronomy 09 00106 g006
Table 1. Basic information about the four rice field experiments.
Experiment No.Transplanting/Harvesting DateLocationCultivarN Rate (kg N ha−1)Soil Characteristic
EXP. 1 200720-Jun; 21-OctJiangning, E 118.98°, N 31.93°9915, 27123
(Japonica)
N0 (0)Soil type = Fe-leachic -stagnic Anthrosols
N1 (130)Soil pH = 6.5
N4 (260)OM = 13.5 g·kg−1
N7 (390)Total N = 1.13 g·kg−1
Available P = 45 mg·g−1
Available K = 82.6 mg·g−1
EXP. 2 200825-Jun; 27-OctJiangning, E 118.98°, N 31.93°WXJ14, 27123
(Japonica)
N0 (0)Soil type = Fe-leachic -stagnic Anthrosols
N1 (130)Soil pH = 6.9
N4 (260)OM = 13.5 g·kg−1
N7 (390)Total N = 1.38 g·kg−1
Available P = 43 mg·g−1
Available K = 80 mg·g−1
EXP. 3 200919-Jun; 20-OctJiangning, E 118.98°, N 31.93°WYJ19, YY8, WXJ14, WYJ24
(Japonica)
N0 (0)Soil type = Gley- stagnic Anthrosols
N1(130)Soil pH = 6.9
N4 (260)OM = 26.15 g·kg−1
N7 (390)Total N = 1.65 g·kg−1
Available P = 38 mg·g−1
Available K = 70 mg·g−1
EXP. 4 201319-Jun; 20-OctWujiang, E 121.28°, N 31°33′WYJ19, WXJ19
(Japonica)
N0 (0)Soil type = Typic Endoaquepts
N2(150)Soil pH = 6.75
N3 (225)OM = 26.15 g·kg−1
N5 (300)Total N = 2.15 g·kg−1
N6 (375)Available P = 45.5 mg·g−1
Available K = 115.3 mg·g−1
Note: “9915, 27123, WXJ14, WYJ19, WYJ24, YY8, and WXJ19” are rice cultivars; “WXJ14” is Wuxiangjing14; “WYJ19” is Wuyunjing19; “WYJ24” is Wuyunjing24; “YY8” is Yongyou8; and “WXJ19” is Wuxiangjing19. “N0 = 0 kg N ha−1; N1 = 130 kg N ha−1; N2 = 150 kg N ha−1; N3 = 225 kg N ha−1; N4 = 260 kg N ha−1; N5 = 300 kg N ha−1; N6 = 375 kg N ha−1; N7 = 390 kg N ha−1”.
Table 2. Equations of soil and plant analysis development (SPAD)-based indices.
IndexDescriptionAlgorithmReference
DSIL1-L3The difference SPAD between 1LFT and 3LFTS1LFT − S3LFT[24]
SPADL3-L4The difference SPAD between 3LFT and 4LFTS3LFT − S4LFT[18]
RSIL1/L3The relative SPAD index between 1LFT and 3LFT S1LFT/S3LFT[23]
RDSIL1,3The relative difference SPAD index between 1LFT and 3LFT S1LFT/(S1LFT + S3LFT)[25]
NDSIL1,3The normalized differences SPAD and index between 1LFT and 3LFT (S1LFT − S3LFT)/(S1LFT + S3LFT)[28]
NDSIThe normalized differences SPAD and index between i LFT and j LFT, the range of i, j values is from 1 to 4, i < j (SiLFT − SjLFT)/(SiLFT + SjLFT)[29]
Note: “S” means SPAD values; “LFT” represents the fully expanded leaf position form the top; “1-4 LFT” means the first to fourth fully expanded leaf position form the top.
Table 3. Simple grouping linear analysis of SPAD indicator.
SPAD IndicatorVarietyYearTreatmentGrowth StageResidual
dfMSF-ValuedfMSF-ValuedfMSF-ValuedfMSF-ValuedfMS
NDSIL1,260.00612 **12.01620.016 *30.02530.0001 **0.06450.16 ns53.72710.0001
NDSIL1,360.013 ns11.28820.032 ns27.30330.0001 ns0.18450.04 *81.0142710.001
NDSIL1,460.034 ns11.75120.079 **27.06830.003 ns0.86350.1 **812710.002
NDSIL2,360.002 *1.70620.003 ns2.8430.016 *17.75550.009 **10.7712710.001
NDSIL2,460.016 **8.44820.035 *17.93230.006 ns2.6250.048 ns44.1032710.002
NDSIL3,460.004 ns6.6520.009 ns13.94530.006 **10.2950.017 **60.6362710.0001
“df” is degrees of freedom; “MS” is mean square; “ns” means non-significance; “*” indicates significant difference at 0.05 probability level; “**” indicates significant difference at 0.01 probability level. Variety include Japonica rice “9915, 27123, Wuxiangjing14 Wuyunjing19, 27123, Wuxiangjing14, Wuyunjing19, Wuyunjing24, Wuxiangjing19”, and Indica rice “Y-Liangyou8”; years are 2007, 2008, and 2013; treatment is the N rates (N1–N6); growth stage form tillering to flowering.
Table 4. Quantitative relationships between the SPAD readings of different rice leaves and leaf nitrogen concentrations.
YearSPAD IndexQuantitative RelationshipR2SD
2007SPADL3-L4LNC = 2.243 × e−0.053SPAD0.21 ns0.37
RSIL1/L3LNC = 2.12 × e−2.66RSI0.56 *0.27
DSIL1-L3LNC = 11.909 × e−1.75DSI0.53 *0.33
RDSIL1,3LNC = 2.054 × e−0.049RDSI0.35 *0.29
NDSIL1,2LNC = 2.193 × e−11.38NDSI0.77 **0.31
NDSIL1,3LNC = 2.137 × e−5.072NDSI0.61 *0.33
NDSIL1,4LNC = 2.205 × e−2.229NDSI0.36 *0.46
NDSIL2,3LNC = 2.16 × e−7.467NDSI0.36 *0.23
NDSIL2,4LNC = 2.257 × e−2.681NDSI0.19 ns0.25
NDSIL3,4LNC = 2.249 × e−10.58NDSI0.83 **0.23
2008SPADL3-L4LNC = 2.195 × e−0.042SPAD0.11 ns0.27
RSIL1/L3LNC = 1.863 × e−6.747RSI0.58 *0.31
DSIL1-L3LNC = 4.131 × e−0.688DSI0.56 *0.33
RDSIL1,3LNC = 1.862 × e−0.163RDSI0.59 *0.24
NDSIL1,2LNC = 1.896 × e−14.87NDSI0.61 **0.21
NDSIL1,3LNC = 1.898 × e−14.84NDSI0.61 **0.21
NDSIL1,4LNC = 2.092 × e−3.476NDSI0.18 ns0.48
NDSIL2,3LNC = 2.019 × e−0.4133NDSI-0.54
NDSIL2,4LNC = 2.201 × e−1.895NDSI0.06 ns0.49
NDSIL3,4LNC = 2.208 × e−14.71NDSI0.81 **0.16
2013SPADL3-L4LNC = 1.974 × e−0.045SPAD0.16 ns0.41
RSIL1/L3LNC = 1.979 × e−0.037RSI0.49 *0.34
DSIL1-L3LNC = 8.39 × e−1.43DSI0.17 ns0.52
RDSIL1,3LNC = 1.998 × e−1.434RDSI0.57 *0.36
NDSIL1,2LNC = 2.167 × e−3.556NDSI0.56 **0.34
NDSIL1,3LNC = 2.219 × e−2.401NDSI0.57 **0.29
NDSIL1,4LNC = 2.324 × e−1.706NDSI0.18 ns0.39
NDSIL2,3LNC = 2.363 × e−2.673NDSI0.07 ns0.15
NDSIL2,4LNC = 2.385 × e−0.121NDSI-0.24
NDSIL3,4LNC = 2.246 × e−10.56NDSI0.82 **0.18
“RSI” means relative SPAD index; “DSI” represents difference SPAD index; “RDSI” means relative difference SPAD index; “NDSI” is the normalized difference SPAD index; “SD” is standard deviation value; “LNC” means leaf nitrogen concentration; “NNI” is nitrogen nutrition index; “ns” and “-” mean non-significance; * indicates significant difference at 0.05 probability level; ** indicates significant difference at 0.01 probability level.
Table 5. Simple linear regression; fitted curves between the SPAD values of different leaves and rice nitrogen indicators.
Nitrogen IndicatorParameterImpact FactorMean Square (MS)
NDSIL1,2NDSIL1,3NDSIL1,4NDSIL2,3NDSIL2,4NDSIL3,4
LNCaYear0.27 *0.27 ns0.15 ns0.0355 ns0.09 ns0.001 ns
variety0.104 ns0.035 ns0.021 ns0.0178 ns0.26 ns0.0252 ns
bYear42.67 ns42.88 ns0.83 ns12.97 ns1.72 ns5.71 ns
variety36.58 ns41.24 ns0.61 ns8.73 ns1.22*3.07 ns
Residual0.0510.0610.0210.0350.0140.023
NNIaYear0.02 ns0.01 ns0.01 ns--0.02 ns
variety0.21 ns0.04 ns0.09 *0.17 ns0.06 ns0.51 ns
bYear5.51 ns5.58 ns0.54 ns8.45 ns5.91 ns5.62 ns
variety1.39 ns6.71 ns0.91 ns4.27 ns6.53 ns4.98 ns
Residual0.270.390.170.320.210.04
“LNC” means leaf nitrogen concentration; “NNI” is nitrogen nutrition index; “NDSI” represents normalized difference SPAD index; “ns” and “-” mean non-significance; * indicates significant difference at 0.05 probability level; ** indicates significant difference at 0.01 probability level.
Table 6. Quantitative relationships between SPAD readings of different rice leaves and the nitrogen nutrition index.
YearSPAD IndexQuantitative RelationshipR2SD
2007SPADL3-L4NNI = 0.780 × e−0.028SPAD0.16 ns0.49
RSIL1/L3NNI = 0.739 × e−0.012RSI0.35 *0.38
DSIL1-L3NNI = 1.017 × e−0.322DSI0.26 ns0.32
RDSIL1,3NNI = 0.746 × e−0.627RDSI0.56 *0.27
NDSIL1,2NNI = 0.776 × e−5.84NDSI0.76 **0.31
NDSIL1,3NNI = 0.759 × e−2.35NDSI0.53 *0.33
NDSIL1,4NNI = 0.766 × e−1.06NDSI0.15 ns0.46
NDSIL2,3NNI = 0.755 × e−2.89NDSI0.61 *0.23
NDSIL2,4NNI = 0.773 × e−1.32NDSI0.14 ns0.25
NDSIL3,4NNI = 0.809 × e−8.85NDSI0.83 **0.23
2008SPADL3-L4NNI = 0.764 × e−0.36SPAD0.14 ns0.51
RSIL1/L3NNI = 0.713 × e−2.91RSI0.21 ns0.34
DSIL1-L3NNI = 0.498 × e0.41DSI0.43 *0.40
RDSIL1,3NNI = 0.707 × e−0.07RDSI0.67 *0.26
NDSIL1,2NNI = 0.709 × e−5.99NDSI0.71 *0.21
NDSIL1,3NNI = 0.710 × e−6.05NDSI0.62 *0.21
NDSIL1,4NNI = 0.749 × e0.50NDSI-0.48
NDSIL2,3NNI = 0.746 × e−2.11NDSI0.68 *0.54
NDSIL2,4NNI = 0.742 × e1.48NDSI0.07 ns0.49
NDSIL3,4NNI = 0.821 × e−11.96NDSI0.85 **0.16
2013SPADL3-L4NNI = 0.653 × e−0.02SPAD0.15 ns0.39
RSIL1/L3NNI = 0.610 × e−0.03RSI0.32 *0.28
DSIL1-L3NNI = 2.492 × e−1.40DSI0.51 *0.36
RDSIL1,3NNI = 0.615 × e−1.40RDSI0.60 *0.26
NDSIL1,2NNI = 0.708 × e−1.85NDSI0.57 *0.34
NDSIL1,3NNI = 0.711 × e−1.52NDSI0.41 *0.29
NDSIL1,4NNI = 0.721 × e−1.96NDSI0.25 *0.39
NDSIL2,3NNI = 0.733 × e−2.96NDSI0.58 *0.15
NDSIL2,4NNI = 0.764 × e−3.36NDSI0.16 ns0.24
NDSIL3,4NNI = 0.734 × e−13.51NDSI0.84 **0.18
“RSI” means relative SPAD index; “DSI” represents difference SPAD index; “RDSI” means relative difference SPAD index; “NDSI” is the normalized difference SPAD index; “SD” is standard deviation value; “LNC” means leaf nitrogen concentration; “NNI” is nitrogen nutrition index; “ns” and “-” mean non-significance; * indicates significant difference at 0.05 probability level; ** indicates significant difference at 0.01 probability level.
Table 7. Linear regressions between various normalized SPAD indices and grain yield.
YearVarietyGrowth Stage
TISEPIBTHDFL
200799150.26 *0.73 **0.79 **0.68 *0.68 *0.32 *
271230.21 *0.48 *0.62 *0.75 **0.51 *0.43 *
2008271230.20 *0.68 *0.73 **0.72 **0.65 *0.40 *
WXJ140.26 *0.75 **0.79 **0.72 **0.54 *0.37 *
2013WYJ190.22 *0.57 *0.63 *0.61 *0.52 *0.34 *
YY80.19 ns0.74 **0.62 *0.47 *0.62 *0.42 *
“ns” and “-” mean non-significant difference; * indicates significant difference at 0.05 probability level; ** indicates significant difference at 0.01 probability level. “TI” is tillering stage; “SE” is stem elongation stage; “PI” is panicle initiation stage; “BT” is booting stage; “HD” is heading stage; “FL” is flowering stage; “9915, 27123, WXJ14, WYJ19, WYJ24, YY8, WXJ19” are different rice cultivars; “WXJ14” is Wuxiangjing14; “WYJ19” is Wuyunjing19; “WYJ24” is Wuyunjing24; “YY8” is Yongyou8; “WXJ19” is Wuxiangjing19.
Table 8. Summary of fitting results of normalize difference SPAD index (NDSI) dynamic model under different fitting equation.
Regression ModelEquationR2RRMSE (%)F-Value
linear modely = a + b × x0.89923.5213.8
Boltzmann modely = A2 + (A1 − A2)/(1 + e((xx0)/dx))0.97516.8265.9
Polynomial modely = A + B × x + C × x2+D × x3+…0.92725.2113.91
Exponential modely = a−b × cx0.89428.599.9
Bradley modely = a × ln(−b × ln(x))0.88928.95142.5
Power modely = a × xb0.45348.315.3
Nelder modely = (x + a)/(b0 + b1 × (x + a) + b2 × (x + a)2)0.92924.4116.9
DoseResp modely = A1 + (A2 − A1)/(1 + 10((LOGx0 x) × p))0.93123.4119.8
Hyperbola model----
Note: “RRMSE” indicates relative root mean square error; “a, b, A, A1, A2, B, b0, b1, C, and D” are parameters of the equation; ‘LOG’ means the base-10 logarithm.

